chapter 2 continuous monitoring of ozone
TRANSCRIPT

Chapter 2
Continuous Monitoring of Ozone


Chapter 2
Continuous Monitoring of Ozone
Table of Contents
1.0 Introduction ............................................................................................................ 1
2.0 Probe Siting Criteria .............................................................................................. 2 2.1 Horizontal and Vertical Probe Placement ................................................................. 2
2.2 Spacing from Obstructions ....................................................................................... 2 2.3 Spacing from Roads .................................................................................................. 2
2.4 Spacing from Trees ................................................................................................... 3
3.0 Monitoring Methodology ....................................................................................... 3 3.1 Monitoring Principles ............................................................................................... 3 3.1.1 Ultraviolet (UV) Absorption ........................................................................... 3
3.1.2 Chemiluminescence ........................................................................................ 4
3.2 Monitoring Requirements ......................................................................................... 4
4.0 Calibration Methodology ....................................................................................... 4 4.1 Calibration Environment ........................................................................................... 6
4.2 Determination of Standard Concentration ................................................................ 6 4.3 Calibrations ............................................................................................................... 6
4.3.1 On-Site Multi-Point Calibration .................................................................... 6 4.3.2 On-Site Multi-Point Calibration using the station calibrator ......................... 8 4.3.3 Remote Multi-Point Calibration using LEADS to control the Station
Calibrator ................................................................................................................ 10 4.3.4 Multi-Point Calibration Frequency .............................................................. 10
5.0 Quality Control Checks and Quality Assurance Audits ................................... 11 5.1 Zero/Span/One-Point Quality Control Check ......................................................... 11 5.2 Quarterly Accuracy Audit ....................................................................................... 11
5.2.1 Procedure ..................................................................................................... 12
6.0 Quality Control Measures ................................................................................... 14 6.1 Zero Span Checks ................................................................................................... 14 6.2 Site Checks.............................................................................................................. 14
6.3 Preventive Maintenance .......................................................................................... 15
7.0 Data Reduction and Reporting ........................................................................... 15
Forms
1 OAMD O3 AUDIT ................................................................................................. 16
2 Ozone Calibration Worksheet ................................................................................ 17

Table
1 Minimum Seperation DistanceBetween Roadways and Sampling Probes or
Monitoring Paths at Neighborhood and Urban Scales for Ozone ............................ 3
Figure
1 Ozone Standard Tractability Ladder ........................................................................ 5

Chapter 2
Revision No. 8
December 31, 2015
Page 1 of 18
1.0 Introduction
It is the intent of this chapter to outline the requirements for the ambient air monitoring of ozone
(O3). All practices and procedures outlined follow the requirements set forth in 40 CFR Parts 50,
53 and 58. All agencies or groups that conduct ozone monitoring within the state of Indiana and
submit data to the Air Quality System (AQS) database must follow requirements in this chapter.
Indiana's ozone monitoring season is April 1 through September 30 with some sites monitoring
outside this time frame.
On October 1, 2015, the United States Environmental Protection Agency (USEPA) strengthened
the nation’s air quality standards for ground‐level ozone to improve public health and
environmental protection. The updated standards will improve air quality broadly across the
country, and are particularly important for at‐risk groups, which include children, people of all
ages with asthma and other respiratory diseases; older adults; and people who are active
outdoors, especially outdoor workers, among others. EPA also updated the Air Quality Index
(AQI) for ozone and the ozone monitoring season in many states to help inform the public about
daily air quality. One of the standards is described as: the 3-year average of the annual 4th
highest
daily maximum 8-hour ozone concentrations measured at each monitor within an area over each
year must not exceed .070 ppm. Additional information on these changes can be found at
http://www3.epa.gov/ozonepollution/pdfs/20151001aqifs.pdf
Currently all Indiana Ozone Monitoring Network analyzers operated by the Indiana Department
of Environmental Management, Office of Air Quality (IDEM/OAQ) are connected to the
Leading Environmental Analysis and Display System (LEADS). This Data Acquisition System
(DAS) allows for remote access to the analyzers and site conditions providing information on:
Diagnostics; such as:
Flow
Pressure
Temperature
Near Real Time Ambient Ozone levels
Quality Control Activities such as:
Daily zero/span checks
One-Point (precision) precision checks
Multi-point calibrations
Electronic operator log records retention
Site Conditions like:
Inside temperature
Meteorological conditions

Chapter 2
Revision No. 8
December 31, 2015
Page 2 of 18
2.0 Probe Siting Criteria
For specific siting requirements for O3 monitors and inlet probes, refer to Chapter 1 of this
manual and to 40 CFR Part 58, Appendixes D and E.
2.1 Horizontal and Vertical Probe Placement
The ozone monitor inlet probe should be as close as possible to the breathing zone. Complicating
factors may require that the probe be elevated. The sample inlet probe height or at least 80
percent of the monitoring path must be 2 to 15 meters above ground level. The probe or at least
90 percent of the monitoring path must also be located more than one meter vertically or
horizontally away from any supporting structure, walls, parapets, penthouses, etc., and away
from dusty or dirty areas.
2.2 Spacing from Obstructions
The probe must be located away from obstacles and buildings such that the distance between the
obstacles and the inlet probe is at least twice the height that the obstacle protrudes above the
probe. The probe would be considered to be obstructed if an imaginary line extended 30 degrees
up from the horizontal and rotated 360 degrees intersects any obstruction within 30 meters.
Airflow must be unrestricted in an arc of at least 270 degrees around the inlet probe and the
predominant wind direction for the season of greatest pollutant concentration potential must be
included in the 270 degrees arc. If the probe is located on the side of a building, 180 degrees of
clearance is required.
2.3 Spacing from Roads
It is important to minimize the destructive interferences of nitric oxide (NO) since NO readily
reacts with O3 (see Table 1 for separation distances between roadways and monitoring stations).
The proximity of other NOx sources such as: coal fired furnaces, parking lots, or dispersion from
agricultural operations must also been taken in consideration when setting up an ozone
monitoring location.

Chapter 2
Revision No. 8
December 31, 2015
Page 3 of 18
Table 1
Minimum Separation Distance Between Roadways and Sampling Probes or Monitoring
Paths at Neighborhood and Urban Scales for Ozone
Roadway Average Vehicles per day Minimum Separation (meters) *
≤ 10,000 10
15,000 20
20,000 30
40,000 50
70,000 100
≥110,000 250
* Distances should be interpolated based on traffic flow.
2.4 Spacing from Trees
Since the scavenging effect of trees is greater for O3 than for other priority pollutants, strong
consideration must be given to the location of an O3 inlet probe. The sample probe, inlet, or at
least 90 percent of the monitoring path must be at least 10 meters from the drip line of trees
which are located in the predominant seasonal wind direction. Ideally, the probe should be at
least 20 meters from the drip line of trees in all directions.
3.0 Monitoring Methodology
All methods used to monitor O3 must be a Federal Reference Method (FRM) or equivalent
procedure described in 40 CFR Part 53. For all analyzers, refer to the manufacturer's instruction
manual for specific requirements.
3.1 Monitoring Principles
3.1.1 Ultraviolet (UV) Absorption
This method used to monitor O3, is based on the Beer-Lambert principle that O3 absorbs
ultraviolet light. The greatest absorbance takes place at the 253.7 nm wavelength. A low pressure
mercury vapor lamp produces light at this wavelength. This light is admitted into a measuring
cell. Ozonated (sample) air and non-ozonated (zero) air are alternately passed through the sample
cell. The UV radiation passes through the sample and is absorbed by ozone. The strength of the
UV signal detected after passing through the sample air is directly proportional to the O3
concentration.

Chapter 2
Revision No. 8
December 31, 2015
Page 4 of 18
3.1.2 Chemiluminescence
The State has one site which uses this method for ozone measurement. An analyzer is designed
to measure the concentration of ozone using the chemiluminescence reaction of ozone with NO.
The reaction of ozone combined with NO results in electronically excited NO2 molecules. The
excited NO2 molecules release their excess energy by emitting a photon hν and dropping to a
lower energy level. It has been shown that the number of emitted photons is directly proportional
to the O3 concentration in the sample stream.
3.2 Monitoring Requirements
The sample manifold and all contact sample lines and connectors must be borosilicate glass
or Teflon
The analyzer reads mercury vapor as ozone, therefore the analyzer should not be placed in a
facility where mercury contamination is possible (i.e. laboratories)
Airflow to the monitoring system should be unrestricted
The incoming sample air should not be pressurized
The location of the monitor should be maintained at a temperature between 59o and 91.4
o
Fahrenheit
4.0 Calibration Methodology
Once each year, prior to the beginning of the ozone monitoring season, the OAQ O3 Standard is
verified at the USEPA’s Region V laboratory facility. There, the IDEM O3 Standard is compared
to the EPA Level 1 Standard Reference Photometer. Upon successful verification, the OAQ’s
standard becomes a Level 2 standard and serves as the Primary Standard used to verify/certify
other ozone standards, thus making those a Level 3 transfer standard. The OAQ also has a
backup standard verified against the EPA Level 1 Standard Reference Photometer.
A transfer standard is defined as a transportable device or apparatus which, together with
associated operational procedures, is capable of accurately reproducing pollutant concentration
standards (in this case, ozone) or of producing accurate assays of pollutant concentrations which
are quantitatively related to a higher level and more authoritative standard. The transfer
standard’s purpose is to transfer the authority of a Level 1 pollutant standard (in this case, ozone)
to a remote point where it is used to verify or calibrate an air monitoring analyzer. (see Figure 1)

Chapter 2
Revision No. 8
December 31, 2015
Page 5 of 18
Figure 1
Ozone Standard Tractability Ladder
Routine calibrations of the IDEM ozone monitoring network analyzers are performed every three
months (USEPA requires 6 months) using the on-site Level 3 O3 transfer standard. Heretofore
this term can be considered synonymous with: station calibrator.
The station calibrators are calibrated then verified against the IDEM Level 2 O3 Primary
Standard once each year in the IDEM QA laboratory. The calibration consists of adjusting the
zero and offset of the calibrator while comparing it to the Primary Standard. Following this two
point calibration, the verification is started and consists of a six day comparison using a zero and
five upscale points. Six months after the laboratory verification the station calibrators are verified
in the field by a Level 3 Transfer Standard (Field Standard) or by a designated Level 2 Field
Primary Standard. For more information on transfer standards see Chapter 6 of this manual or
consult: http://www.epa.gov/ttn/amtic/files/ambient/qaqc/OzoneTransferStandardGuidance.pdf
All calibrations must follow the guidelines established in 40 CFR Part 50 Appendix D.
NIST SRP2
EPA SRP1 OR EPA SRP7
Regional EPA SRPs
Level 1 Standard Reference Photometers
Level 2 O3 Transfer Standard
IDEM- QAS Laboratory-Indianapolis
Level 3 O3 Transfer Standard Stationary Calibrator
IDEM-Air Monitoring Sites
Level 3 O3 Transfer Standard Audit Calibrator and Field
Standard IDEM-QAS
IDEM Air Monitoring Network On-site Ozone Analyzer
Chapter 2
Revision No. 8
December 31, 2015
Page 6 of 18
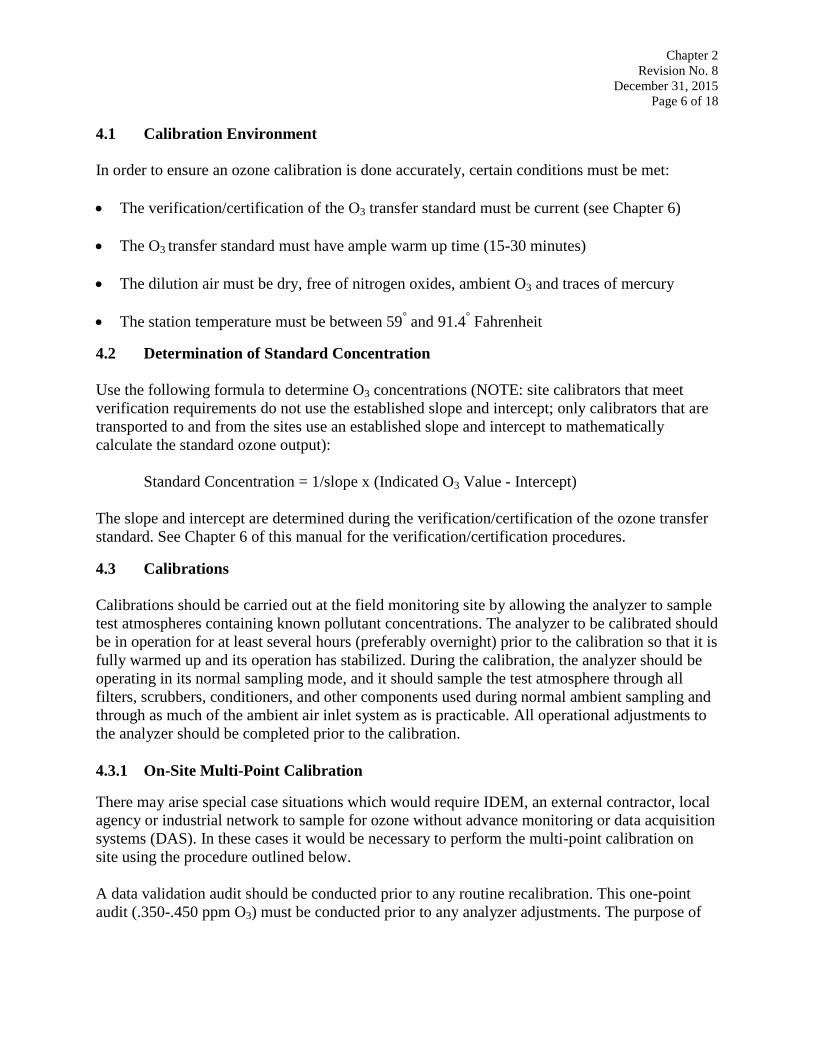
4.1 Calibration Environment
In order to ensure an ozone calibration is done accurately, certain conditions must be met:
The verification/certification of the O3 transfer standard must be current (see Chapter 6)
The O3 transfer standard must have ample warm up time (15-30 minutes)
The dilution air must be dry, free of nitrogen oxides, ambient O3 and traces of mercury
The station temperature must be between 59° and 91.4
° Fahrenheit
4.2 Determination of Standard Concentration
Use the following formula to determine O3 concentrations (NOTE: site calibrators that meet
verification requirements do not use the established slope and intercept; only calibrators that are
transported to and from the sites use an established slope and intercept to mathematically
calculate the standard ozone output):
Standard Concentration = 1/slope x (Indicated O3 Value - Intercept)
The slope and intercept are determined during the verification/certification of the ozone transfer
standard. See Chapter 6 of this manual for the verification/certification procedures.
4.3 Calibrations
Calibrations should be carried out at the field monitoring site by allowing the analyzer to sample
test atmospheres containing known pollutant concentrations. The analyzer to be calibrated should
be in operation for at least several hours (preferably overnight) prior to the calibration so that it is
fully warmed up and its operation has stabilized. During the calibration, the analyzer should be
operating in its normal sampling mode, and it should sample the test atmosphere through all
filters, scrubbers, conditioners, and other components used during normal ambient sampling and
through as much of the ambient air inlet system as is practicable. All operational adjustments to
the analyzer should be completed prior to the calibration.
4.3.1 On-Site Multi-Point Calibration
There may arise special case situations which would require IDEM, an external contractor, local
agency or industrial network to sample for ozone without advance monitoring or data acquisition
systems (DAS). In these cases it would be necessary to perform the multi-point calibration on
site using the procedure outlined below.
A data validation audit should be conducted prior to any routine recalibration. This one-point
audit (.350-.450 ppm O3) must be conducted prior to any analyzer adjustments. The purpose of

Chapter 2
Revision No. 8
December 31, 2015
Page 7 of 18
the audit is to determine the validity of the data from the last audit or calibration to the present
date.
Observe the following steps when performing a multi-point calibration on a UV absorption or
Chemiluminescence ozone monitor:
Attach the analyzer's sample line to the vented output of the calibrator. A vented output
consists of a union tee to bleed off excess pressure or an output manifold on the calibrator. If
excess flow pressure is not released, the analyzer could be damaged. Adjust the zero air flow
from the calibrator to the analyzer. The zero air flow must exceed the analyzer's total flow
demand by at least 25% to ensure that no ambient air is pulled into the system through the
vent. For example, if the analyzer flow demand is 1.0 l/min then the total output flow from
the calibrator should be no less than 1.25 l/min.
Allow for stabilization (a response is considered stable when the display does not vary more
than 5 ppb over a five minute period). Using the analyzer's zero adjustment; adjust the
analyzer response to read .000 mV or ppm on the data acquisition system (DAS). Record the
zero response on the calibration worksheet; an example of which can be found.
Using the O3 standard concentration equation below and the calibrator certification
information, determine the calibrator settings required to generate a concentration at
approximately 80% of the analyzer's range (e.g., for an analyzer operating in the 0-.5 ppm
range, .400 to .450 ppm should be used as the span concentration).
Std. Conc. (ppm) = Slope x (indicated O3 - intercept)
Allow the analyzer to sample until the response is stable. Adjust the span setting until the
response matches the standard concentration determined in the above equation (to
within ±2%).
After the zero and the 80% of range concentration have been set, make no further
adjustments to the zero or span controls. Three additional concentrations must be
introduced (e.g., .300, .200 ppm and .090 ppm). Record or enter the standard
concentration (those introduced by the O3 generator or photometer) and the analyzer's
indicated response on the calibration worksheet/spreadsheet.
Determine the calibration slope by:
a. Using the least squares linear regression method to find the line of best fit.
Use analyzer responses (in ppm) as the X values. Use the standard ozone
concentrations (generated from a certified ozone generator or photometer)
in ppm as Y values.
b. Adjust the analyzer’s span pot so that the slope is a fixed value (i.e., for a
0.5 ppm range: a 0.5 slope for a 1 volt output; a 0.005 for a 100 millivolt

Chapter 2
Revision No. 8
December 31, 2015
Page 8 of 18
or strip chart output; a 0.0005 slope for a 1000 millivolt). All calibration
concentrations must be within ±2% of the range of the monitor.
Calculate the measured concentration using the observed concentrations and the
calibration slope and intercept.
Compare the difference between the measured and standard concentrations. If any point
is outside the 2% or range limit, the calibration is considered invalid and must be
repeated. If a successful calibration cannot be completed in two attempts, the instrument
is considered suspect, and maintenance may be required.
4.3.2 On-Site Multi-Point Calibration using the station calibrator
Manual field calibrations of ozone analyzers are performed at the individual monitoring sites
using the Level 3 verified station calibrator. The analyzer is challenged to sample test
atmospheres containing a known concentration of ozone and zero air.
To perform an ozone field calibration, it is not necessary to change the set-up of the calibrator
delivery system. To begin the calibration:
Log into the station laptop and access the data logger
From the User menu, Press G to display channel identification numbers
Press C and the ozone channel number/Q to disable the ozone channel and flag the data
Press U to return to the User Menu
Press: MENU on the analyzer, and using the arrow keys, select: INSTRUMENT
CONTROLS
Press: ENTER
Using the arrow keys, select: SERVICE MODE
Press: ENTER twice to turn ON the SERVICE MODE
Press: MENU twice to return to the MAIN MENU
Using the arrow keys, select: CALIBRATION
Press: ENTER
Select: CALIBRATE ZERO

Chapter 2
Revision No. 8
December 31, 2015
Page 9 of 18
Press: ENTER
Introduce zero air to the analyzer by setting the station calibrator to Level 60
Allow for stabilization
Press: ENTER to set the zero, the analyzer will automatically save the new zero value
Press: MENU on the analyzer
Using the arrow keys, select: CALIBRATE O3
Press: ENTER
Introduce a concentration of .400 ppm ozone to the analyzer by setting the station calibrator
to Level 66
Allow for stabilization
Using the arrow keys, set the analyzer ozone response to match the calibrator display
Press: ENTER to save the setting
Press: MENU twice to return to the MAIN MENU
Using the arrow keys, select: INSTRUMENT CONTROLS
Press: ENTER
Using the arrow keys, select: SERVICE MODE
Press: ENTER twice to turn OFF the SERVICE MODE
Press: RUN on the analyzer to return to normal sampling mode
Introduce three more evenly spaces ozone concentrations (e.g., .300 ppm, .200 ppm, and .090
ppm) using the same procedure that was used to produce a .400 ppm concentration
All calibration points must be within ±2% of the full range of the analyzer (e.g., if the range
is .500 ppm, then all measured values must be within ± .010 ppm of the introduced test
concentration)
Set the station calibrator to Level 99 to return it to STANDBY mode

Chapter 2
Revision No. 8
December 31, 2015
Page 10 of 18
Enable the ozone channel on the station Zeno data logger and make the appropriate electronic
operator log entries
4.3.3 Remote Multi-point Calibration using LEADS to control the Station Calibrator
Currently all O3 sites in the IDEM continuous air monitoring network are equipped with on-site
Teledyne Advanced Pollution Instruments (API) mass flow calibrators. These units can be
accessed remotely through the Leading Environmental Analysis and Display System (LEADS).
Calibrations and certain quality assurance/quality control processes are conducted telemetrically
on a routine pre-set schedule and/or on a by demand basis.
A Multi-point Calibration consists of a zero and four upscale points, the highest being above the
NAAQS (for SLAMS criteria pollutants) and higher than any routine values one might expect at
the site. The remote multi-point calibration should include:
A zero concentration (pollution free air)
A concentration between 80% and 90% of full range (or, approximately .400 ppm for a
.500 ppm range ozone analyzer)
Three more concentrations spread evenly across the operating range (or, approximately .300
ppm, .200 ppm and .090 ppm for a .500 ppm range ozone analyzer)
This multi-point calibration must be performed at the time of the initial installation and after
a six month period (Note: IDEM calibrates on a three month cycle using the LEADS automatic
setup) has lapsed since the most recent multi-point calibration. All calibration points must be
within ±2% of the full range of the analyzer (e.g., if the range is .500 ppm, then all measured
values must be within ± .010 ppm of the introduced test concentration).
4.3.4 Multi-point Calibration Frequency
A multi-point calibration should be performed on an analyzer if any of the following conditions
exist:
Following any repairs (replacement of electronic boards, optics, etc.) that may affect the
calibration
Physical relocation of the analyzer
After initial installation
At the beginning of each monitoring season
After a six (6) month period has lapsed since the most recent Multi-point Calibration
Chapter 2
Revision No. 8
December 31, 2015
Page 11 of 18
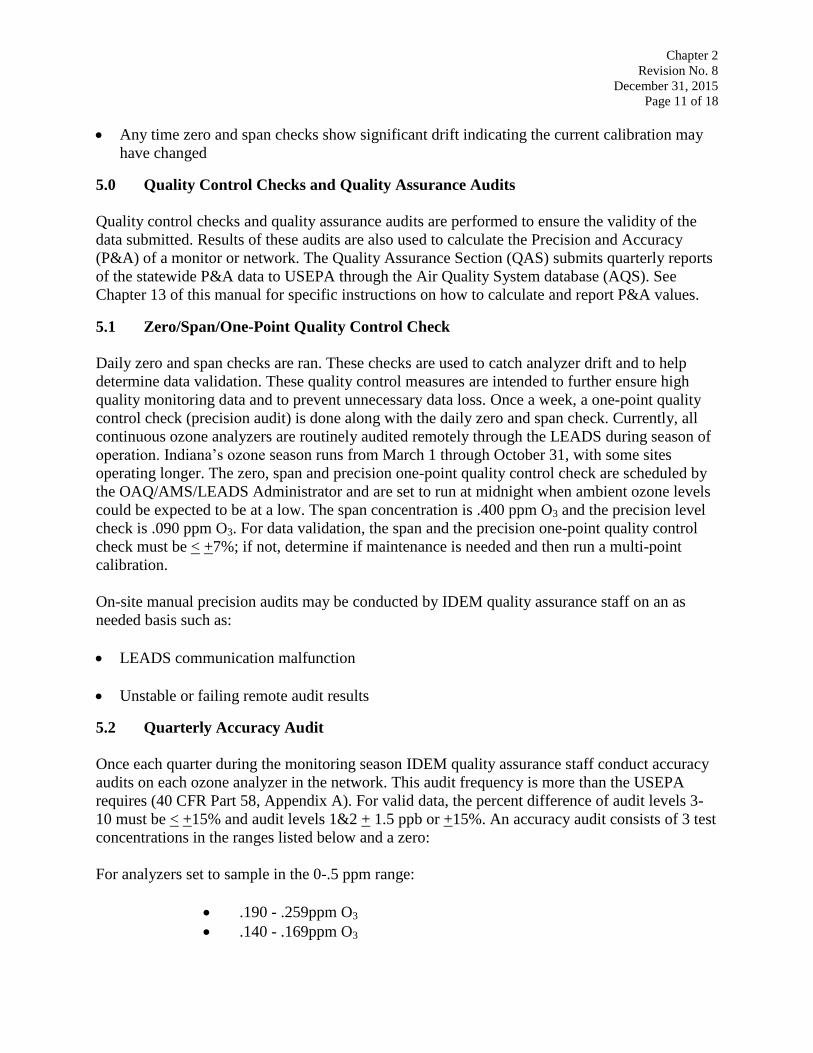
Any time zero and span checks show significant drift indicating the current calibration may
have changed
5.0 Quality Control Checks and Quality Assurance Audits
Quality control checks and quality assurance audits are performed to ensure the validity of the
data submitted. Results of these audits are also used to calculate the Precision and Accuracy
(P&A) of a monitor or network. The Quality Assurance Section (QAS) submits quarterly reports
of the statewide P&A data to USEPA through the Air Quality System database (AQS). See
Chapter 13 of this manual for specific instructions on how to calculate and report P&A values.
5.1 Zero/Span/One-Point Quality Control Check
Daily zero and span checks are ran. These checks are used to catch analyzer drift and to help
determine data validation. These quality control measures are intended to further ensure high
quality monitoring data and to prevent unnecessary data loss. Once a week, a one-point quality
control check (precision audit) is done along with the daily zero and span check. Currently, all
continuous ozone analyzers are routinely audited remotely through the LEADS during season of
operation. Indiana’s ozone season runs from March 1 through October 31, with some sites
operating longer. The zero, span and precision one-point quality control check are scheduled by
the OAQ/AMS/LEADS Administrator and are set to run at midnight when ambient ozone levels
could be expected to be at a low. The span concentration is .400 ppm O3 and the precision level
check is .090 ppm O3. For data validation, the span and the precision one-point quality control
check must be < +7%; if not, determine if maintenance is needed and then run a multi-point
calibration.
On-site manual precision audits may be conducted by IDEM quality assurance staff on an as
needed basis such as:
LEADS communication malfunction
Unstable or failing remote audit results
5.2 Quarterly Accuracy Audit
Once each quarter during the monitoring season IDEM quality assurance staff conduct accuracy
audits on each ozone analyzer in the network. This audit frequency is more than the USEPA
requires (40 CFR Part 58, Appendix A). For valid data, the percent difference of audit levels 3-
10 must be < +15% and audit levels 1&2 + 1.5 ppb or +15%. An accuracy audit consists of 3 test
concentrations in the ranges listed below and a zero:
For analyzers set to sample in the 0-.5 ppm range:
.190 - .259ppm O3
.140 - .169ppm O3

Chapter 2
Revision No. 8
December 31, 2015
Page 12 of 18
.070 - .089ppm O3
5.2.1 Procedure
The procedure outlined below is to be used for Indiana Ozone Monitors equipped with the
LEADS. If the LEADS is not in service or another form of DAS is being utilized, flag the data
with the appropriate information according to the procedure recommended by the specific DAS
operations manual.
Once on site, to begin the audit:
Plug in the audit calibrator and allow for warm up (30 minutes)
Log into the station laptop and access the data logger
From the User menu, Press G to display channel identification numbers
Press C and the ozone channel number/Q to disable the ozone channel and flag the data
Press U to return to the User Menu
Press T
Press R/ozone channel number to view the current voltage output
Open the OAMD O3 Audit form on the field laptop
Fill in the appropriate information including:
a) Site Name
b) Auditor
c) Date
d) Start time
e) Analyzer calibration slope and intercept
f) Audit and On-Site Calibrator serial numbers
Introduce zero air to the analyzer by setting the audit calibrator to zero
Disconnect the incoming sample line at the manifold and cap the port
Attach the incoming sample line to the output of the calibrator, venting if necessary
Allow for stabilization

Chapter 2
Revision No. 8
December 31, 2015
Page 13 of 18
Observe the Zeno output display in volts
Enter the output and the calibrator zero response on the OAMD form. The Oracle spread
sheet will automatically calculate the Zeno output to parts per million ozone and display the
% difference between the standard and observed concentration
Introduce a test concentration of between .190 and .259 ppm O3 to the analyzer
Allow for stabilization
Observe the Zeno output display in volts
Enter the output and the calibrator response on the OAMD field data form. The Oracle spread
sheet will automatically calculate the Zeno output to parts per million ozone
Introduce a test concentration of between .140 and .169 ppm O3 to the analyzer
Allow for stabilization
Observe the Zeno output display in volts
Enter the output and the calibrator response on the OAMD field data form. The Oracle spread
sheet will automatically calculate the Zeno output to parts per million ozone
Introduce a test concentration of between .070 and .089 ppm O3 to the analyzer
Allow for stabilization
Observe the Zeno output display in volts
Enter the output and the calibrator response on the OAMD field data form. The Oracle spread
sheet will automatically calculate the Zeno output to parts per million ozone and display the
% difference between the standard and observed concentration
Reconnect the incoming sample line to the manifold and disassemble the audit calibrator
Allow the ozone analyzer to return to ambient conditions
Enable the ozone channel and make the appropriate electronic operator log book entries
Enter the audit end time on the OAMD form and save the audit results
Chapter 2
Revision No. 8
December 31, 2015
Page 14 of 18
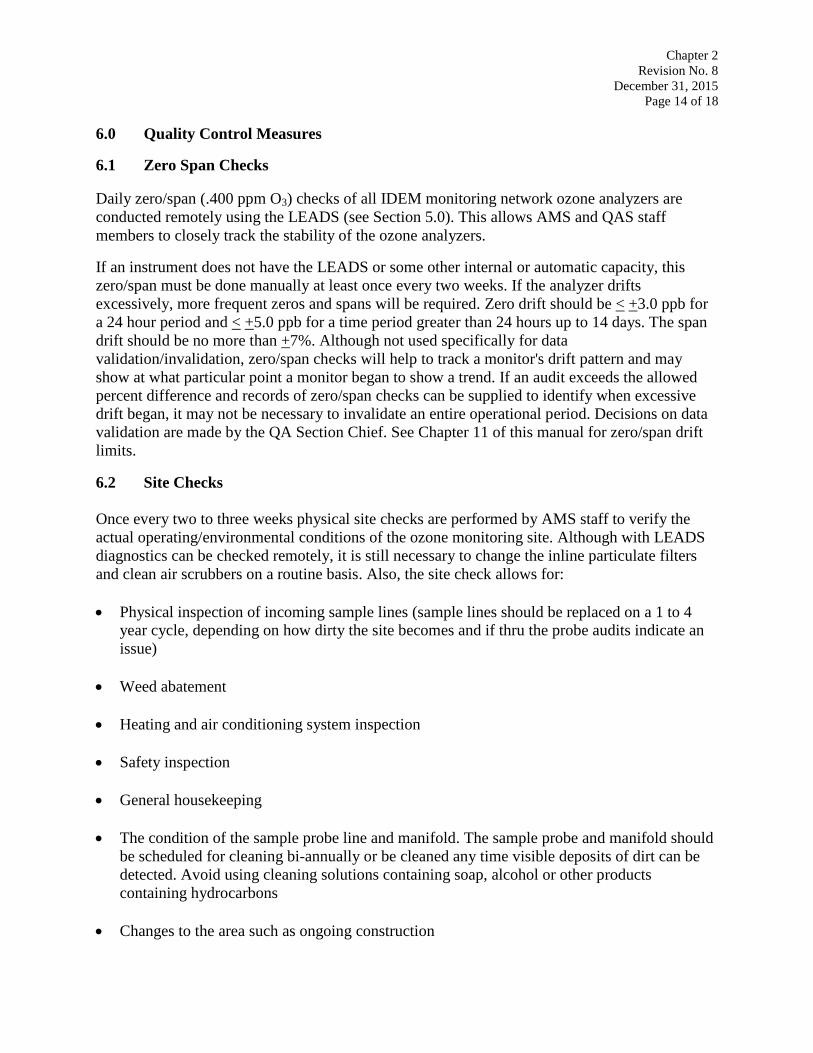
6.0 Quality Control Measures
6.1 Zero Span Checks
Daily zero/span (.400 ppm O3) checks of all IDEM monitoring network ozone analyzers are
conducted remotely using the LEADS (see Section 5.0). This allows AMS and QAS staff
members to closely track the stability of the ozone analyzers.
If an instrument does not have the LEADS or some other internal or automatic capacity, this
zero/span must be done manually at least once every two weeks. If the analyzer drifts
excessively, more frequent zeros and spans will be required. Zero drift should be < +3.0 ppb for
a 24 hour period and < +5.0 ppb for a time period greater than 24 hours up to 14 days. The span
drift should be no more than +7%. Although not used specifically for data
validation/invalidation, zero/span checks will help to track a monitor's drift pattern and may
show at what particular point a monitor began to show a trend. If an audit exceeds the allowed
percent difference and records of zero/span checks can be supplied to identify when excessive
drift began, it may not be necessary to invalidate an entire operational period. Decisions on data
validation are made by the QA Section Chief. See Chapter 11 of this manual for zero/span drift
limits.
6.2 Site Checks
Once every two to three weeks physical site checks are performed by AMS staff to verify the
actual operating/environmental conditions of the ozone monitoring site. Although with LEADS
diagnostics can be checked remotely, it is still necessary to change the inline particulate filters
and clean air scrubbers on a routine basis. Also, the site check allows for:
Physical inspection of incoming sample lines (sample lines should be replaced on a 1 to 4
year cycle, depending on how dirty the site becomes and if thru the probe audits indicate an
issue)
Weed abatement
Heating and air conditioning system inspection
Safety inspection
General housekeeping
The condition of the sample probe line and manifold. The sample probe and manifold should
be scheduled for cleaning bi-annually or be cleaned any time visible deposits of dirt can be
detected. Avoid using cleaning solutions containing soap, alcohol or other products
containing hydrocarbons
Changes to the area such as ongoing construction
Chapter 2
Revision No. 8
December 31, 2015
Page 15 of 18
Vandalism
6.3 Preventive Maintenance
Preventive maintenance is an intrinsic part of quality control. Analyzers and station calibrators
must have routine preventive maintenance performed to ensure proper operation and prevent data
loss or costly repairs.
Most manufacturers supply a preventive maintenance check list with the analyzer’s instruction
manual. A tracking mechanism such as a computerized database or an on-site check list should
be developed to ensure all maintenance is performed as recommended. This tracking mechanism
needs to be reviewed and updated as new equipment or operating procedures are put in place.
All maintenance should be logged into the electronic or bound logbooks located at each
monitoring site.
7.0 Data Reduction and Reporting
The NAAQS for ozone is based on hourly average concentration. These hourly average
concentrations are done automatically via the LEADS. If this reduction must be done manually,
refer to Chapter 12 of this manual for specific guidelines.

Chapter 2
Revision No. 8
December 31, 2015
Page 16 of 18
Form 1
OAMD O3 AUDIT
Chapter 2
Revision No. 8
December 31, 2015
Page 17 of 18
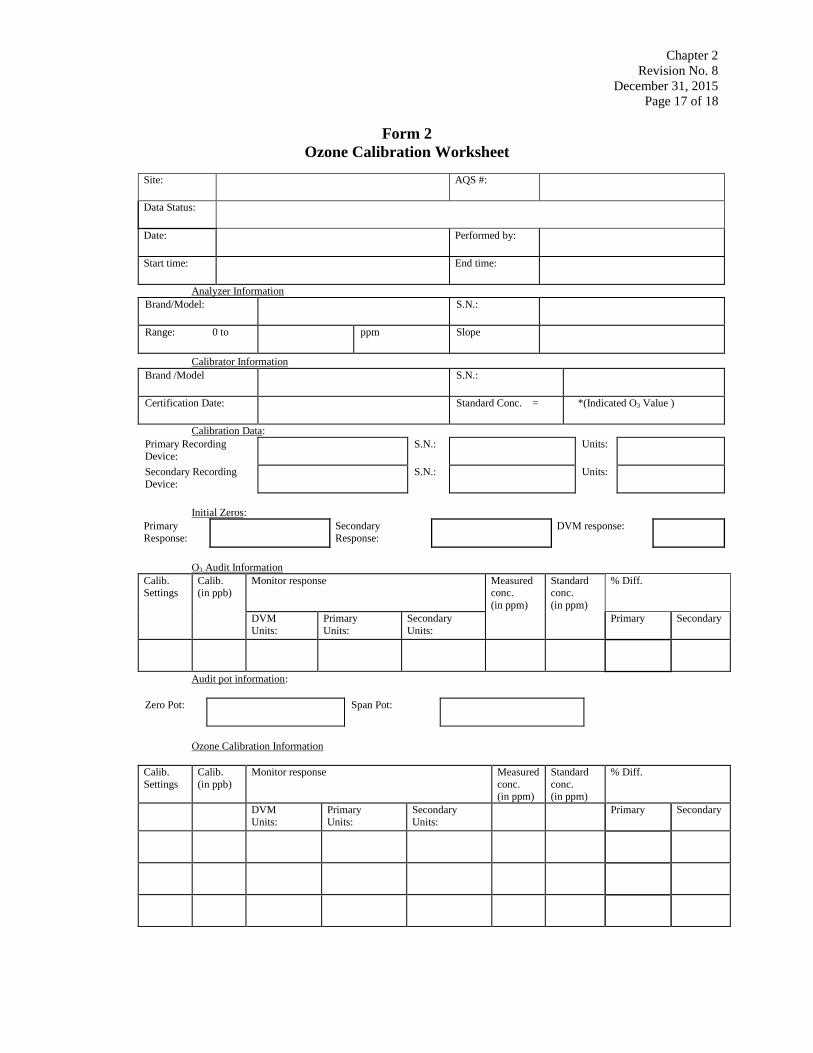
Form 2
Ozone Calibration Worksheet
Site: AQS #:
Data Status:
Date: Performed by:
Start time: End time:
Analyzer Information
Brand/Model: S.N.:
Range: 0 to ppm Slope
Calibrator Information
Brand /Model S.N.:
Certification Date: Standard Conc. = *(Indicated O3 Value )
Calibration Data:
Primary Recording
Device: S.N.: Units:
Secondary Recording
Device: S.N.: Units:
Initial Zeros:
Primary
Response: Secondary
Response: DVM response:
O3 Audit Information
Calib. Settings
Calib. (in ppb)
Monitor response Measured conc.
(in ppm)
Standard conc.
(in ppm)
% Diff.
DVM
Units: Primary
Units: Secondary
Units: Primary Secondary
Audit pot information:
Zero Pot: Span Pot:
Ozone Calibration Information
Calib.
Settings Calib.
(in ppb) Monitor response Measured
conc. (in ppm)
Standard
conc. (in ppm)
% Diff.
DVM
Units: Primary
Units: Secondary
Units: Primary Secondary

Chapter 2
Revision No. 8
December 31, 2015
Page 18 of 18
Calibration pot information:
Zero Pot: Span Pot:
For TECO Only:
A/B Test:
Are the 10 averages within 3.0%? : (Circle one) Yes No
Leak
Test: Site
Temp: Reminder: IS PSI SET IN COMPUTER?
DIAGNOSTICS
TECO DASIBI
Flow: A: B: Flow:
For 49:
Noise: A: B: Sample
Frequency:
Frequency A: B:
Pressure: A: B: Control
Frequency:
Temp: A: B:
For 49C: (Also for 1008):
Intensity: A: B: Temperature:
Noise: Aref Asam Bref Bsam
Pressure: Pressure:
Bench:
Bench lamp:
COMMENTS
__________________________________________________________________________
__________________________________________________________________________
__________________________________________________________________________