chapter 2 chemical passivation of ge(111) surfacesthesis.library.caltech.edu/6205/4/thesis-2.pdf ·...
TRANSCRIPT

12
Chapter 2
Chemical Passivation of Ge(111)Surfaces
2.1 Background
A stable, low defect-density GeOx/Ge interface that is analogous to the SiOx/Si(100)
interface cannot be formed, so the elimination of surface oxide from Ge would be im-
portant to the utilization of Ge as a device material. The original surface passivation
through Grignard alkylation of a diamond-type semiconductor had in fact been per-
formed on Ge in 1962.1 The researchers were successful in eliminating the influence
of atmospheric moisture upon the electronic properties of the crystal surface, but still
suffered from a large density of surface states, possibly because of an overly aggressive
etching procedure. Very little follow-up work on such organic passivation methods
was done in the ensuing decades. More recent work has shown that a variation on that
early procedure is useful in passivating Si surfaces.2,3 The alkylated Ge(111) surfaces
described in this research were prepared in a similar manner, with some modifications.
This chapter is a description of the chemical methods utilized.
Proper cleaning of the substrate is crucial to any successful surface modification.

13
The well established methods for cleaning Si cannot be directly applied to Ge because
the oxide offers no protection. Aqueous acidic oxidizing solutions can easily etch and
roughen the surface.4,5 Repeated etching cycles in aqueous acid etchants and water
can remove contaminants such as metal ions, but do still remove crystal material and
thus leave open the possibility for further surface roughening.6–10 Degreasing with
organic solvents does not etch the surfaces, but does not remove ionic contaminants,
so aqueous etching methods cannot be avoided.
Hydrogen-terminated surfaces may be prepared through the use of aqueous HF
solutions. Removal of the oxide is possible, but the well-ordered 1x1 H-Si(111) surface
established for Si(111) treated with aqueous NH4F solution has no reported Ge(111)
corollary.11 Confirmation that the NH4F solutions do not lead to a flat, hydrogen-
terminated surface is easily achieved by noting that the etchant does not produce
a hydrophobic Ge surface. There is some disagreement over the stability of the H-
Ge(111) surface, but it is generally accepted that it does not posses the stability of
the H-Si(111) surface.8,12,13
Halogen termination can be achieved in vacuum or in solution.14,15 The distance
between Ge atop atoms is approximately 4 Å, which can accommodate bromine or
chlorine on every site.16,17 While not air-stable over long periods, these surfaces do
serve as useful precursor substrates for Grignard alkylation.1,18
Sulfide passivation of Ge(100) and Ge(111) in UHV conditions had been reported
to successfully remove oxygen through the formation of either 1.0 ML or 0.5 ML
sulfur atoms bonded to the surface, depending upon the sulfur source and anneal-
ing procedure.19 Such passivation was then attempted with a more readily accessible

14
wet chemical method involving (NH4)2S, but an amorphous GeSx layer was often
formed.12,20,21 Dielectric stacks formed on sulfur-passivated Ge(100) with HfO2 dis-
played trap state densities very similar in magnitude to unpassivated stacks.22 From
these results, it appears the sulfide layer formation does not reliably passivate the Ge
surface.
Organic passivation can be achieved at relatively low temperatures and could al-
low further functionalization of the surface. Three methods of attaching long-chain
hydrocarbons have been established and are summarized in Figure 2.1. From the
hydrogen- or halogen-terminated surface, organic molecules can be attached either
through reaction with thiols or with terminal olefins.12,23–26 The thiol attachment
route has the advantage of requiring neither heat nor inert atmosphere, however it
has the disadvantage of producing a less chemically robust surface.23 Hydrogermyla-
tion requires only one post-etching step, is completed within a couple of hours, and
produces the more chemically inert Ge-C bond at the surface.25 The Grignard alky-
lation also produces Ge-C bonds, and is unique in that it allows the attachment of
methyl groups to the surface, allowing for the thinnest overlayer and best possible
coverage. Larger organic groups, such as ethyl, have a radius of 4.5–5.0 Å, which does
not allow for the capping of every atop atom of the Ge(111) surface.1,27,28
Because they show the greatest stability and do not require energy-intensive high
vacuum techniques, the organic modifications show promise as useful interface pas-
sivation methods. This chapter details the experimental procedures for the surface
modifications used in the investigations described in the subsequent chapters.


16
2.1.1 X-Ray Photoelectron Spectroscopy
2.1.1.1 Elemental Analysis
X-ray photoelectron spectroscopy (XPS) is useful for surface sensitive elemental
analysis and for obtaining certain chemical information such as oxidation state. The
sample under ultra-high vacuum is irradiated with a monochromatic X-ray line of
sufficient energy to eject core electrons to vacuum, where they are collected by the
analyzer and sorted by kinetic energy. The kinetic energy, KE, is a function of the
photo-ionized atom, but also the X-ray energy, hυ and the work function, Φ of the
specific instrument being used. As a result, the data is usually reported in binding
energy, BE
BE = hυ − KE − Φ (2.1)
which is independent of the X-ray source and instrument.
Figure 2.2 is a survey spectrum of sputter-cleaned Ge. Many of the features visible
in the spectrum are either Auger lines or XPS lines compounded with another energy
loss pathway. Random scattering of photoelectrons causes the baseline to rise after
every strong emission line. A photo-ionized atom may be in an excited state, or a
quantized amount of energy may go into bulk plasmons rather than KE so there are
often peaks of less intensity located at higher B. eV from the parent XPS line.

17
Fig
ure
2.2:
XP
Ssu
rvey
spec
trum
ofcl
ean
Ge

18
2.1.1.2 Surface Coverage Model
A substrate-overlayer model was used to quantify the composition of the surface
region.29,30 In the following analysis, the X-ray penetration depth far exceeds the
photoelectron escape length, λ, so only the escape length affects the XPS line intensity.
The escape length is dependent upon the kinetic energy of the photoelectron and
the material of the overlayer through which it must travel. This dependence was
calculated by the empirical relationship
λ = 532−2 + 0.41a1.5KE0.5 (2.2)
where a is the atomic diameter.
The spectral peaks of interest in this study are Br 3d or C 1s of the overlayer
atoms and the Ge 3d of the crystal surface atoms. Because there will always be
hydrocarbon contamination of a surface exposed to air or backstreamed mechanical
pump oil, the C 1s peak contains a 285 B. eV component arising from carbon bonded
to carbon (C-C). A core electron of carbon bonded to a less electronegative element
such as Ge (C-Ge) will have a lower binding energy, so for alkylated samples, there
is a C 1s component at 284.3 B. eV. The area of that component is a measure of the
alkyl groups bonded to the surface.
The Ge 3d spectral peak is dominated by emission from the crystal atoms below
the surface, which yields a doublet at 29.4 and 30 B. eV. The doublet arises from spin
orbit coupling, and has a well established peak intensity ratio. Surface Ge atoms are
not readily apparent, but those atoms which are in +1 – +4 oxidation states, such as

19
those in an oxide, have a sufficiently higher binding energy to be visible in the 31 –
33 B. eV range, distinguishable from the bulk emission. The intensity of this broad
spectral feature is a measure of the chemical oxidation of the Ge surface, as described
below.
The thickness of the carbon overlayer is calculated from the C 1s and Ge 3d peak
area from
Iov
IGe
=
(
SFov
SFGe
) (
ρov
ρGe
)
1 − exp(
−dov
λov sin θ
)
exp(
−dov
λGe sin θ
)
(2.3)
where is I the peak intensity, ρ is the atomic density, SF is the sensitivity factor,
dov is the overlayer thickness, λ is the photoelectron escape length, and θ is the
photoelectron take-off angle determined by the surface orientation relative to the
analyzer. The subscript ov signifies an overlayer component, the subscript Ge signifies
a Ge component. The Ge 3d spectral peak was chosen over the more surface-sensitive
Ge 2p because the 3d photoelectron has a high kinetic energy that is similar to that
of the C1s photoelectron, so that λGe ≈ λov and equation 2.3 may be simplified to
dov = λov sin θ × ln
(
1 +
(
SFGe
SFov
) (
Iov
IGe
) (
ρGe
ρov
))
(2.4)
An alternative formulation that is useful for expressing the fractional monolayer
coverage from the 284.3 B. eV C 1s component is
(
Iov
IGe
)
=Φov
(
1 − exp(
−aov
λov sin θ
))
1 − Φov
(
1 − exp(
−aov
λGe sin θ
))
(
ρov
ρGe
) (
SFov
SFGe
)
(2.5)

20
where Φov is the fractional monolayer coverage, and aov is the atomic diameter of
the overlayer. If Φov is not large, and the escape lengths are once again set equal,
equation 2.5 can be simplified to
Φov =
[
λov sin θ
aov
] (
ρGe
ρov
) (
SFGe
SFov
) (
Iov
IGe
)
(2.6)
Oxygen incorporation was never intentional for these experiments, so the signal
from the 532 B. eV O 1s peak was usually weak and difficult to quantify. The GeOx
layer was instead quantified from the Ge 3d peak. From the intensity ratio of the
higher B. eV component to the bulk Ge component, the oxide thickness may be
calculated in a manner very similar to that used in equation 2.4.
d = λov sin θ ×
(
ln
[
1 +
(
I0
Ge
I0ov
) (
Iov
IGe
)])
(2.7)
where the subscript ov denotes the oxide overlayer. The ratio I0
Ge/I0
ov is an experi-
mentally determined normalization factor obtained from the ratio of pure Ge to pure
oxide.29
To estimate the fraction of surface atoms that are oxidized, the measured Ge 3d
ratio is compared to the expected value for 100% oxidation. Because the kinetic energy
of all considered photoelectrons are similar, any scattering and attenuation should be
similar and may be ignored. The total intensity, used in the relation of equation
2.8, would have contribution from all photoelectrons able to reach the surface, which
would depend upon the atomic density (nGe), the photoionization cross section (σGe),
and the take-off angle-dependent escape depth (λGe).

21
IGe ≈ nGeσGe
∞ˆ
0
exp
(
−z
λGe,bulk sin θ
)
dz = nGeσGeλGe,bulk sin θ (2.8)
The surface atoms have the same photoionization cross section, a two-dimensional
surface density (nGe,s), but the photoelectrons do not traverse the bulk material, so
the surface contribution can be given by
IGe,s ≈ nGe,sσGe (2.9)
If every surface atom is oxidized, the broad oxidized spectral peak would be given
by equation 2.9, and the bulk peak component would be IGe − IGe,s, so a ratio of
0.223 would be obtained from
IGe,s
IGe
=nGe,s
nGeλGe,bulk sin θ − nGe,s
(2.10)
and division of the measured ratio by equation 2.10 yields the fraction of oxidized
surface atoms.
2.2 Experimental
2.2.1 Materials
Unless stated otherwise, all chemicals were purchased from Aldrich or Alfa Aesar
and used as received. All water was obtained from a Barnstead Nanopure system
and had a resistivity of 18 MΩ-cm. Diethylene glycol dibutyl ether (DEGDBE) was

22
vacuum distilled from LiAlH4 and stored under nitrogen until further use. 1-Decene
was vacuum distilled from sodium metal and stored under nitrogen, in the dark,
until needed. Br2(l) was vacuum transferred from phosphorus(V) oxide, subjected to
multiple freeze-pump-thaw cycles, and stored in a Schlenk flask until needed. Etching
solutions were prepared from dilution (or combination) of 30.7 M (49%) HF, 9.7 M
(30%) H2O2, 12.0 M (37%) HCl, or 8.8 M (48%) HBr.
Dimethylmagnesium solutions were prepared by adding small portions of 1,4-
dioxane to methylmagnesium bromide in diethyl ether until the dioxane•MgBr2 com-
plex no longer precipitated, then the ether solution was filtered through glass wool.
Low vapor-pressure organomagnesium and organolithim solutions were prepared from
the diethyl ether solutions by addition of an equal volume DEGDBE, then vacuum
removal of the diethyl ether to a liquid nitrogen cooled trap.
Two-inch Ge(111) wafers (MTI Corp.) were diced with a diamond scribe to form
rectangular fragments of a size appropriate for the experiment, and the edges were
ground with carbide paper to prevent shattering. When necessary, regions of the
surface were sanded for ohmic contact points. The fragments were then rinsed with
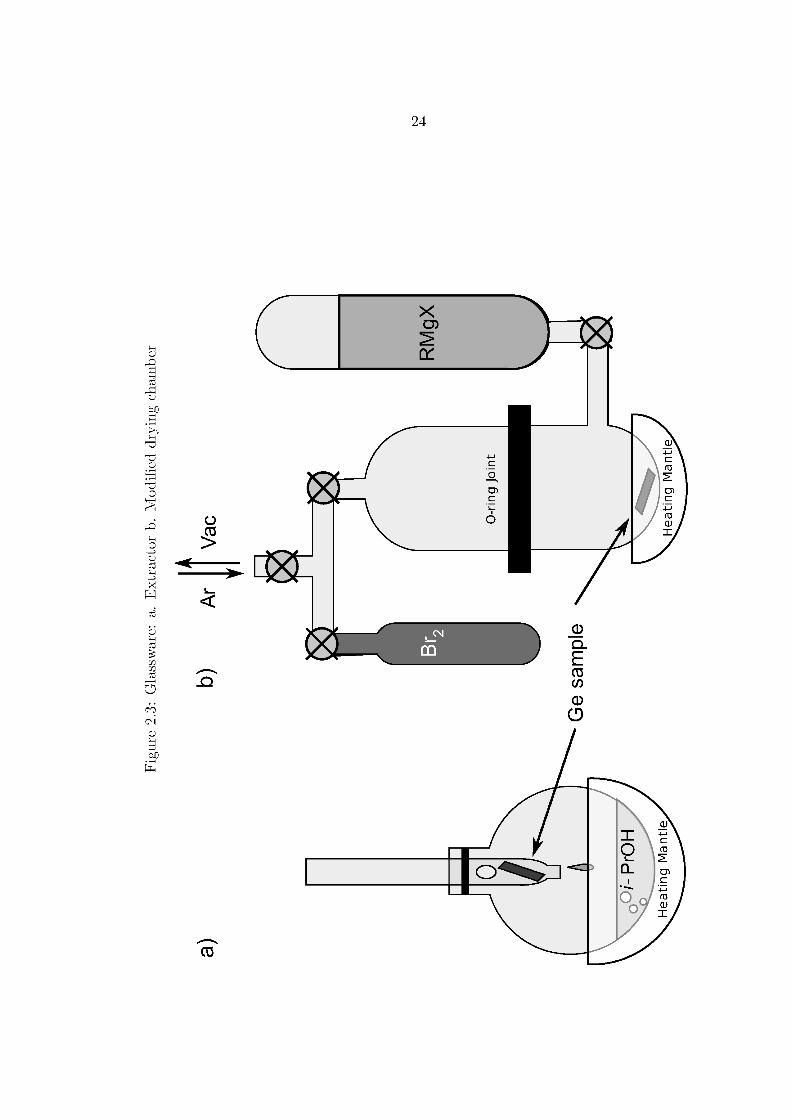
water and and either degreased with refluxing isopropanol in an extractor apparatus
shown in Figure 2.3 on page 24, or sonicated in a detergent solution (7x cleaning
solution, MP BioMedical). To remove any contamination in the oxide layer, the
fragments were then rinsed with water, immersed in a 30% hydrogen peroxide for 50
– 70 s, then rinsed again and blown dry with nitrogen.

23
2.2.2 Surface Modification
2.2.2.1 Grignard Alkylation
Each sample was etched until the etchant solution did not adhere to the surface.
The etchant compositions and etching durations are listed in Table 2.1. H-Ge(111)
surfaces were prepared by one of two methods. Some samples were very briefly etched
with an anisotropic etchant, henceforth referred to as Superoxol etch, composed of a
mixture of H2O, HF, and H2O2 in a 4:1:1 volume ratio of their standard concentrations
to yield a solution of 1.6 M H2O2 and 5.1 M HF(aq). These samples were then
thoroughly rinsed and placed in a 6.0–9.0 M HF(aq) solution for 3–6 min, until the
surface was cleanly hydrophobic. Samples that were not treated with the Superoxol
etch were also etched with 6.0–9.0 M HF(aq), and required longer etching times to
become hydrophobic. Cl-Ge(111) samples were produced by etching in 6.0 M HCl(aq)
for 20–25 min until hydrophobic. Br-Ge(111) samples were produced by etching in
6.0 M HBr(aq) for 1–3 min.

25
Tab
le2.
1:P
roce
dure
sof
Etc
hing
Ge(
111)
Etc
hant
Nam
est
epC
ompo
siti
ondu
rati
on
HF-6
16.
0M
HF
20-2
5m
in
HF-1
21
12.0
MH
F8-
15m
in
HC
l-6
16.
0M
HC
l20
-25
min
HC
l-9
19.
0M
HC
l8-
10m
in
HB
r-6
16.
0M
HB
r1-
3s
HF-N
H4C
l-6
16.
0M
HF
&6.
0M
NH
4C
l20
min
a
Supe
roxo
l-6
11.
6M
H2O
2&
5.1
MH
F1-
3s
26.
0M
HF
3-6
min
Supe
roxo
l-6-
HC
l1
1.6
MH
2O
2&
5.1
MH
F1-
3s
26.
0M
HC
l>
45m
inb
Supe
roxo
l-12
11.
6M
H2O
2&
5.1
MH
F1-
3s
212
.0M
HF
30s
abe
cam
eco
ated
wit
hhy
droc
arbo
nsan
ddi
dno
tlo
sehy
drop
hobi
city
inpr
olon
ged
cont
act
wit
hw
ater
oret
chan
t.b
did
not
beco
me
hydr
opho
bic

26
Immediately after removal from the etchant, the hydrophobic sample was blown
dry with nitrogen and placed in a modified drying chamber, depicted in Figure 2.3b.
The chamber was evacuated and backfilled with argon several times. For all but the
HBr-etched samples, when the chamber pressure was below 20 mTorr, the vacuum
line was closed and the chamber was backfilled with Br2. After 2–3 minutes, the
valve to vacuum was re-opened and the Br2 captured in a liquid nitrogen trap. Once
the pressure was again below 20 mTorr, the low vapor pressure organomagnesium
or organolithium solution was added until the sample was completely immersed, and
the chamber backfilled with argon. Reactions involving the lithium reagent were not
heated, but the organomagnesium solution was heated to 60–70C and left to react
for 3–12 h. In the case of decylmagnesium bromide, the reaction was left for 20–24
h. Once the solution had cooled, the sample was removed and rinsed successively
with isopropanol, methanol, water, 1.7 M acetic acid(aq) (to remove magnesium
hydroxide), water, methanol, isopropanol, then placed back into the extractor or
detergent solution until needed.
2.2.2.2 Hydrogermylation
Samples were etched with 6.0 M HF and placed under vacuum in a drying cham-
ber, as described above. 1-Decene was added to the chamber until the sample was
completely immersed, then the chamber backfilled with Ar(g) and heated to reflux
for 3 h while under a slight positive argon pressure. Once cooled, the sample was re-
moved and rinsed with hexanes and isopropanol, then placed back into the extractor
until further needed.

27
2.2.2.3 Thiolation
Methanethiol solutions were prepared just prior to use by passing methanethiol
vapor through isopropanol. HF etched samples and the thiol solution were placed
in a sealed polypropylene container overnight. After removal from the solution, the
sample was rinsed with isopropanol and methanol.
2.2.3 Elemental Surface Chemical Analysis
2.2.3.1 Instrumentation
Measurements were performed at vacuum pressures of 10−10−10−8 Torr with an M-
probe spectrometer interfaced with a computer running ESCA200 Capture software
(Service Physics). The monochromatic X-ray line was 1486.6 eV Al Kα directed
at 35 to the sample surface. Photoelectrons were collected with a hemispherical
analyzer mounted at a 35 angle to the sample surface. The samples were conductive
so correction for sample charging was not necessary.
Survey spectra were collected with low resolution settings. Higher resolution scans
were collected at settings yielding a full-width at half-maximum of ∼0.76 eV.
2.2.3.2 Analysis
Peak fitting of the detailed scans was performed with ESCA2000 Analysis software
(Service Physics). Individual peaks of the Ge 3d and Br 3d doublets were set to have
identical asymmetry and Gaussian shape, and a 5
2: 3
2height ratio of 0.69. All other
parameters were allowed to float. Sensitivity factors used for this instrument Br, Ge,

28
Si, and C were 3.16, 1.62, 0.9, and 1.0, respectively.
Atomic diameters were estimated from the inverse cube root of the atomic density,
a = 3
√
A.W./ρNA (2.11)
with A.W. being the atomic weight, ρ the density, and NAis Avogadro’s number. The
sensitivity factors were obtained from the software. Parameters used to calculate the
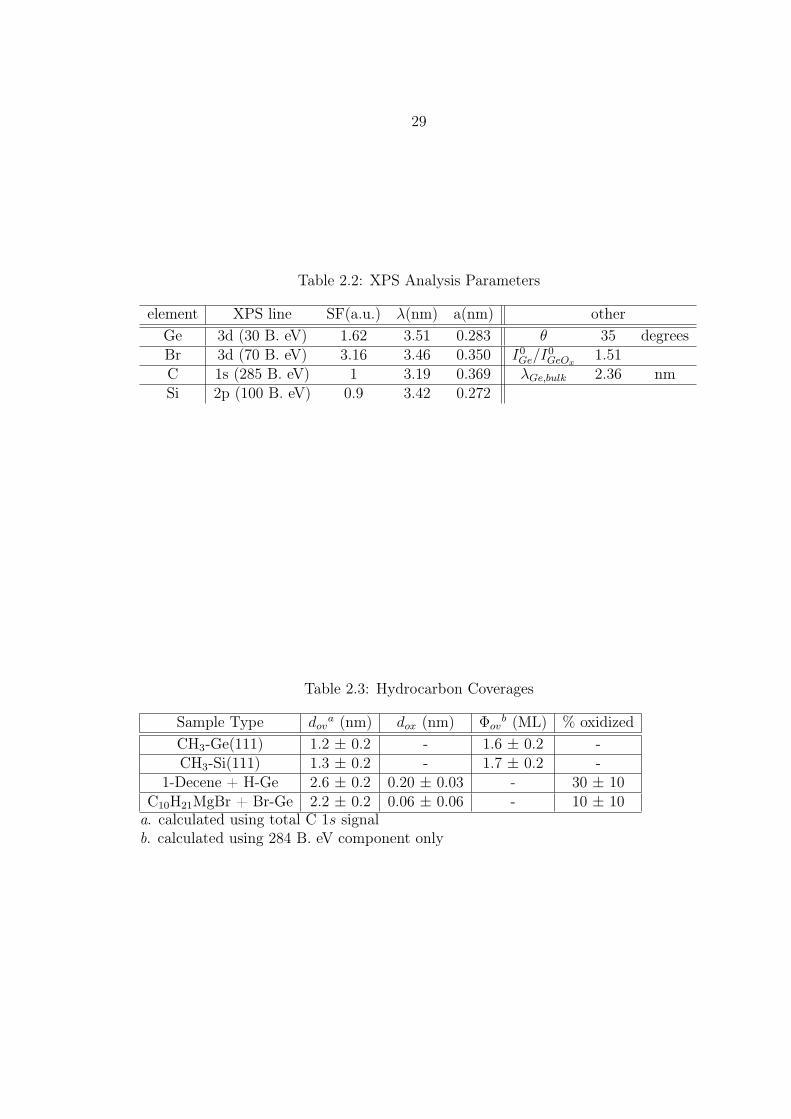
overlayer thicknesses and equivalent monolayer coverages are collected in Table 2.2.
29
Table 2.2: XPS Analysis Parameters
element XPS line SF(a.u.) λ(nm) a(nm) otherGe 3d (30 B. eV) 1.62 3.51 0.283 θ 35 degreesBr 3d (70 B. eV) 3.16 3.46 0.350 I0
Ge/I0
GeOx1.51
C 1s (285 B. eV) 1 3.19 0.369 λGe,bulk 2.36 nmSi 2p (100 B. eV) 0.9 3.42 0.272
Table 2.3: Hydrocarbon Coverages
Sample Type dova (nm) dox (nm) Φov
b (ML) % oxidizedCH3-Ge(111) 1.2 ± 0.2 - 1.6 ± 0.2 -CH3-Si(111) 1.3 ± 0.2 - 1.7 ± 0.2 -
1-Decene + H-Ge 2.6 ± 0.2 0.20 ± 0.03 - 30 ± 10C10H21MgBr + Br-Ge 2.2 ± 0.2 0.06 ± 0.06 - 10 ± 10
a. calculated using total C 1s signalb. calculated using 284 B. eV component only


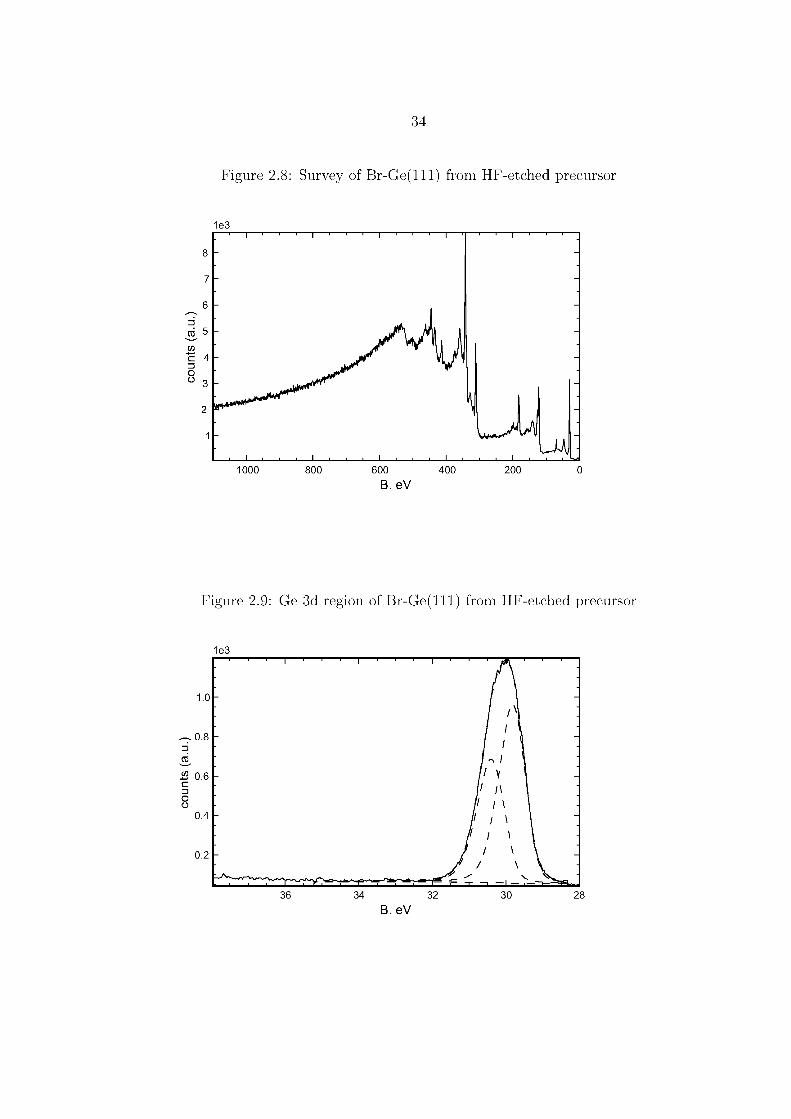
33
The lack of a significant O 1s peak in the survey spectrum Figure 2.8 on page 34,
and the lack of noticeable higher B. eV components in the Ge 3d or Ge 2p spectra,
Figures 2.9 and 2.10, show that hydrogen-terminated surfaces immediately treated
with Br2 vapor show little sign of oxidation. From the Br 3d peak intensity, shown in
Figure 2.11, initial surface coverages are calculated to be 1.0 ± 0.1 ML. Halogenated
surfaces show much slower rates of oxidation compared to H-Ge(111), but are not air-
stable over the long term. After four days exposure to lab air, there is an appearance
of 0.3 ML oxide, and a reduction of the Br 3d signal to 0.5 ML. Surfaces that
had been etched with 6.0 M HCl(aq) prior to Br2 exposure displayed 0.5 ML Br, as
determined from the ratio of the areas of the Br 3d and Ge 3d peaks, seen in Figures
2.15 and 2.13. The Ge 2p and Ge 3d, shown in Figures 2.14 and 2.13, do not display
noticeable high B. eV components indicative of oxidized surface species. Evidence for
Cl components can be seen from the small peak at 270 B. eV in the survey spectrum
of Figure 2.12, but the Cl peaks were not clear in detailed scans and the coverage was
not calculated.


47
2.4 Discussion
2.4.1 Inorganic Surface Groups
Hydrogen-terminated and halogen-terminated Ge surfaces do not provide chem-
ically stable surfaces, but are useful as intermediates for further processing. The
higher reactivity of the H-Ge(111) surface relative to the halogen-terminated sur-
faces is not simply explained by the bond dissociation energies, for the H-Ge bond
is intermediate, at 290 kJ/mol, between Cl-Ge (356 kJ/mol) and Br-Ge (276 kJ/-
mol).31 The chloride-terminated surfaces are believed to be well ordered, but the
HF-etched surfaces are not, which would be expected to cause differences in reac-
tivity.15,16 This atomic roughness could also explain the discrepancy between earlier
reports of H-Ge(111) stability and what has been observed more recently, including
the work described here.13,26
Thiol termination of Ge continues to receive attention because the procedure is
simple, the concept is reminiscent of Au-thiol monolayer system, and H-, Cl-, and
Br-terminated surfaces are not stable.6,26 Monolayers attached via a Ge-S bond are
not as stable as those attached by a Ge-C bond, but that does not rule out their use as
a stable intermediate.32 In this study, the Ge-S bond was of interest so methanethiol
was used, despite the inconvenience of handling, so that the surface was not protected
simply by being buried under a thick hydrocarbon layer. The procedure was not
optimized, so the presence of oxygen on the surface could have been further minimized.
If the Ge-S-C bonding was not stable, the small thiol molecule could be expected to
easily desorb. This is confirmed in Figure 2.20 on page 40 by the disappearance of

48
the S 2p after one day exposure to air.
2.4.2 Alkyl Groups
2.4.2.1 Methyl
As has been established for CH3-Si(111), methylation of the Ge(111) surface pro-
tects the surface from chemical oxidation by atmospheric conditions. After normal-
ization for differing sensitivity factors, the ratio of surface-bound C 1s XPS line to the
bulk Ge 3d line, IC1s : IGe3d, is nearly identical to the IC1s : ISi2p ratio measured in the
CH3-Si(111) surfaces prepared in this work and in measurements previously reported
by others.33 From this, it can be concluded that there is complete or near complete
termination of atop Ge bond sites, and the final surface is comparable to that of Si.
The 12±2 Å overlayer thickness (see Table 2.3) is too large for a methyl group with
a van der Waals radius of 2.2 Å.27 However, if the adventitious hydrocarbon peak,
which can be seen to comprise just over half the entire C 1s signal, is discounted,
a measured value of 6 ±2 Å thickness is obtained. Such a value is justifiable if the
surface is not atomically smooth over the area of the incident X-ray spot.
A proposed mechanism for the alkylation of the halogenated (or hydrogen-terminated)
surface is that alkyl halide impurities are reduced by the Grignard and form radi-
cals, both in solution and on the crystal surface.34 Evidence of radicals in lithium-
halide exchange reactions indicates that the same process is possible for alkyllithium
reagents.35 The report that alkyllithium reagents were ineffective in this type of alky-
lation raises the question of whether the alkylation mechanism is different for Si and

49
Ge.36 In this work however, there were no detectable differences in methylated surfaces
prepared from CH3MgX (X = Cl,Br,I,CH3) or CH3Li. This would be consistent with
the radical model, which implicates halogenated hydrocarbons as a radical source,
because the methyllithium solution was reported by the supplier to contain lithium
iodide, and removal of MgBr2 with dioxane, to prepare (CH3)2Mg solutions, would
have little effect upon halogenated hydrocarbon impurities.
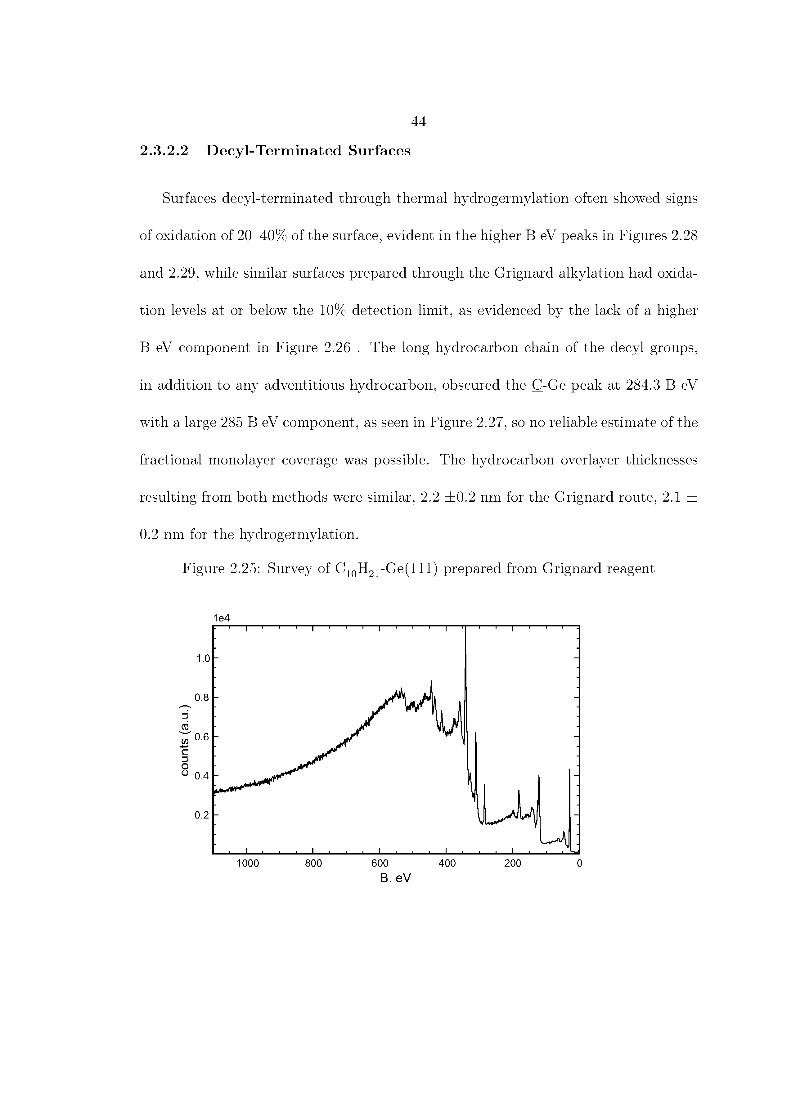
2.4.2.2 Decyl
The long reaction times reported to be necessary for the Grignard alkylation
make the quicker one-step hydrogermylation reaction an attractive method of surface
passivation. Hydrophobic surfaces with largely non-oxidized surface Ge atoms do
indicate that there was surface modification, however it was not as successful as the
Grignard reaction route. Both the Grignard alkylation and hydrogermylation routes
yielded layer thicknesses that were higher than expected, but if the adventitious
hydrocarbon contribution to the C 1s signal is assumed to be the same for both
the C10H21-Ge(111) and CH3-Ge(111) surfaces and may be similarly subtracted, the
resulting 15–16 Å thickness is in better agreement with that seen on Si(111).37
The majority of reports on successful hydrogermylation characterize the surfaces
by IR, XPS, and contact angle.24,25,38,39 Of the reports that address the issue, the au-
thors concede that there is some oxidation.25,38 Considering the higher temperatures
necessary in hydrogermylation compared to Grignard alkylation, it is not surpris-
ing that there would be degradation of the H-Ge(111). Because the alkyllithium
and alkylmagnesium reagents react with water, the reaction conditions for the two-
50
step alkylation are dry, even if there are other oxygen-containing species present. It
should be noted that there can be significant variability in the quality of Si(111) sur-
faces modified by reaction with alkenes, so the occurrence of oxide growth may be
eliminated with further optimization of the reaction conditions.40,41
2.5 Conclusion
Alkyl monolayers prepared through a milder version of the surface modification
technique first attempted almost 50 years ago show initial low oxygen content and
long-term resistance to atmospheric oxidation. XPS measurements confirm that the
hydrogen-terminated surface is unstable and that the brominated surfaces are slower
to oxidize but do not demonstrate long-term stability. The low level of oxidation
present in the final alkylated surfaces demonstrates that despite this instability, the
hydrogen- and bromine-terminated surfaces are suitable intermediates for the pro-
duction of stable alkylated surfaces. Methylmagnesium halide, dimethylmagnesium,
and methyllithium proved to be effective methylating reagents.
Two other surface passivation techniques were attempted but were not as success-
ful. While it may be possible to prepare low oxygen content monolayers through the
use of alkanethiols, the Ge-S bond does not show long term stability. Hydrogermy-
lation does provide a one-step route to a stable overlayer grafted with a stable Ge-C
bond, but the initial oxide content was higher than what is seen in the Grignard
alkylation method. Furthermore, both thiolation and hydrogermylation reactions are
better suited to production of monolayers of larger alkane groups, while the Grignard

51
alkylation method is applicable to methyl groups and larger alkanes.

52
Bibliography
[1] Cullen, G.; Amick, J.; Gerlich, D. J. Electrochem. Soc. 1962, 109, 124–127.
[2] Bansal, A.; Li, X.; Lauermann, I.; Lewis, N.; Yi, S.; Weinberg, W. J. Am. Chem.
Soc. 1996, 118, 7225–7226.
[3] Bansal, A.; Lewis, N. J. Phys. Chem. B 1998, 102, 4058–4060.
[4] Bolts, J. M.; Wrighton, M. S. J. Am. Chem. Soc. 1978, 100, 5257–5262.
[5] Brunco, D. et al. J. Electrochem. Soc. 2008, 155, H552–H561.
[6] Ardalan, P.; Musgrave, C.; Bent, S. Langmuir 2009, 25, 2013–2025.
[7] Kamata, Y.; Ino, T.; Koyama, M.; Nishiyama, A. Applied Physics Letters 2008,
92, 063512.
[8] Rivillion, S.; Chabal, Y. J.; Amy, F.; Kahn, A. Appl. Phys. Lett. 2005, 87,
253101.
[9] Maroun, F.; Ozanam, F.; Chazalviel, J.-N. J. Phys. Chem. B 1999, 103, 5280–
5288.
[10] Kosuri, M.; Cone, Q., R. Li; S.M., H.; Bunker, B.; Mayer, T. Langmuir 2004,
20, 835–840.
[11] Higashi, G.; Chabal, Y.; Trucks, G.; Raghavachari, K. Appl. Phys. Lett. 1990,
56, 656–658.

53
[12] Bodlaki, D.; Yamamoto, D.; Waldeck, D.; Borguet, E. Surf. Sci. 2003, 543,
63–74.
[13] Deegan, T.; Hughes, G. Appl. Surf. Sci. 1998, 123/124, 66–70.
[14] Fouchier, M.; McEllistrem, M.; Boland, J. Surf. Sci. 1997, 385, L905–L910.
[15] Lu, Z. Appl. Phys. Lett. 1996, 68, 1996.
[16] Cao, S.; Tang, J.-C.; Shen, S. J. Phys.: Condens. Matter. 2003, 15, 5261–5268.
[17] Sun, S.; Sun, Y.; Lee, D.-I.; Pianetta, P. Appl. Phys. Lett. 2006, 89, 231925.
[18] Wang, D.; Dai, H. Appl. Phys. A 2006, 85, 217–225.
[19] Newstead, K.; Robinson, A.; Patchett, A.; Prince, N.; McGrath, R.; Whittle, R.;
Dudzik, E.; McGovern, J. T. J. Physics: Cond. Matt. 1992, 4, 8441–8446.
[20] Anderson, G.; Hanf, M.; Norton, P.; Lu, Z.; Graham, M. Appl. Phys. Lett. 1995,
66, 1123–1125.
[21] Lyman, P.; Sakata, O.; Marasco, D.; Breneman, K.; Keane, D.; Bedzyk, M. Surf.
Sci. 2000, 462, L594–L598.
[22] Frank, M. M.; Koester, S. J.; Copel, M.; Ott, J. A.; Paruchuri, V. K.; Shang, H.;
Loesing, R. Appl. Phys. Lett. 2006, 89, 112905.
[23] Han, S. M.; Ashurst, W. R.; Carraro, C.; Maboudian, R. J. Am. Chem. Soc.
2001, 123, 2422–2425.

54
[24] Sharp, I.; Schoell, S.; Hoeb, M.; Brandt, M.; Stutzmann, M. Appl. Phys. Lett.
2008, 92, 223306.
[25] Choi, K.; Buriak, J. Langmuir 2000, 16, 7737–7741.
[26] Ardalan, P.; Sun, Y.; Pianetta, P.; Musgrave, C. B.; Bent, S. F. Langmuir 2010,
26, 8419–8429.
[27] Rivillion, S.; Chabal, Y. J. Phys. IV 2006, 132, 195–198.
[28] Yu, H.; Webb, L.; Heath, J.; Lewis, N. Appl. Phys. Lett. 2006, 88, 252111.
[29] Pomykal, K. E.; M., F. A.; Lewis, N. J. Phys. Chem. 1995, 99, 8302–8310.
[30] Haber, J. A.; Lewis, N. S. J. Phys. Chem. B 2002, 106, 3639–3656.
[31] CRC Handbook of Chemistry and Physics; Lide, D. R., Ed.; CRC Press LLC:
Boca Raton, 1999.
[32] S.M., H.; Ashurst, W.; Carraro, C.; Maboudian, R. J. Am. Chem. Soc. 2001,
123, 2422–2425.
[33] Nemanick, E.; Hurley, P.; Brunschwig, B.; Lewis, N. J. Phys. Chem. B 2006,
110, 14800–14808.
[34] Fellah, S.; Boukherroub, R.; Ozanam, F.; Chazalviel, J.-N. Langmuir 2004, 20,
6359–6364.
[35] Seyferth, D. Organometallics 2006, 25, 2–24.
[36] He, J.; Lu, Z.; Mitchell, S.; Wayner, D. J. Am. Chem. Soc. 1998, 120, 2660–2661.
55
[37] Linford, M.; Fenter, P.; Eisenberger, P.; Chidsey, C. J. Am. Chem. Soc. 1995,
117, 3145–3155.
[38] Hanrath, T.; Korgel, B. J. Am. Chem. Soc. 2004, 126, 15466–15472.
[39] Chen, R.; Bent, S. Chem. Mater. 2006, 18, 3733.
[40] Webb, L.; Lewis, N. J. Phys. Chem. B 2003, 107, 5404–5412.
[41] Aureau, D.; Rappich, J.; Moraillon, A.; Allongue, P.; Ozanam, F.; Chazalviel, J.-
N. J. Electroanal. Chem. 2010, 646, 33–42.