chapter 18: nmr spectroscopy - organic...
TRANSCRIPT

165
Chapter 18: NMR Spectroscopy
The most important tool of the chemist for the determination of molecular structure is Nuclear Magnetic
Resonance Spectroscopy, or NMR spectroscopy. NMR spectra are acquired on a special instrument called an NMR Spectrometer. The instrument and concepts are related to those used for Magnetic Resonance Imaging or MRI in medical diagnostics. The technique is challenging to learn but wonderfully powerful for the determination of organic and biochemical structure.
For organic structure determination, the two most important types of NMR spectra are the proton and carbon spectra. They give information about the number of hydrogens and carbons in a molecule and how those hydrogens and carbons are connected together, as well as information about functional groups. NMR complements IR for determination of structures of organic compounds. IR spectra can help identify functional groups in a molecular structure, but they cannot give much information about how the skeleton of an organic molecule is put together.
18.1 Spin States, Magnetic Fields, and Electromagnetic Radiation
Some nuclei exist in discrete nuclear spin states when the nuclei reside in an external magnetic field. Nuclear magnetic resonance spectroscopy observes transitions between these spin states. Important examples are the nucleus of hydrogen (the proton) and the nucleus of the 13C isotope of carbon. Nuclei that do not exist in spin states are the 12C isotope of carbon (the major isotope), and the 16O isotope of oxygen (again the major isotope). Consequently, 12C and 16O nuclei are invisible (or “transparent”) to NMR spectroscopy. The abundance of the 13C isotope of carbon in nature is only 1.1% relative to 98.9% 12C isotope. In spite of this low abundance, 13C nuclear spin transitions can be readily observed.
Other nuclei commonly present in organic molecules such as chlorine, bromine, iodine, and nitrogen nuclei have nuclear spin but are transparent for reasons beyond the scope of this presentation. Important exceptions are fluorine and phosphorous for which the major isotopes 19F and 31P have nuclear spin, and spin transitions are readily observed.
In the presence of an applied external magnetic field, 1H and 13C (also 19F and 31P) nuclei exist in two nuclear spin states of different energy. Slightly more than half of the nuclei exist in the lower energy state called alpha (α) than in the higher energy state called beta (β). The external magnetic field Bo, which is homogeneous, is created with a large magnet, commonly a super-conducting solenoid. The energy difference, ∆E, between the spin states is proportional to the strength of Bo. A typical Bo field is 7.05 T (Tesla) or 70,500 Gauss. NMR spectroscopy records transitions between these spin states induced by a radio frequency electromagnetic field called the B1 field. (See “The Electromagnetic Spectrum” on p. 156.) With an applied magnetic field of 7.05 T, the frequency v of the B1 field is about 300 MHz (megahertz, million cycles per second) for 1H NMR or 75 MHz for 13C NMR. Correspondingly, if the applied field is 11.75 T, the frequency is 500 MHz for 1H NMR or 125 MHz for 13C NMR. Instruments operating at 500 MHz give better sensitivity and resolution than those operating at 300 MHz. The relationship between field and frequency is shown mathematically by Equation 1 and graphically in Figure 18-1.
∆E = hv = h(Bo–Be)γ Equation 1
where
∆E is the energy difference between spin states
v is the frequency of the B1 field
h is Planck’s constant

Chapter 18: NMR Spectroscopy
166
γ (gyromagnetic ratio) is a constant that is a property of the particular nucleus
Bo is the strength of the external homogeneous magnetic field
Be is a small magnetic field generated by the circulation of electrons of the molecule
Figure 18-1: Graphical relationship between field Bo and frequency v.
Equation 1 introduces the important term Be. In a spherically symmetric s orbital, the Bo field (the external magnetic field) causes the electrons in the cloud surrounding the nucleus to circulate through the orbital (Figure 18-2). This circulation of electrons produces Be: an induced magnetic field opposed to the Bo field. Thus, the Be field slightly shields the nucleus from the applied magnetic field Bo and the value (Bo–Be) represents the actual magnetic field experienced at the nucleus. The Be field produced by electrons in p and d orbitals are more complex.
Figure 18-2: Creation of the Be field by the circulation of electrons in response to the Bo field. Be opposes Bo at
the nucleus.
If we divide through by h, Equation 1 simplifies to:
v = (Bo–Be)γ Equation 2
or the frequency of a nuclear spin transition v is directly proportional to the magnetic field experienced at the nucleus. This nuclear spin transition frequency v is also called the resonance or precession frequency. The

Chapter 18: NMR Spectroscopy
167
proportionality constant γ is four times larger for the 1H nucleus than it is for the 13C nucleus. This is why the resonance frequency (vo) is 300 MHz for 1H and only 75 MHz for 13C.
Almost equal population of the α and β nuclear spin states occurs because the energy difference between the spin states is quite small, 3 x 10⁻⁵ kcal/mol at 300 MHz, and the higher energy state is heavily populated by available thermal energy. The actual population ratio is given by the Boltzmann equation that relates the population ratio to ∆E and the absolute temperature. In contrast, higher energy vibrational states in IR spectroscopy are not significantly populated by available thermal energy because the energy difference between vibrational states is much larger, 5.8 kcal/mol at 2000 cm–1. An excess population of the α spin state is required in order to observe an NMR signal, and the slight excess of α spins over β spins at 7.05 T is more than sufficient. The excess is higher at higher Bo fields (11.75 T/500 MHz versus 7.05 T/300 MHz) because ∆E is higher. Correspondingly, a 500 MHz instrument has higher sensitivity than a 300 MHz instrument.
18.2 Chemical Shift
If all 1H or 13C nuclei absorbed energy at exactly the same resonance frequency v, NMR spectroscopy would not be very useful for determination of organic and biochemical structures. However, different 1H or 13C nuclei absorb at slightly different frequencies. This difference results from differences in the small internal magnetic field Be for each 1H or 13C nucleus. Again, the Be field results from the circulation of electrons of the molecule. Different 1H or 13C nuclei have different electron density surrounding them and consequently, are shielded from the applied field Bo by Be fields of different magnitude. Remember, differences in (Bo–Be) translate into differences in the frequency n needed to cause the nuclear spin transitions as shown by Equation 2.
The frequency of absorption for a nucleus of interest relative to the frequency of absorption of a molecular standard is called the chemical shift of the nucleus. The molecular standard for both 1H and 13C NMR spectroscopy is tetramethylsilane (TMS, Figure 18-3). Because of molecular symmetry all 12 protons of TMS absorb at the same frequency and all 4 carbons absorb at the same frequency.
Figure 18-3: Tetramethylsilane (TMS) contains 12 equivalent protons.
In the NMR spectrum of an organic compound, peaks appear at the positions of absorption, also called the positions of resonance or precession frequencies, for different nuclei in the molecule. The exact chemical shift of a particular nucleus in a molecule gives us information about how the atom with that nucleus is bonded in the molecule. The x-axis of the spectrum is called the delta scale (δ) with units of ppm and the y-axis is an intensity scale. The height of the peak on the y-axis is proportional to the number of 1H nuclei in the molecule with the same chemical shift. The intensity of a 13C resonance is, however, not proportional to the number of carbons and this will be discussed later.
On the δ scale, the position of resonance is given by:

Chapter 18: NMR Spectroscopy
168
δ = (v – vTMS)/vo Equation 3
where
(v – vTMS) is the frequency difference between the resonance of the signal of interest and the resonance of TMS. Note that (v – vTMS) will always be in units of Hz (from 1 Hz to a few thousand Hz)
vo is the center frequency of the B1 field in megahertz (MHz). (Note: If Bo=7.05 T, νo = 300 MHz for 1H nuclei or 75 MHz for 13C nuclei. If Bo = 11.75 T, νo = 500 MHz for 1H nuclei or 125 MHz for 13C nuclei.)
In Equation 3, δ is a ratio of Hz/MHz, the result is a ratio without units (1/1 × 106) or one over one million. A better term for “one over one millionth” is parts-per-million or ppm.
As a result of Equation 3 the chemical shift of the 1H nuclei in the 1H NMR spectrum or 13C nuclei in the 13C NMR spectrum of TMS appear at δ = 0 ppm. Typically, δ increases from 0 on the right-hand side of the spectrum to 10 ppm on the left-hand side of an 1H NMR spectrum or from 0 on the right-hand side to 200 ppm on the left-hand side of a 13C NMR spectrum. The reason frequencies of absorption are recorded on the δ-scale relative to those of a standard molecule is so the position of absorption will be independent of the spectrometer used to record the spectrum, in particular independent of the strength of the Bo field of the spectrometer. For example, the chemical shift of the protons of acetone will be the same (δ 2.16 ppm), independent of whether the spectrum is obtained at 300 MHz or 500 MHz.
In principle, resonance can be achieved by holding Bo constant and scanning the frequency of the radio frequency excitation field B1. Alternatively, the frequency can be held constant and the strength of Bo can be scanned. In other words, Equation 2 can be satisfied by varying the frequency of B1 or the strength of Bo for each different 1H or 13C nucleus in a molecule. In practice, modern NMR spectrometers operate at constant Bo.
The direction of increasing frequency at fixed field and increasing field at fixed frequency are shown in Figure 18-4. The right-hand side of the chart is described as the high field region and the left-hand side as the low field region.
Figure 18-4: NMR chart papers for 1H and 13C NMR.
The 1H NMR spectrum of methyl acetate (Figure 18-5) shows two peaks: one at δ=2.1 ppm for the three equivalent methyl protons and one at δ=3.7 ppm for the three equivalent methoxy protons. The methoxy protons are said to resonate downfield from the methyl protons. Each of the three methyl protons are

Chapter 18: NMR Spectroscopy
169
equivalent to each other and each of the three methoxy protons are equivalent to each because of rapid rotation about the carbon-carbon and carbon-oxygen single bonds. 1H or 13C nuclei are said to be chemical
shift equivalent if they have exactly the same chemical shift; in other words they experience the same Be field. This most commonly results from molecular symmetry coupled with rapid rotations about single bonds, but can also occur by coincidence. Table 18-1 summarizes the symbols used to designate magnetic fields and frequencies.
Figure 18-5: The 1H NMR spectrum of methyl acetate.
Table 18-1: Summary of magnetic fields and frequencies.
Bo applied external magnetic field
Be local magnetic field caused by circulating electrons in response to Bo
B1 radio frequency electromagnetic field of frequency v that causes the spin transitions
Bn local nuclear magnetic field caused by neighboring magnetic nuclei
v precession frequency of a magnetic nucleus of interest in Hz
vTMS precession frequency of the nuclei of the NMR standard compound, tetramethyl silane (TMS) in Hz
vo the center frequency of the B1 field in MHz, also called the spectrometer operating frequency

Chapter 18: NMR Spectroscopy
170
A. Factors Affecting Proton Chemical Shifts
1. Electronegativity Effect
The resonance position of protons bonded to carbon is shifted downfield by electronegative elements also bonded to the carbon (Figure 18-6). The electronegative element withdraws electron density from the carbon and its directly bonded protons, which diminishes the magnitude of the Be field. Since the Be field shields the protons from the Bo field, a smaller (in magnitude) Be field requires a lower Bo field to achieve resonance, hence a downfield shift. The higher the electronegativity of the directly bonded atom, the larger the downfield shift. (See Equation 2 and Figure 18-4.) The higher the electronegativity of the directly bonded atom, the larger the downfield shift.
Figure 18-6: The effect of electronegative elements on chemical shift.
2. ̟-Bond Effect
Alkenes and aromatic compounds bearing π-bonds will spend a portion of their time oriented with the plane defined by their sigma bonds perpendicular to the direction of the Bo field. In this orientation, the π-electrons will circulate to produce a Be field that opposes the Bo field above and below the π-bond, but adds to the Bo field in the vicinity of the hydrogen nuclei as shown in Figure 18-7. Since the Be field from the π-electrons is augmenting the applied field, a lower applied field at fixed B1 frequency is required to achieve resonance. Because this mechanism causes alkene and aromatic hydrogen nuclei to resonate downfield, they are also said to be deshielded by the π-electrons, but in reality the contribution to the total Be field from the π-electrons is just opposite in sign to the contribution from the other electrons. In contrast, the major effect from π-electrons in the terminal alkyne occurs when the molecular axis lies along the direction of the Bo field. In this orientation the π-electrons circulate about the girth of the molecule involving both π-bonds to produce a contribution to the Be field that opposes the Bo field in the vicinity of the terminal proton (Figure 18-7). Hence, the terminal alkyne proton resonates upfield (δ~2.5 ppm) from the alkene (δ~5.5 ppm) and aromatic protons (δ~7 ppm). The effect from the π-electrons is an anisotropic effect because its magnitude and direction depend upon a particular orientation of the molecules with respect to the direction of the Bo field. An isotropic effect is independent of orientation.

Chapter 18: NMR Spectroscopy
171
Figure 18-7: Components of the Be field produced by the circulation of π-electrons in alkenes, aromatics, and
alkynes as a function of orientation relative to the applied field Bo. The major anisotropic contribution to the
total Be field from circulation of π-electrons adds to (alkene or aromatic) or subtracts from Bo (alkyne).
The chemical shifts of some hydrogen nuclei (protons) in various magnetic environments are shown in Figure 18-8 (and also in the table on the back cover of this Handbook). A general rule to remember about chemical shifts of protons on saturated carbon is that the methylene proton (CH2) chemical shift will appear approximately 0.2–0.4 ppm downfield from the corresponding methyl proton chemical shift, and the methine proton (CH) chemical shift will appear approximately 0.2–0.4 ppm downfield from the corresponding methylene chemical shift:
δ CH>CH2>CH3
This is because carbon is slightly more electronegative than hydrogen. Electronegativity and π-bond effects are additive; additivity is readily apparent in the chemical shift of the aldehyde proton (δ = 10) and of the methoxy of a methyl ester (δ = 4) relative to the methoxy of an ether (δ = 3.5).

Chapter 18: NMR Spectroscopy
172
Figure 18-8: Approximate proton chemical shifts.
From Figure 18-8 we quickly see that the position of absorption is suggestive of the presence of functional groups. A peak between δ 9 and 10 indicates an aldehyde, peaks in the region δ 7 to 8 indicate an aromatic ring, peaks in the region δ 5 to 6 indicate an alkene, peaks between δ 3.5 to 4.5 indicates an ester, etc. Note that protons on the heteroatoms O and N show a wide range of chemical shifts that are concentration, temperature, solvent, and pH dependent. These protons are involved in hydrogen bonding and exchange with each other and with water (usually present as an impurity) by an acid–base mechanism through hydrogen bonding. Variable hydrogen bonding and exchange give rise to the variable chemical shift.
B. Factors Affecting Carbon Chemical Shifts
13C chemical shifts are also reported relative to the standard, tetramethylsilane (TMS). Hence, the chemical shift of the four equivalent carbons of TMS appear at δ = 0 ppm. The range of chemical shifts in which most carbon resonances appear is 0 to 200 ppm, which is about 10–20 times the range of proton chemical shifts. As a consequence, a peak is usually observed for each carbon or sets of equivalent carbons; whereas, resonances for 1H nuclei often overlap in proton NMR spectra. Carbon chemical shifts, as discussed earlier for 1H chemical shifts, are influenced by electronegative substituents and π-bonds, but also more strongly by the shielding from an abundance of electrons in non-spherical p-orbitals. A large effect from electrons in p-orbitals is the downfield shift of carbon resonances with branching. For example, compare the 13C chemical shifts for the carbons of 2-methylhexane and hexane shown in Figure 18-9. The methyls at the branched end of 2-methylhexane (δ ≈ 22 ppm) appear approximately 8 ppm downfield from the methyl at the unbranched end or both methyls of hexane (δ≈14). Further, the methylene at the 3-position of 2-methylhexane (δ ≈ 39) appears 7 ppm downfield from the methylene at the 3-position of hexane (δ ≈ 32).
Figure 18-9: Comparison of carbon chemical shifts and proton chemical shifts calculated using empirical rules and
ChemDraw software.

Chapter 18: NMR Spectroscopy
173
A number of empirical rules have been developed for predicting chemical shifts. A very rough rule is that 13C chemical shifts are approximately 10 to 20 times the corresponding 1H chemical shifts. For example the protons of the methyl groups of hexane appear at about 1 ppm in the 1H NMR spectrum and the methyl carbons of hexane appear at about 14 ppm in the 13C NMR spectrum. A broader comparison of 13C and 1H chemical shifts appears in Table 18-2. An example of how 1H NMR and 13C NMR spectra appear as printed out is given in Figure 18-10, the spectra of 2-bromobutane.
Figure 18-10: 1H and 13C NMR spectra of 1-bromobutane.
Figure 18-11: Carbon shift values for t-butyl benzene.
Table 18-2: Approximate 13C chemical shifts versus 1H chemical shifts as a function of structure.
Structure
Approximate
d 13C d 1H
alkanes 10–40 1–2
RCH2OR’ 50–70 3–4
RCH2–Cl 40–80 3–4
RCH2–Br 30–40 2.5–4
RCH2–I 5–(–5) 2–4

Chapter 18: NMR Spectroscopy
174
60–80 4–5
R–C≡C–H 65–90 2–3
110–140 5–7
aromatics 125–160 7–8
160–180
190–210
18.3 Absorption of Energy and Fourier Transform NMR
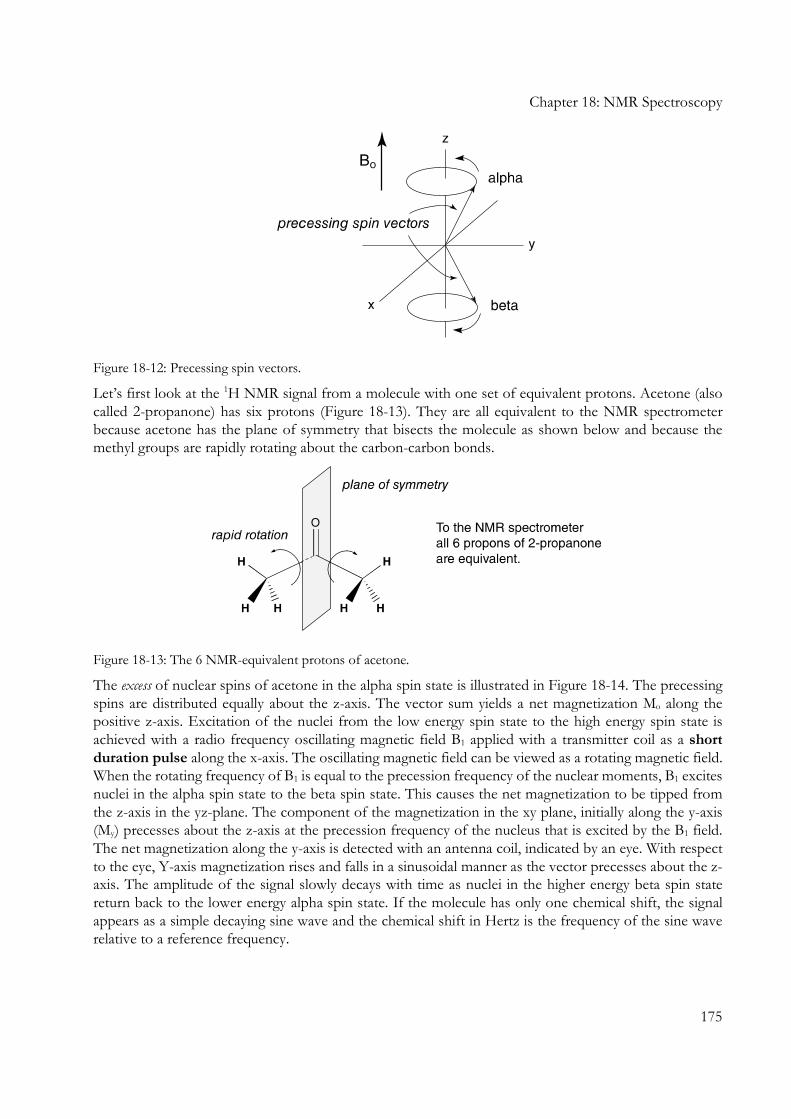
When placed in the presence of an external magnetic field of strength Bo a spinning 1H or 13C nucleus creates a magnetic moment represented by a vector. This is illustrated with an xyz coordinate diagram with the direction of Bo along the z-axis (Figure 18-12). If the nucleus is in the low energy spin state (α), the z-component of the vector is aligned with the direction of Bo and if in the high energy spin state (β), the z-component of the vector is opposed to the direction of Bo. The vectors are tilted from the direction of Bo and precess about Bo with the frequency ν. An explanation for why the spin vectors are tilted from the z-axis uses the Heisenberg Uncertainty Principle but is beyond the scope of this discussion. This precession is analogous to the precession of a spinning gyroscope with respect to the Earth’s gravitational field.
At any instant in time, a compound consisting of many molecules will have many alpha spins represented by precessing spin vectors equally distributed about the +z axis as well as many beta spins represented by precessing spin vectors equally distributed about the -z axis. Because of a slight excess of alpha spins, the net vector points along the +z axis.
Chapter 18: NMR Spectroscopy
175
Figure 18-12: Precessing spin vectors.
Let’s first look at the 1H NMR signal from a molecule with one set of equivalent protons. Acetone (also called 2-propanone) has six protons (Figure 18-13). They are all equivalent to the NMR spectrometer because acetone has the plane of symmetry that bisects the molecule as shown below and because the methyl groups are rapidly rotating about the carbon-carbon bonds.
Figure 18-13: The 6 NMR-equivalent protons of acetone.
The excess of nuclear spins of acetone in the alpha spin state is illustrated in Figure 18-14. The precessing spins are distributed equally about the z-axis. The vector sum yields a net magnetization Mo along the positive z-axis. Excitation of the nuclei from the low energy spin state to the high energy spin state is achieved with a radio frequency oscillating magnetic field B1 applied with a transmitter coil as a short
duration pulse along the x-axis. The oscillating magnetic field can be viewed as a rotating magnetic field. When the rotating frequency of B1 is equal to the precession frequency of the nuclear moments, B1 excites nuclei in the alpha spin state to the beta spin state. This causes the net magnetization to be tipped from the z-axis in the yz-plane. The component of the magnetization in the xy plane, initially along the y-axis (My) precesses about the z-axis at the precession frequency of the nucleus that is excited by the B1 field. The net magnetization along the y-axis is detected with an antenna coil, indicated by an eye. With respect to the eye, Y-axis magnetization rises and falls in a sinusoidal manner as the vector precesses about the z-axis. The amplitude of the signal slowly decays with time as nuclei in the higher energy beta spin state return back to the lower energy alpha spin state. If the molecule has only one chemical shift, the signal appears as a simple decaying sine wave and the chemical shift in Hertz is the frequency of the sine wave relative to a reference frequency.

Chapter 18: NMR Spectroscopy
176
Figure 18-14: Vector diagram illustrating the NMR experiment.
Most molecules have many nuclei with many different chemical shifts and correspondingly many different precession frequencies. The B1 field actually contains a band width of frequencies that excite all the nuclei in a molecule at the same time, and the net magnetization along the y-axis is the sum of the magnetization of each set of equivalent nuclei, all precessing at different frequencies. The resulting complex waveform is called the free induction decay (FID) also known as the time domain spectrum. It is a measure of y-axis magnetization, My as a function of time after the B1 pulse. A Fourier transformation (FT) of the signal yields the individual precession frequencies or chemical shifts, called the frequency domain spectrum or just the NMR spectrum.
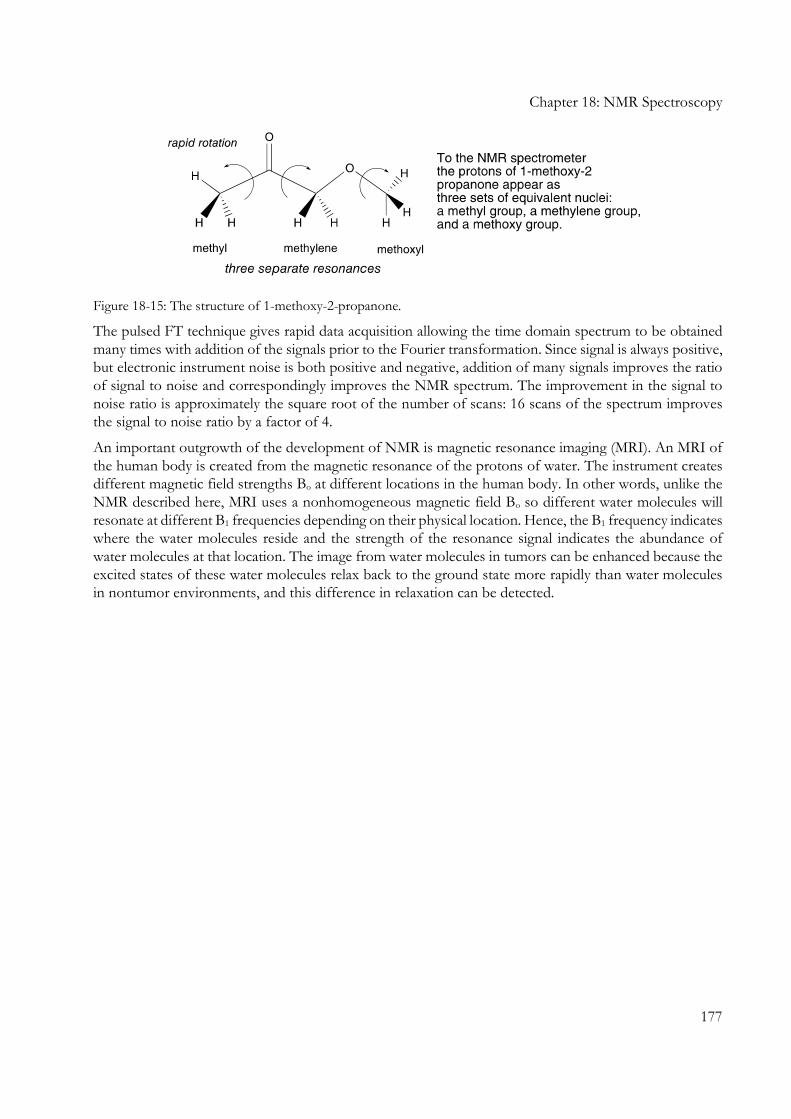
1H time domain and frequency domain spectra of 1-methoxy-2-propanone (Figure 18-15) are shown in Figure 18-16. This molecule has three different sets of equivalent protons, all with different precession frequencies. Hence, the time domain spectrum is the sum of three decaying sine waves of different frequency. Relaxation of excited state spins to ground state spins is partially responsible for the FID shown in Figure 18-16.
Chapter 18: NMR Spectroscopy
177
Figure 18-15: The structure of 1-methoxy-2-propanone.
The pulsed FT technique gives rapid data acquisition allowing the time domain spectrum to be obtained many times with addition of the signals prior to the Fourier transformation. Since signal is always positive, but electronic instrument noise is both positive and negative, addition of many signals improves the ratio of signal to noise and correspondingly improves the NMR spectrum. The improvement in the signal to noise ratio is approximately the square root of the number of scans: 16 scans of the spectrum improves the signal to noise ratio by a factor of 4.
An important outgrowth of the development of NMR is magnetic resonance imaging (MRI). An MRI of the human body is created from the magnetic resonance of the protons of water. The instrument creates different magnetic field strengths Bo at different locations in the human body. In other words, unlike the NMR described here, MRI uses a nonhomogeneous magnetic field Bo so different water molecules will resonate at different B1 frequencies depending on their physical location. Hence, the B1 frequency indicates where the water molecules reside and the strength of the resonance signal indicates the abundance of water molecules at that location. The image from water molecules in tumors can be enhanced because the excited states of these water molecules relax back to the ground state more rapidly than water molecules in nontumor environments, and this difference in relaxation can be detected.

Chapter 18: NMR Spectroscopy
178
Figure 18-16: 1H time and frequency domain spectra of 1-methoxy-2-propanone

Chapter 18: NMR Spectroscopy
179
18.4 Spin-Spin Splitting or J Coupling
A. Coupling in 1H NMR Spectra
We have discussed how the chemical shift of an NMR absorption is affected by the magnetic field Be produced by the circulation of neighboring electrons. Now we wish to examine how the magnetic field produced by neighboring nuclei Bn affects the appearance of the 1H NMR absorption. The effect occurs through the interaction of nuclear spins with bonding electron spins rather than through space. Let’s first consider the absorption of a hydrogen nucleus labeled A with only one neighboring hydrogen nucleus in a vicinal position labeled X. “Vicinal” means that the two protons are attached to carbons that are bonded to each other (Figure 18-17). Let’s also assume that HA and HX have significantly different chemical shifts.
Figure 18-17: Vicinal hydrogens.
HX will have approximately equal probability of existing in either the low energy alpha state or high energy beta state. Again, because of the small energy difference between the low and high energy states, the high energy state is easily populated from thermal energy. For those molecules in which HX exists in the low energy state, about half the molecules in the sample, its magnetic field Bn will subtract from the magnetic field Bo-Be and for those molecules in which HX exists in the higher energy state, again about half the molecules, its magnetic field Bn will add to Bo-Be.
Whether Bn for a particular spin state adds to or subtracts from Bo is a function of the number of intervening bonds; this phenomenon doesn’t usually affect the appearance of the signal and will not be explained here, but results from the mechanism of coupling involving interaction of nuclear spins with electron spins. For the example of vicinal coupling (3 intervening bonds), the Bn field is negative for HX in the alpha spin state; for geminal coupling Bn is positive for HX in the alpha spin state. Geminal coupling occurs between protons of different chemical shift bonded to the same carbon (2 intervening bonds); it will be discussed later.
As a consequence of the Bn field in a vicinal system, at fixed external magnetic field Bo, a lower frequency ν will be required to achieve resonance for those molecules that have HX in the a state than for those molecules that have HX in the b state. The NMR signal for HA will appear as a two line pattern as shown in Figure 18-18. We say the HX splits the absorption HA into a doublet and the two protons are coupled to each other. The intensity of the two lines will be equal since the probability of HX existing in the a or b states is approximately equal. The chemical shift, which is defined as the position of resonance in the absence of coupling, is the center of the doublet. Just as HX splits the signal of HA into a doublet, HA splits the signal of HX into a doublet. The overall splitting pattern consisting of two doublets is call an AX pattern. The splitting of HA by HX is diagrammed in Figure 18-18.

Chapter 18: NMR Spectroscopy
180
Figure 18-18: Splitting of an NMR signal into a doublet as a result of the Bn field produced by a single vicinal
proton.
When the molecule bears two equivalent vicinal protons, four possibilities exist for their combined magnetic fields: both are in a spin states, one is in the a spin state and one in the b spin state, and vice versa, or both in the b spin state. These four possibilities have about equal probability, and the appearance of the NMR signal is a 3-line pattern, a triplet (Figure 18-19), with intensities 1:2:1 because the effect of ab and ba are the same. With one adjacent proton in the a spin state and the other in the b spin state, the effect of the Bn field becomes zero, and the center line of the triplet is the position of the chemical shift. The two HX protons split the HA signal into a triplet and the HA proton splits the two HX protons into a doublet. The overall splitting pattern consisting of a triplet and a doublet is called an AX2 pattern.
Figure 18-19: Splitting of an NMR signal into a triplet as a result of the Bn field produced by two vicinal protons.
Three chemical shift equivalent vicinal protons HX split the absorption of HA into a quartet with intensity pattern 1:3:3:1 as shown in Figure 18-20. The chemical shift is the center of the quartet. The three HX protons split the HA signal into a quartet and the HA proton splits the signal for the three HX protons into a doublet. The overall splitting pattern consisting of a quartet and a doublet is called an AX3 pattern.

Chapter 18: NMR Spectroscopy
181
Figure 18-20: Splitting of an NMR signal into a quartet as a result of the Bn field produced by three vicinal
protons.
The spacing between the lines of a doublet, triplet, or quartet is called the coupling constant. It is given by the symbol J and is measured in units of Hertz (cycles per second). The magnitude of the coupling constant can be calculated by multiplying the separation of the lines in δ units (ppm) by the resonance frequency of the spectrometer in megaHertz.
J Hz = δ ppm x νo MHz (typically 300, 400, or 500 MHz)
In general, N neighboring protons with the same coupling constant J will split the absorbance of a proton or set of equivalent protons into N+1 lines. Note that the splitting pattern observed for a particular proton or set of equivalent protons is not due to anything inherent to that nucleus, but due to the influence of the neighboring protons. The relative intensity ratios are given by Pascal’s triangle as shown in Table 18-3.
Table 18-3: Pascal’s triangle gives relative peak intensities for any splitting pattern where all J values are the same.
no. of
neighbors relative intensities pattern
0 1 singlet (s)
1 1 1 doublet (d) Figure 17.18
2 1 2 1 triplet (t) Figure 17.19
3 1 3 3 1 quartet (q) Figure 17.20
4 1 4 6 4 1 pentet RCH2-CHR’CH2R
5 1 5 10 10 5 1 sextet CH3-CH2-CH2R’ (equal Js)
6 1 6 15 20 15 6 1 septet CH3-CHR-CH3
Because of the mechanism of J coupling, the magnitude is field independent: coupling constants in Hertz will be the same whether the spectrum is measured at 300 MHz or 500 MHz. Coupling constants range in magnitude from 0 to 20 Hz. Observable coupling will generally occur between hydrogen nuclei that are separated by no more than three sigma bonds.

Chapter 18: NMR Spectroscopy
182
H–C–H, two sigma bonds or geminal coupling
H–C–C–H, three sigma bonds or vicinal coupling
Facts about chemical shifts and coupling constants:
• Chemical shifts in δ ppm are independent of the strength of the applied field Bo and correspondingly, the instrument operating frequency νo.
• Chemical shifts in Hz are field and frequency dependent.
• Coupling constants J in Hz are field and frequency independent.
• Coupling constants in ppm are field and frequency dependent.
Coupling is never observed between chemical shift equivalent nuclei, be it from symmetry or by accident, not because the Bn field disappears but because spin transitions that would reveal the coupling are forbidden by symmetry. The role of symmetry in forbidding spectral transitions is of general importance in spectroscopy, but is beyond the scope of this discussion. The magnitude of the coupling constant also provides structural information; for example, trans-alkenes show larger vicinal coupling than cis-alkenes. Sometimes, coupling is not observed between protons on heteroatoms such as the OH proton of an alcohol and adjacent protons on carbon. In this case, the absence of coupling results from rapid exchange of the OH protons via an acid-base mechanism; because of rapid exchange the identity of the spin state, a or b, of the acidic proton is lost. Examples of coupling constants J are shown in Figure 18-21.
Figure 18-21: Examples of proton-proton coupling constants (J) as a function of structure.
The example of geminal coupling of protons on a saturated carbon requires a structure in which the protons have different chemical shifts. This commonly occurs in a chiral molecule with a tetrahedral stereocenter adjacent to the methylene group as shown in the following compounds with stereocenters labeled with an asterisk. The geminal protons are labeled HA and HB rather than HA and HX because they have similar chemical shifts (A and B are close in the alphabet). Coupling between the geminal protons is independent of optical activity and rotation about single bonds. The hydrogens HA and HB are said to be diastereotopic hydrogens (Figure 18-22) because if alternately each one is replaced with a deuterium atom, the resulting two structures are diastereomers (stereoisomers that aren’t mirror images).

Chapter 18: NMR Spectroscopy
183
Figure 18-22: Examples of diastereotopic hydrogens.
Now let’s examine the 1H NMR spectrum of methyl propanoate (Figure 18-23). Notice that hydrogen atoms of the methyl group bonded to oxygen appear as a singlet at δ 3.6 ppm. They are chemical shift equivalent, and hence, do not couple with each other. The chemical shift results from the deshielding effect of the strongly electronegative oxygen atom. The resonance for the methylene protons appear as a quartet at δ 2.3 ppm. The splitting is caused by the three chemical shift equivalent protons on the adjacent methyl group. The methylene protons do not split each other since they are also chemical shift equivalent. The methyl protons appear at δ 1.1 ppm and are split into a triplet by the adjacent methylene protons. The coupling constant for the methyl triplet and the methylene quartet is 7 Hz. The overall splitting pattern consisting of a three-proton triplet and a two-proton quartet is called an A3X2 pattern.
Figure 18-23: 1H NMR spectrum of methyl propanoate.
B. More Complex Splitting Patterns
1H NMR patterns are more complex than predicted by the N+1 coupling rule when coupling of one proton or set of equivalent protons occurs to two different sets of protons with different size coupling constants or when coupling occurs between protons with similar but not identical chemical shifts. The former situation can still be analyzed in terms of overlapping N+1 patterns using stick diagrams. This is shown for the spectrum of phenyloxirane that has three oxirane protons of different chemical shift all coupled to each other (Figure 18-24). The protons are labeled HA, HM, and HX to reflect that they are not

Chapter 18: NMR Spectroscopy
184
close to each other in chemical shift. Each resonance appears as a doublet of doublets, and the overall pattern of three doublets of doublets is called an AMX pattern.
Figure 18-24: 1H NMR spectrum of phenyloxirane showing the AMX pattern of three doublets of doublets.

Chapter 18: NMR Spectroscopy
185
The situation of protons with close chemical shifts coupled to each other is more complex. If only two protons are coupled to each other, the pattern still appears as two doublets but the intensities are no longer 1:1 and the chemical shifts are not the centers of the doublets; the separation between the lines of each doublet is still the coupling constant J. The chemical shifts are closer to the larger peaks of each doublet and can be calculated using a simple equation as shown in Figure 18-25.
Second order intensity perturbation of two doublets results from close chemical shifts of two coupled protons (∆δν0/J<10). The protons are labeled with subscripts A and B rather than A and X to indicate their close chemical shift. The overall pattern, consisting of two doublets with intensity perturbation, is called an AB pattern.
Figure 18-25: Second order intensity perturbation.
If more than two protons of close chemical shift are coupled to each other, more complex patterns, often described as complex multiplets, are observed. Multiplets still provide useful structural information because they indicate the presence of coupled protons of similar chemical shift. The AB pattern and complex multiplet patterns result from what is called second order effects. Second order effects occur when the ratio of the chemical shift separation in Hz to the coupling constant is less than approximately 10 or ∆δν0/J < 10. Even when this ratio is greater than 10, slight intensity perturbation is evident in first order patterns as shown by the spectrum for 2-butanone. In fact, if we draw an arrow over the pattern showing the slight tilt (dotted arrows in Figure 18-26), the arrows point toward each other. So we say the patterns for coupled protons point toward each other.

Chapter 18: NMR Spectroscopy
186
Figure 18-26: 1H NMR spectrum of 2-butanone showing tilted patterns of coupled protons.
18.5 Integration of 1H NMR Spectra
The area under each pattern is obtained from integration of the signal (or better the function that defines the signal) and is proportional to the number of hydrogen nuclei whose resonance is giving rise to the pattern. The integration is sometimes shown as a step function on top of the peak with the height of the step function proportional to the area. The integration of the patterns at δ 1.1, 2.4, and 3.7 ppm for methyl propanoate is approximately 3:2:3 (see Figure 18-23). Note, the error in integration can be as high as 10% and depends upon instrument optimization. The integration of a 1H NMR spectrum gives a measure of the proton count adjusted for the molecular symmetry. Methyl propanoate has no relevant molecular symmetry, and so, the integration gives the actual proton count: 3+2+3=8 protons. In contrast, diethyl ether (Et-OEt) has a plane of symmetry that makes the two ethyl groups equivalent, and so, only two signals are observed, a triplet and a quartet, with integration 3:2.
The areas represented by the integration step function is usually integrated by the instrument and displayed as numerical values under the δ scale. For instance, the normalized integration values for 2-butanone are shown in Figure 18-27. Note that these values are not exact integers and need to be rounded to the nearest integer to obtain the proper value.

Chapter 18: NMR Spectroscopy
187
Figure 18-27: Integrations values for the 1H NMR spectrum of 2-butanone.
18.6 Coupling in 13C NMR Spectra
Because the 13C isotope is present at only 1.1% natural abundance, the probability of finding two adjacent 13C carbons in the same molecule of a compound is very low. As a result spin-spin splitting between adjacent nonequivalent carbons is not observed. However, splitting of the carbon signal by directly bonded protons is observed, and the coupling constants are large, ranging from 125 to 250 Hz. Methyl groups appear as quartets, methylenes as triplets, methines as doublets, and unprotonated carbons as singlets. Commonly, splitting of the signal by protons is eliminated by a decoupling technique that involves simultaneous irradiation of the proton resonances at 300 MHz, while observing the carbon resonances at 75 MHz. The decoupling is accomplished with a second broad band, continuous, oscillating magnetic field B2 (as opposed to the pulsed B1 field), and the decoupling is continued during data collection. The B2 field causes rapid proton spin transitions such that the 13C nuclei lose track of the spin states of the protons. Figure 18-28 shows a proton decoupled 13C spectrum of ethyl acetate. The purpose of proton decoupling is to eliminate overlapping signal patterns and to increase the signal to noise ratio. Decoupling of the protons increases the signal to noise ratio by causing the collapse of quartets, triplets, and doublets to singlets and by causing a favorable increase in the number of carbons in the α-spin state relative to the β-spin state. The latter effect is called the Nuclear Overhauser Effect (NOE); how it causes this change in spin state populations will not be discussed here.

Chapter 18: NMR Spectroscopy
188
Figure 18-28: Proton decoupled 13C spectrum of ethyl acetate in CDCl3.
18.7 Integration of 13C NMR Spectra
In a 1H NMR spectrum, the area under the signals is proportional to the number of hydrogens giving rise to the signal. As a result, the integration of the spectrum is a measure of the proton count. In a 13C NMR spectrum the area under the signal is not simply proportional to the number of carbons giving rise to the signal because the NOE from proton decoupling is not equal for all the carbons. In particular, unprotonated carbons receive very little NOE, and their signals are always weak, only about 10% as strong as signals from protonated carbons.
Because the resolution in 13C NMR is excellent, the number of peaks in the spectrum is a measure of the carbon count adjusted for the symmetry of the molecule. For example, hexane gives three peaks: the two methyls are equivalent as are two sets of methylenes. Several examples are analyzed as follows; the chemical shifts shown are not the observed values but calculated values from empirical rules:
Hexane shows three peaks, two methyls and two sets of methylenes (Figure 18-29). Acetone shows two peaks, one for the methyls and one for the carbonyl carbon (Figure 18-30).
Figure 18-29: The 13C shifts of hexane.
Figure 18-30: The 13C shifts of acetone.
Chapter 18: NMR Spectroscopy
189
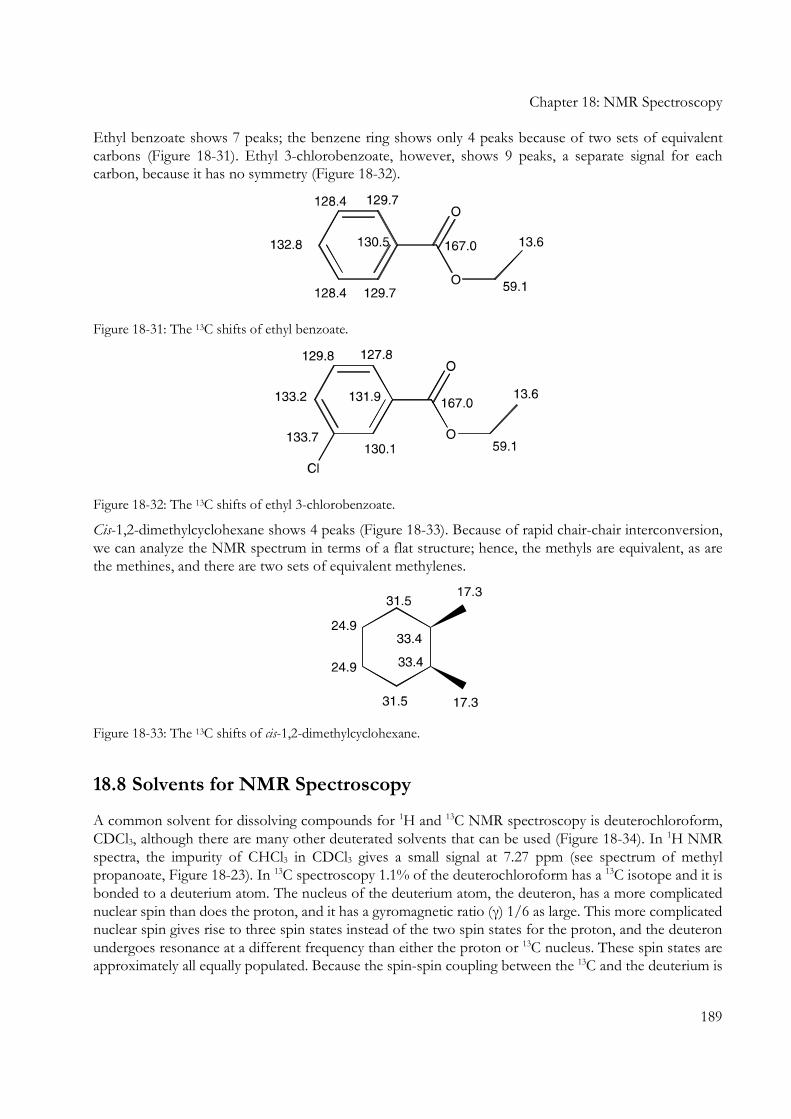
Ethyl benzoate shows 7 peaks; the benzene ring shows only 4 peaks because of two sets of equivalent carbons (Figure 18-31). Ethyl 3-chlorobenzoate, however, shows 9 peaks, a separate signal for each carbon, because it has no symmetry (Figure 18-32).
Figure 18-31: The 13C shifts of ethyl benzoate.
Figure 18-32: The 13C shifts of ethyl 3-chlorobenzoate.
Cis-1,2-dimethylcyclohexane shows 4 peaks (Figure 18-33). Because of rapid chair-chair interconversion, we can analyze the NMR spectrum in terms of a flat structure; hence, the methyls are equivalent, as are the methines, and there are two sets of equivalent methylenes.
Figure 18-33: The 13C shifts of cis-1,2-dimethylcyclohexane.
18.8 Solvents for NMR Spectroscopy
A common solvent for dissolving compounds for 1H and 13C NMR spectroscopy is deuterochloroform, CDCl3, although there are many other deuterated solvents that can be used (Figure 18-34). In 1H NMR spectra, the impurity of CHCl3 in CDCl3 gives a small signal at 7.27 ppm (see spectrum of methyl propanoate, Figure 18-23). In 13C spectroscopy 1.1% of the deuterochloroform has a 13C isotope and it is bonded to a deuterium atom. The nucleus of the deuterium atom, the deuteron, has a more complicated nuclear spin than does the proton, and it has a gyromagnetic ratio (γ) 1/6 as large. This more complicated nuclear spin gives rise to three spin states instead of the two spin states for the proton, and the deuteron undergoes resonance at a different frequency than either the proton or 13C nucleus. These spin states are approximately all equally populated. Because the spin-spin coupling between the 13C and the deuterium is

Chapter 18: NMR Spectroscopy
190
not eliminated during proton decoupling, the CDCl3 shows three equal peaks of low to moderate intensity at about 77 ppm (Figure 18-28). The separation is the carbon-deuterium coupling constant JCD. The intensity is low to moderate because the 13C receives no Nuclear Overhauser Enhancement from the proton decoupling.
Figure 18-34: Common deuterated solvents used for NMR.
18.9 Acknowledgements
Thanks to Professor Rich Shoemaker for reading and editing the chapter, and making helpful suggestions.