chapter 18 call centers in financial services: strategies...
TRANSCRIPT

Chapter 18
Call Centers in Financial Services:
Strategies, Technologies, and Operations
Michael Pinedo Sridhar Seshadri
New York University J. George Shanthikumar
University of California – Berkeley
18.1 Introduction The importance of call centers in the economy has grown dramatically since 1878, when the Bell Telephone Company began using operators to connect calls. The National American Call Center Summit (NACCS) estimates that the percentage of the U.S. working population currently employed in call centers is around 3%. In other words, in the United States, more people work in call centers than in, for example, agriculture. The annual spending on call centers is currently estimated to be somewhere between $120 and $150 billion (Anupindi and Smythe 1997). Operations budgets for all call centers in the U.S. are estimated to grow from $7 billion in 1998 to $18 billion in 2002, i.e., at a projected annual growth rate of 21% (NACCS).

358 CALL CENTERS IN FINANCIAL SERVICES
Call centers play an important role in many industries. Industries that have used call centers extensively in the past include:
i. The telecommunication industry (AT&T, MCI) ii. The airline industry (United, Delta) iii. The retail industry (L.L. Bean, Dell)
The telecommunications industry traditionally has used large call centers to provide a myriad of services to customers, such as information regarding phone numbers and addresses, operator assistance in establishing connections, and resolution of billing problems. The airlines have, through their call centers, taken business away from travel agents; as more and more customers book flights over the phone and obtain tickets either in the mail or electronically. Mail order houses send out catalogues, enabling consumers to shop at home by calling 800 numbers. Reflecting the consumer preference for remote shopping, call centers that support consumer products represent approximately 44% of all the call center operations in the U.S. (NACCS). A call center can serve different purposes for a company, depending on the industry the firm is in and the overall strategy of the firm. It may be used to provide information (e.g., phone numbers and flight schedules), handle orders or reservations (e.g., mail order houses, airlines and car rental companies), or conduct more complex transactions such as providing medical advice or opening accounts (e.g., HMOs and banks). In some industries, call centers have to be tightly tuned into the marketing material that the company sends out; in other industries the call centers need to be more focused on the customer history. Consequently, the intensity of the customer interaction as well as the technological requirements varies from industry to industry. There are several reasons for firms in the financial services industry to invest in call centers. The first one is to lower operating costs. Consolidation of operations and Information Technology (IT) typically decreases labor costs. For example, Ohio Casualty’s short-term goal with its call center strategy was to decrease headcount. The firm replaced 39 regional offices with five call centers and obtained productivity gains of more than 100% over its previous regional office structure. Another reason for investing in call centers is to improve customer service and provide access 24 hours a day, 7 days a week. Sanwa Bank’s call center, for example, was set up to perform loan-related and basic account data retrieval functions. But, as PC banking emerged, and customers began relying on 24-hour banking, the center had to be reconfigured to handle more incoming calls and to provide more extensive data access (Baljko 1998).

CREATING VALUE IN FINANCIAL SERVICES 359
Call centers and Information Technology (IT) investments typically take into consideration the potential for cross selling. Cross selling can be viewed as turning a service request into an opportunity to market additional products (Aksin and Harker, 1996). This improves customer service as well as transforms the call center into a revenue generating segment of the business: “banks created their own call centers primarily as a means to cut costs and route ordinary inquiries away from branches. By rerouting these commonplace calls, bankers theorized, their branches could develop into more sophisticated sales centers. Moreover, souped-up call center intelligence would support both inbound and outbound telemarketing opportunities” (Holliday, 1997). In July 1997, the Fleet Financial Group began using call center software that allows operators to see simultaneously information regarding customers and sales prompts with scripts. “That way, a customer, calling for information on a checking account, can also be told about the latest rate on a certificate of deposit, a low-interest credit card or another product that fits the customer’s lifestyle and investment needs,” (Hamblen, 1997). Schwartz (1998) observes that the Fleet Financial Group increased the number of customers converted to buyers from those calling for information by 30%. Revenue also increased because the new system permitted more effective cross selling of products (i.e., products that are related to those that customers inquire about). The USAA Group has long been admired by the insurance industry, since it consistently exceeds the industry benchmarks for implementations of call center, database and networking technologies fostering exceptional customer service with a full range of insurance, banking and investment products. USAA has implemented a system which, “automatically profiles callers, giving agents (operators) suggested scripts that correspond with products the system believes fit customers’ profiles, such as flood insurance for customers living in high-risk areas,” (Schwartz 1998). A call center also increases the ability of the firm to reach customers outside the firm’s traditional geographical market areas because of the easy access through an 800 number. Finally, a call center allows the firm to package its services and products and then target its customers with these packages. “(T)he customer data can be shared across the combined organization to provide new selling opportunities for both call centers and agents,” (Tauhert, 1998). The efficiency of a call center depends on the methods used to generate and retrieve data as well as the database and interface needs. For example, the following is a call center model developed by Meridien Research (Figure 1). It is a generic model of a financial services firm’s call center, incorporating all the different options that can be considered in the design of such a center. Of course, not all call centers are this complex and some are much simpler than simplification of this model (Meridien Research).

360 CALL CENTERS IN FINANCIAL SERVICES
Figure 1: Generic Model of a Call Center
The operations management decisions in a call center can be categorized as follows: (i) those involving long term strategic planning including the design of the facility, (ii) those related to medium term aggregate planning of services, and (iii) those decisions that are made on a daily or weekly basis. The strategic decisions involve the allocation of resources (e.g., equipment and communication systems) as well as the layout and location of the facilities. Included in this category of decisions are those regarding the routing of the calls, whether the caller should be switched from one customer service representative (CSR) to another or served by a single CSR, whether or not in-bound and out-bound calls are dealt with by the same pool of operators, whether to automate parts of the service, etc. These decisions depend on the anticipated variety and volume of services to be provided over a 2 or 3 year planning horizon. The selection of hardware and software depends on these decisions. Standard models for the design of such facilities are described in Buzacott and Shanthikumar (1993). In describing these decisions we implicitly assume that the strategic objectives of call center management are derived from an overall plan that specifies how different distribution channels are to be used for serving the corporate objectives. For example, the decision whether to sell related products is sometimes considered outside the scope of the call center

CREATING VALUE IN FINANCIAL SERVICES 361
strategic decision making process. Evenson, Harker and Frei (1998) recommend considering an integrative perspective that includes service delivery, IT, process design, and human resource management. The medium term decisions involve the development of a semi-annual or annual manpower plan. The plan will have as inputs the anticipated demand for different skill sets over the planning horizon, the costs of training, and the time to train. Factors such as absenteeism, overtime, personnel turnover and attrition rates can be incorporated in such planning. Forecasts are usually made monthly and queueing models are used to determine the appropriate staffing levels on an aggregate basis. The models have to be sufficiently refined to determine the training requirements for the different skills. (A brief discussion of these models is provided in the section on modeling.) The queueing models used for aggregate planning can feed into the models that are used in the design stage. Short and medium term management issues in a call center include:
i. the forecast of call volume (monthly, weekly, hourly), ii. the determination of appropriate staffing levels (monthly,
weekly), iii. the development of staffing schedules that meet the staffing
needs (by shift), iv. the tracking of the performance of the staff as well as of the
system and of the overall call center (monthly, weekly, hourly).
Managers must first forecast call volume and then determine staffing levels to handle that volume. After they have determined appropriate staffing levels they must determine an efficient workforce schedule. Then they have to track the performance against the plan; this is a feedback loop because this last step is taken after the management has completed the first three steps. According to the TCS Management Group, the first three steps are traditionally determined from historical and current data as well as from the predicted arrival rates of calls and the availability of each operator. Call center managers target an optimal utilization of their facility based on what they found has worked well in the past. The call center utilization is a product of the arrival rate of calls and the expected processing time of a call divided by the total time available. The processing times of the different types of calls have different stochastic properties. More standard calls have a lower variability whereas less standard calls have a higher variability. As call centers become more common, we expect customers to measure the service according to several criteria, such as convenience and reliability, as well as according to the access to other services the firm provides. Additionally, the fourth step serves as an indicator of overall customer service. Staffing levels may be optimal but customers may not be served according to

362 CALL CENTERS IN FINANCIAL SERVICES
their expectations. From this, managers can look into new IT investments to improve the service that the firm provides to its customers.
18.2 Technologies, Personnel Costs and Performance
Measures Nowadays, there are several technological tools that are commonplace in the industry and that make it possible for operators to provide a high level of service. (i) Interactive Voice Response (IVR) is a menu system that a customer accesses when connecting to a call center. The IVR routes a call to the most appropriate person or desk. The structure of the menu system can be a simple list of two or three items, or a more elaborate decision tree. This tool enables the system and the operator to provide the service in minimum time. The technology is relatively inexpensive when compared to the time wasted in the transfers of customers via live operators. Large banks pay between $2.50 and $3.00 per in-branch staffed teller transaction; they spend $1.75 to $2.00 for an operator handled call center transaction and between $0.25 to $0.75 for an IVR transaction (NACCS). However, these costs are relatively low compared to the estimated $17.85 for an e-mail transaction which has an average response time of 16 hours (see Racine 1998). Today almost 90% of all call centers have a web page and e-mail contacts are predicted to grow by more than 250% over the next three years (NACCS). It appears that the Internet and e-mail will play a more and more important role in call centers. However, the costs of handling e-mails should come down. (ii) Automated Call Distribution (ACD) is a service provided by telephone companies that makes physically dispersed operators appear to a caller as residing at one location. The phone company handles the necessary switching in order to make this happen. Some of the benefits are fairly obvious, such as lower network costs (phone bills) since the phone companies connect incoming calls to the regional representative that incurs the lowest long-distance charges. (iii) Computer Telephone Integration (CTI) refers to the combination of computers and telephone systems. Roughly 15% of all call centers today use some form of CTI technology. However, Meridien Research has predicted that by 2002, 30% of all call centers will use CTI technology. Spending on CTI technology in the U.S. is expected to grow from $3.5 billion in 1997 to over $6.1 billion in the year 2000. Anupindi and Smythe describe some interesting applications of CTI technology in use today, such as Intelligent Call Routing, Screen Pops and Whispers. Intelligent Call Routing is an application that reads the phone number of an incoming call, retrieves information concerning the caller from a database, and presents it to the operator when they take the call. Screen Pops

CREATING VALUE IN FINANCIAL SERVICES 363
and Whispers are pieces of information that either pop onto the operator’s computer screen or into his or her headset. They provide information about the customer that the operator has on the line. Predictive dialing is another application that is an efficient way of making an operator’s day more productive, especially when the actual demand is lower than the forecasted level of inbound calls. The computer system keeps track of when an operator is talking to customers and when he or she is not. The computer system also compiles a list of customers that should be contacted (possibly because of recent calls or unresolved problems) and calls them for the operator whenever he or she is not busy. This implies that an operator receives inbound calls and makes outbound calls. Additional training is necessary to manage such a mix of tasks. Ultimately, predictive dialing utilizes operators more efficiently and has a large impact on operator scheduling and customer satisfaction. It has been estimated by some that this sort of outbound calling technique increases operator productivity by 200% to 300% (Anupindi and Smythe, 1997). Conversely, it remains to be seen how effective call centers are in achieving their management’s objectives. “Bank investments in call centers are not paying off as anticipated. Of 122 institutions surveyed, 47% stated that their call centers had helped increase market penetration-but 72% stated that they had expected it to do so. Similarly, Luhby’s 1998 findings indicate 89% said the phone-based services had improved customer satisfaction-short of the 96% that they had thought it would.” Cross selling has not yet proven to be effective. A recent study of financial institutions reveals that, “bankers were intent on making call centers generate profits. But because call center personnel generally were not furnished with information that would let them sell new products effectively, relatively few banks have seen dramatic profit improvements from the phone operations. The sales shortcomings are not limited to the call center; banks also have had trouble creating sales cultures in branches. But, Luhby (1998) stated that, with an increasing number of customers using call centers as their primary point of contact with bank personnel, many view the phone as the most important sales channel of the future.” Holliday’s (1997) survey showed that 64% of the responding banks expected increased sales and cross sales, while only 48% saw an actual increase. Of the responding banks, 71% expected the call center to increase customer retention; however, only 53% said that it actually did. Evenson, Harker and Frei's (1998) study suggests that outbound sales efforts can shift attention from effective sales delivery. Reynolds’ findings indicate that close to 70% of the operating expenses of a call center are personnel related, with the remainder of the expenses spread out

364 CALL CENTERS IN FINANCIAL SERVICES
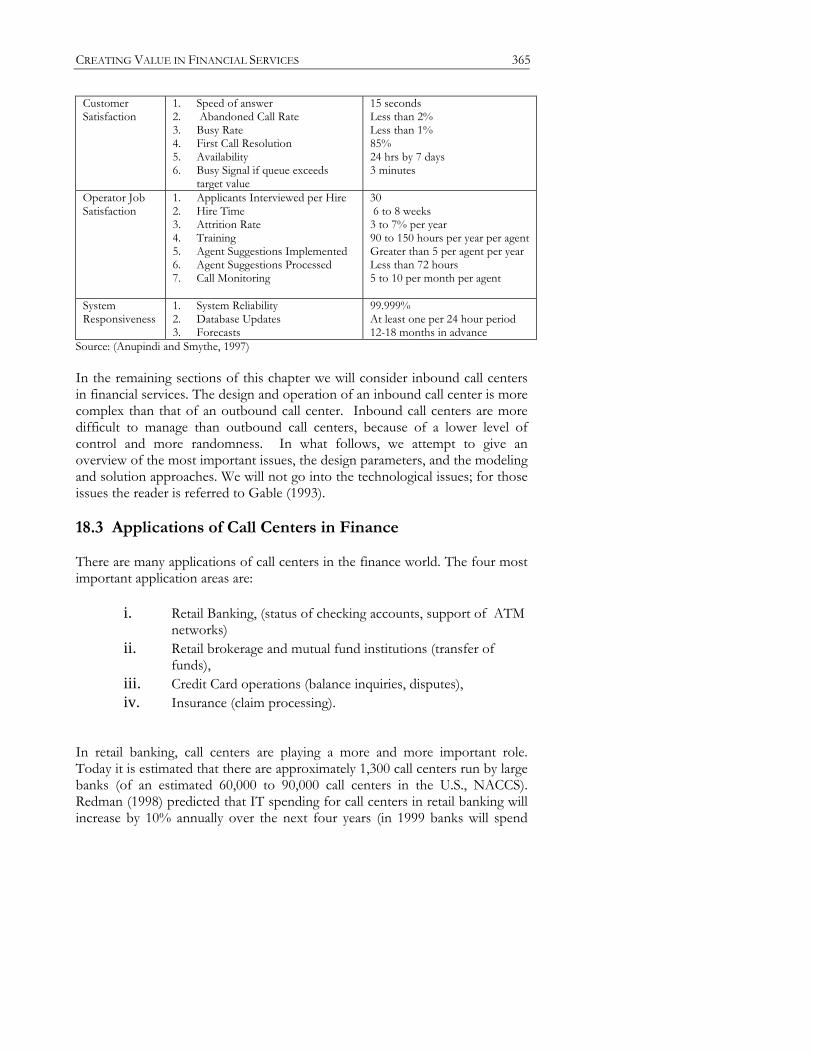
over network, overhead and equipment costs. It seems that call center managers in the future will focus primarily on lowering their personnel related expenses (because that has the biggest impact.) There are several ways in which managers can lower these costs. First they can try to reduce training and other recurring expenses (currently, the average cost of recruiting and training a representative is between $5,000 and $18,000, NACCS). They can do so by lowering their training costs (more web training sessions) or by reducing the need for operators through increased IVR usage. “Using a product called Automatic Coaching and Mentoring from Witness.com (Austin), USAA synchronizes voice and computer screen playback to augment training of representatives and agents” (Schwartz 1998). Other areas for improvement will emerge with the development of virtual intelligence automated speech recognition software. This software can be used via the phone or in response to emails. Recently, Charles Schwab has implemented a voice-automated system that allows customers to buy and sell mutual funds over the phone. Markoff (1998) states that the system recognizes over 1,300 mutual fund names and can also respond to price quote inquiries for more than 13,000 publicly traded stocks. The advance in technology and training methods will also increase the ability of operators to work from home. This will be advantageous for both the operator and the call center because it lowers overhead costs and increases employee satisfaction. Of course, it remains to be seen how effective operators are working from home and how effective training and other guidelines are with little or no supervision. Other means of supervision will have to be developed and, possibly, different methods of remuneration (e.g., by the number of customers handled.) However, the opportunities of call centers to reach a larger employee base because of improved flexibility will undoubtedly increase their efficiencies and performance. Today it is difficult to measure the true performance of a call center because of the difficulty in establishing good measures of performance. The three common metrics of performance are the level of customer service, the operator’s level of job satisfaction and the system’s responsiveness. While these are the common drivers to a successful call center, they are difficult to quantify, measure and track. Consequently, the industry typically adheres to some commonly used indicators as proxies. The following table contains a list of those indicators as well as the common target values set by call centers.
Table 1: Common Indicators Used by Call Centers in the U.S.
Category Indicators Target Value
CREATING VALUE IN FINANCIAL SERVICES 365
Customer Satisfaction
1. Speed of answer 2. Abandoned Call Rate 3. Busy Rate 4. First Call Resolution 5. Availability 6. Busy Signal if queue exceeds
target value
15 seconds Less than 2% Less than 1% 85% 24 hrs by 7 days 3 minutes
Operator Job Satisfaction
1. Applicants Interviewed per Hire 2. Hire Time 3. Attrition Rate 4. Training 5. Agent Suggestions Implemented 6. Agent Suggestions Processed 7. Call Monitoring
30 6 to 8 weeks 3 to 7% per year 90 to 150 hours per year per agent Greater than 5 per agent per year Less than 72 hours 5 to 10 per month per agent
System Responsiveness
1. System Reliability 2. Database Updates 3. Forecasts
99.999% At least one per 24 hour period 12-18 months in advance
Source: (Anupindi and Smythe, 1997)
In the remaining sections of this chapter we will consider inbound call centers in financial services. The design and operation of an inbound call center is more complex than that of an outbound call center. Inbound call centers are more difficult to manage than outbound call centers, because of a lower level of control and more randomness. In what follows, we attempt to give an overview of the most important issues, the design parameters, and the modeling and solution approaches. We will not go into the technological issues; for those issues the reader is referred to Gable (1993). 18.3 Applications of Call Centers in Finance There are many applications of call centers in the finance world. The four most important application areas are:
i. Retail Banking, (status of checking accounts, support of ATM networks)
ii. Retail brokerage and mutual fund institutions (transfer of funds),
iii. Credit Card operations (balance inquiries, disputes), iv. Insurance (claim processing).
In retail banking, call centers are playing a more and more important role. Today it is estimated that there are approximately 1,300 call centers run by large banks (of an estimated 60,000 to 90,000 call centers in the U.S., NACCS). Redman (1998) predicted that IT spending for call centers in retail banking will increase by 10% annually over the next four years (in 1999 banks will spend

366 CALL CENTERS IN FINANCIAL SERVICES
roughly $1.31 billion on call centers), while spending on branch systems and check processing will increase by 2% and –2% respectively (or $1.42 billion and $1.03 billion in 1999 respectively.) Banks are looking at call centers as a way to cut operating expenses while providing better service to their customers. “A 1996 survey by the American Bankers Association and Lombard, IL-based FTR Inc. showed that 68% of U.S. bank survey respondents viewed their call centers as a place to reduce operating expenses and provide a ‘necessary service’ for bank customers. Only 9% said they perceived call centers as profit centers” (Holliday 1997). Banks are forced to use call centers for several other reasons. First of all, if the bank has an ATM network, then typically every machine has a phone attached to it enabling a customer to call in case of a problem. Also, if the customer receives a (monthly) statement and has an inquiry, or if the customer wants to stop payment on a check, he or she has to contact a call center. Mortgage applications processing in retail banking are handled by call centers as well. Anupindi and Smythe (1997) state that approximately 90% of all banks use call centers for sales, delivery and product support. However, it is not yet clear whether PC banking and call centers are substitute channels or complementary channels. Datamonitor has predicted that call centers within securities firms will grow at an annual rate of 12% over the next five years (NACCS). In retail brokerage and mutual fund institutions, a call center may have to handle calls that represent inquiries with regard to the value of the accounts (these calls typically can be handled by an IVR) or transfer funds from one mutual fund to another (which also can be handled by an IVR). However, a call with an order to buy shares of a company is often still handled by a human, since the placement of such an order may involve a certain amount of information, detail and judgment that an IVR may not be able to provide. Call centers for credit card operations handle a variety of standard inquiries involving account balance (issues that can be handled by IVRs), and account maintenance such as an address or phone number change. However, they also have to handle settlements of disputes, which are typically done by operators. The functionality of IVRs is increasing and the number of calls handled by IVRs is also increasing. It is interesting to note, however, that credit card companies are beginning to add account maintenance functionality to their web sites and they are beginning to see an increased usage of their web sites for these functions. It remains to be seen what type of long term effect this will have on the inbound call volume at the call centers. There has been a decrease in maintenance inquiries but an increase in the number of calls requesting help with navigating the web site and resolving problems encountered in using the web site.
CREATING VALUE IN FINANCIAL SERVICES 367
In the insurance world call centers are used for the processing of claims, account maintenance, sales and so on. Travelers Property & Casualty Corporation believes that the overall cost structure of its call centers is lower than the cost structure of its sales force of agents in the field. “‘One of our primary call center objectives is to provide an alternate sales channel at a minimum cost,’ states Dean Collins, director of project management for direct response at Travelers P&C.” Schwartz (1998) estimated that there are approximately 60,000 call center agents in the insurance industry and that that number is expected to grow anywhere from 2% to 4% over the next three years. A number of characteristics distinguish call centers in the finance world from those in other industries (such as airlines). Examples of such differences are:
i. The customer is very often, to a certain degree, captive. ii. There are significant database requirements (data pertinent to the
customer). iii. Security and confidentiality issues. iv. Fast (real time) execution (in contrast with order executions in
mail order houses). v. Less tolerance for errors.
In financial call centers the customer is moderately captive. The cost of switching from one financial institution to another is higher than the cost of using a different retailer or airline. The fact that the customer is somewhat captive allows the institution to let the customer wait slightly longer without running the immediate risk of losing him or her (the waiting time consideration, is of course much more important at a call center of an airline). The performance standards in call centers in the finance world are therefore different from the standards in other industries. The database requirements in financial call centers are more extensive due to the nature of the relationships between the firms and their customers. The operator must have the entire profile of the customer at hand. For example, a customer may have several accounts with an insurance firm. The customer probably expects the operator to be aware of this aspect when answering his or her inquiries. It is not unusual for the profile of a customer to comprise several pages of information, which must be shown to the operator in a user-friendly way. The database requirements in the insurance industry may be different from those in other types of financial institutions; for example, the databases may have image bases containing photos.

368 CALL CENTERS IN FINANCIAL SERVICES
If the customer wishes to make a transaction, (e.g., transferring funds at a retail bank or at a mutual funds institution from one account to another), then certain security requirements have to be met (e.g., in the form of a social security number or PIN number). It may have to be followed up with signed confirmations, etc. There are also regulatory issues that the financial services firms may have to face. A financial services firm may have one call center for all of its operations but it may offer different services and products in different states because of different state laws. A call center operator must know the products that the firm offers in different states and must also be familiar with the laws that are applicable in each state. The probability of an error in a transaction or execution at a call center of a financial institution must be kept at lower levels than in other industries. Such a performance measure is often not an objective that has to be minimized but rather a constraint that may not be violated. 18.4 Design and Modeling We first discuss the modeling assumptions. Any call center is subject to a number of different types (or classes) of calls. Each class has its own interarrival time distribution and processing time distribution and each type may have its own dependency on mailings or other periodic events (monthly statements, billings, advertisements, and so on). For example, at a mutual fund company a large number of calls come in between 3 and 4 p.m., right before the market closes, in order to complete a transaction, and a large number also come in between 4 and 5 p.m. to check the status of an account or outcome of a transaction. Certain classes of calls may be combinations of other classes. A call center may also have different classes of employees with each class having a specific skill set and capable of handling a given set of call types. To prepare an operator to handle a particular call type requires specific training, which has a certain cost associated with it. Each type of operation has a learning curve and operators are subject to a specific turnover rate. The call routing depends on the skill sets of the operators. This call routing is based on matching and assignment algorithms. The cross training of operators implies that one employee can handle requests of different types without having to transfer calls too different desks. But with cross training there are certain costs and trade-offs involved. Cross training allows for a higher utilization of the operators. From a queueing perspective the system behaves better and the delays are shorter. The routing hierarchy of a call center may be based on a tree structure. The customer has to be routed towards a particular leaf of the tree.

CREATING VALUE IN FINANCIAL SERVICES 369
Each level of the tree is associated with a queue and a given pool of operators (with specific training). We make a distinction between two types of analyses of call centers.
• Phase I: The static design phase dealing with medium term aggregate planning.
• Phase II: The dynamic operational phase with short term staffing and control policies.
In Phase I, the number of operators is determined along with the hours of the shifts based on historical data, medium term, and long term forecasts. Other types of work may also be assigned to the operators in order to smooth out the workload. This work may be, for example, administrative tasks related to the calls received. The level of cross training has to be determined. An important part of the call center design focuses on the topology of the tree and the cross training of operators. Phase II constitutes the dynamic operational issues. That is, given the number of operators and shifts, how should the operations be managed on an hour-by-hour and day-to-day basis? For example, what are the rules for the real-time scheduling of coffee breaks and lunch breaks? Task Design Gable (1993) recommends adopting three principles in the design of call centers: isolation, standardization, and simplification. Isolation refers to dedicating resources to the provision of a specific service. For example, requests for account openings have to be handled by a specific pool of operators. Prudential securities follows this design principle in dedicating groups of operators to deal with requests for account information based on the type of account. The rationale is that to answer queries concerning a particular type of account (or product) not only do operators require a special set of skills and training but also the privileges given to the account holder may be different depending on the type of account. While, at the surface, it appears to be easy to train operators to handle different types of products/accounts, there are several problems associated with implementing this concept (Rappaport 1996). Some of these problems include different software and hardware requirements for different products, the time required to train operators, and the cost-benefit trade-off of training and retaining operators. Standardization and simplification of tasks appear to be difficult to achieve in practice. Call center managers have the following goals:

370 CALL CENTERS IN FINANCIAL SERVICES
• the customer should be answered to his/her satisfaction within a
single call without being put on hold during the call or forwarded from one operator to another;
• in answering the customer the operator should not have to waste time searching for data, or verifying the validity or time stamp of the data, or obtaining clearance for providing information to the customer;
• call statistics should be collected and be available for quality assurance and training purposes without having to waste time searching;
• after call data processing, either by the operator or by the group that processes the customer's request, should be zero or minimal (for example, re-entering the customer's address after the call on a box of new checks requested by the customer is a waste);
• key strokes for the processing of any request should be reduced to a minimum;
• procedures for eliciting information (scripts) should be available and easily accessible (on line) while the customer is on-line;
• audio and visual clues should be available to sensitize operators and managers to call congestion, security lapses, and equipment related emergencies;
• the working environment should be comfortable, professional, and lend itself to a flexible assignment of tasks.
Economic Optimization As stated in the introduction, call centers usually consider the percentage of calls answered within a predetermined time interval an important performance measure. Andrews and Parsons (1993) describe an application at L.L. Bean that deviates from this tradition. In their approach, they use a linear combination of (i) the cost of lost orders, (ii) the cost of queueing time, and (iii) the loaded cost of direct labor. In view of their results, (the authors do not make the connection themselves) the gain is provided by exploiting a well-known phenomenon in queueing, namely that when the number of servers increases while the load is kept constant, the service improves. Thus, instead of attempting to maintain the same standards of performance regardless of the load offered, the design can be “improved” by changing the performance levels dependent on the load. It should be clear that an economic justification of such an approach has to be provided by formulating the problem as a multi-objective optimization problem.
18.5 Modeling the static Phase I problem

CREATING VALUE IN FINANCIAL SERVICES 371
The research methodology for a Phase I analysis, i.e., the design and optimization of a call center (see Fig. 2), is based on various different fields of research, namely
• forecasting and data mining, • non-stationary queueing theory, • workforce scheduling.
Figure 2: The Static or Phase I Design Problem
{Historical Data, Projected Mailings}
Forecasting Module
Arrival Rate of CallsPer Time Interval
Queueing and SimulationModule
TargetsValues,Costs
Desired Number ofOperators for each
Given Skill Set
Personnel SchedulingModule
Number of Shifts of Each Type
{
}
{Union Rules,TrainingRequirements}
An enormous amount of data is being gathered at call centers. These data include call frequencies as well as durations of calls. The data tend to be highly non-stationary, since the number of calls fluctuates heavily over the course of a day and over the course of a year. However, in practice only aggregate data tends to be used. The time interval used for data gathering is 15 minutes, with a day consisting of 96 time units. Even though the data allows for segmentation

372 CALL CENTERS IN FINANCIAL SERVICES
of calls, only a very limited analysis of the data has been done. Also, statistics of past years typically are not very indicative of the future. Forecasting methods tend to be more sophisticated than just exponential smoothing methods; they typically include Box and Jenkins (ARIMA) techniques. Forecasts also need confidence intervals. Forecasts may require an enormous amount of data mining. There is also a strong dependency between the frequencies of the calls and the recent mailings or ad campaigns of the company. The forecast of a response to a mailing (either a billing or a catalogue) is hard to measure (unless a significant amount of past data is available). Queueing analysis is often hard to perform due to the very significant non-stationarities in the system. The arrival process of the calls can be modeled as a non-homogeneous Poisson process, which would be a fairly accurate representation of reality. However, a queueing model subject to such an input process is often difficult to analyze. Actually, it is known that the non-homogeneity of the arrival process makes the process perform worse than a process subject to a homogenous Poisson process with the same number of arrivals over the long term, see Chang and Pinedo (1990) and Chang, Chao, Pinedo, and Shanthikumar (1991). One way of getting a feel for the queueing behavior is through simulation. However, because of the non-stationarities and the fact that the system is often congested, even simulation is hard. The short-term workforce scheduling problem is usually tackled using an integer programming approach. Since this problem is NP-Hard, one has to resort to heuristics. These heuristics have to schedule lunch breaks and coffee breaks of various shifts and have to do so while abiding to union and other rules. It is clear that the three sub-problems are intertwined. Forecasting tells us how the intensity of the call arrivals varies over the hours of the day. If the intensity is in an upswing, then this has to be anticipated by the workforce scheduling module. That is, a sufficient number of operators have to be ready just to be able to handle the incoming flux of calls and prevent a queue from building up. Because it takes a relatively long time for operators to wind down a queue, a build-up implies that a large number of customers will have a long waiting time. In what follows, we discuss some of the issues and models in detail. Queueing Analysis An intuitive approach for dealing with the non-stationarity of the arrival process of customers is to segment the day or shift into intervals, and to assume a fixed arrival rate within each time interval. Recently, research has focused on queueing models with non-stationary input processes. In the context of
CREATING VALUE IN FINANCIAL SERVICES 373
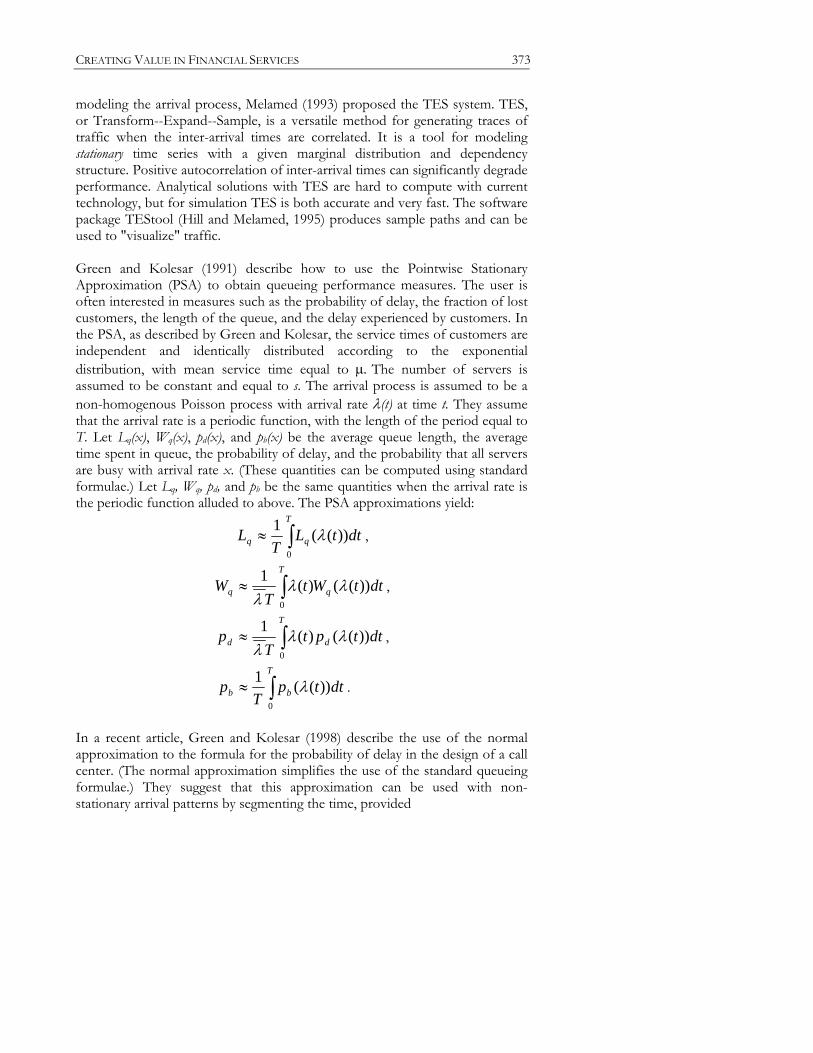
modeling the arrival process, Melamed (1993) proposed the TES system. TES, or Transform--Expand--Sample, is a versatile method for generating traces of traffic when the inter-arrival times are correlated. It is a tool for modeling stationary time series with a given marginal distribution and dependency structure. Positive autocorrelation of inter-arrival times can significantly degrade performance. Analytical solutions with TES are hard to compute with current technology, but for simulation TES is both accurate and very fast. The software package TEStool (Hill and Melamed, 1995) produces sample paths and can be used to "visualize" traffic. Green and Kolesar (1991) describe how to use the Pointwise Stationary Approximation (PSA) to obtain queueing performance measures. The user is often interested in measures such as the probability of delay, the fraction of lost customers, the length of the queue, and the delay experienced by customers. In the PSA, as described by Green and Kolesar, the service times of customers are independent and identically distributed according to the exponential distribution, with mean service time equal to µ. The number of servers is assumed to be constant and equal to s. The arrival process is assumed to be a non-homogenous Poisson process with arrival rate λ(t) at time t. They assume that the arrival rate is a periodic function, with the length of the period equal to T. Let Lq(x), Wq(x), pd(x), and pb(x) be the average queue length, the average time spent in queue, the probability of delay, and the probability that all servers are busy with arrival rate x. (These quantities can be computed using standard formulae.) Let Lq, Wq, pd, and pb be the same quantities when the arrival rate is the periodic function alluded to above. The PSA approximations yield:
∫≈T
qq dttLT
L0
))((1 λ ,
∫≈T
qq dttWtT
W0
))(()(1 λλλ
,
∫≈T
dd dttptT
p0
))(()(1 λλλ
,
∫≈T
bb dttpT
p0
))((1 λ .
In a recent article, Green and Kolesar (1998) describe the use of the normal approximation to the formula for the probability of delay in the design of a call center. (The normal approximation simplifies the use of the standard queueing formulae.) They suggest that this approximation can be used with non-stationary arrival patterns by segmenting the time, provided

374 CALL CENTERS IN FINANCIAL SERVICES
• the service transactions are short relative to the duration of the
busy period, • the arrival rate function does not exhibit spikes, and • the system is not heavily loaded.
Jennings, Mandelbaum, Massey, and Whitt (1996) suggest using instead an infinite server (IS) approximation to determine staffing levels. They consider an operator staffing problem in which
• any number of operators can be assigned as a function of time to projected loads,
• forecasting uncertainty is not a problem, • server assignments can not be changed dynamically in response to
actual loads, and • the number of servers has to be determined as a function of time
to achieve a target value of probability of delay. The IS approximation was motivated by the fact that the PSA performs poorly when the arrival rate fluctuates rapidly. When this happens there is a carry forward of the backlog from periods with heavy loads to periods in which the load is relatively light. The PSA method performs poorly under these circumstances because it cannot anticipate such an eventuality (PSA assumes that time periods are independent and also that the queue assumes to achieve its stationary characteristics within each time period). The IS approximation was proposed to deal with this problem. It is based on the assumption that there are an infinite number of servers. Given this assumption the mean, m(t), and variance, v(t), of the number of busy servers at time t can be determined. It turns out that the mean number of servers can be determined using minimal assumptions about the arrival process (e.g., the arrival process need not be Poisson and the service times need not be exponentially distributed). Good approximations are available for determining the variance of the number of busy servers. Once these two quantities have been obtained, the IS approximation sets the number of servers at time t equal to
⎡ ⎤)()()( tvztmts α+= ,
where α is the desired service level, i.e., the probability of experiencing delay, and zα is the standardized normal deviation that gives this service level. Other approaches are described in Abate and Whitt (1998), Falin (1990), Massey and Whitt (1996), and Massey and Whitt (1997). The work of Kelly

CREATING VALUE IN FINANCIAL SERVICES 375
(1991) and Ross (1995) also relate to the study of loss networks. While they do not deal with non-stationarity, the work of Kelly and Ross can be used as starting points towards extending the single stage models discussed above to networks of servers. Research is also required in a number of areas with regard to the following issues:
• Workforce scheduling. • The revision of staffing plans as a function of updates in forecasts
based on observed call volumes as well as on external events. • The economic optimization of staffing with time varying demand.
Workforce Scheduling Models One can formulate an optimization model to obtain ballpark figures for various important decision variables. The input data for such an optimization problem includes personnel costs, costs of (cross) training, personnel turnover rate and goodwill costs (waiting costs). The decision variables are numbers of employees in the various shifts and levels of cross training. The objectives include operational costs and queueing (goodwill) costs. The operational objectives include the utilization of the personnel as well as the potential cross training costs. The goodwill costs depend on the delays of the customers waiting in queue. Another aspect is the minimization of the percentage of calls that abandon. Trade-offs between cross training, number of operators, and waiting times have to be computed. (If the requests for a specific type of service have a high variability, then cross training as well as combining the particular workload with other work, which can be used as "filler", has advantages). The optimal level of cross training has to be determined. Summarizing, the optimization problem involves the following decision variables:
• The number of operators of each type (in a more elaborate non-linear program the number of operators in each shift).
• The levels of cross training over the different skill sets.
The cost components of the objective include:
• Personnel costs (an increasing function of the number of people hired).
376 CALL CENTERS IN FINANCIAL SERVICES
• Waiting costs (a decreasing function of the number of people hired
and amount of cross training). • Cross training costs (proportional to the level of cross training).
The constraints of the program include:
• The expected waiting time has to be less than a given value. • The percentage of the calls abandoned has to be less than a given
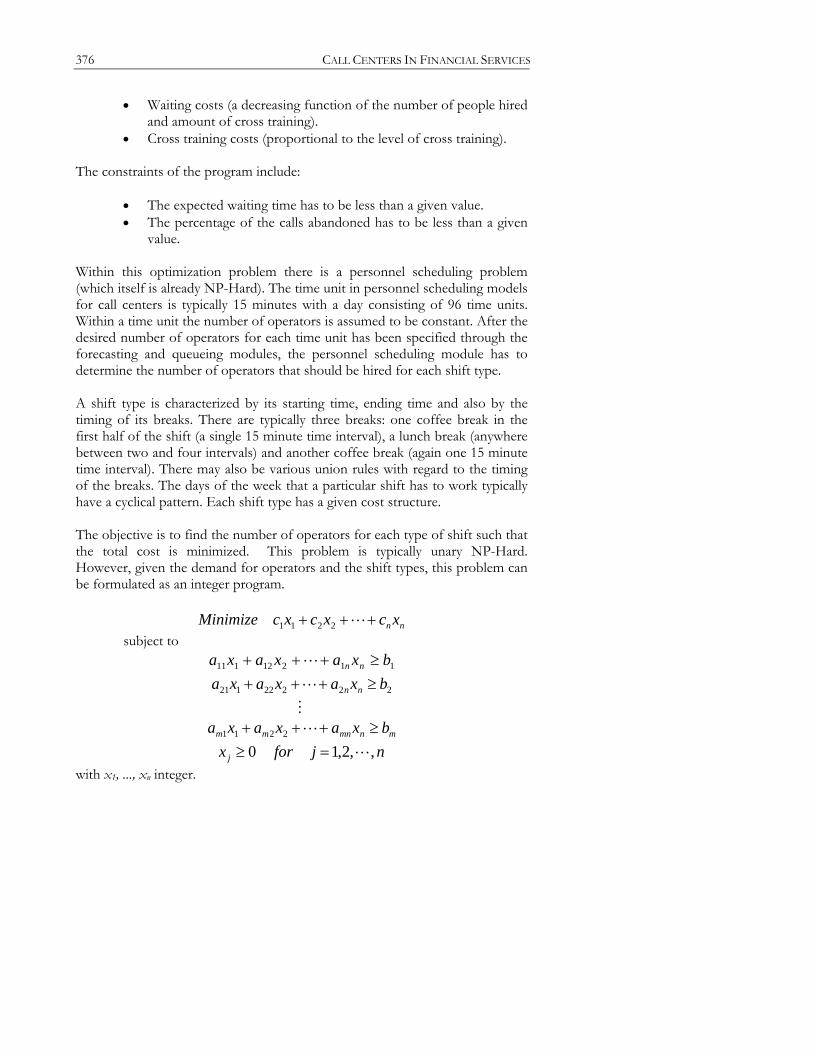
value. Within this optimization problem there is a personnel scheduling problem (which itself is already NP-Hard). The time unit in personnel scheduling models for call centers is typically 15 minutes with a day consisting of 96 time units. Within a time unit the number of operators is assumed to be constant. After the desired number of operators for each time unit has been specified through the forecasting and queueing modules, the personnel scheduling module has to determine the number of operators that should be hired for each shift type. A shift type is characterized by its starting time, ending time and also by the timing of its breaks. There are typically three breaks: one coffee break in the first half of the shift (a single 15 minute time interval), a lunch break (anywhere between two and four intervals) and another coffee break (again one 15 minute time interval). There may also be various union rules with regard to the timing of the breaks. The days of the week that a particular shift has to work typically have a cyclical pattern. Each shift type has a given cost structure. The objective is to find the number of operators for each type of shift such that the total cost is minimized. This problem is typically unary NP-Hard. However, given the demand for operators and the shift types, this problem can be formulated as an integer program.
nnxcxcxcMinimize +++ L2211 subject to
11212111 bxaxaxa nn ≥+++ L
22222121 bxaxaxa nn ≥+++ L
M
mnmnmm bxaxaxa ≥+++ L2211
njforx j ,,2,10 L=≥
with x1, ..., xn integer.

CREATING VALUE IN FINANCIAL SERVICES 377
In matrix form this integer program is written as follows.
xcMinimize subject to
0≥≥
xbxA
The integer decision variable xj represents the number of people hired for a shift of type j. Column j of the A matrix represents a shift of type j. A row in the A matrix represents a specific time interval i. The A matrix is a matrix of zeroes and ones. If an entry aij in the A matrix assumes the value 1 then an operator in shift j has to work during the time interval i. The entry bi in the
column vector b represents the minimum number of operators required during interval i. If a shift would not have any breaks, then the column may consist of some zeroes, followed by a contiguous set of ones, and then followed by another set of zeroes, e.g.,
1 0 0 1 0 1 0 0 1 0 1 0 1 1 0 1 1 1 1 0 1 1 1 1 0 A = 1 1 1 1 0 1 1 1 0 1 1 1 1 0 1 0 1 0 0 1 0 1 0 0 1 0 1 0 0 1
However, breaks in a shift cause the set of ones to be non-contiguous, e.g.,
1 0 0 1 0 1 0 0 1 0 0 0 1 0 0 1 1 1 0 0 1 1 0 1 0 A = 0 0 1 1 0 1 1 1 0 1 1 1 1 0 1 0 0 0 0 0 0 1 0 0 1

378 CALL CENTERS IN FINANCIAL SERVICES
0 1 0 0 1
The flexibility in the break schedules imply that there may be many different columns in the matrix with the same start and end times but with different break periods. The fact that there is some freedom in the timing of the break periods makes the problem very hard. So, even though the problem can be formulated as an integer program, it may in practice not be solvable to optimality. One way of finding a workforce schedule is to solve first the problem without breaks (i.e., ignoring the coffee breaks and the lunch breaks) and then insert the break periods using a heuristic in a way that minimizes the total number of people to be hired. Developing good heuristics for this problem is an important research area, see Pinedo and Chao (1999). Staffing and Training Models The models discussed above can be combined to determine the mix of skills required in a call center. We provide a simple formulation below and discuss later the extensions that are possible. (A similar model can be found in Aksin and Harker (1996a); they model a call center to determine whether cross selling is profitable, and find that the profitability will depend on the call characteristics.) Assume that n products have to be serviced at the call center. A product can be either the sale of a financial product or the servicing of a certain type of account. We assume that K types of customer service representatives (CSR) can be trained. A CSR of type k can service a given set of products, Sk. We assume that the service time for product i is independent of the type of CSR and has mean 1/µi. Service times of type i customers are assumed to be independent and identically distributed. This assumption can be violated in three different ways. First, the CSRs may respond at different rates during busy periods, see, for example, Larson (1987) and Carmon, Shanthikumar, and Carmon (1996). Second, the CSRs may use a different script at different times of the day or at different levels of congestion, see for example the discussion below on dynamic control models. Third, due to shared resources such as computer and communication systems, all customers may experience similar delays when the system is congested (see Aksin and Harker, 1996b). In what follows, we consider the static problem of determining the number of CSRs of each type. That is, the customers are not dynamically routed to the different types of CSRs. The arrival process of type i customers is Poisson with hourly rate equal to λi. The routing is fixed and a certain fraction fik of type i customers are routed to CSRs of type k. (The routing is external and there is no internal routing.) Customers that find all CSRs busy are lost. (Ideally we should include also the possibilities of customers reneging after waiting for some time and possibly retrying after reneging or balking.) The hourly wages of a CSR of type k is wk and the cost associated with the loss of a customer of type i is li. It
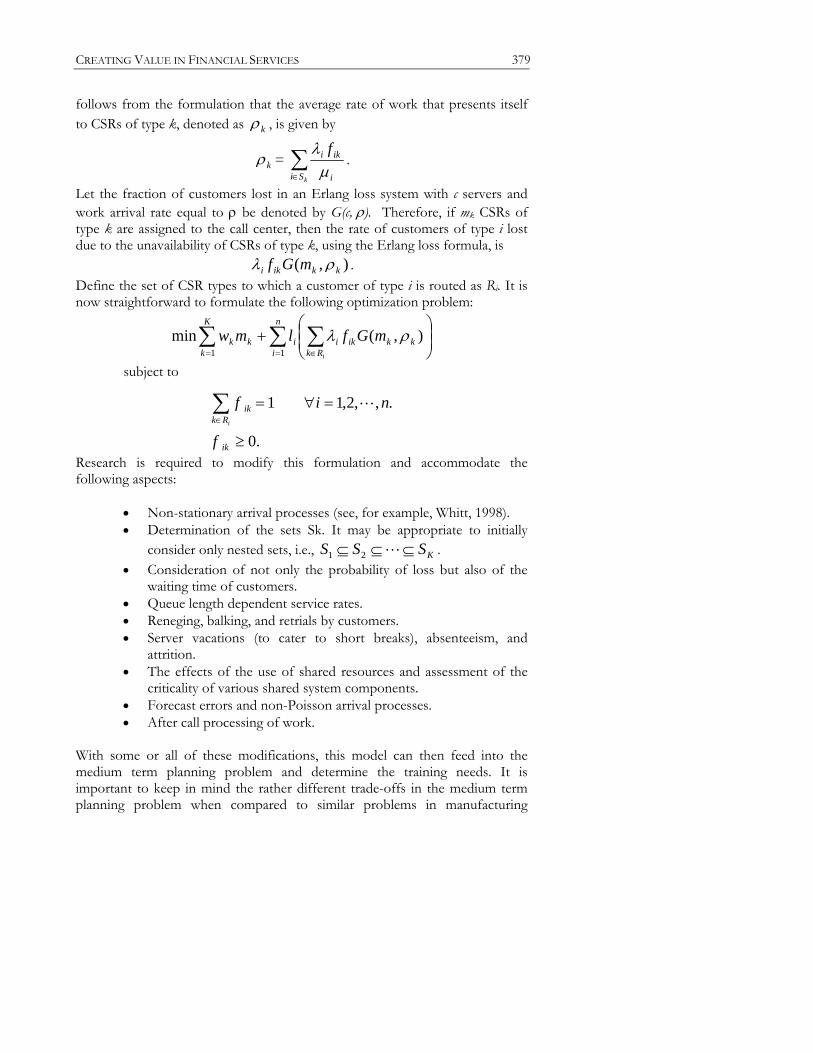
CREATING VALUE IN FINANCIAL SERVICES 379
follows from the formulation that the average rate of work that presents itself to CSRs of type k, denoted as kρ , is given by
kρ = ∑∈ kSi i
iki fµ
λ.
Let the fraction of customers lost in an Erlang loss system with c servers and work arrival rate equal to ρ be denoted by G(c, ρ). Therefore, if mk CSRs of type k are assigned to the call center, then the rate of customers of type i lost due to the unavailability of CSRs of type k, using the Erlang loss formula, is
),( kkiki mGf ρλ . Define the set of CSR types to which a customer of type i is routed as Ri. It is now straightforward to formulate the following optimization problem:
∑ ∑∑= ∈=
⎟⎟⎠
⎞⎜⎜⎝
⎛+
n
i Rkkkikii
K
kkk
i
mGflmw11
),(min ρλ
subject to
∑∈
=∀=iRk
ik nif .,,2,11 L
.0≥ikf Research is required to modify this formulation and accommodate the following aspects:
• Non-stationary arrival processes (see, for example, Whitt, 1998). • Determination of the sets Sk. It may be appropriate to initially
consider only nested sets, i.e., KSSS ⊆⊆⊆ L21 . • Consideration of not only the probability of loss but also of the
waiting time of customers. • Queue length dependent service rates. • Reneging, balking, and retrials by customers. • Server vacations (to cater to short breaks), absenteeism, and
attrition. • The effects of the use of shared resources and assessment of the
criticality of various shared system components. • Forecast errors and non-Poisson arrival processes. • After call processing of work.
With some or all of these modifications, this model can then feed into the medium term planning problem and determine the training needs. It is important to keep in mind the rather different trade-offs in the medium term planning problem when compared to similar problems in manufacturing

380 CALL CENTERS IN FINANCIAL SERVICES
operations (known as aggregate planning problems). In the financial services sector, products and services change rapidly and become obsolete relatively quickly. With greater skills and wider availability of alternative employment, CSRs tend to stay with the same firm only for a relatively short time. Technological advances are rather rapid with the growth of Internet-based services and changes in computing and communication technology. Thus the financial services firms are faced with multiple risks that have to be traded-off against the flexibility of CSR skills. A detailed formulation of the resulting stochastic programming problem is beyond the scope of this survey. However, a simplified formulation is given below. Assume that there is only one type of CSR. The time to train a CSR is exponentially distributed with mean 1/µT. CSRs, once trained, remain with the firm for a random duration. This duration is also assumed to be exponentially distributed with mean equal to 1/µL. There is an unlimited supply of labor. The cost of training is proportional to the time spent and equals cT. The wages of a CSR is cW per unit time. The expected benefit of operating a call center with m trained CSRs is increasing concave in m (a result that can be obtained by analyzing an appropriate queueing model). The decision variable is the number of CSRs to train. It can be shown that under these assumptions it is optimal to have f(m) CSRs in training when there are m trained CSRs in the call center, where f(m) is a decreasing function of m. Extending this model to multiple types of CSRs and incorporating technological change as well as product introductions and changes in products and services offered is a complex problem. 18.6 Modeling the Dynamic Phase II Problem The operations management of call centers can be modeled as a control problem. In the daily operations of a call center there are certain variables that can be controlled, see Figure 3. One of the variables that can be controlled is the long script versus the short script option. For example, a long script may include information about related products that is not contained in a corresponding short script. A second control variable is based on the flexibility in the scheduling of coffee breaks and lunch breaks. A third control variable determines a possible mobilization of supervisory personnel.
Figure 3: The Dynamic or Phase II Design Problem

CREATING VALUE IN FINANCIAL SERVICES 381
Time t Forecasts
Contents of allQueues
Routing
Personnel Management
Assignment ofWorkers to Desks
Routing of Callsto Operators
Schedules ofCoffee, LunchBreaks and Overtime
Data Collection,Quality Control,Feedback
There are two important input parameters in this control process, namely • the current queue lengths, and • the time of day and the day of the week.
The most important input parameter in this control process is the queue length (the number of calls waiting). There may actually be various different queues and the content of each queue is an input parameter. The second input parameter is the time of day; the time of day is important because the rate of change in the intensity of the calls. A forecast of what is to be expected during the next hour may have an important effect on the management of the operators. The actions to be taken based on these input parameters include:
• Operators may postpone any administrative work that has to be done with regard to calls just completed,
• going from a long script to a short script, • the rescheduling of the (coffee and lunch) breaks, and • the mobilization of additional personnel.
From results in the control theory literature we do expect that certain types of threshold rules will be a basis of the decision-making process. That is, if at a certain time of day, the queue length reaches a certain level, then the operators may be required to switch over to the short script. If the queue length reaches a higher level, then coffee breaks may be postponed. If the queue length reaches an even higher level, then additional personnel is mobilized. Any one of these actions involves a switchover cost. These switchover costs are, of course, hard to measure, but estimates do have to be made in order to be able to determine the trade-offs. These thresholds will also depend on the time of day. Threshold values that trigger a certain action will be lower when the intensity of the call arrivals is expected to increase rather than decrease. The research methodology

382 CALL CENTERS IN FINANCIAL SERVICES
for a Phase II analysis may be based on control theory. The outcome of the Phase I analysis is an input into Phase II. To determine appropriate threshold values at which certain actions should be taken, we can use optimal control theory or dynamic programming. There is an extensive body of literature on the control of queues. In a typical framework for controlling queues, the problem is formulated as a Markov Decision Process. Structural results can be obtained that indicate in which regions of the state space (values of the input parameters) the system operates in a particular mode (see Figure 4). Some control modeling issues and models are described below. Figure 4: Dynamic Control of Scripts (Phase II Design Problem)
180
150
120
90
60
30
0 4 8 12 16 20 24
0 4 8 12 16 20 24
Time of Day (Hours)
Time of Day (Hours)
EstimatedWaiting Time(sec)
CallFrequency
Long Script
Short Script
Postpone Coffee Breaks
Mobilize Additional Supervising Personnel
Dynamic Control Models The dynamic control models are more complex than the ones described above. The models can be categorized as follows: models for dynamic routing, models for predicting workloads, and models with time varying service times due to changes in the script.

CREATING VALUE IN FINANCIAL SERVICES 383
Dynamic routing models are used to determine where to route a caller. Such a model becomes advantageous when operators with different skill sets are available to take calls. Xu, Righter, and Shanthikumar (1992) have studied a model that captures this flavor. There are certain drawbacks in adopting dynamic routing. For example, faster operators may end up getting more work and customers may not be able to speak with their preferred CSR. The call routing software is sufficiently sophisticated to track the time spent by each CSR and route calls to level the workload, see Gable (1993). From a system point of level view such a strategy is not optimal, see for example Chen, Rotem, and Seshadri (1995). From an operator’s perspective, phasing the workload depending on previous work history as well as on current physiological and psychological status is better. Evenson, Harker, and Frei (1998) state that the work environment is more critical than the compensation in matters of employee retention. Increasing the average retention period from 12 to 18 months represents a significant benefit. This can be achieved through different methods including charting career paths that show progress beyond the current job. Prediction of workload can be useful in three ways. First, by predicting the overflow of current work into the future, immediate forecasts of operator requirements can be made. Thus some degree of dynamic staffing can be achieved. This aspect is addressed in Whitt (1998a) and Whitt (1999). In call centers, it is current practice to show to all operators in real time the workload in terms of operators that are busy, idle or not available, calls that are in progress as well as the number of customers waiting. Managers and supervisors take corrective action based on these statistics. One other feature that may not be that useful is the practice of tracking the average of statistics and reporting them at periodic intervals. For example, if the call center performance is assessed on the percentage of calls answered within 20 seconds, the performance may drift and then be brought under control by such tracking methods. The customers who rarely if ever view average performance of the call center may not be pleased with a varying degree of responsiveness. Research is required to determine if and whether such methods provide stable service to customers. Second, a prediction of the workload can be given to customers, see Whitt (1999a). The effect of this would be that customers may hang up and try again later. Third, based on observed call volumes, the forecast of call volumes in the immediate future can be improved, allowing the manager to call in reserves or arrange for the overflow volume to go to another center that offers non-critical services.

384 CALL CENTERS IN FINANCIAL SERVICES
Finally, as alluded to above, the service time can be changed depending on the current load or customers can be switched to a more specialized VRU during times of congestion. A 10% reduction in the length of the script can accommodate a 10% increase in the arrival rate of calls. Routing of longer calls (determined by a screening of the callers) to a different pool of operators can also improve service during peak times. Models that capture the effect of dynamically varying service times in response to time varying demand have not been fully developed in the literature (although they have been discussed in some of the papers cited in the section on Non-Stationarity). 18.7 Discussion The call center issues discussed in this chapter are currently still evolving at a very rapid pace. Research and development is being done at a number of levels. In universities and research laboratories work is being done on non-stationary queues, workforce scheduling algorithms, and algorithms that route calls based on skill sets. At the same time software companies are embedding simplified versions of these algorithms into systems that are suitable for implementation. A number of software companies have emerged in the last couple of years doing development work in these areas. Some of the better known companies in this field are IEX, TCS and Siebel systems. These companies have experienced extremely rapid growth over the last few years. Some large financial services companies do all the software development needed for the management of their call centers themselves. An example of such a development is PruServ™, which is a system developed by Prudential Securities for its own use. A description of this system is given in the next chapter of this book. One very important issue that is not clear yet is the following: How will call centers in the future function in conjunction with the Internet? Are these channels of communications between the firms and their customers complementary? How are the financial firms going to integrate these two channels of communication and take advantage of the synergies? Acknowledgments We gratefully acknowledge the research and writing support given by Jimmy Soujin Kow and Matthew Michaels of the Stern School of Business. References

CREATING VALUE IN FINANCIAL SERVICES 385
1. Abate, J. and Whitt, W. (1998). Calculating Transient Characteristics of the
Erlang Loss Model by Numerical Transform Inversion, Commun. Statist. -- Stochastic Models, 14, 3, 663-680.
2. Aksin, O. Z., and Harker, P. T. (1996a). To Sell or Not to Sell: Determining the Tradeoffs between Service and Sales in Retail Banking Phone Centers, Financial Institutions Center working paper 96-02-B, The Wharton School, University of Pennsylvania.
3. Aksin, O. Z., and Harker, P. T. (1996b). Computing Performance Measures in a Multi-Class Multi-Resource Processor-Shared Loss System, Financial Institutions Center working paper 96-02-C, The Wharton School, University of Pennsylvania.
4. Aksin, O. Z. and Harker, P. T. (1997). Computing Performance Measures in a Multi-Channel Multi-resource Processor Shared Loss System, Working Paper, Fishman-Davidson Center, The Wharton School.
5. Andrews, B. and Parsons, H. (1989). L. L. Bean Chooses a Telephone Agent Scheduling System, Interfaces, 19, 6, 1-9.
6. Andrews, B. and Parsons, H. (1993). Establishing Telephone-Agent Staffing Levels through Economic Optimization, Interfaces, 23, 4, 14-20.
7. Andrews, B. and Cunningham, S. (1995). L.L. Bean Improves Call-Center Forecasting, Interfaces, 25, 6, 1-13.
8. Anupindi, R. and Smythe, B. T. (1997). Call Centers and Rapid Technological Change, Working Paper, J.L. Kellogg Graduate School of Management, Northwestern University.
9. Baljko, J. L. (1998). Sanwa Bank California Irons Out Wrinkles in Telephone Service, Bank Systems + Technology, 35, 4, 66.
10. Box, G. and Jenkins, G. (1970). Time Series Analysis: Forecasting and Control, Holden Day, San Francisco.
11. Burgess, W. J., and Busby, R. E. (1992). Personnel Scheduling, In Handbook of Industrial Engineering (G. Salvendy, Ed.), 2155-2169, John Wiley, New York.
12. Buzacott, J. A. and Shanthikumar. J. G. (1993). Stochastic Models of Manufacturing Systems. Prentice Hall, Engelwood Cliffs, NJ.
13. C. S. Chang, Chao, X., Pinedo, M., and Shanthikumar, J. G. (1991). Stochastic Convexity for Multi-Dimensional Processes and its Applications, IEEE Transactions on Automatic Control, Special Issue on Multi-Dimensional Queueing Systems, 1347-1356.
14. Carmon, Z., Shanthikumar, J. G., and Carmon, T. F. (1996). A psychological perspective on service segmentation models: The significance of accounting for consumers' perceptions of waiting and service, Management Science, 41, 11, 1806-1815.
15. Chang, C-S., and Pinedo, M. (1990). Bounds and Inequalities for Single Server Loss Systems, Queueing Systems: Theory and Applications, 425-436.

386 CALL CENTERS IN FINANCIAL SERVICES
16. Chen, L. T., Rotem, D. and Seshadri, S. (1995). Declustering Databases on
Heterogeneous Disk Systems, Proceedings, 21st VLDB Conference, Zurich, Switzerland, 110-121.
17. Crabill, T. B. Gross, D. and Magazine, M. (1977). A Classified Bibliography of Research on Optimal Design and Control of Queues, Operations Research, 25, 2, 219-232.
18. Evenson, A., Harker, P. T., and Frei, F. X. (1998). Effective Call Center Management: Evidence from Financial Services, Financial Institutions Center working paper 98-25-B, The Wharton School, University of Pennsylvania.
19. Falin, G. (1990). A survey of retrial queues, Queueing Systems, 7, 127-167. 20. Frei, F. X. and Harker, P. T. (1996). Process Design and Efficiency:
Evidence from Retail Banking, Working Paper 96-04, Wharton Financial Institutions Center.
21. Gable, R. A. (1993). Inbound Call Centers: Design, Implementation and Management, Artech House, Boston.
22. Green, L. and Kolesar, P. (1991). The Pointwise Stationary Approximation for Queues with Non-stationary Arrivals, Management Science, 37, 1, 84-97.
23. Hamblen, M. (1997), Bank Call Center System Pays Dividends, Computerworld, 31, 45, 55-56.
24. Hassler, K. W., Jones, C. C., Kohler, J. E. and Nalbone, R. D. (1995). Revolutionizing DEFINITY Call Centers in the 1990s, AT&T Technical Journal, July/August.
25. Hill, J. R. and Melamed, B. (1995). TEStool: A Visual Interactive Environment for Modeling Autocorrelated Time Series, Performance Evaluation, 24, 1&2, 3–22.
26. Holliday, K. K. (1997), Talking Heads or Talking Leads? USBanker, 107, 10, 61-64.
27. Jennings, O. B., Mandelbaum, A., Massey, W. A., and Whitt, W. (1996). Server Staffing to Meet Time-Varying Demand, Management Science, 42, 10, 1383-1394.
28. Kelly, F. P. (1991). Loss Networks, Annals of Applied Probability, 1, 319-378. 29. Kolesar, P. and Green, L. (1998). Insights on service system design from a
normal approximation to Erlang's formula, Production and Operations Management, 7, 3, 282-293.
30. Larson, R. C. (1987). Perspectives on Queues - Social Justice and the Psychology of Queuing, Operations Research, 35, 6, 895-905.
31. Lippman, S. A. (1975). Applying a New Device in the Optimization of Exponential Queuing Systems, Operations Research, 23, 4, 687-710.
32. Livny, M., Melamed, B., and Tsiolis, A. K. (1993). The Impact of Autocorrelation on Queuing Systems, Management Science, 39, 3, 322-339.
33. Luhby, T. (1998), Call Centers Failing to Ring the Bell, Survey Finds, American Banker, 163, 1, 11.
CREATING VALUE IN FINANCIAL SERVICES 387
34. Markoff, J. (June 21, 1998), Voice on Phone Is Not Human, But It’s
Helpful, New York Time. 35. Massey, W. A. and Whitt, W. (1996). Stationary-Process Approximations
for the Nonstationary Erlang Loss Model, Operations Research, 44, 6, 976-983.
36. Massey, W. A. and Whitt, W. (1997). Peak Congestion in a multi-server service system with slowly varying arrival rates, Queueing Systems, 25, 157-172.
37. Melamed, B. (1993). An Overview of TES Processes and Modeling Methodology, Performance Evaluation of Computer and Communications Systems, L. Donatiallo and R. Nelson, Eds., Springer-Verlag Lecture Notes in Computer Science, 359-393.
38. Meridien Research, (1999) Strategic Information Technology Investments: Who’s Spending What on IT for Competitive Advantage
39. Nanda, R. and Browne, J. (1992). Introduction to Employee Scheduling, Van Nostrand Reinhold, New York.
40. North American Call Center Summit (NACCS), Call Center Statistics, Call Center Summit on Strategic Outsourcing., http://www.callcenternews.com/resources/statistics.shtml.
41. Pinedo, M. and Chao, X. (1999). Operations Scheduling with Applications in Manufacturing and Services, Irwin/McGraw-Hill, Burr Ridge, IL.
42. Racine, J. (1998), Information Technology: Call Centers to the Rescue: Bridging the Physical, virtual Sales Worlds, American Banker, 1, 2, 9.
43. Rappaport, D. M. (1996). Key Role of Integration in Call Centers Business Comm. Rev., July, 44-48.
44. Redman, R. (Apr 1998), Emerging Technologies to Lure More IT Dollars but Core Channels, Systems Remain the Focus, Bank Systems + Technology, 35, 4, 10-11.
45. Reynolds, P. (May 1994), Real-Time Adherence Monitoring in the Call Center, Voice Processing.
46. Ross, K. W. (1995). Multiservice Loss Models for Broadband Communication Networks, Springer, New York.
47. Schwartz, S. (Jun 1998), Preparing for Massive Growth, Insurance & Technology, 23, 6, 57-58
48. Stidham, S. Jr. (1985). Optimal Control of Admission to a Queueing System, IEEE Trans. AC, 30, 8, 705-713.
49. Tauhert, C. (Sep 1998), Merger of the Century, Insurance & Technology, 23, 9, 49-51.
50. TCS Management Group, Inc., Workforce Management Overview, Brentwood Tennessee.
51. Tien, J. M., and Kamiyama, A. (1982). On Manpower Scheduling Algorithms, SIAM Review, 24, 275-287.
52. Weber, R. R. and Stidham, S. (1987). Optimal Control of Service Rates in Networks of Queues, Adv. Appl. Prob., 19, 202-218.

388 CALL CENTERS IN FINANCIAL SERVICES
53. Whitt, W. (1998). Decomposition Approximations for Time-Dependent
Markovian Queueing Networks, forthcoming, Operations Research Letters. 54. Whitt, W. (1998a). Predicting Queueing Delays, forthcoming, Management
Science. 55. Whitt, W. (1999). Dynamic Staffing in a Telephone Call Center Aiming to
Immediately Answer All Calls, submitted to Operations Research Letters. 56. Whitt, W. (1999). Improving Service by Informing Customers About
Anticipated Delays, Management Science, 45, 1, 1-16. 57. Xu, S. H., Rhighter, R. and Shanthikumar, J. G. (1992). Optimal Dynamic
Assignment of Customers to Heterogeneous Servers in Parallel, Operations Research, 40, 6, 1126-1138.