chapter 17. physiological reactions to climatic … › files › subsurface-book › ... ·...
TRANSCRIPT
Chapter 17 Physiological reactions to Climatic Conditions Malcolm J. McPherson
1
CHAPTER 17. PHYSIOLOGICAL REACTIONS TO CLIMATIC CONDITIONS
17.1 INTRODUCTION ..........................................................................................2 17.2 THERMOREGULATION OF THE HUMAN BODY........................................2 17.3 PHYSIOLOGICAL HEAT TRANSFER ..........................................................4
17.3.1 The metabolic heat balance.............................................................................................. 4 17.3.2 Respiratory heat transfer .................................................................................................. 7 17.3.3 Convective heat transfer .................................................................................................. 8
17.3.3.1 The convective heat transfer equation....................................................................... 8 17.3.3.2 Clothing factors .......................................................................................................... 9 17.3.3.3 Convective heat transfer coefficient, hc...................................................................... 9 17.3.3.4 Mean skin temperature, tsk ....................................................................................... 10
17.3.4 Radiant heat transfer ...................................................................................................... 13 17.3.5 Evaporative heat transfer................................................................................................ 14
17.3.5.1 Evaporation from unclothed and clothed bodies...................................................... 14 17.3.5.2 Skin wetness fraction ............................................................................................... 15
17.3.6 A thermoregulation model............................................................................................... 18 17.4 INDICES OF HEAT STRESS......................................................................22
17.4.1 Purpose and types of heat stress indices. ...................................................................... 22 17.4.2 Single measurements ..................................................................................................... 23 17.4.3 Empirical methods .......................................................................................................... 23
17.4.3.1 Effective temperature, ET ........................................................................................ 23 17.4.3.2 Wet Kata thermometer ............................................................................................. 24 17.4.3.3 Wet bulb globe temperature and wet globe temperature......................................... 25
17.4.4 Rational indices............................................................................................................... 27 17.4.4.1 Air Cooling Power (M scale), ACPM ........................................................................ 27 17.4.4.2 Specific Cooling Power (A scale), ACPA ................................................................. 29
17.4.5 Choice of heat stress index. ........................................................................................... 30 17.5 HEAT ILLNESSES......................................................................................30
17.5.1 Heat fainting.................................................................................................................... 31 17.5.2 Heat exhaustion .............................................................................................................. 31 17.5.3 Heat cramps.................................................................................................................... 31 17.5.4 Heat rash ........................................................................................................................ 31 17.5.5 Heat stroke...................................................................................................................... 32 17.5.6 Precautions against heat illnesses ................................................................................. 32
17.6 COLD ENVIRONMENTS ............................................................................33 17.6.1 Physiological reactions to cold environments................................................................. 33 17.6.2 Protection against cold environments............................................................................. 34 17.6.3 Indices of cold stress ...................................................................................................... 35
17.7 HEAT TOLERANCE AND ACCLIMATIZATION..........................................36 17.7.1 Physiological tests .......................................................................................................... 36
17.7.1.1 Initial screening ........................................................................................................ 36 17.7.1.2 Heat Tolerance Screening ....................................................................................... 37
17.7.2 Acclimatization ................................................................................................................ 38 17.7.2.1 In-situ acclimatization............................................................................................... 38 17.7.2.2 Physiological changes during acclimatization.......................................................... 38
17.8 EFFECT OF MINE CLIMATE ON PRODUCTIVITY....................................39 References ........................................................................................................41 APPENDIX A17.1 ...............................................................................................43
Listing of the thermoregulation model developed in Section 17.3.6 .............................. 43 APPENDIX A17.2 ...............................................................................................46
Acclimatization of workers in South African gold mines prior to 1990. ......................... 46
Chapter 17 Physiological reactions to Climatic Conditions Malcolm J. McPherson
2
17.1 INTRODUCTION In conventional mining operations, the need to control air temperatures and humidities arises primarily because of the relatively narrow range of climatic conditions within which the unprotected human body can operate efficiently. In some areas of underground repositories or where remotely controlled equipment is in use, a different spectrum of atmospheric criteria may be allowed or even required. However, in this chapter, we shall concentrate on the effects of climatic variations on the human body, and alternative means of quantifying the ability of a given environment to maintain an acceptable balance between metabolic heat generation and body cooling. Section 17.3 on Physiological Heat Transfer is fairly comprehensive as this provides the basis of computer models that predict the physiological reactions of the average acclimatized worker in hot environments. Readers are encouraged to consult the chapter contents in order to select the topics of his/her particular interest. 17.2 THERMOREGULATION OF THE HUMAN BODY Within the human body, chemical and biological processes act upon consumed nutrients to produce metabolic energy. A little of this is in the form of mechanical energy expended against external forces. However, the majority of metabolic energy results in the internal generation of heat. If the body is to remain in thermal equilibrium then this metabolic heat must be transferred to the ambient surroundings at a rate equal to that at which it is produced. Section 17.3 analyses and attempts to quantify the various elements of physiological heat exchange, namely, by respiration, convection, radiation and evaporation, whose net sum must equal the rate of metabolic heat generation for thermal equilibrium to exist. First, however, let us discuss in general terms the mechanisms employed by the human body in adjusting to variations in climatic conditions. A conceptual model that is commonly envisioned is one in which the body is made up of a central core of average temperature, tc, surrounded by an outer layer of tissue that has an average temperature tsk. The latter is referred to simply as the mean skin temperature or MST. Contrary to popular belief, the core temperature is not constant but varies normally between 36 and 38°C with respect to both location within the body and muscular activity for a healthy individual experiencing no heat strain., The skin temperature is even more variable depending upon position on the body surface, clothing, temperature and velocity of the ambient air, rate of perspiration and, to a lesser extent, metabolic activity, The average temperature and wettedness of the skin are parameters of major importance in physiological heat exchange. For a resting person located within an environment that gives no sensation of either heat or cold, mean skin temperature approximates to 34°C. This may be termed the neutral skin temperature. When the surrounding environment removes heat from the human body at a rate that is not equal to the metabolic heat generation then one or both of two types of response will occur. A behavioural response consists of conscious steps taken to alleviate the situation. These might consist of shedding or donning clothing, and by decreasing or increasing physical activity. The second type of response comprises the involuntary actions taken by the body to re-establish a stable heat balance with the surroundings. This is known as body thermoregulation. Temperature sensitive receptors exist throughout both the core and skin elements of the body. These react to departures of tc and tsk away from their neutral values. The predominant mode of heat conductance from the core to skin tissues is by the flow of blood. A 'high" signal from the core receptors will produce vasodilation, the relevant blood vessels expand to allow a greater flow of blood and, hence, heat from the core to the skin. Further increases in the “high” signals from

Chapter 17 Physiological reactions to Climatic Conditions Malcolm J. McPherson
3
core receptors will result in perspiration and evaporative cooling, the most powerful mode of surface heat transfer from the body. When the skin temperature exceeds its neutral value of some 34°C the skin receptors react to excite the sweat glands into additional activity. However, some areas are more efficient at producing perspiration than others to the extent that unevaporated run-off may occur in those zones before other areas are fully wetted. There is also considerable variation in sweat rates between individuals. “Low” signals from the skin receptors (cold conditions) cause vasoconstriction. The blood vessels that supply skin tissues contract. The vital organs in the core of the body continue to be supplied by warm blood and are thus protected preferentially while the skin is allowed to cool. This can cause extremities such as fingers, toes or ears to suffer tissue damage by frostbite in very cold conditions. Reduced skin temperature may also produce the involuntary muscular movement of shivering in an attempt to generate additional metabolic heat. In order to follow the thermoregulatory reactions of the human body to hot conditions, let us conduct an imaginary experiment in which a volunteer undertakes physical work at a steady but unhurried rate within an environment that is initially fairly cool, say at 10°C. In this situation, heat loss from the body will occur, mainly, by convection with lesser amounts of cooling by respiration and radiation. The sweat glands are effectively inactive and evaporation of water by direct diffusion through the skin contributes only a little evaporative cooling. The procedure of the experiment is to increase the air temperature in increments, maintaining all other parameters constant, including the rate of work and, hence, metabolic heat generation. The incremental changes in air temperature are made sufficiently slowly to allow the body to maintain itself in or near thermal equilibrium. The purpose of the experiment is to observe the changes that take place in the modes of heat transfer. As the air temperature rises from its initial low value, the skin temperature, tsk, also increases in an attempt to retain the differential between tsk and the temperature of the surrounding environment and, hence, to maintain convective and radiant cooling. However, the influence of respiratory cooling decreases because the heat content of the expired air rises at a lesser rate than that of the inspired air. At some point, as the air temperature continues to climb and depending upon the rate of work, signals from the core receptors cause sweating to commence, resulting in partial wetting of the body surface. This initiates some significant changes in the heat transfer processes. First, throughout the period of increased sweating and until full surface wetness occurs, evaporative cooling moderates the rate at which skin temperature continues to rise with respect to ambient temperature. Also, throughout this stage, the combined effects of convective and radiative cooling are progressively replaced by evaporative heat transfer. When the skin temperature approaches and exceeds some 34°C, the skin receptors react to produce further enhanced sweating. The increased area that is coated in perspiration and the corresponding effectiveness of evaporative cooling both grow rapidly. However, when the skin becomes fully wetted, further cooling can be gained only by additional rises in skin temperature. Hence, the skin temperature resumes a higher rate of increase (see Figure 17.6). If the dry bulb temperature of the surroundings exceeds skin temperature then the convective and radiant heat transfers will reverse. Evaporative cooling must then balance the heat gain from convection and radiation in addition to metabolic heat. When mean skin temperature exceeds about 36°C the subject is likely to begin exhibiting the effects of heat strain (Section 17.5) unless he has been well acclimatized to hot working environments. At mean skin temperatures above 37°C the person is in danger of excessive and, perhaps, even fatal core temperatures. This might be a good time to terminate the experiment.

Chapter 17 Physiological reactions to Climatic Conditions Malcolm J. McPherson
4
17.3 PHYSIOLOGICAL HEAT TRANSFER A great deal of research has been devoted to quantification of the various modes of heat exchange associated with the human body and the corresponding physiological reactions. Such work has involved laboratory and field experiments, analytical studies and numerical simulations. The development of a numerical thermoregulation model utilizes a combination of relationships that approximate the modes of heat transfer between the human body and the surrounding environment. The purpose of such a model is to predict one or more of the parameters that are deemed to represent physiological reaction such as mean skin temperature, core temperature or sweat rate. One such model is described in Section 17.3.6. First, however, we must develop relationships that quantify the individual modes of physiological heat transfer. 17.3.1 The metabolic heat balance In common with many other living organisms, the human body is a biological heat engine of low mechanical efficiency. Fuel is consumed in the form of nutrients and combines with oxygen to produce • metabolic heat • mechanical work and • changes in mass (body growth)
The rate of body growth is negligible compared to other physiological changes and can be ignored for the purposes of this analysis. The mechanical work output, shown as W on Figure 17.1, is seldom more than 20 per cent of the total metabolic energy even for strenuous efforts by trained athletes and is usually very much less than this. It is considered only when the work involves significant lifting or lowering of a mass, including the human body itself. Metabolic energy = metabolic heat + work done against gravity (W) [proportional to oxygen consumption] For example, a person of mass 70 kg walking up an incline of 4 in 100 at a speed of 2 m/s would do work against gravity at a rate of
WsmN
sm
smkg55
1004281.970
2===×××
The metabolic energy produced by the person should be reduced by this amount to give the corresponding metabolic heat generation. However, in walking uphill, the rate of oxygen consumption and, hence, metabolic energy is itself increased. In practice, it is usual to ignore mechanical work in analyses of physiological response to climatic conditions. At equilibrium, the generation of metabolic heat, M, is balanced by heat transfer from the body to the surroundings. However, a fraction of the metabolic heat, Ac, may be accumulated within the body resulting in a transient rise in core temperature, ∆tc, and (usually) also skin temperature. By assuming that 80 per cent of the body mass is at core temperature, tc, and 20 per cent at skin temperature, tsk, the rate of heat accumulation may be approximated as
( )
( )secondstime2.08.0 skcbb ttCm
Ac∆∆ +
= W (17.1)
where mb = mass of body (kg) and Cb = average specific heat of the body ( 3470 J/(kgK) ) (Stewart, 1982)

Chapter 17 Physiological reactions to Climatic Conditions Malcolm J. McPherson
5
For sedentary persons at thermal equilibrium with the surroundings, average oral temperature is approximately 36.9°C. Skin temperature varies over the body surface and with the ambient air temperature but has an average value of 34°C for non-stressed personnel experiencing a sensation of thermal comfort. The effect of heat storage, Ac, is to increase core temperature, tc, and, hence, skin temperature This normally results in enhanced body cooling in order to attain a new equilibrium at which the rate of heat accumulation declines to zero. Figure 17.1 shows that heat loss from the body occurs through a combination of heat transfer processes: • respiratory heat exchange (breathing), Br . • convection, Con . • radiation, Rad, and • evaporation, Evap
Evap
(evaporation
M
Ac
Work W
Rad (radiation)
Con (convection)
Fuel
Br (breathing)
Figure 17.1 The human body is a biological heat engine producing both work and metabolic heat, M: M = Con + Rad + Evap + Br + Ac

Chapter 17 Physiological reactions to Climatic Conditions Malcolm J. McPherson
6
Conductive heat transfer may also take place at any areas of contact with solid surroundings. Here again, this is usually small and is neglected in the following sections. In this analysis we will also ignore any heating or cooling caused by the ingestion of food or drink. We can now state the metabolic heat generation, M, to be M =Br + Rad + Con + Evap + Ac (17.2) At thermal equilibrium, the rate of heat accumulation, Ac, is zero. Then M = Br + Rad + Con + Evap (17.3) This equation is known as the metabolic heat balance. Each of the terms Br, Rad, Con, and Evap may, theoretically, be negative. However, their net sum must be equal to the rate of internal heat generation, M, if equilibrium is to be maintained. In this condition, evaporative and respiratory heat transfer from the body must remain positive while both Rad and Con may be negative. Physiological heat exchange and metabolic heat generation are usually quoted in terms of Watts per square meter of body surface (W/m2) where the skin area, Ask, may be estimated from the DuBois relationship 2725.0425.0 m202.0 bbsk hmA = (17.4) where hb = height of body (m) and mb = body mass (kg) For an average sized man of mass 70 kg and height 1.73 m, Ask = 1.83 m2. Metabolic heat generation depends primarily upon muscular activity but also varies with respect to the condition of individual health, physical fitness and emotional state. Table 17.1 gives average metabolic rates for a series of activities both in terms of total energy production (W) and normalized (W/ m2) on the basis of Ask = 1.83 m2. From this point on we shall refer to the modes of heat transfer in terms of W/m2.
Table 17.1 Metabolic rates for various activities
Activity Metabolic heat production
W W/m2 (M) Sleeping 73 40 Seated 107 58.5* Standing but relaxed 128 70 Walking on the level at:
1m/s 238 130 1.4 m/s 320 175 1.8 m/s 403 220
Manual work:
very light 174 95 light 265 145 moderate 448 245 heavy 622 340
* 1 met = 58.5 W/m2 and is sometimes used as a unit of metabolic rate

Chapter 17 Physiological reactions to Climatic Conditions Malcolm J. McPherson
7
17.3.2 Respiratory heat transfer The large internal area and wetness of human lungs give a good efficiency of heat exchange. The actual degree of respiratory cooling depends upon the rate of breathing and the wet bulb temperature of the ambient air.
( ) 2W/mBr
sk
inoutresp
ASSm −
= (17.5)
where mresp = mass rate of breathing (kg air/s) Sout = sigma heat of exhaled air (J/kg) Sin = sigma heat of inhaled (ambient) air (J/kg) Experimental evidence (Fanger, 1970) has indicated that the rate of respiration, mresp is proportional to the total metabolic energy production kg/s107.1energymetabolic107.1 66
skresp AMm ×××=××= −− (17.6) Hence, equation (17.5) becomes ( ) 26 W/m107.1Br inout SSM −×= − (17.7) where the metabolic rate, M (W/m2) may be estimated from Table 17.1. The sigma heat terms Sout and Sin are calculated from the equations given in Section 14.6 at the corresponding wet bulb temperatures for exhaled air, tex, and ambient inhaled air, tw, respectively. The latter can be measured directly. The wet bulb temperature of the near-saturated exhaled air depends upon body temperature and the psychrometric condition of the ambient air. Again, empirical data (Fanger, 1970) have produced the relationship tex = 32.6 + 0.066 td + 0.0002 e °C (17.8) where td = ambient dry bulb temperature (°C) and e = actual vapour pressure of the ambient air (Pa) Example Estimate the rate of respiratory cooling for a man of average size (Ask = 1.83 m2) walking at 1.8 m/s in an atmosphere of wet bulb temperature, tw = 18°C, dry bulb temperature, td = 25°C and barometric pressure, P = 110 kPa. Solution From Table 17.1 the metabolic rate, M, is selected as 220 W/m2. Applying the given climatic conditions to the psychrometric equations of Section 14.6 leads to: Sigma heat, Sin = 47 334 J/kg and actual vapour pressure, e = 1566 Pa. Then, temperature of exhaled air (equation (17.8)) tex = 32.6 + (0.066 x 25) + (0.0002 x 1566) = 34.563°C Applying this temperature of saturated air to the same equations of Section 14.6 gives the sigma heat of the expired air to be Sout = 113 756 J/kg
Chapter 17 Physiological reactions to Climatic Conditions Malcolm J. McPherson
8
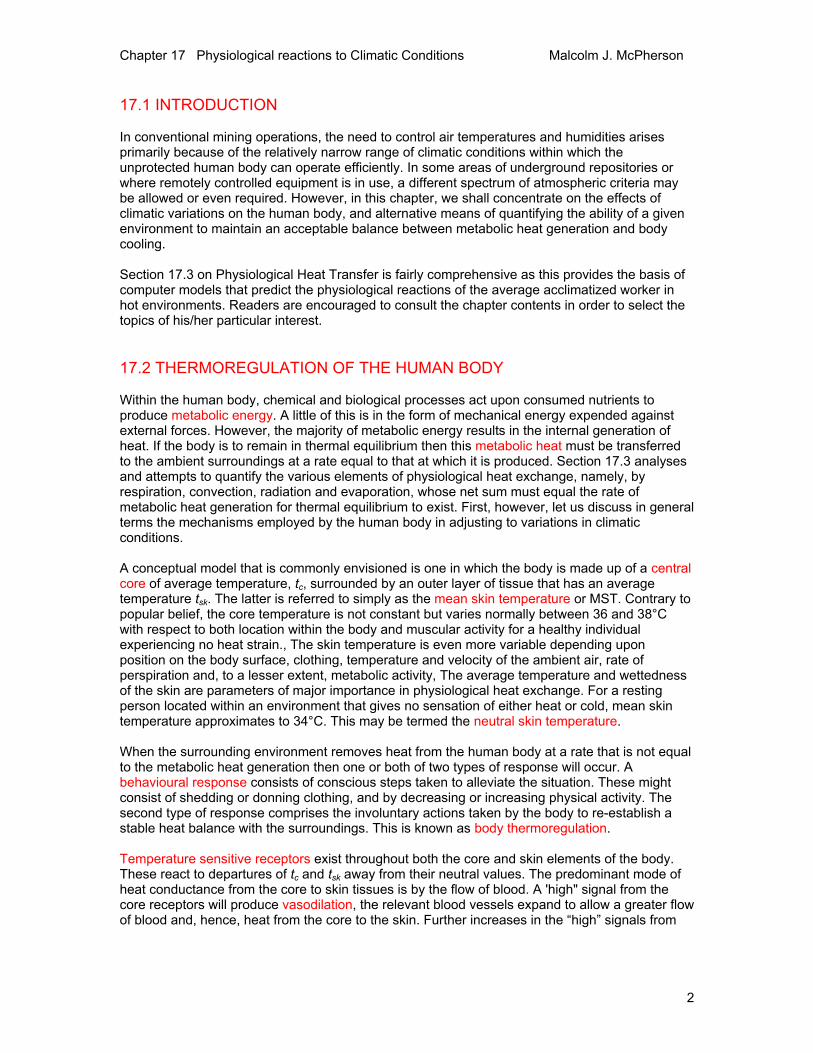
Equation (17.7) then gives the heat removed by respiration as Br = 1.7 x 10-6 x 220 (113 756 - 47 334) = 24.8 W/m2
This represents some 11 per cent of the metabolic rate of 220 W/m2. We shall continue with this example later as we introduce the other modes of heat transfer. The influence of respiratory cooling decreases as the ambient wet bulb temperature rises towards that of the expired air. At ambient wet bulb temperatures in excess of tex, condensation will occur within the lungs and respiratory tracts, accompanied by a rapid onset of heat strain. 17.3.3 Convective heat transfer 17.3.3.1 The convective heat transfer equation The convective, radiative and evaporative modes of heat transfer from the human body are all affected by the degree of covering and the thermal properties of clothing. In the case of an unclothed body, the convective heat transfer is given by equation (15.16) ( ) 2W/mCon dskc tth −= (17.8) where hc = convective heat transfer coefficient (W/(m2 °C)) and tsk = skin temperature (°C) To take the effect of clothing into account, let us consider the heat transfer in two parts: (i) from the skin at temperature tsk to the outside of the clothing at temperature tcl, and (ii) from the clothing to the surrounding air of dry bulb temperature td. For each square metre of skin surface, we can write Con = hcl (tsk - tcl) W/m2 (17.9) where hcl = effective heat transfer coefficient through the clothing (W/(m2 °C)) and Con = hc fcl (tcl - td) W/m2 (17.10) hc remains the surface convective heat transfer coefficient from the (now clothed) body to the surroundings (W/(m2 °C)) while
bodyunclothedofareasurface
bodyclothedofareasurface=clf (17.10A)
The latter factor accounts for the increase in overall surface area caused by clothing. At equilibrium, equations (17.9) and (17.10) represent the same value of Con. As tcl is particularly difficult to establish independently, we can eliminate it by re-writing equation (17.9) as
cl
skcl htt Con
−= °C (17.11)
Chapter 17 Physiological reactions to Climatic Conditions Malcolm J. McPherson
9
For practical application, 1/hcl may be expressed as
C/Wm/1 2oclcl hR = (17.12)
and is known as the thermal resistance of the clothing. Substituting for tcl in equation (17.10) and re-arranging gives
( )
( )2W/m
/1Con
cclcl
dsk
hfRtt
+−
= (17.13)
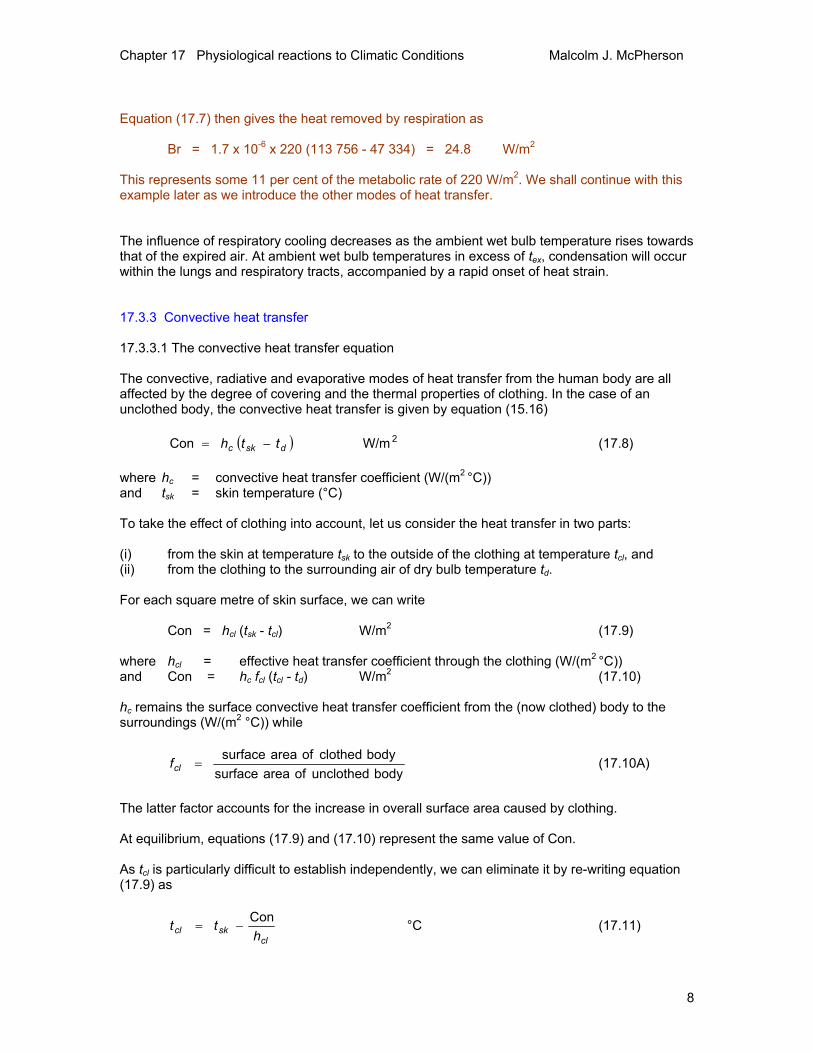
Note that for an unclothed body, Rcl = 0 and fcl = 1. The relationship then simplifies to equation (17.8). The only variable in equation (17.13) that is amenable to direct measurement is the ambient dry bulb temperature. The remaining parameters may be estimated from the following empirical data and relationships. 17.3.3.2 Clothing factors The effective thermal resistances, Rcl, of clothing ensembles commonly worn in underground workings are given in Table 17.2 together with typical corresponding area factors, fcl. This table has been derived from data reported in the ASHRAE Fundamentals Handbook (1985).
Ensemble* Thermal resistance+ Rcl
°C m2/W
Area factor fcl
hcl = 1/Rcl W/(m2°C)
Unclothed 0 1.00 infinite Walking shorts 0.051 1.05 19.6 Shorts & short sleeved shirt 0.076 1.11 13.2 Thin trousers & short sleeved shirt 0.085 1.14 11.8 Thick trousers & long sleeved shirt 0.110 1.28 9.1 Long sleeved coveralls & long sleeved shirt 0.143 1.28 7.0 *All ensembles include hardhat, boots and stockings +Thermal resistance of clothing is sometimes stated in units of clo, where 1 clo = 0.155 °C m2/W
Table 17.2 Clothing factors for ensembles commonly worn in mining.
The insulation provided by clothing is primarily due to the small pockets of air trapped within it. If the clothing is fully wetted then heat transfer through it may be estimated as for conduction through still water in a porous medium. The heat transfer coefficient may then be the order of some 50 W/(m2 °C) and Rcl of 0.02 (m2°C)/W. 17.3.3.3 Convective heat transfer coefficient, hc A number of authorities have reported experimental data and proposed empirical relationships for the convective heat transfer coefficient applicable to the human body (Stewart, 1982; ASHRAE, 1989). This parameter depends upon the psychrometric condition of the air, the localized (microclimate) relative velocity, and the size and shape of the body. A simplified relationship that gives acceptable agreement with experimental data for the velocity range 0.2 to 5 m/s is

Chapter 17 Physiological reactions to Climatic Conditions Malcolm J. McPherson
10
C)W/(m00878.0 25.06.0 ouPhc = (17.14)
where P = barometric pressure (Pa) and u = local (effective) relative velocity (m/s) The local (effective) relative velocity is not the same as the difference between the velocities of the body and the general airstream. Migration of heat and water vapour creates an envelope around the body within which the velocity and psychrometric properties of the air differ from those in the general airstream. This envelope is known as the body microclimate. The velocity within the microclimate is affected by the corresponding temperature gradient and body movements as well as the mainstream air velocity. However, a practical approximation may be obtained for the range 0 to 3 m/s as u = 0.8 ur + 0.6 m/s (17.15) where ur = relative velocity between the main airstream and the general motion of the body. For values of ur in excess of 3 m/s, the correction becomes negligible and we may then accept that u = ur. 17.3.3.4 Mean skin temperature, tsk The only parameter in equation (17.13) that remains to be investigated is the mean skin temperature. This is a factor of prime importance, controlling convective, radiant and evaporative modes of heat transfer. While neutral skin temperature is of the order of 34°C (Section 17.2) it may rise to 36°C in hot conditions without the subject necessarily suffering from heat strain. Well acclimatized individuals may be able to tolerate skin temperatures of up to 37°C without harm. However, the probability of progressive symptoms of heat strain increases rapidly after skin temperatures have reached 36°C. Skin temperatures of more than 37°C are likely to be indicative of dangerously high core temperatures. A close correlation has been observed between mean skin temperature and heat strain. Hence, mean skin temperature is one of the physiological response parameters that may be used as an indicator of heat strain. Skin temperature may vary considerably over the surface of the body depending upon the temperature and velocity of the ambient airstream, orientation of the body, the degree of covering and thermal resistance of clothing, and wetness of the skin. Figure 17.2 shows an experimental curve obtained by Gagge et al (1969) for unclothed subjects within an airflow of 40 per cent relative humidity and low velocity. Fanger (1970) and other authorities have reported some indication that skin temperature reduces as metabolic rate increases. However, those experiments were related to the measurement of thermal "comfort" in surface buildings rather than for hot industrial conditions. The relationship obtained by regression analysis on the curve shown on Figure 17.2 is tsk = 24.85 + 0.322 td - 0.00165 td2 °C (17.16) where td = dry bulb temperature of the ambient air (°C). The value given by this curve or equation has been known as a Base Skin Temperature1.
1 Base skin temperature is included here as background interest. It is not, however, a required parameter in the development of a human thermoregulation model (Section 17.3.6).

Chapter 17 Physiological reactions to Climatic Conditions Malcolm J. McPherson
11
The reducing slope of this curve as td and tsk increase indicates the moderating effect of evaporative cooling. The average skin temperature obtained from equation (17.16) should be corrected for air velocity and the effects of clothing. As the velocity increases the base skin temperature will, in general, fall provided that the air temperature is less than that of the skin. The effect is mitigated by the presence of clothing. It is assumed here that heavy clothing having a thermal resistance, Rcl, of 0.15 (°C m2/W) will provide full protection against the effect of air velocity on skin temperature. The correction to be applied to the “low velocity" skin temperature, tsk, of equation (17.16) is
( ) ( )15.0
15.0009.0,
cldskcvelsk
Rttht
−−−=∆ °C (17.17)
The heat transfer coefficient, hc, is calculated as a function of air velocity from equation (17.14). The constant 0.009 has been determined by curve fitting to results reported for unclothed and fully wetted personnel (Stewart, 1982). The base skin temperature should be increased beyond the values given on Figure 17.2 because of the insulation provided by clothing. Gagge (1969) estimated that the skin temperature for fully clothed bodies was approximately 1°C higher than for unclothed subjects. In order to take account of the degree of thermal insulation, the clothing correction to base skin temperature may be approximated as
15.0,cl
clskR
t +=∆ °C (17.18)
Figure 17.2 Mean skin temperature for unclothed subjects as a function of dry bulb temperature in air of low velocity and relative humidity of 40 per cent (after Gagge, 1969). tsk = 24.85 + 0.322 td – 0.00165 td2
20
22
24
26
28
30
32
34
36
38
40
0 5 10 15 20 25 30 35 40 45 50Dry bulb temperature deg C
Bas
e sk
in te
mpe
ratu
re
deg
C
Chapter 17 Physiological reactions to Climatic Conditions Malcolm J. McPherson
12
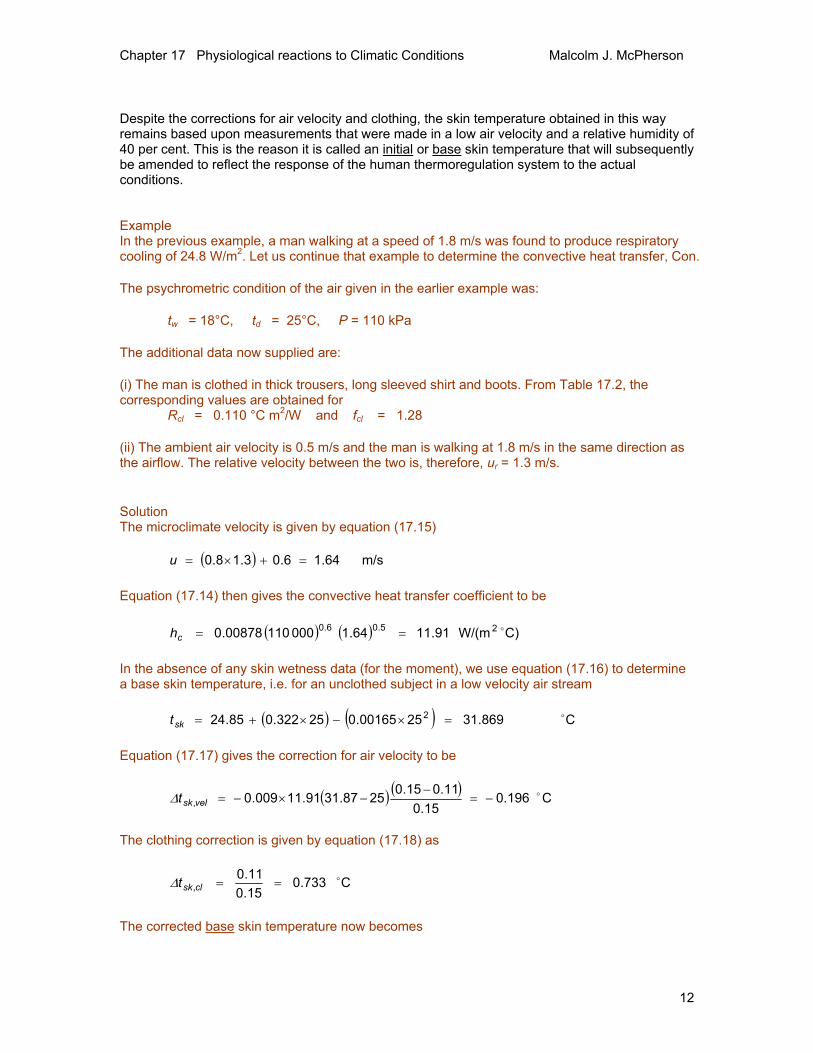
Despite the corrections for air velocity and clothing, the skin temperature obtained in this way remains based upon measurements that were made in a low air velocity and a relative humidity of 40 per cent. This is the reason it is called an initial or base skin temperature that will subsequently be amended to reflect the response of the human thermoregulation system to the actual conditions. Example In the previous example, a man walking at a speed of 1.8 m/s was found to produce respiratory cooling of 24.8 W/m2. Let us continue that example to determine the convective heat transfer, Con. The psychrometric condition of the air given in the earlier example was: tw = 18°C, td = 25°C, P = 110 kPa The additional data now supplied are: (i) The man is clothed in thick trousers, long sleeved shirt and boots. From Table 17.2, the corresponding values are obtained for Rcl = 0.110 °C m2/W and fcl = 1.28 (ii) The ambient air velocity is 0.5 m/s and the man is walking at 1.8 m/s in the same direction as the airflow. The relative velocity between the two is, therefore, ur = 1.3 m/s. Solution The microclimate velocity is given by equation (17.15) ( ) m/s64.16.03.18.0 =+×=u Equation (17.14) then gives the convective heat transfer coefficient to be ( ) ( ) C)W/(m91.1164.100011000878.0 25.06.0 o==ch In the absence of any skin wetness data (for the moment), we use equation (17.16) to determine a base skin temperature, i.e. for an unclothed subject in a low velocity air stream ( ) ( ) C869.312500165.025322.085.24 2 o=×−×+=skt Equation (17.17) gives the correction for air velocity to be
( ) ( ) C196.015.0
11.015.02587.3191.11009.0,o−=
−−×−=velskt∆
The clothing correction is given by equation (17.18) as
C733.015.011.0
,o==clskt∆
The corrected base skin temperature now becomes
Chapter 17 Physiological reactions to Climatic Conditions Malcolm J. McPherson
13
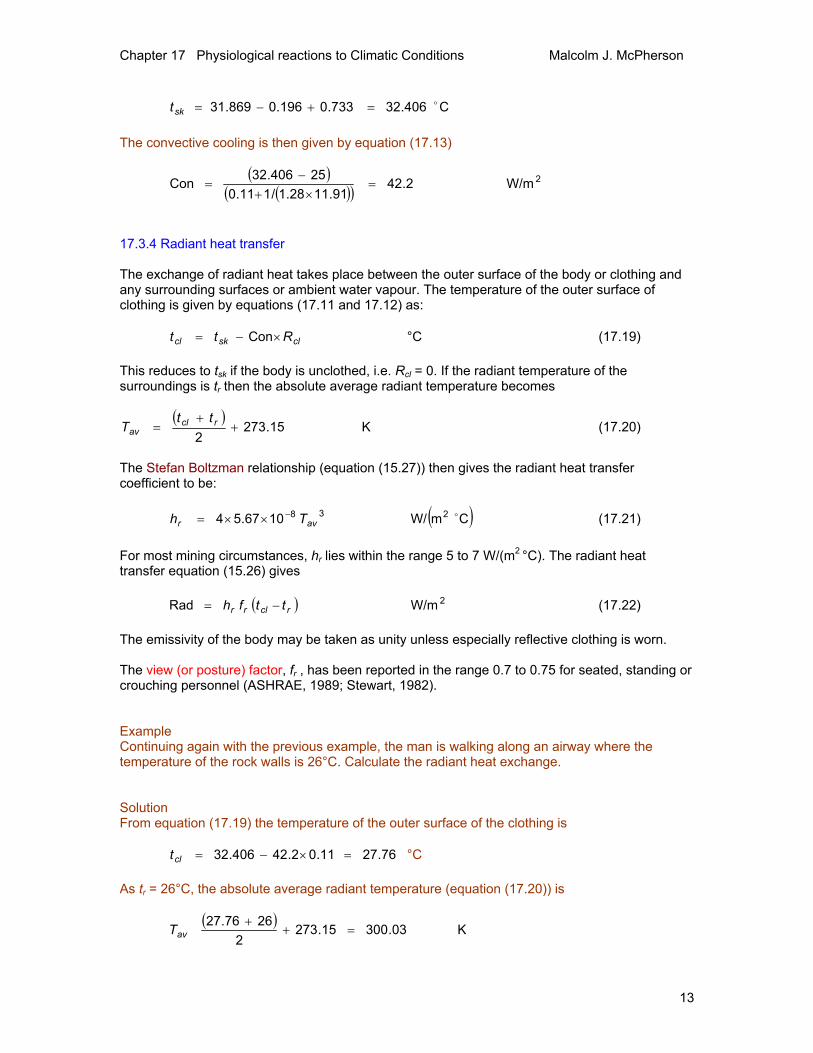
C406.32733.0196.0869.31 o=+−=skt The convective cooling is then given by equation (17.13)
( )( )( )
2W/m2.4291.1128.1/111.0
25406.32Con =×+
−=
17.3.4 Radiant heat transfer The exchange of radiant heat takes place between the outer surface of the body or clothing and any surrounding surfaces or ambient water vapour. The temperature of the outer surface of clothing is given by equations (17.11 and 17.12) as: clskcl Rtt ×−= Con °C (17.19) This reduces to tsk if the body is unclothed, i.e. Rcl = 0. If the radiant temperature of the surroundings is tr then the absolute average radiant temperature becomes
( )K15.273
2+
+= rcl
avtt
T (17.20)
The Stefan Boltzman relationship (equation (15.27)) then gives the radiant heat transfer coefficient to be: ( )CmW/1067.54 238 o
avr Th −××= (17.21) For most mining circumstances, hr lies within the range 5 to 7 W/(m2 °C). The radiant heat transfer equation (15.26) gives ( ) 2W/mRad rclrr ttfh −= (17.22) The emissivity of the body may be taken as unity unless especially reflective clothing is worn. The view (or posture) factor, fr , has been reported in the range 0.7 to 0.75 for seated, standing or crouching personnel (ASHRAE, 1989; Stewart, 1982). Example Continuing again with the previous example, the man is walking along an airway where the temperature of the rock walls is 26°C. Calculate the radiant heat exchange. Solution From equation (17.19) the temperature of the outer surface of the clothing is 76.2711.02.42406.32 =×−=clt °C As tr = 26°C, the absolute average radiant temperature (equation (17.20)) is
( )K03.30015.273
22676.27
=++
avT
Chapter 17 Physiological reactions to Climatic Conditions Malcolm J. McPherson
14
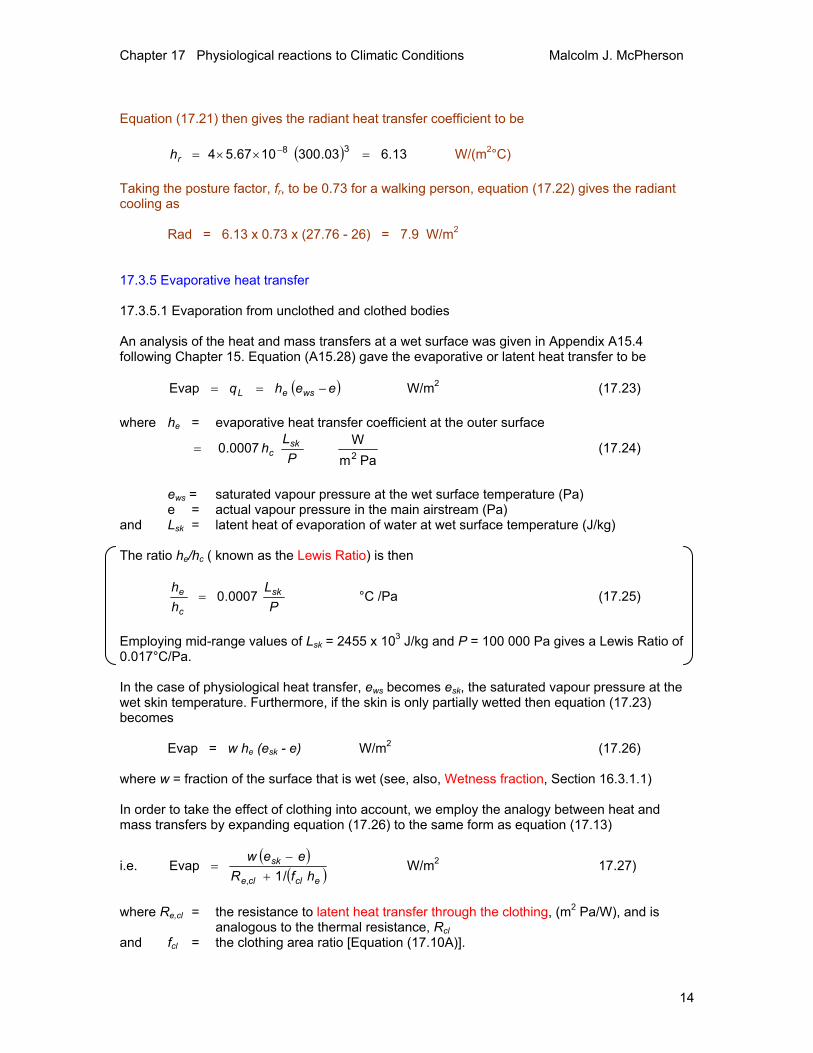
Equation (17.21) then gives the radiant heat transfer coefficient to be ( ) 13.603.3001067.54 38 =××= −
rh W/(m2°C) Taking the posture factor, fr, to be 0.73 for a walking person, equation (17.22) gives the radiant cooling as Rad = 6.13 x 0.73 x (27.76 - 26) = 7.9 W/m2 17.3.5 Evaporative heat transfer 17.3.5.1 Evaporation from unclothed and clothed bodies An analysis of the heat and mass transfers at a wet surface was given in Appendix A15.4 following Chapter 15. Equation (A15.28) gave the evaporative or latent heat transfer to be ( )eehq wseL −==Evap W/m2 (17.23) where he = evaporative heat transfer coefficient at the outer surface
Pam
W0007.02P
Lh sk
c= (17.24)
ews = saturated vapour pressure at the wet surface temperature (Pa) e = actual vapour pressure in the main airstream (Pa) and Lsk = latent heat of evaporation of water at wet surface temperature (J/kg) The ratio he/hc ( known as the Lewis Ratio) is then
P
Lhh sk
c
e 0007.0= °C /Pa (17.25)
Employing mid-range values of Lsk = 2455 x 103 J/kg and P = 100 000 Pa gives a Lewis Ratio of 0.017°C/Pa. In the case of physiological heat transfer, ews becomes esk, the saturated vapour pressure at the wet skin temperature. Furthermore, if the skin is only partially wetted then equation (17.23) becomes Evap = w he (esk - e) W/m2 (17.26) where w = fraction of the surface that is wet (see, also, Wetness fraction, Section 16.3.1.1) In order to take the effect of clothing into account, we employ the analogy between heat and mass transfers by expanding equation (17.26) to the same form as equation (17.13)
i.e. ( )
( )eclcle
sk
hfReew
/1Evap
, +−
= W/m2 17.27)
where Re,cl = the resistance to latent heat transfer through the clothing, (m2 Pa/W), and is analogous to the thermal resistance, Rcl and fcl = the clothing area ratio [Equation (17.10A)].
Chapter 17 Physiological reactions to Climatic Conditions Malcolm J. McPherson
15
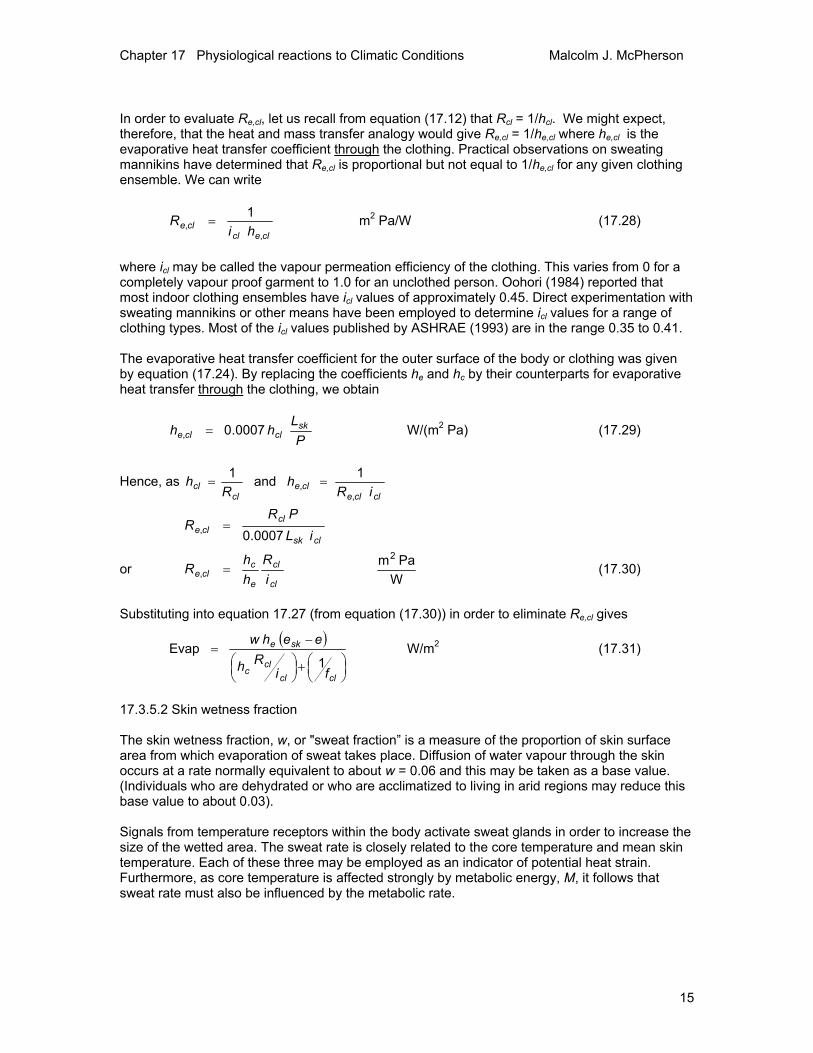
In order to evaluate Re,cl, let us recall from equation (17.12) that Rcl = 1/hcl. We might expect, therefore, that the heat and mass transfer analogy would give Re,cl = 1/he,cl where he,cl is the evaporative heat transfer coefficient through the clothing. Practical observations on sweating mannikins have determined that Re,cl is proportional but not equal to 1/he,cl for any given clothing ensemble. We can write
clecl
cle hiR
,,
1= m2 Pa/W (17.28)
where icl may be called the vapour permeation efficiency of the clothing. This varies from 0 for a completely vapour proof garment to 1.0 for an unclothed person. Oohori (1984) reported that most indoor clothing ensembles have icl values of approximately 0.45. Direct experimentation with sweating mannikins or other means have been employed to determine icl values for a range of clothing types. Most of the icl values published by ASHRAE (1993) are in the range 0.35 to 0.41. The evaporative heat transfer coefficient for the outer surface of the body or clothing was given by equation (17.24). By replacing the coefficients he and hc by their counterparts for evaporative heat transfer through the clothing, we obtain
P
Lhh sk
clcle 0007.0, = W/(m2 Pa) (17.29)
Hence, as clcle
clecl
cl iRh
Rh
,,
1and1==
clsk
clcle iL
PRR
0007.0, =
or W
Pam2
,cl
cl
e
ccle i
Rhh
R = (17.30)
Substituting into equation 17.27 (from equation (17.30)) in order to eliminate Re,cl gives
( )
+
−=
clclcl
c
ske
fiRh
eehw
1Evap W/m2 (17.31)
17.3.5.2 Skin wetness fraction The skin wetness fraction, w, or "sweat fraction” is a measure of the proportion of skin surface area from which evaporation of sweat takes place. Diffusion of water vapour through the skin occurs at a rate normally equivalent to about w = 0.06 and this may be taken as a base value. (Individuals who are dehydrated or who are acclimatized to living in arid regions may reduce this base value to about 0.03). Signals from temperature receptors within the body activate sweat glands in order to increase the size of the wetted area. The sweat rate is closely related to the core temperature and mean skin temperature. Each of these three may be employed as an indicator of potential heat strain. Furthermore, as core temperature is affected strongly by metabolic energy, M, it follows that sweat rate must also be influenced by the metabolic rate.

Chapter 17 Physiological reactions to Climatic Conditions Malcolm J. McPherson
16
An analysis of the effective limits of evaporative cooling given in the ASHRAE Handbook on Fundamentals (1985) leads to the estimated curves shown on Figure 17.3. These provide a base wetness fraction for any given metabolic heat generation and ambient wet bulb temperature.
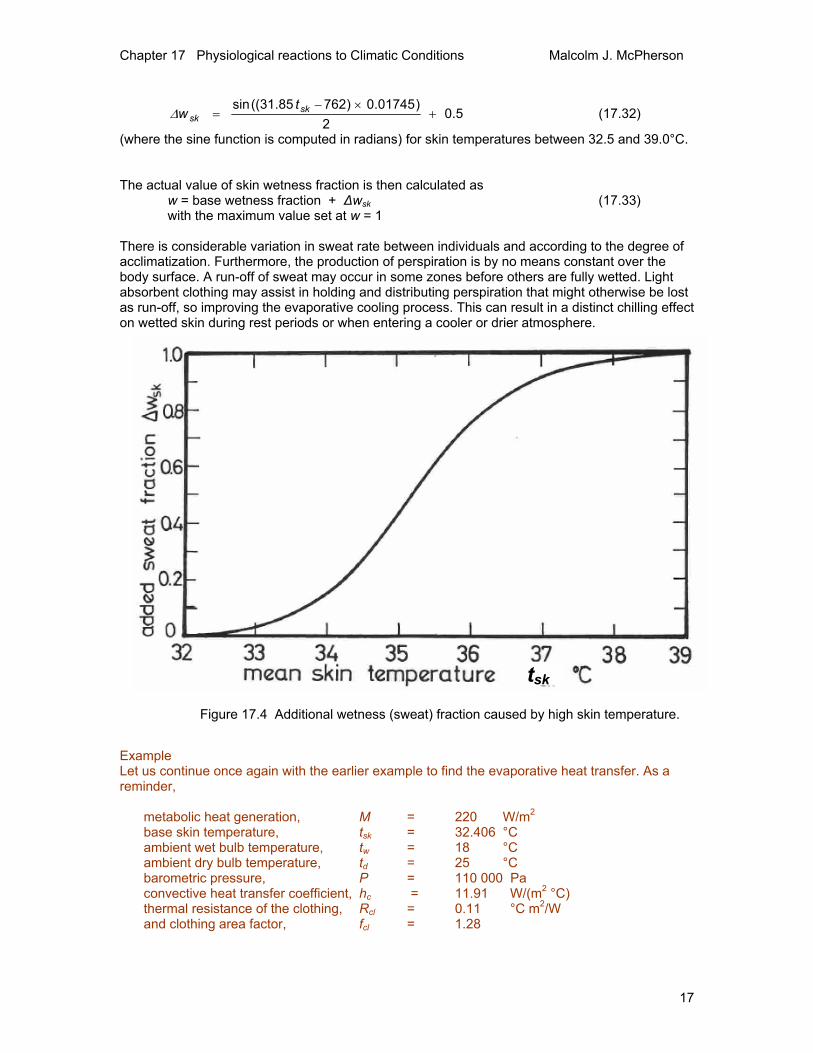
The curves converge to give a fully wetted body surface (w = 1) at a wet bulb temperature of 33°C, irrespective of the metabolic heat production. The curves are described numerically by the algorithm contained within the Sweat Fraction subroutine of the computer program listed in Appendix A17.1 at the end of this chapter. There is, however, an additional effect when the temperature receptors indicate a high skin temperature. Figure 17.4 illustrates the value to be added to the base wetness fraction when skin temperature exceeds 32.5°C. This curve has been obtained from a consideration of sweat production as a function of the thermoregulatory signals generated by body temperature receptors. The curve is represented adequately by the equation
Figure 17.3 Base wetness fraction as a function of ambient wet bulb temperature and metabolic rate.
Chapter 17 Physiological reactions to Climatic Conditions Malcolm J. McPherson
17
5.02
)01745.0)76285.31((sin+
×−= sk
skt
w∆ (17.32)
(where the sine function is computed in radians) for skin temperatures between 32.5 and 39.0°C. The actual value of skin wetness fraction is then calculated as w = base wetness fraction + ∆wsk (17.33) with the maximum value set at w = 1 There is considerable variation in sweat rate between individuals and according to the degree of acclimatization. Furthermore, the production of perspiration is by no means constant over the body surface. A run-off of sweat may occur in some zones before others are fully wetted. Light absorbent clothing may assist in holding and distributing perspiration that might otherwise be lost as run-off, so improving the evaporative cooling process. This can result in a distinct chilling effect on wetted skin during rest periods or when entering a cooler or drier atmosphere.
Example Let us continue once again with the earlier example to find the evaporative heat transfer. As a reminder,
metabolic heat generation, M = 220 W/m2 base skin temperature, tsk = 32.406 °C ambient wet bulb temperature, tw = 18 °C ambient dry bulb temperature, td = 25 °C barometric pressure, P = 110 000 Pa convective heat transfer coefficient, hc = 11.91 W/(m2 °C) thermal resistance of the clothing, Rcl = 0.11 °C m2/W and clothing area factor, fcl = 1.28
tsk
Figure 17.4 Additional wetness (sweat) fraction caused by high skin temperature.

Chapter 17 Physiological reactions to Climatic Conditions Malcolm J. McPherson
18
The only additional item of information that we now require is the vapour permeation efficiency of the clothing, icl. This is taken as 0.45. Solution The evaporative heat transfer is given by equation (17.31), i.e.
( )
+
−=
clclcl
c
ske
fiRh
eehw
1Evap
We must determine the values of those parameters in this equation that are not already known. From the psychrometric equations given in Section 14.6 the saturation vapour pressure at a skin temperature of 32.406°C is calculated as esk = 4863 Pa with a corresponding latent heat of evaporation Lsk = 2425.2 x 103 J/kg The actual vapour pressure in the ambient atmosphere has already been calculated (in the respirable cooling example) as e = 1566 Pa Equation (17.24) gives the evaporative heat transfer coefficient to be
( )PamW/1838.0000110
102.242591.110007.0 23
=×
××=eh
The base wetness fraction, w, at a metabolic rate of M = 220 W/m2 and a wet bulb temperature tw = 18°C may be estimated from Figure 17.3 or computed from the Sweat Factor subroutine given within the program listed in Appendix 17.1 as w = 0.268. Had the base skin temperature been greater than 32.5°C then an addition to the wetness fraction would have been required from Figure 17.4. Equation (17.31) then gives
( )( ) ( )
2W/m0.4428.1/145.0/11.091.11
156648631838.0268.0Evap =+×
−×=
17.3.6 A thermoregulation model The analyses in the previous subsections have produced a set of equations that describe the heat transfers from a human body. A numerical model of the human thermoregulation system involves organizing those equations into a logical sequence: then, after comparing the net heat transfer with a known metabolic heat generation, adjust one or more of the physiological parameters in a manner that simulates the thermoregulatory response of an average, healthy person. The process is repeated iteratively until either thermal equilibrium is reached (when net heat transfer equals metabolic heat) or the model indicates untenable conditions of heat strain.

Chapter 17 Physiological reactions to Climatic Conditions Malcolm J. McPherson
19
It must be appreciated that considerable variation occurs between individuals in their reaction to climatic variations. Empirical data gained from physiological tests represent average response. Combined with the approximations that are inherent in the analyses of surface heat and mass transfer theory, this indicates that the results of any thermoregulation model provide guidelines to average reaction rather than precise predictions for individual workers. The thermoregulation model developed here employs mean skin temperature as the physiological indicator of heat strain. The model calculates an initial or base skin temperature on the basis of ambient dry bulb temperature from Gagge's equation (17.16) or from Figure 17.2.2 The heat transfer from respiration, Br, convection, Con, radiation, Rad, and evaporation, Evap, are calculated from equations (17.7, 17.13, 17.22 and 17.31) respectively. The difference between net heat transfer and metabolic heat then indicates the heat accumulated, Ac (see equation (17.2)). Ac = M - (Br + Con + Rad + Evap) W/m2 (17.34) If Ac is positive then heat is temporarily accumulated within the body. The reaction of an actual person may be to rest, reduce the rate of work, or discard clothing (the behavioural response). However, the simulation model assumes that the metabolic rate, M, is maintained. The skin temperature, tsk, and, consequently, wetness fraction are increased as a function of Ac. In the thermoregulation model given as a program listing in Appendix A17.1, the correction to tsk may be taken as 0.01 Ac or 0.02 Ac. The heat transfer equations are re-evaluated iteratively until Ac is within 1 W/m2 of zero. If the final equilibrium skin temperature is over 36°C then the worker may exhibit the progressive symptoms of heat strain, while skin temperatures in excess of 37°C should be considered to be dangerous.
Example The example that was built up sequentially through Sections 17.3.2 to 17.3.5 is continued here to illustrate the reaction of the model and iterative convergence towards thermal equilibrium. Recalling the results of the earlier calculations, the initial or base skin temperature2 was calculated to be 32.406°C and the heat transfers associated with this skin temperature were calculated to be
Respiration, Br, = 24.8 W/m2 Convection, Con, = 42.2 W/m2 Radiation, Rad, = 7.9 W/m2 and Evaporation, Evap, = 44.0 W/m2 Total (net cooling) = 118.9 W/m2
The metabolic rate was, however, 220 W/m2. Hence, the initial rate of heat accumulation is Ac = 220 - 118.9 = 101.1 W/m2 This causes the simulated skin temperature to increase to 32.406 + (0.02 x 101.1) = 34.428°C. The heat transfer equations are then re-evaluated iteratively until Ac approaches zero. Table 17.3 illustrates the convergence of the model (listed in Appendix A17.1) towards equilibrium when net cooling equals metabolic rate.
2 Alternatively, the initial skin temperature may simply be assumed to be the neutral value of 34°C
Chapter 17 Physiological reactions to Climatic Conditions Malcolm J. McPherson
20
Skin
Temperature °C
Respiration Br
W/m2
Convection Con
W/m2
Radiant Rad
W/m2
Evaporation Evap W/m2
Wetness fraction
Net Cooling W/m2
Heat accumulated
Ac W/m2
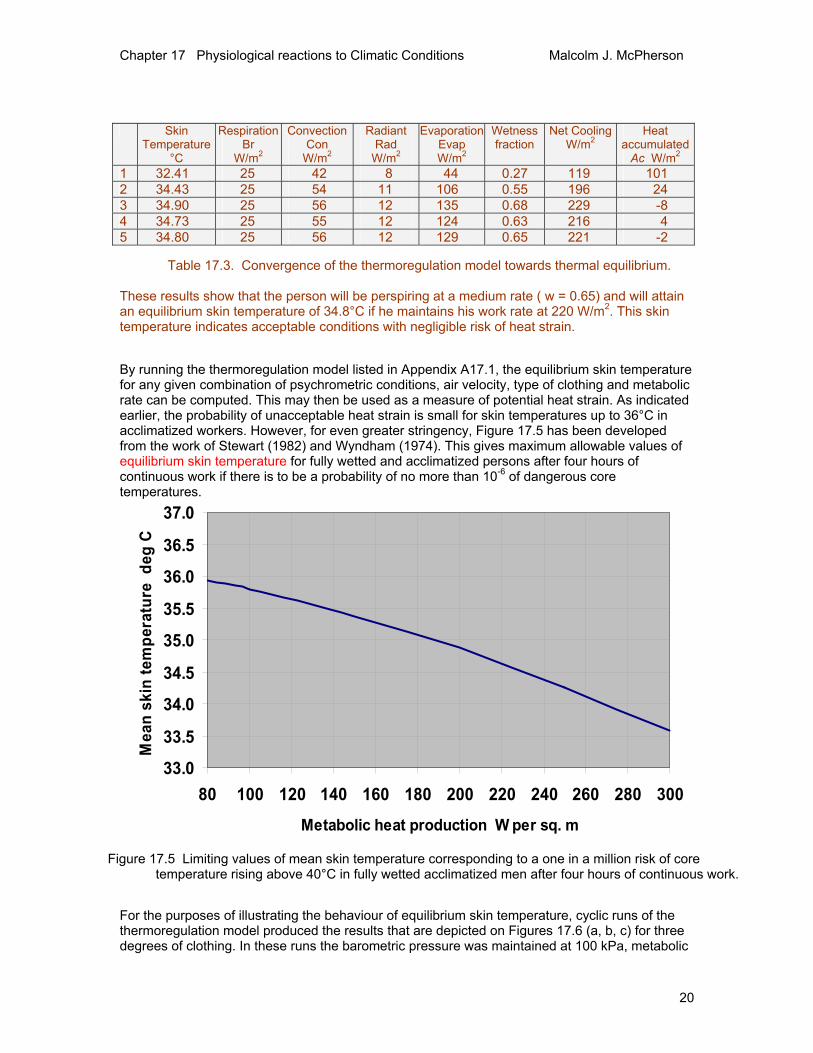
1 32.41 25 42 8 44 0.27 119 101 2 34.43 25 54 11 106 0.55 196 24 3 34.90 25 56 12 135 0.68 229 -8 4 34.73 25 55 12 124 0.63 216 4 5 34.80 25 56 12 129 0.65 221 -2 Table 17.3. Convergence of the thermoregulation model towards thermal equilibrium. These results show that the person will be perspiring at a medium rate ( w = 0.65) and will attain an equilibrium skin temperature of 34.8°C if he maintains his work rate at 220 W/m2. This skin temperature indicates acceptable conditions with negligible risk of heat strain. By running the thermoregulation model listed in Appendix A17.1, the equilibrium skin temperature for any given combination of psychrometric conditions, air velocity, type of clothing and metabolic rate can be computed. This may then be used as a measure of potential heat strain. As indicated earlier, the probability of unacceptable heat strain is small for skin temperatures up to 36°C in acclimatized workers. However, for even greater stringency, Figure 17.5 has been developed from the work of Stewart (1982) and Wyndham (1974). This gives maximum allowable values of equilibrium skin temperature for fully wetted and acclimatized persons after four hours of continuous work if there is to be a probability of no more than 10-6 of dangerous core temperatures.
For the purposes of illustrating the behaviour of equilibrium skin temperature, cyclic runs of the thermoregulation model produced the results that are depicted on Figures 17.6 (a, b, c) for three degrees of clothing. In these runs the barometric pressure was maintained at 100 kPa, metabolic
33.0
33.5
34.0
34.5
35.0
35.5
36.0
36.5
37.0
80 100 120 140 160 180 200 220 240 260 280 300
Metabolic heat production W per sq. m
Mea
n sk
in te
mpe
ratu
re d
eg C
Figure 17.5 Limiting values of mean skin temperature corresponding to a one in a million risk of core temperature rising above 40°C in fully wetted acclimatized men after four hours of continuous work.

Chapter 17 Physiological reactions to Climatic Conditions Malcolm J. McPherson
21
rate at 100 W/m2, and the dry bulb temperature and radiant temperature both set at 5°C above the wet bulb temperature. For those specific conditions, the equilibrium skin temperature can be read from Figure 17.6 for given values of wet bulb temperature, air velocity, and type of clothing.
Figure 17.6 For the specific values M = 100 W/m2, td = tr = tw + 5°C and P = 100 kPa, this figure illustrates the variation of mean skin temperature with ambient wet bulb temperature on
(a) unclothed, (b) lightly clothed (c) heavily clothed personnel

Chapter 17 Physiological reactions to Climatic Conditions Malcolm J. McPherson
22
These sets of curves show clearly: • the increases in skin temperature both below and above the zone of evaporative regulation • the levelling of skin temperatures during evaporative regulation (when body wetness is
increasing) • the increased skin temperatures caused by clothing, and • the reduced influence of air velocity as clothing is added.
17.4 INDICES OF HEAT STRESS 17.4.1 Purpose and types of heat stress indices. It is clear from the preceding sections that the reaction of the human body to climatic variations involves a complex mix of psychrometric parameters and physiological responses. It is due to such complexity that heat stress indices rely, directly or indirectly, on data gained from experimental tests on volunteer human subjects undergoing monitored work rates in a range of environmental conditions. For more detailed and wider investigations, the availability of high speed computing allows a thermoregulation model such as that described in Section 17.3.6 to be employed. This requires a specification of all relevant data pertaining to work rate, clothing and psychrometric condition of the air. For less rigorous applications such as routine checking of the cooling power of an existing environment or for initial conceptual designs, it is convenient to employ some measure of air cooling power or physiological reaction that can be quoted as a single number or index of heat stress. For manual use, such an index should be capable of direct measurement, or calculated easily from only a few types of observation. Over ninety indices of heat stress were developed during the twentieth century (Hanoff, 1970). This reflects the large number of variables involved, the complexity of the human thermoregulation system and the range of climatic conditions under which human beings may be required to work. Even with similar climatic conditions, work rates and clothing ensembles, differing indices of heat stress can exhibit substantial variations in their predicted limits of environmental acceptability (Brake and Bates, 2002). The further reasons for such differences include the variety of treatments, assumptions and numerical values used by researchers with respect to clothing and physiological responses. It should also be borne in mind that most research into heat stress in non-sedentary workers is based on young, healthy and acclimatized personnel. In practice, there are significant variations between individuals within any given workforce. It is for this reason that initial screening and heat tolerance tests are advisable for recruits or returnees who will work in hot conditions (ref. Section 17.7). We may classify heat stress indices into three types: • single measurements • empirical methods (dependent on measurements of temperature and air velocity) • rational indices (based on the metabolic heat balance [equation 17.2] and physiological
thermoregulation models). Indices within each of these groups that have been recommended for subsurface ventilation systems are introduced in the following subsections.
Chapter 17 Physiological reactions to Climatic Conditions Malcolm J. McPherson
23
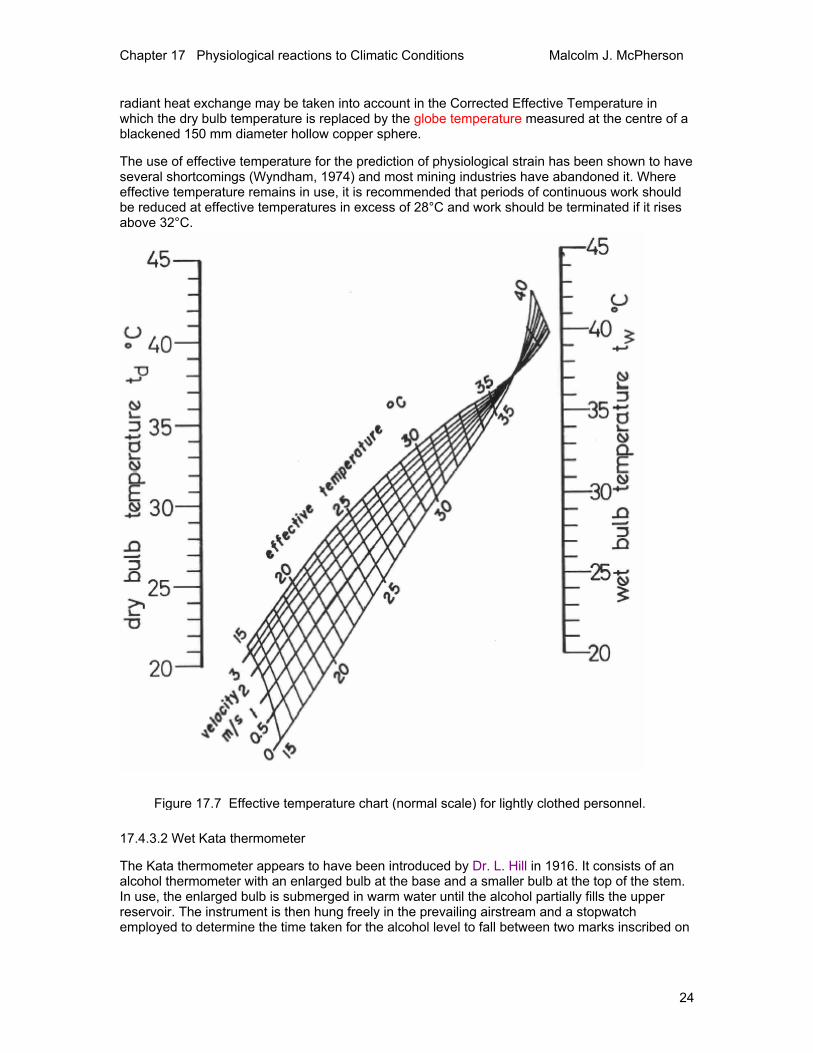
17.4.2 Single measurements No single psychrometric parameter is, by itself, a reliable indicator of physiological reaction. In hot and humid environments where the predominant mode of metabolic heat transfer is evaporation, the wet bulb temperature of the ambient air is the most powerful variable affecting body cooling. Indeed, some mines retain the wet bulb temperature as a sole indicator of climatic acceptability. A psychrometric (aspirated) wet bulb temperature of 27 to 28°C may be employed as a proximate criterion above which work rates or shift hours should be reduced, while in former years 32°C has been regarded as an upper limit of acceptability for very hot mines. The second most important variable in hot conditions is the air velocity. Although air velocity, by itself, gives little indication of climatic acceptability, it can easily be combined with wet bulb temperature. This may be achieved by measuring the natural wet bulb temperature, that is, the temperature indicated by a non-aspirated wet bulb thermometer held stationary within the prevailing airstream. Dry bulb temperature alone has a very limited role on climatic acceptability in hot mine environments. However, dry bulb temperatures in excess of 45°C can give a burning sensation on exposed skin facing the airstream. Hot dry environments may also result in skin ailments (Section 17.5.4). Heating and ventilating engineers concerned with comfort conditions in surface buildings often employ a combination of dry bulb temperature and relative humidity. Unfortunately, workers in underground mines or involved in the development of other subsurface facilities must often have to contend with much wider ranges of climatic acceptability. For cold conditions where convection and radiation are the primary modes of heat exchange, dry bulb temperature and air velocity become the dominant factors. These may be combined into a wind chill index (Section 17.6). 17.4.3 Empirical methods These techniques produce indices of heat stress that have either evolved from a statistical treatment of observations made on volunteers working in a controlled climate or are based on simplified relationships that utilize measurable parameters but have not been derived through a rational or theoretical analysis. 17.4.3.1 Effective temperature, ET Effective temperature is one of the older indices of heat stress. In the mid 1920's, F.C. Houghton and C.P. Yaglou of the then American Society of Heating and Ventilating Engineers (ASHVE) conducted a series of experiments in which three volunteers were asked to pass between two adjoining rooms. One room was maintained at saturated conditions and negligible air velocity during any given experiment while the wet bulb temperature, dry bulb temperature and air velocity were varied in the second room. The instantaneous and subjective thermal sensation of each volunteer on passing between rooms was recorded simply as "hotter, cooler or the same". The experiments were conducted first on men stripped to the waist then repeated with the same subjects wearing lightweight suits. The effective temperature was defined as the temperature of still saturated air that would give the same instantaneous thermal sensation as the actual environment under consideration. Charts were produced that allowed the effective temperature to be read for given wet bulb temperature, dry bulb temperature and air velocity. An example is shown on Figure 17.7. The concept of effective temperature has been employed widely both as a comfort index for office workers and also as a heat stress index for industrial and military occupations. The effect of
Chapter 17 Physiological reactions to Climatic Conditions Malcolm J. McPherson
24
radiant heat exchange may be taken into account in the Corrected Effective Temperature in which the dry bulb temperature is replaced by the globe temperature measured at the centre of a blackened 150 mm diameter hollow copper sphere. The use of effective temperature for the prediction of physiological strain has been shown to have several shortcomings (Wyndham, 1974) and most mining industries have abandoned it. Where effective temperature remains in use, it is recommended that periods of continuous work should be reduced at effective temperatures in excess of 28°C and work should be terminated if it rises above 32°C.
17.4.3.2 Wet Kata thermometer The Kata thermometer appears to have been introduced by Dr. L. Hill in 1916. It consists of an alcohol thermometer with an enlarged bulb at the base and a smaller bulb at the top of the stem. In use, the enlarged bulb is submerged in warm water until the alcohol partially fills the upper reservoir. The instrument is then hung freely in the prevailing airstream and a stopwatch employed to determine the time taken for the alcohol level to fall between two marks inscribed on
Figure 17.7 Effective temperature chart (normal scale) for lightly clothed personnel.

Chapter 17 Physiological reactions to Climatic Conditions Malcolm J. McPherson
25
the stem. This is combined with an instrument factor given with each individual thermometer to produce a measure of the cooling power of the air in mcal/(cm2s). When the main reservoir of the Kata thermometer is covered in wet muslin, the instrument gives cooling powers that are representative of a 20 mm wetted bulb at 36.5°C. These have been found to correlate reasonably well with core temperatures of unclothed and acclimatized workers subjected to hot and humid conditions (Stewart, 1982). Wet Kata readings may be approximated from measurements of air velocity, u, and wet bulb temperature, tw,
( )( )wtupowercoolingKataWet −+= 5.367.0 5.0 mcal/(cm2s) (17.35) (South African Chamber of Mines, 1972)
The use of Wet Kata readings as an index of heat stress is limited to hot and humid environments. Only the South African gold mining industry has utilized the Wet Kata reading in mines as a heat stress index on a routine basis. 17.4.3.3 Wet bulb globe temperature and wet globe temperature The wet bulb globe temperature (WBGT) relies upon two measurements only. The first is the reading indicated by a wet bulb thermometer held stationary in the prevailing airstream. This is sometimes termed the natural wet bulb temperature, tnw, and, at air velocities of less than about 3 m/s, will indicate a temperature greater than that of the normal psychrometric (aspirated) wet bulb thermometer, tw (Section 14.3.5). Secondly, the temperature at the centre of a matte black hollow sphere or globe temperature, tg, is measured. The two are combined to give WBGT = 0.7 tnw + 0.3 tg °C (17.36) When a significant source of radiant heat is visible then WBGT = 0.7 tnw + 0.2 tg + 0.1 td where td = dry bulb temperature °C (17.37) This latter form of the equation is normally employed only in sunlight. The wet bulb globe temperature is a function of the major climatic parameters that affect physiological reaction, i.e. wet and dry bulb temperatures, air velocity and radiant temperature. However, it has the advantage that it does not require a separate measurement of air velocity. The National Institute of Occupational Safety and Health of the United States (NIOSH, 1986) has employed WBGT as a heat stress standard and recommended the exposure limits shown on Figure 17.8. Heat stress levels based on the WBGT have also been subject to an International Standard (ISO, 1982). A simplified version of the wet bulb globe temperature was developed by J.H. Botsford in 1971 and is known as the wet globe temperature (WGT). The instrument, now called a Botsball, consists of a 6 cm diameter blackened copper sphere covered by a wetted black fabric. A dial thermometer indicates the temperature at the middle of the hollow sphere. Regression equations may be employed to relate WGT to WBGT (Ciriello, 1977) for known psychrometric conditions. For the particular range of dry bulb temperatures 20 to 35°C, relative humidities greater than 30 per cent and air velocities less than 7 m/s, Onkaram (1980) has suggested the experimentally derived equation WBGT = 1.044 WGT - 0.187 °C (17.38) where WGT is measured in °C.

Chapter 17 Physiological reactions to Climatic Conditions Malcolm J. McPherson
26
The WBGT and its simplified companion, WGT are both well suited to the rapid assessment of climatic conditions in existing locations where instrumentation may be located. They are, at present, less useful for the prediction of air cooling power in underground openings that have not yet been constructed, as neither natural wet bulb temperature nor wet or dry globe temperatures are included as output in current subsurface climate simulators. Improvements in instrumentation, microelectronics and computer software have resulted in the development of hand-held devices that give an in-situ indication of air cooling power (e.g. Wu and Gillies, 1997).
Figure 17.8 Wet bulb globe temperature exposure for acclimatized workers at varying working time per hour(recommended by the U.S. National Institute of Occupational Safety and Health, Pub. 86-113).
Chapter 17 Physiological reactions to Climatic Conditions Malcolm J. McPherson
27
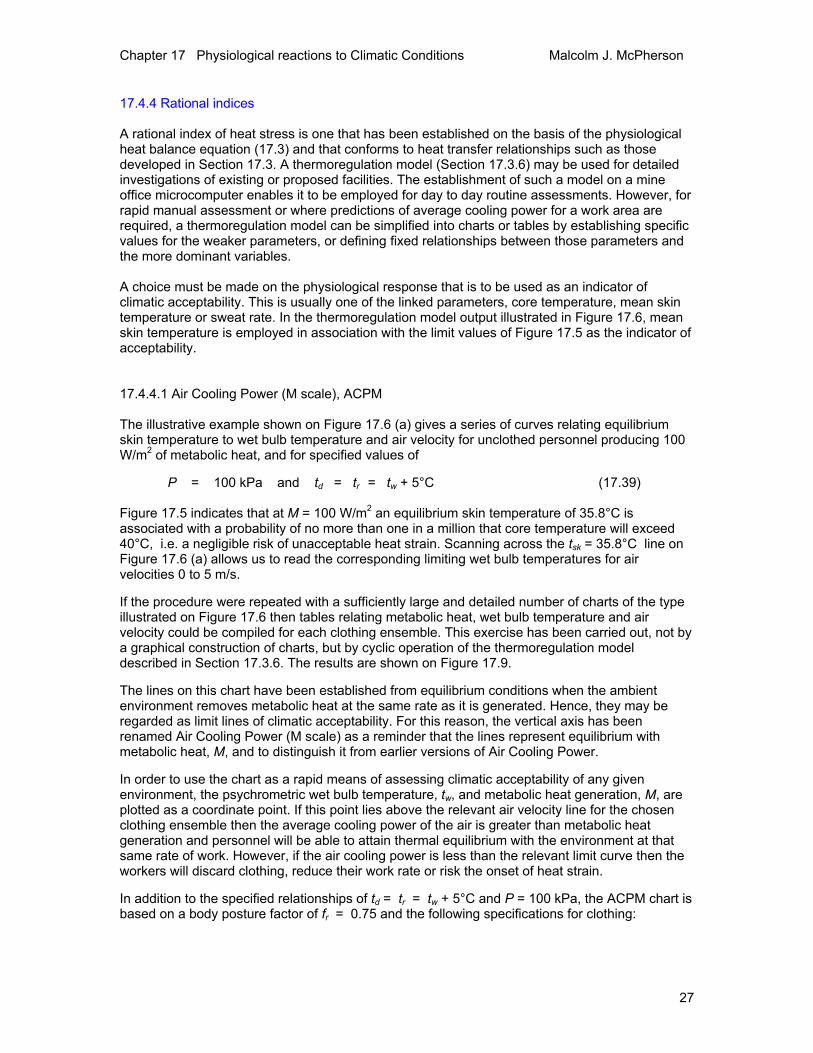
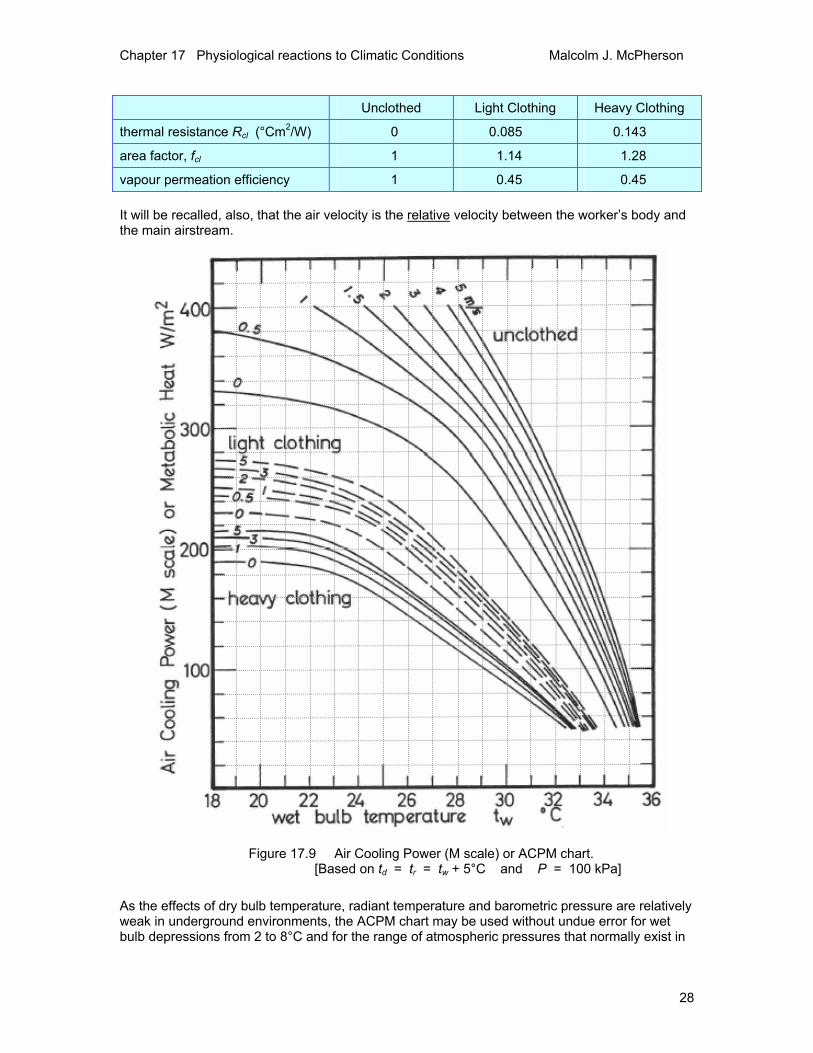
17.4.4 Rational indices A rational index of heat stress is one that has been established on the basis of the physiological heat balance equation (17.3) and that conforms to heat transfer relationships such as those developed in Section 17.3. A thermoregulation model (Section 17.3.6) may be used for detailed investigations of existing or proposed facilities. The establishment of such a model on a mine office microcomputer enables it to be employed for day to day routine assessments. However, for rapid manual assessment or where predictions of average cooling power for a work area are required, a thermoregulation model can be simplified into charts or tables by establishing specific values for the weaker parameters, or defining fixed relationships between those parameters and the more dominant variables. A choice must be made on the physiological response that is to be used as an indicator of climatic acceptability. This is usually one of the linked parameters, core temperature, mean skin temperature or sweat rate. In the thermoregulation model output illustrated in Figure 17.6, mean skin temperature is employed in association with the limit values of Figure 17.5 as the indicator of acceptability. 17.4.4.1 Air Cooling Power (M scale), ACPM The illustrative example shown on Figure 17.6 (a) gives a series of curves relating equilibrium skin temperature to wet bulb temperature and air velocity for unclothed personnel producing 100 W/m2 of metabolic heat, and for specified values of P = 100 kPa and td = tr = tw + 5°C (17.39) Figure 17.5 indicates that at M = 100 W/m2 an equilibrium skin temperature of 35.8°C is associated with a probability of no more than one in a million that core temperature will exceed 40°C, i.e. a negligible risk of unacceptable heat strain. Scanning across the tsk = 35.8°C line on Figure 17.6 (a) allows us to read the corresponding limiting wet bulb temperatures for air velocities 0 to 5 m/s. If the procedure were repeated with a sufficiently large and detailed number of charts of the type illustrated on Figure 17.6 then tables relating metabolic heat, wet bulb temperature and air velocity could be compiled for each clothing ensemble. This exercise has been carried out, not by a graphical construction of charts, but by cyclic operation of the thermoregulation model described in Section 17.3.6. The results are shown on Figure 17.9. The lines on this chart have been established from equilibrium conditions when the ambient environment removes metabolic heat at the same rate as it is generated. Hence, they may be regarded as limit lines of climatic acceptability. For this reason, the vertical axis has been renamed Air Cooling Power (M scale) as a reminder that the lines represent equilibrium with metabolic heat, M, and to distinguish it from earlier versions of Air Cooling Power. In order to use the chart as a rapid means of assessing climatic acceptability of any given environment, the psychrometric wet bulb temperature, tw, and metabolic heat generation, M, are plotted as a coordinate point. If this point lies above the relevant air velocity line for the chosen clothing ensemble then the average cooling power of the air is greater than metabolic heat generation and personnel will be able to attain thermal equilibrium with the environment at that same rate of work. However, if the air cooling power is less than the relevant limit curve then the workers will discard clothing, reduce their work rate or risk the onset of heat strain. In addition to the specified relationships of td = tr = tw + 5°C and P = 100 kPa, the ACPM chart is based on a body posture factor of fr = 0.75 and the following specifications for clothing:
Chapter 17 Physiological reactions to Climatic Conditions Malcolm J. McPherson
28
Unclothed Light Clothing Heavy Clothing
thermal resistance Rcl (°Cm2/W) 0 0.085 0.143
area factor, fcl 1 1.14 1.28
vapour permeation efficiency 1 0.45 0.45 It will be recalled, also, that the air velocity is the relative velocity between the worker’s body and the main airstream.
As the effects of dry bulb temperature, radiant temperature and barometric pressure are relatively weak in underground environments, the ACPM chart may be used without undue error for wet bulb depressions from 2 to 8°C and for the range of atmospheric pressures that normally exist in
Figure 17.9 Air Cooling Power (M scale) or ACPM chart. [Based on td = tr = tw + 5°C and P = 100 kPa]

Chapter 17 Physiological reactions to Climatic Conditions Malcolm J. McPherson
29
mine workings. The computer model listed in Appendix A17.1 can be used to develop similar charts for any other specified conditions. Air cooling charts have the advantage that they are based on a thermoregulation model and can also be used to assess the acceptability of existing workplace conditions. Example 1 In a mine working, the wet bulb temperature is 28°C and the air velocity is 1 m/s. Estimate the limiting rates of continuous work for unclothed, lightly clothed and heavily clothed personnel. Solution From Figure 17.9 the three values of air cooling power at tw = 28°C and u = 1 m/s are estimated at: unclothed: 313 W/m2 lightly clothed: 168 W/m2 heavily clothed: 127 W/m2
Table 17.1 may be used to relate these cooling powers to types of work activity. Example 2 It is predicted that in a future subsurface development the air velocity will be 2 m/s. If personnel are to sustain a metabolic rate of 220 W/m2 while lightly clothed, estimate the upper limit of psychrometric wet bulb temperature. Solution From the light clothing curves on Figure 17.9, at an air velocity of 2 m/s and an air cooling power of 220 W/m2, the limiting wet bulb temperature is estimated at 25.6°C. Example 3 Acclimatized mine employees are required to work in a location where the wet bulb temperature is 29 °C. The workrate will be moderate with occasional extra effort. Recommend the type of clothing and the minimum air velocity to minimize the probability of unacceptable heat stress. Solution From Table 17.1 an average metabolic heat production rate is estimated at 260 W/m2. Plotting a point at M = 260 W/m2 and tw = 29 °C on the Air Cooling Power (M scale) chart of Figure 17.9 shows that it lies close to an air velocity of 0.5 m/s in the unclothed region. Hence, the recommendation is that these workers should wear no more than brief shorts, boots and hardhats, and that the air velocity should not be less than 0.5 m/s. 17.4.4.2 Specific Cooling Power (A scale), ACPA The original concept of air cooling power as employed in this chapter arose from pioneering work conducted by the Chamber of Mines Research Organization of South Africa (Mitchell and Whillier, 1972; Wyndham, 1974; Stewart and Whillier, 1979; Stewart, 1982). This involved detailed analytical investigations as well as some thousands of tests in a large environmentally controlled and monitored wind tunnel. A thermoregulation model was developed on the basis of the physiological heat transfer equation (17.3). That model was restricted to the hot and humid conditions prevalent in the stopes of deep South African gold mines. In those conditions the influence of respiratory cooling is relatively small and was ignored. The model was further confined to fully wetted and unclothed personnel. An air cooling power chart was produced for the specific conditions of td = tr = tw + 2°C and P = 100 kPa and for wet bulb temperatures in the range 25 to 35°C (Stewart, 1982). This was termed the Specific Cooling Power (A Scale) chart and yielded curves that are comparable to those given for unclothed personnel on Figure 17.9 within that range of wet bulb temperature.

Chapter 17 Physiological reactions to Climatic Conditions Malcolm J. McPherson
30
17.4.5 Choice of heat stress index. With such a variety of heat stress indices the question arises on when to employ an empirical or rational index. It would be impractical to conduct measurements of physiological response (e.g. body core temperature, sweat rate or mean skin temperature during normal mining operations. Hence, for routine manual monitoring of the workplace empirical indices are usually preferred by supervisors (Section 17.4.3)3.The values obtained for the preferred empirical index can then be compared with limits of acceptability that have been estimated from controlled experiments on volunteers (e.g. Figures 17.7 and 17.8). As the reliability and costs of handheld cooling power instruments continue to improve we may see these being more widely used for routine workplace monitoring. Similar devices might also be incorporated into minewide monitoring systems for hot mines. Where computer simulation programs are employed to predict climatic conditions in planned future workings a wider choice is available. Provided that the relevant variables of environmental temperatures and air velocities are produced by the simulation package then one or more of the empirical indices of heat stress can again be shown. However, a thermoregulation model may also be included in the simulation package in order to predict one or more of the physiological responses. The latter can be used as a direct and more precise indicator of the level of heat stress experienced by workers for specified types of clothing and rates of physical work. For example, in the CLIMSIM package (Chapter 16) the empirical indices produced are effective temperature and wet bulb globe temperature. Additionally, the thermoregulation model listed in Appendix A17.1 is incorporated within CLIMSIM in order to predict mean skin temperature as an indication of physiological reaction and to give warnings of impending heat stress (see Case Study, Section 16.3.3). 17.5 HEAT ILLNESSES The human thermoregulation system depends upon the efficient operation of the core and skin temperature receptors, the flow of blood throughout the body but particularly between the core and skin tissues, and the production of perspiration. If any of these mechanisms loses its effectiveness then the body will progressively exhibit the symptoms of one or more of a series of disorders known collectively as the heat illnesses. These may arise as separate and recognizable ailments with identifiable causes. However, for workers in hot and humid environments they can occur in combination. A common initial symptom is a loss of interest in the task and difficulty in remaining alert. In any adverse environment, the desire to seek more comfortable surroundings is a psychological reaction that is just as much a part of the body's defence mechanism as thermoregulatory effects. Suppression of such predilection may result in irritability or displays of anger. This may be observed even in persons who are cognizant of the effect. The physical symptoms often reveal themselves first as a loss of coordination and dexterity. It follows, even from these initial symptoms of heat strain, that both manual and mental work productivity will suffer, morale is likely to be low, absenteeism high and standards of safety will decline in environments that are unduly hot. This is true for either a labour intensive method of working or one that is heavily mechanized.
3 However, Air Cooling Power Charts (e.g. Figure 17.9) are also directly applicable to existing workplaces.
Chapter 17 Physiological reactions to Climatic Conditions Malcolm J. McPherson
31
Heat illnesses are introduced in the following subsections and in order of increasing seriousness. However, it should be remembered that symptoms may overlap and, in cases of doubt, it should be assumed that the patient is a victim of heat stroke. 17.5.1 Heat fainting This occurs most frequently when a person stands still for an extended period in a warm environment. Blood tends to pool in the lower parts of the body causing a temporary reduction in blood supply to the brain and, hence, a short term loss of consciousness. A common example arises when soldiers in heavy uniform are required to remain motionless for long periods of time during ceremonial parades. The treatment is simply to restore an adequate supply of blood to the brain by allowing the patient to lie flat in a cooler area and to loosen or remove clothing. Recovery is normally rapid and complete. The probability of heat fainting is reduced by intermittent body movements. 17.5.2 Heat exhaustion Conductance of heat within the body is facilitated primarily by the flow of blood. If the volume of blood is insufficient then heat exhaustion may ensue. A decrease in blood volume may result from dehydration caused either by an inadequate intake of fluids or by a salt deficient diet. Alternatively, a combination of environmental heat stress and metabolic rate may cause the heartbeat to exceed some 180 bpm. The inadequate time interval between contractions of heart muscles may then be insufficient to maintain an adequate supply to the heart chambers - the rate of blood flow drops. A significant increase in total volume of blood occurs during periods of heat acclimatization. The additional symptoms of heat exhaustion are • tiredness, thirst, dizziness • numbness or tingling in fingers and toes • breathlessness, palpitations, low blood pressure • blurred vision, headache, nausea and fainting • clammy skin that may be either pale or flushed.
On the spot treatment should include removal to a cool area and administration of moderate amounts of drinking water. If the patient is unconscious then heat stroke should be assumed. In any case, a medical examination should be carried out before the victim is allowed to return to work. 17.5.3 Heat cramps If the electrolytic balance of body fluids is sufficiently perturbed then painful muscular contractions occur in the arms, legs and abdomen. This may occur by salt deficiency or drinking large amounts of water following dehydration. Medical opinion no longer favours salt tablets but recommends a diet that provides a more natural supply of salt. However, immediate treatment may include the administration of fluid containing no more than 0.1 per cent salt. 17.5.4 Heat rash This is sometimes known as prickly heat by residents of equatorial regions. It is caused by unrelieved periods of constant perspiration. The continuous presence of unevaporated sweat produces inflammation and blockage of the sweat ducts. The typical appearance of the ailment is

Chapter 17 Physiological reactions to Climatic Conditions Malcolm J. McPherson
32
areas of tiny red blisters causing irritation and soreness. Although not serious in itself, heat rash may lead to secondary infections of the skin and, if sweat rates are sufficiently inhibited, may produce an increased susceptibility to heat stroke. Heat rash can be prevented by frequent bathing and the provision of cool living quarters. Skin irritations can also occur in the hot, dry environments of some evaporite mines, especially at areas of skin contact with hat bands or protective devices. 17.5.5 Heat stroke The most serious of the heat illnesses, heat stroke, may occur when the body core temperature rises above 41°C. Co-ordination of the involuntary nervous system, including body thermoregulation, is achieved by means of proteins controlled by the hypothalamus, part of the brainstem. At temperatures in excess of 41°C, damage to those proteins results in the transmission of confused signals to the muscles and organs that control involuntary reactions. Furthermore, irreversible injury may be caused to the brain, kidneys and liver. Heat stroke carries a high risk of fatality. The initial symptoms of impending heat stroke are similar to those of the less serious heat illnesses, i.e. headaches, dizziness, nausea, fatigue, thirst, breathlessness and palpitations. If the patient loses consciousness, then heat stroke should be assumed. The additional symptoms arise from disruption of the thermoregulatory and other nervous systems of the body: • perspiration ceases, the skin remains hot but is dry and may adopt a blotchy or bluish
colouration. • disorientation may become severe involving dilated pupils, a glassy stare and irrational or
aggressive behaviour. • shivering and other uncontrolled muscular contractions may occur. • there may be a loss of control of bodily functions.
Although treatment should commence as soon as possible, current medical opinion is that the patient should not be moved until core temperature has been brought under control. The administration of first aid should include: • Cooling by air movement and the application of water to the skin. The water temperature
should be not less than 15°C in order to avoid vasoconstriction of the skin blood capillaries. Massaging the skin also assists in promoting blood flow through the surface tissues.
• The application of CPR (cardiopulmonary resuscitation) in cases where perceptible heart beat or respiration are absent. This includes chest massage and mouth-to-mouth breathing.
• Frequent sips of water if the patient is conscious. Medical assistance should be sought and treatment continued until the core temperature falls below 38.5°C. The patient should then be covered by a single blanket and transported by stretcher to hospital. Unfortunately, death or permanent disability may still occur if irreversible damage has occurred in vital organs. Even after physical recovery, the heat tolerance of the victim may be impaired, perhaps permanently. 17.5.6 Precautions against heat illnesses There is a great deal that can be done to protect a workforce against unacceptable heat strain. First, the design and engineering control of the ventilation and air quality systems of the mine or facility should be directed toward providing a safe climatic environment within all places where
Chapter 17 Physiological reactions to Climatic Conditions Malcolm J. McPherson
33
personnel work or travel routinely. If threshold limit values for climatic parameters have not been set by legislative action, then they should be chosen and enforced by self-imposed action of the mine or industry. Cool and potable drinking water should be available to workers in hot mines. Clothing that is appropriate for the work environment and level of activity should be worn by personnel. In hot environments, this may mean very little clothing or lightweight garments that are loosely weaved, porous and absorbent. For unusual circumstances such as rescue operations where personnel are occasionally required to enter hot areas that do not meet the criteria of climatic acceptability, microclimate protective garments may be used as a short-term and temporary measure. Such devices typically take the form of specialized jackets that contain distributed pockets to hold solid carbon dioxide (dry ice), cooled gels or water ice. The microclimate garments are worn over underclothing in order to avoid ice burns. Outer clothing reduces direct heat transfer from the surroundings. It is important that this type of microclimate jacket is changed before the cooling medium is exhausted, as the garment may then become an effective insulator. More sophisticated microclimate suits, incorporating temperature controlled fluids circulating through capillary tubing, have also been manufactured. However, these are expensive and less applicable to mining environments. A workforce that is required to work in hot environments should be trained to recognize the initial symptoms of heat strain and to adopt sensible work habits. The latter include appropriate, but not excessive, rest periods and adequate consumption of cool drinking water. A good dietary balance should be sought that includes sufficient but, again, not excessive salt. Vitamin C supplementation is also regarded as improving heat tolerance (Visagie, 1974). Finally, workers should have been subjected to a process of natural or induced acclimatization prior to being employed in particularly hot conditions (Section 17.7). 17.6 COLD ENVIRONMENTS This chapter is concerned primarily with physiological reactions to heat. However, personnel at mines or other facilities that are located in cold climates or at high altitudes may be subjected to low temperatures for at least part of the year. Even in the more temperate zones, workers in main intake airways may suffer from cold discomfort during winter seasons. It is, therefore, appropriate that we include the effects of cold environments on the human body. 17.6.1 Physiological reactions to cold environments Heat loss from the clothed body in cold surroundings is mainly by convection with lesser amounts by radiation and respiration. The most important climatic parameters in these circumstances are ambient (dry bulb) temperature and air velocity. These may be combined into an equivalent wind chill temperature (Section 17.6.3). As heat loss occurs, the initial behavioural response is to don additional clothing and to increase metabolic heat production by conscious muscular activity. Involuntary physiological reaction is initiated by reductions in either the body core temperature or mean skin temperature and consists of an increase in muscular tension. In skin tissues, this causes the familiar "gooseflesh” and progresses into shivering within localized muscle groups. This may result in metabolic heat generation being raised by up to 120 W/m2. With further cooling, the degree of shivering increases to encompass the whole body, producing as much as 300 W/m2 of metabolic heat and effectively incapacitating the person.

Chapter 17 Physiological reactions to Climatic Conditions Malcolm J. McPherson
34
If the core temperature falls below 35°C, the body thermoregulation system will be affected. Core temperatures of less than 28°C can prove fatal, although successful recovery of individuals has been achieved from core temperatures of less than 20°C. The subjective feeling of comfort depends upon the mean skin temperature and also the surface temperature of the extremities. Commencing from the neutral mean skin temperature of 34°C, this table shows subjective reactions that have been reported for sedentary persons. However, the increased blood flow caused by a medium or hard work rate may enable reduced values of mean skin temperature to be tolerated. The large surface to volume ratio of fingers, toes, and ears maximizes heat loss while the influence of vasoconstriction is particularly effective in reducing blood flow to those areas. The latter is a natural reaction to protect, preferentially, the vital organs within the body core. However, it can give rise to severe discomfort and tissue (frost) damage to the extremities. The following reactions to hand surface temperatures have been reported:
20°C uncomfortably cold 16°C limit of finger dexterity 15°C extremely cold 5°C painful
Skin surface temperatures some 1.5 to 2.0°C higher produce similar reactions at the feet. 17.6.2 Protection against cold environments
Human beings have been described as “tropical animals” inasmuch as our thermoregulation is much more effective in warm environments. In cold conditions we rely more on the behavioural response of donning extra clothing and/or engaging in additional muscular activity.
The first line of defence against any potentially adverse environment in the subsurface is the initial design and subsequent control of the ventilation and air conditioning systems. Methods of heating mine air are discussed in Section 18.4. These are subject to economic limitations and can lead to problems of strata control if the mine is within permafrost. It may, therefore, be necessary to provide means of personal protection against a cold working environment.
Personnel should be instructed on physiological reactions to cold ambient surroundings and, particularly, on the use of protective clothing. The thermal insulating properties of garments depend upon the entrapment of air rather than the fibres of the material. The incorporation of radiation reflective layers can also be helpful. A compromise must be sought between the body movements required to perform the work and the restraint offered by bulky insulated clothing. An ambient temperature of -35°C appears to be the practical limit for many activities while, at -50°C only short term exposure should be permitted. Protection to the hands and feet is particularly important but does, of course, affect dexterity. Auxiliary heating of some 10W to each hand and foot allows activity to continue at even lower temperatures provided that the rest of the body is well insulated.
Facial tissues do not suffer unduly from vasoconstriction. Hence, face masks are usually unnecessary. However, the effects of wind chill can result in freezing of exposed skin. Fur-lined hoods should be used to avoid direct wind on the face at low ambient temperatures. Pre-heating inspired air is not required for healthy individuals for air temperatures down to -45°C.
A limited degree of cold acclimatization can occur in personnel who have been subjected to frequent exposure. An improved blood flow to skin tissues gives increased circulation to the
Mean skin temperature °C
Subjective response
31 uncomfortably cold
30 shivering
29 extremely cold
25 limit of tolerance without numbing

Chapter 17 Physiological reactions to Climatic Conditions Malcolm J. McPherson
35
extremities and reduces the risk of frostbite. Additional heat is also generated by the metabolism of body reserves of adipose (fatty) tissue. 17.6.3 Indices of cold stress A series of experiments were carried out by Siple and Passel (1945) in Antarctica involving rates of cooling by convection and radiation from a plastic cylinder of 5.7 cm diameter whose surface temperature was 33°C. This led to an empirical formulation known as the Wind Chill Index, WCI, which described the rate of heat loss from the cylinder. When expressed in SI units, this becomes
( ) ( )dtuu −−+= 331045.10163.1WCI W/m2 (17.40)
where u = air velocity (m/s) and td = dry bulb temperature (°C)
Although the Wind Chill Index is open to criticism arising from the differences in heat transfer phenomena between a small plastic cylinder and a human body, it has been used as a basis for the more commonly employed Equivalent Wind Chill Temperature, teq . This is defined as the ambient temperature in an airstream moving at 1.79 m/s (4 mph) that gives the same WCI (rate of cooling) as the actual combination of air temperature and velocity. That definition leads to the equation
( ) ( )
22331045.10
33 deq
tuut
−−+−= °C (17.41)
Figure 17.10 Equivalent wind chill temperature (developed from data reported by the U.S. Army Research Institute of Environmental Medicine).
Chapter 17 Physiological reactions to Climatic Conditions Malcolm J. McPherson
36
This relationship may be employed for air velocities not less than 2 m/s. Figure 17.10 gives a graphical depiction of equivalent wind chill temperature. It is important to remember that teq is indicative of a rate of cooling rather than a physical temperature. The ambient temperature, td, controls the limit to which any body can cool and is independent of air velocity. 17.7 HEAT TOLERANCE AND ACCLIMATIZATION In any mine or other subsurface facility where the wet bulb temperature exceeds 25°C, it is advisable to consider means of combatting potential heat strain within the workforce. The return on such efforts is shown not only by a decreased risk of heat illnesses but also improvements in safety statistics and productivity. This section considers procedures of physiological testing and the acclimatization procedures that may be conducted on personnel prior to their employment in hot conditions. Much of the research and development on heat stress and acclimatization procedures for hot mines has been carried out for the gold mining industry of South Africa. Most of the information given in this Section originates from that work (e.g. South African Department of Minerals and Energy, 2002; Bluhm and von Glehn, 2006; Burrows, 1989; Stewart, 1982). Prior to 1990, the primary objective of heat stress procedures practiced in South Africa was to reduce the incidence of heat stroke for persons who worked in deep gold mines. It was not uncommon for wet bulb temperatures to reach 32 °C in stoping areas. Following initial screening and work/heat tolerance tests to identify the heat intolerant, new and returning mine recruits underwent acclimatization procedures over several days in surface-located climatic chambers. For historical interest those former procedures are outlined in Appendix A17.2. Since the early 1990s the approach has changed. First, a determined effort was undertaken to reduce wet bulb temperatures to not more than 28 °C in active mining zones. Secondly, the primary objective of reducing heatstroke has given way to a more general form of risk assessment through an approach known as Heat Stress Management. This also includes revised procedures of initial screening and heat tolerance tests but is followed by a natural progression of supervised on-the-job heat acclimatization. The combination of reduced wet bulb temperatures and the more holistic approach of Heat Stress Management has enabled the elimination of several days spent in surface acclimatization chambers. 17.7.1 Physiological tests 17.7.1.1 Initial screening The initial screening of new or returning recruits who will work in hot conditions in South Africa’s gold mines consists of two parts. First, a general medical examination is carried out on each candidate. In addition to health checks this examination includes the medical, occupational and heat disorder history of each recruit being recorded within a database. Secondly, a separate physical evaluation is carried out to identify features that would indicate unsuitability for physical work in hot environments. These factors include: Age Tolerance to heat declines with age, a trend which accelerates rapidly over the age of 40 years. A general recommendation is that persons of 50 years or more should not normally undertake strenuous activities in hot environments. Body dimensions. Both body mass and Body Mass Index (BMI) should be recorded during the physical examination. The latter is defined as:

Chapter 17 Physiological reactions to Climatic Conditions Malcolm J. McPherson
37
22 m
kgBMIheight
massbody= (17.42)
Table 17.4 gives recommendations of the Department of Minerals and Energy, Mine Health and Safety Inspectorate of South Africa, 2002.
Employee status Criterion/Standard Recommendation
Body mass < 50 kg Unsuitable: reject Body mass 50 to 55 kg Suitable but not for strenuous work BMI: 15 to 29 Suitable BMI: 30 to 35 Suitable if no medical concerns
New or returning recruit
BMI > 35 Unsuitable: reject
Body mass < 45 kg Unsuitable: reject Body mass 45 to 50 kg Suitable if no medical concerns or history of
heat disorders Body mass 45 to 55 kg No allocation to strenuous work
(i.e. M > 160 W/m2) BMI < 15 Unsuitable BMI: 15 to 19 Suitable if no medical concerns or history of
heat disorders BMI: 20 to 29 Suitable BMI: 30 to 35 Suitable if no medical concerns or history of
heat disorders
Existing worker
BMI > 35 Unsuitable
Table 17.4. Body mass and Body Mass Index criteria for physical work in hot environments. Source: Department of Minerals and Energy, Mine Health and Safety Inspectorate of South Africa, 2002.
http://www.dme.gov.za/pdfs/mhs/guidelines/thermal_stress.pdf
17.7.1.2 Heat Tolerance Screening The aim of heat tolerance screening is to identify persons who are likely to suffer from heat stress while working in hot environments. It is also indicative of the physical fitness of the individual. The procedure commences with a rest period of 30 minutes in an environment that feels comfortable to men wearing shorts only. Candidates who have oral temperatures greater than 37 °C at the end of the rest period are excused from the heat tolerance screening and referred for further medical evaluation. The heat tolerance screening itself consists of a 30 minute period during which the test subjects undertake a bench-stepping procedure at a rate of 24 steps per minute to a bench height of 30.5 cm. This approximates to a work rate of 80 W. One step consists of raising the upright body such that both feet are placed on the bench then back to the floor. The climate should be maintained at a dry bulb temperature of 29.5 °C and a wet bulb temperature of 28 + 0.3 °C while the air velocity is maintained within the range 0.3 to 0.5 m/s.

Chapter 17 Physiological reactions to Climatic Conditions Malcolm J. McPherson
38
Individuals whose oral temperature at the end of the test does not exceed 37.6 °C are deemed to be able to acclimatize successfully under supervision in the mine environment. Those with oral temperatures higher than 37.6 °C are recognized as heat intolerant and will not be required to work in hot areas of the mine. 17.7.2 Acclimatization 17.7.2.1 In-situ acclimatization For candidates who have successfully passed the medical, physical and heat tolerance screenings, full acclimatization can be expected within some 12 successive work shifts in hot conditions. During this time physiological changes take place which reduce susceptibility to heat stress. Formal supervision must be provided during the period of acclimatization. Supervisors should be capable of measuring wet and dry bulb temperatures, recognizing signs of ill health and heat stress, ensuring that potable water is available and trained in emergency treatments. Workers in hot conditions should be trained to recognize symptoms of heat stress, not only in themselves but also in fellow workers. The training should also encompass good work practices such as self-pacing of physical work and the use of rest periods. The latter may be imposed by management. It is important to remember that acclimatization does not provide immunity against heat illnesses, including heat stroke, if good work practices are not maintained on a permanent basis. A loss of full acclimatization can occur after missing only a few days of work in hot conditions. Similarly, if exposure to those conditions occurs only intermittently full acclimatization will neither occur nor be maintained. Hence, visits by persons such as senior officials or visitors should take place only while accompanied by acclimatized supervisors. 17.7.2.2 Physiological changes during acclimatization During the process of acclimatization, several significant physiological changes take place that enhance the effectiveness of the body thermoregulation system. These are accompanied by a noticeable psychological improvement. Acclimatization produces a dramatic increase in blood volume, averaging about 25 per cent. This, in turn, results in several beneficial reactions. First, there is an improvement in the response of blood flow conductance to increased metabolic heat production or greater heat stress. Coupled with an enhanced elasticity in the walls of blood vessels, this allows a greater flow of blood both to internal organs and to skin tissues. As a consequence, both core temperature and heartbeat decrease for any given workrate and level of environmental heat stress. There is also a dramatic increase in sweat rate for any given core temperature during acclimatization. Perspiration commences at a lower core temperature, increasing the range and efficiency of evaporative cooling. The improved ability to produce sweat appears also to be associated with the increased blood volume as well as enhanced performance of the sweat glands. Finally, acclimatization raises the mechanical efficiency of the human body, i.e. any given task is achieved with a lower production of metabolic heat. This, again, results in a lower core temperature and reduced thermal strain. The combined effect of the changes obtained through acclimatization is that the worker can perform appropriate tasks in hot conditions more efficiently, with a greatly reduced risk of heat illness, and in a more stable psychological state.
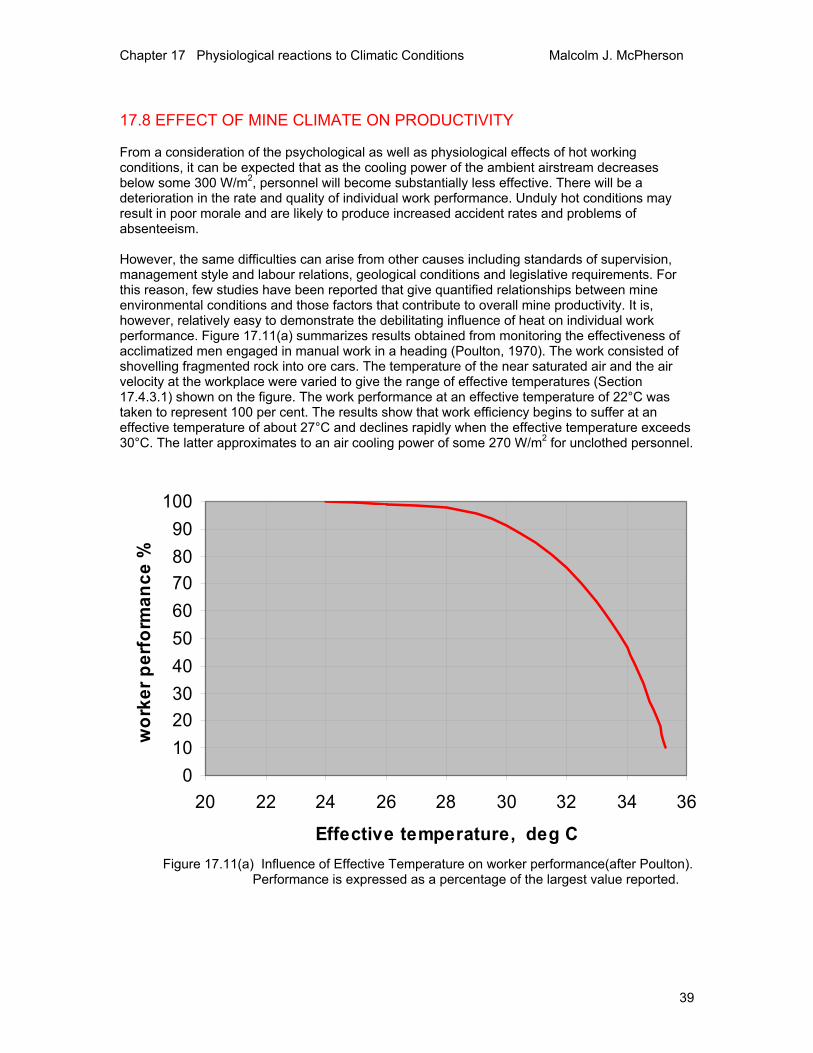
Chapter 17 Physiological reactions to Climatic Conditions Malcolm J. McPherson
39
17.8 EFFECT OF MINE CLIMATE ON PRODUCTIVITY From a consideration of the psychological as well as physiological effects of hot working conditions, it can be expected that as the cooling power of the ambient airstream decreases below some 300 W/m2, personnel will become substantially less effective. There will be a deterioration in the rate and quality of individual work performance. Unduly hot conditions may result in poor morale and are likely to produce increased accident rates and problems of absenteeism. However, the same difficulties can arise from other causes including standards of supervision, management style and labour relations, geological conditions and legislative requirements. For this reason, few studies have been reported that give quantified relationships between mine environmental conditions and those factors that contribute to overall mine productivity. It is, however, relatively easy to demonstrate the debilitating influence of heat on individual work performance. Figure 17.11(a) summarizes results obtained from monitoring the effectiveness of acclimatized men engaged in manual work in a heading (Poulton, 1970). The work consisted of shovelling fragmented rock into ore cars. The temperature of the near saturated air and the air velocity at the workplace were varied to give the range of effective temperatures (Section 17.4.3.1) shown on the figure. The work performance at an effective temperature of 22°C was taken to represent 100 per cent. The results show that work efficiency begins to suffer at an effective temperature of about 27°C and declines rapidly when the effective temperature exceeds 30°C. The latter approximates to an air cooling power of some 270 W/m2 for unclothed personnel.
0102030405060708090
100
20 22 24 26 28 30 32 34 36
Effective temperature, deg C
wor
ker p
erfo
rman
ce %
Figure 17.11(a) Influence of Effective Temperature on worker performance(after Poulton). Performance is expressed as a percentage of the largest value reported.

Chapter 17 Physiological reactions to Climatic Conditions Malcolm J. McPherson
40
Figure 17.11 (b) depicts results reported in a comprehensive study by Howes (1978) using statistics collated by the Chamber of Mines for gold mines in South Africa. The air cooling power used in this figure was an early version of the ACP (A scale).
The correlation between Figures 17.11 (a) and (b) is clear for a labour intensive operation. However, any environment that causes physical discomfort will involve a decline in standards of care and attention. The potential for accidents and loss of production is greater in a mechanized operation where an error made by a single person can have serious repercussions. Low morale and the irritability that often appear as an early symptom of heat strain can easily lead to strained industrial relations. This can have disastrous effects on overall mine profitability. Furthermore, the costs of the additional personnel that are required to compensate for absenteeism in hot mines can be high in an expensive labour market. Failure to create a reasonably comfortable working environment underground not only puts the health and safety of the workforce at risk, it also results in lower productivity and profitability.
50
60
70
80
90
100
100 150 200 250 300 350 400
Air Cooling Power (ACP) W/sq. m
Prod
uctiv
ity p
er c
ent
Figure 17.11(b) Effect of Air Cooling Power on mine productivity (after Howes). Productivity is expressed as a percentage of the largest value reported.

Chapter 17 Physiological reactions to Climatic Conditions Malcolm J. McPherson
41
References ASHRAE (1985, 1989 and 1993). American Society of Heating, Refrigerating and Air Conditioning Engineers. Fundamentals Handbooks. Bluhm, S. and von Glehn, F (2006). Private communication. Botsford, J.H. (1971). A wet globe thermometer for environmental heat measurement. American Industrial Hygiene Assoc. Journal: 38, 264 Brake, R. and Bates, G, (2002). A valid method for comparing and rational and empirical heat stress indices. Ann. Occupational Hygiene, Vol. 46, No.2. pp. 165-174. Published by Oxford University Press. Burrows, J.H. (1989). Private communication. Chamber of Mines of South Africa (1972). Routine mine ventilation measurements. Johannesburg. Ciriello, V.M. and S.H. Snook, 1977. The prediction of WBGT from the Botsball. American Industrial Hygiene Association Journal, 38(June): p. 264-271. Dreosti, A.O. (1935). Problems arising out of temperature and humidity in deep mines of the Witwatersrand. J. Chem, Metall, Min. Soc. of S. Africa, Vol. 36, pp 102-129. duBois, D. and duBois, E.F. (1916). A formula to estimate approximate surface area if height and weight are known. Archives of Internal Medicine. 17: pp. 863-871. Fanger, P.O. (1970). Thermal comfort. Danish Technical Press. Copenhagen. Gagge, J. et al (1969). The prediction of thermal comfort when thermal equilibrium is maintained by sweating. ASHRAE Trans. Vol. 75 Part 2 p.108. Hanoff, J.S.T. (1970). Investigation of the limit of tolerable stresses to men subjected to climatic and working conditions in coal mines. Glückauf-Forschung. Vol. 31 (4). pp. 182-195. Hill, L. Griffith, O.W. and Flack, M. (1916). The measurement of the rate of heat loss on body temperature by convection, radiation and evaporation. Phil. Trans. Royal Soc., Section B (London) Vol. 207 pp 183-220. Houghton, F.C. and Yaglou, C.P. (1923). Determining lines of equal comfort. ASHVE Trans. Vol. 29 pp.163-176 and 361-384. Howes, M.J. (1978). The development of a functional relationship between productivity and the thermal environment. J. Mine Vent. Soc. of S. Africa, Vol. 31, pp 21-38.
International Organisation for Standardization (1982). Hot environments - Estimation of the heat stress on working man, based on the WBGT (wet bulb globe temperature). IS0 Standard 7243 (See also Standard 7730, 1984). Mitchell, D. And Whillier, A. (1972). The cooling power of underground environments. Journ. Mine Ventilation Soc. of S.Africa. Vol 25, pp 140-151.
Chapter 17 Physiological reactions to Climatic Conditions Malcolm J. McPherson
42
NIOSH (1986). Criteria for a recommended standard – Occupational exposure to hot environments, revised criteria. U.S. Dept. of Health and Human Services, USDHHS (NIOSH) publication 86-113. Onkaram, B. et al (1980). Three instruments for assessment of WBGT and a comparison with WGT (Botsball). American Industrial Hygiene Assoc. 41: pp. 634-641. Oohori, T. et al (1984). Comparison of current two-parameter indices of vapor permeation of clothing as factors governing thermal equilibrium and human comfort. ASHRAE Trans. Vol. 90 (2). Poulton, E.C. (1970). Environment and human efficiency. C.C. Thomas, Springfield, Illinois, U.S.A. Siple, P.A. and Passel, C.F. (1945). Measurements of dry atmospheric cooling in subfreezing temperatures. Proc. Americ. Philosophical Soc., Vol. 89, p.177. South African Department of Minerals and Energy, Mine Health and Safety Inspectorate (2002). Guideline for the compilation of a Mandatory Code of Practice for an Occupational Health Programme on Thermal Stress. 78pp. http://www.dme.gov.za/pdfs/mhs/guidelines/thermal_stress.pdf Stewart, J.M. (1982). Environmental engineering in South African mines, Chapters 20 and 21. Mine Ventilation Soc. of S. Africa. Stewart, J.M. and Whillier, A. (1979). A guide to the measurement and assessment of heat stress in gold mines. Journ. Mine Ventilation Soc. of S.A. Vol. 32, No. 9. pp. 169-178. Visagie, M.E. et al (1974). Changes in vitamin A and C levels in black mine workers. S. African Med. Journ. Vol. 48, pp. 2502-2506. Windham, C.H. (1974). The physiological and psychological effects of heat. Chapter 7 The Ventilation of South African Gold Mines. Mine Vent. Soc. of S. Africa. pp 93-137. Wu, H.W. and Gillies, A.D.S. (1997). The development of a personal response heat stress meter calibrated to the range of physiology of the range of employees within the mine workplace. Proc. 6th International Mine Ventilation Congress, Pennsylvania, U.S. pp. 255-261. Published by the Society of Mining Engineers. Yaglou, C.P. and Miller, W.F. (1925). Effective temperatures with clothing. ASHVE Trans. Vol. 31 pp. 89-99.

Chapter 17 Physiological reactions to Climatic Conditions Malcolm J. McPherson
43
APPENDIX A17.1 Listing of the thermoregulation model developed in Section 17.3.6 The program is listed in the original BASIC language in which it was developed and can be translated into any other preferred language suitable for running on a personal computer. Alpha characters are printed in upper case for clarity. The data required are indicated in lines 20 to 100 and the computed parameters identified in lines 560 to 790. The program cycles iteratively, varying the mean skin temperature and other dependent variables until the Air Cooling Power (M scale) equals the input metabolic rate. Mean skin temperatures in excess of 36°C generate a warning message. 10 OPEN "LPT1" FOR OUTPUT AS #1 20 INPUT “TW,TD (deg C),P(kPa) ”,TW,TD,P 30 INPUT "RAD TEMP OF SURROUNDINGS (deg C) ",TR 40 P=1000*P 50 INPUT “RELATIVE AIR VELOCITY (m/s) ",UR 60 INPUT “CLOTHING RESISTANCE, RCL (degC m^2/W) ”,RCL 70 INPUT “CLOTHING AREA RATIO,Fcl ”,FCL 80 INPUT “CLOTH VAPOUR PERMEABILITY EFFICIENCY, Icl “,ICL 90 INPUT “METABOLlC RATE (W/m^2) ”,M 100 INPUT "BODY VIEW FACTOR,Fr ",FR 110 IF UR<3 THEN 140 120 U=UR 130 GOT0 150 140 U=0.8*UR+0.6 150 T=TW 160 HC=.00878*P^.6*SQR(U) 170 GOSUB 930 180 SINT=S 190 GOSUB 1010 200 GOSUB 1050 210 TEX=32.6+(.066*TD)+(0.0002*E) 220 EA=E 230 GOSUB 1080 240 REM 250 REM RESPIRATORY HEAT, BR 260 T=TEX 270 GOSUB 930 280 SEX=S 290 BR=.0000017*M*(SEX-SINT) 300 REM 310 REM CONVECTIVE HEAT, C 320 CNV=(TSK-TD)/(RCL+1/(FCL*HC)) 330 TCL=TSK-CNV*RCL 340 REM RADIATIVE HEAT, R 350 TCL=TSK-CNV*RCL 360 TAV=(TCL+TR)/2+273.15 370 HR=4*5.67E-08*(TAV)^3 380 R=HR*FR*(TCL-TR) 390 REM 400 REM EVAPORATIVE HEAT, EV 410 GOSUB 1190 420 IF TSK>32.5 THEN GOSUB 1410

Chapter 17 Physiological reactions to Climatic Conditions Malcolm J. McPherson
44
430 T=TSK 440 GOSUB 850 450 HE=.0007*HC*L/P 460 GOSUB 810 470 RECL=RCL*P/(.0007*L*ICL) 480 EV=W*(ES-EA)/(RECL+1/(FCL*HE)) 490 ACPM=BR+CNV+R+EV 500 PRINT TSK 510 IF ABS(ACPM-M)<1 THEN 560 520 TSK=TSK-.01*(ACPM-M) 530 W=W1 540 IF TSK>32.5 THEN GOSUB 1410 550 GOT0 310 560 PRINT #1,“ACPM = ”,:PRINT #1,USING “####”;ACPM;:PRINT #1,” W/m^2” 570 PRINT #1,“TCLOTH = ”,:PRINT #1,USING “##.##”;TCL;:PRINT #1,” C “, 580 PRINT #1,“SKIN TEMP = “;:PRINT #1,USING “##.##”;TSK;:PRINT #1, “ C” 590 IF TSK>=36 AND TSK<37 THEN PRINT #1,“***ONSET OF HEAT STRAIN***“:GOTO 610 600 IF TSK>=37 THEN PRINT #1 ,"*** DANGEROUS SKIN TEMPERATURE ***” 610 PRINT #1,”TEXHAUST = “ ,:PRINT #1,USING "##.##";TEX;:PRINT #1," C " 620 PRINT #1, "SWEAT = “ ,:PRINT #1,USING "##.##”;W 630 PRINT #1,”HC = “,:PRINT #1,USING “###.##”;HC;:PRINT #1,” W/m^2 C”, 640 PRINT #1,"HR = ",:PRINT #1,USING “###.##”;HR;:PRINT #1," W/m^2 C” , 650 PRINT #1,"HE = ",:PRINT #1,USING “###.##”;HE;:PRINT #1," W/m^2 Pa", 660 PRINT #1,"FCL = “, FCL 670 PRINT #1,"RECL = “,:PRINT #1,USING "###.###";RECL;:PRINT #1," m^2 Pa/W", 680 PRINT #1,"RCL = “,RCL 690 PRINT #1,"RESP = ",:PRINT #1,USING "###.##";BR;:PRINT #1," W/m^2 “, 700 PRINT #1,“CONV = ",:PRINT #1,USING “###.##”;CNV;:PRINT #1," W/m^2” 710 PRINT #1,"RAD = ",:PRINT #1,USING “###.##”;R;:PRINT #1," W/m^2 “, 720 PRINT #1,"EVAP = ",:PRINT #1,USING "###.##";EV;:PRINT #1," W/m^2" 730 PRINT #1,"SINT = ",:PRINT #1,USING "####.#";SINT*.001;:PRINT #1," kJ/kg ", 740 PRINT #1,"SEX = ",:PRINT #1,USING "####.#";SEX*.001;:PRINT #1," kJ/kg" 750 PRINT #1,"LSK = ",:PRINT #1,USING "#####.#";L*.001;:PRINT #1," kJ/kg ", 760 PRINT #1,"EAIR = ",:PRINT #1,USING “###.##”;EA*.001;:PRINT #1,” kPa" 770 PRINT #1,"ESK = ",:PRINT #1,USING “###.##”;ES*.001;:PRINT #1," kPa “, 780 PRINT #1,"X = “ ,:PRINT #1,USING "##.####”;X;:PRINT #1,” kg/kg dry “ 790 PRINT #1,"MICRO VELOCITY = ";:PRINT #1,USING “##.##”;U;:PRINT #1,” m/s" 800 END 810 REM SAT VAP PRESS 820 ES=610.6*EXP(17.27*T/(237.3+T)) 830 RETURN 840 REM 850 REM LATENT HEAT 860 L=(2502.5-2.386*T)*1000 870 RETURN 880 REM 890 REM MOISTURE CONTENT 900 X=.622*E/(P-E) 910 RETURN 920 REM 930 REM SIGMA HEAT 940 GOSUB 850 950 GOSUB 810 960 E=ES 970 GOSUB 890 980 S=L*X+1005*T

Chapter 17 Physiological reactions to Climatic Conditions Malcolm J. McPherson
45
990 RETURN 1000 REM 1010 REM ACT. MOISTURE CONTENT 1020 X=(S-1005*TD)/(L+1884*(TD-TW)) 1030 RETURN 1040 REM 1050 REM ACT VAP PRESS 1060 E=P*X/(.622+X) 1070 RETURN 1080 REM SKIN TEMP 1090 REM REF GAGGE, 1969 1100 TSK=24.85+.322*TD-.00165*TD*TD 1110 IF W<.9 THEN 1130 1120 TSK=24.49+.249*TD 1130 REM VELOCITY (HC) CORRECTION 1140 DTSK=8.999999E-03*HC*(TSK-TD)*(.15-RCL)/0.15 1150 TSK=TSK-DTSK 1160 REM CLOTHING CORRECTION 1170 TSK=TSK+(RCL/.15) 1180 RETURN 1190 REM SWEAT FRACTION 1200 IF TW> 27.194*EXP(-.004*M) THEN 1230 1210 W=0.06 1220 GOT0 1390 1230 IF TW<33 THEN GOT0 1260 1240 W=1 1250 GOT0 1390 1260 IF M>=200 THEN GOT0 1320 1270 A=-(1.781265E-04-2.544E-07*M+8.557743/M^2.218731) 1280 B=.012095-1.79735E-05*M+1063.187/M^2.31927 1290 C=-(.194294-3.279531E-04*M+46903/M^2.44229) 1300 D=.998117-1.816454E-03*M+92432l/M^2.651246 1310 GOT0 1360 1320 A=-(3.97379E-05+7.075456E-08*M+17.880231/M^2.218441) 1330 B=2.369825E-03+3.359426E-06*M+2211.1688/M^2.316119 1340 C=-(-5.682282E-03+5.86905E-05*M+95583.18/M^2.437565) 1350 D=-.321605+7.958265E-04*M+1875636/M^2.645912 1360 W=D+TW*(C+TW*(B+TW*A)) 1370 IF W<.06 THEN W=.06 1380 IF W>1 THEN W=1 1390 W1=W 1400 RETURN 1410 REM INCREASE W FOR TSK>32.5 1420 IF TSK<38 THEN 1450 1430 W=1 1440 GOT0 1480 1450 DW=SIN((31.85*TSK-762)*.01745)*.5+.5 1460 W=W1+DW 1470 IF W>1 THEN W=1 1480 RETURN
Chapter 17 Physiological reactions to Climatic Conditions Malcolm J. McPherson
46
APPENDIX A17.2 Acclimatization of workers in South African gold mines prior to 1990. This appendix is included for historical interest and is taken from the earlier printed version of this textbook. It reflects the philosophy and procedures of the South African gold mining industry relating to heat stress in underground workers before 1990. The updated procedures at the time of this current writing are outlined in Section 17.7 of the main text. Physiological tests Initial screening An initial screening of recruits for work in wet bulb temperatures of more than 25°C should investigate both body mass and age. Any person with a body mass of less than 50kg is unlikely to have a skin surface area that is sufficient to ensure efficient body cooling. Conversely, individuals with a mass exceeding 100kg have a high and constant metabolic burden in supporting their own weight. No persons in either of these groups should be asked to work in hot environments. After the age of 40 years, the probability of heat stroke increases significantly. Although considerable variation exists between individuals, it is prudent to relocate persons of more than 45 years of age to zones of reduced heat stress. Work capacity tests A simple test of work capacity consists of a ten minute period of constant and controlled activity that requires an oxygen consumption rate of 1.25 litres per minute. At the conclusion of the period, the heartbeat provides an indication of maximum rate of oxygen consumption and, hence, work capacity. Persons with test heartbeats of over 140 bpm should be prohibited from tasks requiring hard manual exertion or from working in conditions of heat stress. If the test results indicate a heartbeat of less than 120 bpm then that individual should be capable of strenuous work. If the wet bulb temperature in the workings does not exceed 27.5°C the initial screening and the work capacity tests are all that are required. Heat tolerance test This more rigorous test may be carried out on persons who have passed both the initial screening and the work capacity tests, and who may be required to work in wet bulb temperatures in excess of 27.5°C. The test consists of requiring the participants to engage in a controlled activity corresponding to an oxygen consumption of 1.25 litres/minute for a period of four hours in a climatic chamber. The wet bulb temperature should be at least equal to the highest value that will be encountered within work areas in the mine. Oral temperatures are taken at intervals of not more than 30 minutes throughout the test and the following criteria applied: If oral temperature –
remains below 37.5°C: person eligible immediately for work in hot mine environment varies between 37.5 and 38.6°C: eligible for short-term or micro-climate acclimatization varies between 38.6 and 40.0°C: eligible for full acclimatization exceeds 40.0°C: test terminated and person classified as heat intolerant
If it is suspected that heat intolerance is caused by a temporary illness or body disorder then the test may be repeated after treatment and recovery. Heat acclimatization The organized process of heat acclimatization may take place over a period of several days during which the participants are subjected to gradually increasing work rates and/or levels of heat stress. During this time, definite physiological changes occur that enable the human body to better resist the adverse effects of a hot environment.

Chapter 17 Physiological reactions to Climatic Conditions Malcolm J. McPherson
47
The first attempts at organized acclimatization for work in hot mines appear to have been carried out in 1926 within the South African gold mining industry (Dreosti). Considerable effort was devoted to the improvement of acclimatization procedures and South Africa seems to have been the only country that provided formal acclimatization for the majority of recruits into deep and hot mines. However, advances in the design of ventilating and air conditioning systems have led to significant improvements in climatic conditions within those mines. The modern philosophy is to promote working environments that do not necessitate full acclimatization procedures. Methods of acclimatization There are essentially three methods of acclimatization for workers in hot environments. The first and, perhaps, most natural is for the individual to spend the first two weeks of underground work in tasks of increasing physical effort (or less frequent rest periods) within the actual mine environment. This may be combined with commencing in relatively cool areas of the mine and progressively moving the participants to locations of increased heat stress through the two week period. Although such "on-the-job” acclimatization appears to be convenient, it does have significant drawbacks. If successful acclimatization is to be achieved, then the process must be monitored and controlled by well-trained supervisors. Work rates, body temperatures and psychrometric conditions must be logged and, if necessary, modifications made to the place or rate of work. Individuals who exhibit signs of heat intolerance must be identified before they suffer unduly from heat strain. Drinking water must be administered at frequent intervals. The difficulty is that such procedures do not blend readily into the production-oriented activities of a working stope or face. It is for this reason that “on-the-job” acclimatization has, in general, been less successful than the more easily controlled procedures. For individuals whose oral temperature does not exceed 38.6°C during a heat tolerance test a shorter period of acclimatization may provide the required degree of protection. The use of micro-climate jackets during acclimatization may be deemed acceptable for candidates who are familiar with underground operations. For the first week in hot conditions, the worker performs his expected rate of work while wearing a micro-climate jacket. This allows the individual to be fully productive during the acclimatization period while, at the same time, offering protection against heat illness. The use of surface or underground climatic chambers designed specifically for fully controlled acclimatization procedures was developed for the South African gold mining industry (Stewart, 1982). The success of those procedures in reducing the incidence of heat stroke and improving productivity led to the widespread use of the technique within that country. The environment within the climatic chamber is maintained at a wet bulb temperature of about 31.7°C and an air velocity of 0.5 m/s. The work consists of stepping on and off a bench at a rate indicated by an audible and visual metronome. The height of the bench is adjusted according to each man's body weight such that every person works at the same rate. This correlates with an oxygen consumption of some 1.4 litres/minute and, hence, is equivalent to hard manual work. The task is carried out for four continuous hours per day over a period of several days. Measurements are made of body temperature, and drinking water is administered every thirty minutes. During the first day of acclimatization, the stepping task is conducted at only half the normal pace for most of the four hours. The time spent on full work rate (oxygen consumption of 1.4 litres/minute) is increased gradually until the final day is entirely at the full rate. The period of acclimatization within a climatic chamber originally encompassed eight days. However, the improvement of conditions underground, coupled with heat tolerance testing have resulted in the acclimatization period being reduced to four days with far fewer men required to undergo it. The ultimate objective is to reduce the wet bulb temperature to less than 27.5°C in all mines at which time acclimatization will no longer be required (Burrows, 1989).