chapter 15 - university of wisconsin– · web viewchapter 15 leverage and the debt-equity...
TRANSCRIPT
15-1
CHAPTER 15
Leverage and the Debt-Equity Mix
QUESTIONS
1. In what way is business leverage similar to physical leverage? Both types of leverage involve magnification. In both, we carefully construct our system to produce the magnified result. The differences are in what is magnified¾income vs. physical force, and what serves as the lever¾fixed costs vs. a mechanical device.
2. Distinguish between operating leverage and financial leverage. Both operating and financial leverage result in the magnification of changes to earnings due to the presence of fixed costs in a company's cost structure. The difference is only the part of the income statement we are looking at. Operating leverage is the magnification on the top half of the income statement¾how EBIT changes in response to changes in sales; the relevant fixed cost is the fixed cost of operating the business. Financial leverage is the magnification on the bottom half of the income statement¾how earnings per share changes in response to changes in EBIT; the relevant fixed cost is the fixed cost of financing, in particular interest.
3. How much choice does a firm have over its operating leverage? Over its financial leverage? Choice over operating leverage depends on the technologies available to a company. Some companies have little control over their operating leverage. For example, airlines¾which have no substitute for airplanes and their associated support systems¾can only operate with a large investment in fixed assets that create fixed costs. Other companies have a significant degree of control over their operating leverage. Many manufacturing companies, for example, can choose to produce using automated equipment or piecework labor. By contrast, most firms have total control over their financial leverage through their choice of financing (the exception is small firms that have limited access to financial markets, hence limited financing alternatives). A company can increase its financial leverage by using debt financing and can avoid financial leverage through financing with equity.
4. Describe the way in which earnings per share responds to changing EBIT in a firm with:a. No fixed financing costs. A firm with no fixed financing costs has no financial leverage.
In such a firm, earnings per share will rise and fall with EBIT by the same percentage. For example, a 15% increase in EBIT will result in a 15% increase in EPS; a 9% decrease in EBIT will result in a 9% decrease in EPS.
15-2 Chapter 15
b. Some fixed financing costs. A firm with some fixed financing costs does have financial leverage. In such a firm, earnings per share will rise and fall with EBIT by a greater percentage. For example, a 15% increase in EBIT will result in a more-than-15% increase in EPS; a 9% decrease in EBIT will result in a more-than-9% decrease in EPS.
5. How does a firm's financial leverage affect: Financial leverage changes a firm's returns and risk.a. Its profitability? Financial leverage changes a firm's earnings per share. To the left of
the indifference point (lower EBIT) between financing alternatives (refer to Figure 15.4, p. 533) financial leverage reduces EPS. To the right of the indifference point (greater EBIT) EPS is increased as the firm takes on financial leverage. This observation indicates the importance of knowing the indifference point and where a company's level of EBIT is relative to it.
b. Its level of risk? Financial leverage increases the volatility of a firm's earnings per share. As a firm increases its financial leverage, its EPS will rise and fall by magnified amounts in response to changes in EBIT. This makes the EPS stream riskier for investors. Also, the possibility that EPS could be lower than if there were less financial leverage (if EBIT is left of the indifference point) and the power over the firm given to creditors should the firm have difficulty paying its debts create additional risks for shareholders.
6. A firm is considering two alternative capital structures, and has calculated its profitability at various EBIT levels under each structure. What should the firm do if its projected EBIT is:a. Below the indifference point? In this case, choose the capital structure with the lower
degree of financial leverage. If EBIT is below (to the left of) the financing indifference point, higher financial leverage would decrease EPS (lower return) as it increases the volatility of the EPS stream (higher risk). However, lower financial leverage would increase EPS (higher return) and decrease the volatility of the EPS stream (lower risk), the combination preferred by risk-averse investors.
b. Above the indifference point? In this case, the choice of capital structure is not obvious, since there is a tradeoff between the effects of financial leverage on risk and return. If EBIT is above (to the right of) the indifference point, higher financial leverage would increase EPS (higher return) but also increase the volatility of the EPS stream (higher risk). Lower financial leverage would decrease EPS (lower return) and decrease the volatility of the EPS stream (lower risk). Further analysis is required to identify which capital structure provides investors with the best risk-return combination.
7. Compare and contrast the “net income approach,” “net operating income approach,” and “traditional approach” to the optimal debt-equity mix. Which assumptions do you find reasonable? Unreasonable? The net income approach, net operating income approach, and traditional approach are three theoretical frameworks for how a company should set its debt-equity mix. All three examine how a company's cost of capital changes with the debt-equity mix and search for the lowest value of the cost of capital, hence the

Leverage and the Debt-Equity Mix 15-3
maximum value of the firm, to identify the best mix. They reach different conclusions because they make different assumptions about creditors' and investors' reactions to increasing debt. Each of us will have our own feelings about the reasonableness of the assumptions. Without going into the Modigliani-Miller mathematics, the assumptions of the traditional approach usually seem most reasonable to most people.(1) The net income approach makes the simplest assumptions, that neither creditors nor
investors increase their required rates of return as a company takes on debt. The cost of capital declines as higher-cost equity is replaced with lower-cost debt. This approach concludes that the optimal financing mix is all debt.
(2) The net operating income approach assumes that creditors do not increase their required rate of return as a company takes on debt, but investors do. Further, the rate at which investors increase their required rate of return as the financing mix is shifted toward debt exactly offsets the weighting away from the more expensive equity and toward the cheaper debt. The result is that the cost of capital remains constant regardless of the financing mix. This approach concludes that there is no optimal financing mix¾any mix is as good as any other.
(3) The traditional approach assumes that both creditors and investors increase their required rates of return as a company takes on debt. At first this increase is small, and the weighting toward lower-cost debt pushes the cost of capital down. Eventually, the rate at which creditors and investors increase their required rates of return accelerates and dominates the weighting toward debt, pushing the cost of capital back upward. The result is that the cost of capital declines with debt and reaches a minimum point before rising again. This approach concludes that there is a optimal financing mix consisting of some debt and some equity.
8. What role does each of MM's assumptions play in their theory of the debt-equity mix? MM's key assumptions and the role played by each are:(1) Unlimited borrowing and lending is available to all market participants at one rate of
interest. Role: makes the cost of personal and corporate borrowing and lending the same.(2) Individual margin borrowing is secured by the shares purchased, the borrower's liability
is limited to the value of these shares, there are no costs to bankruptcy. Role: makes the risk of personal and corporate borrowing and lending the same.
(3) All companies can be grouped into equivalent risk classes. Role: enables investors to identify companies with identical business risk.
(4) Capital markets are perfect. Role: permits investors to easily and costlessly arbitrage between securities of companies which differ only in their financing mix.
(5) There are no corporate income taxes. Role: prevents the tax code from making debt financing more valuable by allowing interest and not dividends as a tax deduction.
(6) Shareholders are indifferent to the form of their returns, all returns are taxed at the same rate. Role: prevents investors from seeing any difference in value between interest, dividends, and capital gains.
15-4 Chapter 15
9. Describe “homemade leverage.” Homemade leverage is investors' method of substituting their own borrowing or lending for corporate borrowing. Investors who want more leverage than a company has taken on can buy the company's stock on margin¾that is, borrow money from a broker and use the borrowed funds to pay for a portion of the stock¾in order to add to the corporate borrowing. Investors who want less leverage than the company has taken on can invest a portion of their funds in a risk-free investment to offset some of the corporate borrowing. MM argued that homemade leverage was a perfect substitute for corporate borrowing, given their assumptions. As a result, investors do not care how much debt any firm has since they can use homemade leverage to adjust their overall debt exposure to precisely reproduce the effect of any level of corporate debt on their returns and risk.
10. Is Professor Miller's personal tax model relevant in today's tax environment? Miller's personal tax model examined the effect of personal income taxes on the debt-equity mix decision. He observed that personal income taxes in the U.S. favor equity financing since profits from equity investments come primarily in the form of capital gains which are taxed later and at potentially lower rates than interest income from debt investments. Miller determined that the bias in personal income taxes toward equity essentially offset the bias toward debt in the corporate income tax code and concluded that this supported the original MM conclusion that the financing mix is irrelevant to a company's value. Since the time Miller wrote, the difference between the tax rates on ordinary income and capital gains has narrowed, somewhat weakening his argument. With today's personal tax rate structure, it is likely that the bias toward debt from the corporate income tax dominates the favoring of equity by personal taxes. However, some politicians continue to advocate for further reductions in capital gains tax rates; if this happens, we will once again move closer to Miller's conclusions.
11. What are the variables that enter compromise theory? What is the effect of each on the optimal debt-equity mix? In compromise theory, the value of a levered firm equals the value of the same firm without leverage modified by the impact of three factors:(1) Corporate income taxes ¾ the bias toward debt in the corporate income tax code adds
value to companies with debt financing.(2) Bankruptcy costs ¾ the increased probability of loss should a company be unable to
service its debt subtracts value from companies with debt financing.(3) Agency costs ¾ the increased difficulty of aligning management actions with shareholder
needs in a company with debt subtracts value from companies with debt financing.
12. Define the meaning of each letter of “FRICTO,” and give an illustration of each. FRICTO is an acronym summarizing important issues that affect the debt-equity mix decision in practice:(1) F = flexibility ¾ the impact of alternative financing choices on the firm's future ability to
raise funds in any form required. A company with flexibility will not be shut out of the financial markets nor forced to take a type of financing that is not its preferred choice.

Leverage and the Debt-Equity Mix 15-5
(2) R = risk ¾ the impact of alternative financing choices on the risks faced by the firm and its stakeholders. In general, taking on additional debt adds to the risks of creditors and shareholders.
(3) I = income ¾ the impact of alternative financing choices on the firm's income stream. A firm with EBIT above the financing indifference point that increases its debt will increase its earnings per share.
(4) C = control ¾ the impact of alternative financing choices on each shareholder's amount of control of the firm. In general, selling additional shares of common equity will dilute each shareholder's control.
(5) T = timing ¾ the impact of market conditions on alternative financing choices. Financial market conditions often favor one or another kind of financing.
(6) O = other ¾ the impact of alternative financing choice on other issues and vice versa. An example is the ability to use collateral to reduce the cost and risks of debt financing.
13. What is meant by the “pecking order approach”? Give three explanations why it is an observed phenomenon. The pecking order approach is a sequence of raising financing that many companies seem to follow, even though it ignores the recommendations of the various debt-equity-mix theories. The approach is to finance first with retained earnings, second with payables and bank debt, third with bonds and other more complex debt, and fourth with common stock issues. Three explanations for the pecking order approach are:(1) It is the easiest way for financial managers to obtain funds since it requires the least
amount of work and limits the need for potentially complex negotiations.(2) It raises funds in the order of low to high flotation costs, keeping these costs to a
minimum.(3) The financial markets often take the announcement of a stock sale as negative
information, assuming that management would only sell new shares if its share price were high, hence the stock was overvalued. When management announces a stock sale, it signals this previously inside information (asymmetric information) to the markets. By putting stock sales last on the list, the financial manager minimizes the possibility of this reduction in the firm's share price taking place.
PROBLEMS

15-6 Chapter 15
SOLUTION - PROBLEM 15-1
(a) Construct an income statement
Sales $5,000,000-Variable costs 2,250,000 ¬¾ 45% of $5 millionContribution 2,750,000
-Fixed costs 1,000,000EBIT 1,750,000
-Interest 0EBT 1,750,000
-Taxes 612,500 ¬¾ 35% of $1,750,000EAT 1,137,500
¸ #shares 1,000,000EPS $1.14
From the statement: EBIT = $1,750,000EPS = $1.14
(b) Redo the income statement
Sales up 5% Sales down 5%Sales $5,250,000 $4,750,000
-Variable costs 2,362,500 2,137,500 ¬¾ 45%Contribution 2,887,500 2,612,500
-Fixed costs 1,000,000 1,000,000 ¬¾ no changeEBIT 1,887,500 1,612,500
-Interest 0 0EBT 1,887,500 1,612,500
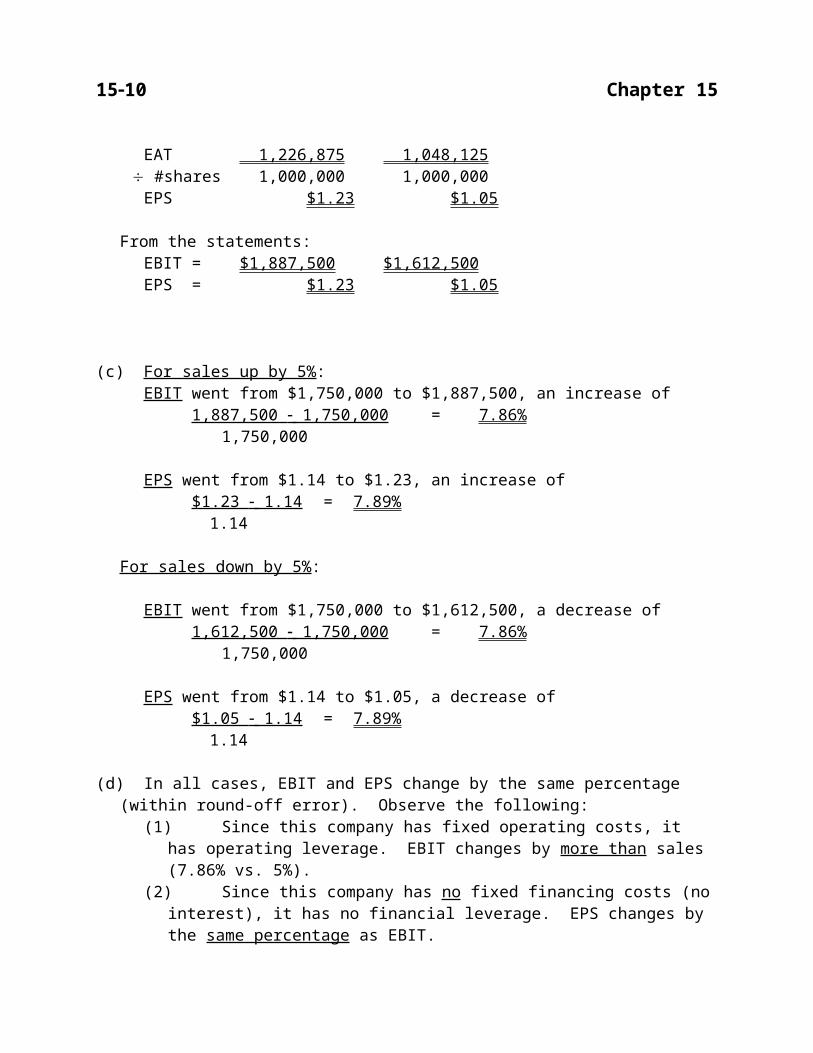
-Taxes 660,625 564,375 ¬¾ 35%EAT 1,226,875 1,048,125
¸ #shares 1,000,000 1,000,000EPS $1.23 $1.05
From the statements:EBIT = $1,887,500 $1,612,500EPS = $1.23 $1.05
(c) For sales up by 5%:EBIT went from $1,750,000 to $1,887,500, an increase of

Leverage and the Debt-Equity Mix 15-7
1,887,500 - 1,750,000 = 7.86%1,750,000
EPS went from $1.14 to $1.23, an increase of$1.23 - 1.14 = 7.89%
1.14
For sales down by 5%:
EBIT went from $1,750,000 to $1,612,500, a decrease of1,612,500 - 1,750,000 = 7.86%
1,750,000
EPS went from $1.14 to $1.05, a decrease of$1.05 - 1.14 = 7.89%
1.14
(d) In all cases, EBIT and EPS change by the same percentage (within round-off error). Observe the following:
(1) Since this company has fixed operating costs, it has operating leverage. EBIT changes by more than sales (7.86% vs. 5%).
(2) Since this company has no fixed financing costs (no interest), it has no financial leverage. EPS changes by the same percentage as EBIT.
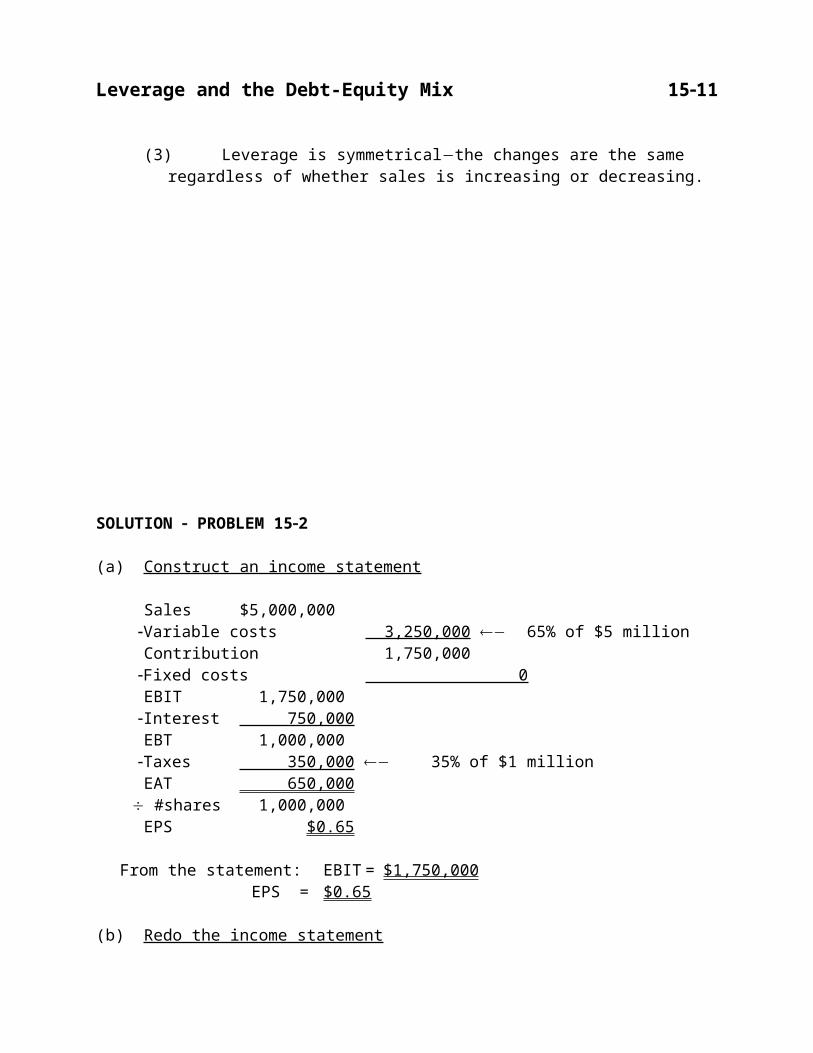
(3) Leverage is symmetrical¾the changes are the same regardless of whether sales is increasing or decreasing.
SOLUTION - PROBLEM 15-2
(a) Construct an income statement
15-8 Chapter 15
Sales $5,000,000-Variable costs 3,250,000 ¬¾ 65% of $5 millionContribution 1,750,000
-Fixed costs 0EBIT 1,750,000
-Interest 750,000EBT 1,000,000
-Taxes 350,000 ¬¾ 35% of $1 millionEAT 650,000
¸ #shares 1,000,000EPS $0.65
From the statement: EBIT = $1,750,000EPS = $0.65
(b) Redo the income statement
Sales up 5% Sales down 5%Sales $5,250,000 $4,750,000
-Variable costs 3,412,500 3,087,500 ¬¾ 65%Contribution 1,837,500 1,662,500
-Fixed costs 0 0 ¬¾ still 0EBIT 1,837,500 1,662,500
-Interest 750,000 750,000EBT 1,087,500 912,500
-Taxes 380,625 319,375 ¬¾ 35%EAT 706,875 593,125
¸ #shares 1,000,000 1,000,000EPS $0.71 $0.59
From the statements:EBIT = $1,837,500 $1,662,500EPS = $0.71 $0.59
(c) For sales up by 5%:EBIT went from $1,750,000 to $1,837,500, an increase of
1,837,500 - 1,750,000 = 5.00%1,750,000
EPS went from $0.65 to $0.71, an increase of$0.71 - 0.65 = 9.23%
0.65

Leverage and the Debt-Equity Mix 15-9
For sales down by 5%:
EBIT went from $1,750,000 to $1,662,500, a decrease of1,662,500 - 1,750,000 = 5.00%
1,750,000
EPS went from $0.65 to $0.59, a decrease of$0.59 - 0.65 = 9.23%
0.65
(d) EPS changes by more than EBIT in both cases. Observe the following:(1) Since this company has no fixed operating costs, it has no operating leverage. EBIT
changes by the same percentage as sales (both by 5.00%).(2) Since this company has fixed financing costs (interest), it has financial leverage. EPS
changes by a greater percentage than EBIT (9.23% vs. 5.00%).(3) Leverage is symmetrical¾the changes are the same regardless of whether sales is
increasing or decreasing.
SOLUTION - PROBLEM 15-3
(a) Alternative #1 Alternative #2EBIT 1,000,000 1,000,000
-Interest 250,000 350,000EBT 750,000 650,000
-Taxes 262,500 227,500 ¬¾ 35%EAT 487,500 422,500
¸ #shares 200,000 150,000EPS $2.44 $2.82
(b) Alternative #1 Alternative #2EBIT 1,100,000 1,100,000
-Interest 250,000 350,000EBT 850,000 750,000
-Taxes 297,500 262,500 ¬¾ 35%
15-10 Chapter 15
EAT 552,500 487,500¸ #shares 200,000 150,000
EPS $2.76 $3.25
(c) Alternative #1 Alternative #2EBIT 900,000 900,000
-Interest 250,000 350,000EBT 650,000 550,000
-Taxes 227,500 192,500 ¬¾ 35%EAT 422,500 357,500
¸ #shares 200,000 150,000EPS $2.11 $2.38
(d) Alternative #2 has the greater amount of leverage since it has higher fixed costs (interest). In these examples, EBIT is high enough so that Alternative #2 provides the greater amount of EPS, hence the higher returns. But alternative #2 also has the higher level of risk. Under Alternative #1, EPS swings from $2.44 down to $2.11(-13.52%) and up to $2.76(+13.11%). Under Alternative #2, EPS swings from $2.82 down to $2.38(-15.60%) and up to $3.25(+15.25%), a greater range in percentage terms. There is a tradeoff here between returns and risk.
SOLUTION - PROBLEM 15-4
(a) Alternative #1 Alternative #2EBIT 8,000,000 8,000,000
-Interest 2,250,000 4,000,000EBT 5,750,000 4,000,000
-Taxes 2,012,500 1,400,000 ¬¾ 35%EAT 3,737,500 2,600,000
¸ #shares 1,000,000 800,000EPS $3.74 $3.25
(b) Alternative #1 Alternative #2EBIT 9,200,000 9,200,000
-Interest 2,250,000 4,000,000EBT 6,950,000 5,200,000
-Taxes 2,432,500 1,820,000 ¬¾ 35%EAT 4,517,500 3,380,000
Leverage and the Debt-Equity Mix 15-11
¸ #shares 1,000,000 800,000EPS $4.52 $4.23
(c) Alternative #1 Alternative #2EBIT 6,800,000 6,800,000
-Interest 2,250,000 4,000,000EBT 4,550,000 2,800,000
-Taxes 1,592,500 980,000 ¬¾ 35%EAT 2,957,500 1,820,000
¸ #shares 1,000,000 800,000EPS $2.96 $2.28
(d) Alternative #2 has the greater amount of leverage since it has higher fixed costs (interest). In this example, however, EBIT is not high enough for Alternative #2 to provide the greater returns¾Alternative #2 has lower returns (lower EPS) than Alternative #1. Also, Alternative #2 has the higher level of risk. Under Alternative #1, EPS swings from $3.74 down to $2.96(-20.86%) and up to $4.52(+20.86%). Under Alternative #2, EPS swings from $3.25 down to $2.28(-29.85%) and up to $4.23(+30.15%), a greater range in percentage terms. Alternative #1 is clearly preferable to Alternative #2.
SOLUTION - PROBLEM 15-5
(a) Try a couple of values for EBIT and calculate EPS for each:Plan A: EBIT = $500,000 ¾® EPS = $0
EBIT = $3,000,000 ¾® EPS = $4.06Plan B: EBIT = $800,000 ¾® EPS = $0
EBIT = $3,000,000 ¾® EPS = $5.72
Plot these points and join them with a straight line:

15-12 Chapter 15
1 2 3
1,300,000
1
2
3
4
5
6
EBIT ($million)
EPS ($)
A
B
(b) (EBIT - i A)(1 - t) = (EBIT - i B)(1 - t) SharesA SharesB
(EBIT - 500,000)(1 - .35) = (EBIT - 800,000)(1 - .35) 400,000 250,000
400,000(EBIT - 800,000) = 250,000(EBIT - 500,000)400,000EBIT - 320,000,000,000 = 250,000EBIT - 125,000,000,000150,000EBIT = 195,000,000,000
EBIT = 1,300,000
(c)EPS = (EBIT - i)(1 - t)
#shares
Use either alternative, since EPS is the same at this level of EBIT. Using Alternative A:
EPS = (1,300,000 - 500,000)(1 - .35) = 800,000(.65) = $1.30400,000 400,000
(d) Looking at the graph, EPS is higher:Plan A - left of break-even, i.e., for EBIT < $1,300,000Plan B - right of break-even, i.e., for EBIT > $1,300,000
SOLUTION - PROBLEM 15-6

Leverage and the Debt-Equity Mix 15-13
(a) Try a couple of values for EBIT and calculate EPS for each:Plan X: EBIT = $2,000,000 ¾® EPS = $0
EBIT = $6,000,000 ¾® EPS = $10.40Plan Y: EBIT = $1,200,000 ¾® EPS = $0
EBIT = $6,000,000 ¾® EPS = $6.93
Plot these points and join them with a straight line:
(b) (EBIT - i X)(1 - t) = (EBIT - i Y)(1 - t)
SharesX SharesY
(EBIT - 2,000,000)(1 - .35) = (EBIT - 1,200,000)(1 - .35) 250,000 450,000
250,000EBIT - 300,000,000,000 = 450,000EBIT - 900,000,000,000200,000EBIT = 600,000,000,000
EBIT = 3,000,000
(c) EPS = (EBIT - i)(1 - t) #shares
Use either plan, since EPS is the same at this level of EBIT. Using Plan X:
EPS = (3,000,000 - 2,000,000)(1 - .35) = 1,000,000(.65) = $2.60250,000 250,000
(d) Looking at the graph, EPS is higher:

15-14 Chapter 15
Plan X - right of break-even, i.e., for EBIT > $3,000,000Plan Y - left of break-even, i.e., for EBIT < $3,000,000
SOLUTION - PROBLEM 15-7
(a) The optimal debt-equity mix is the one which minimizes the cost of capital.
(b)Debt Percent Cost of Percent Cost of Cost ofratio : debt × debt + equity × equity = capital 0% : 0% 4.0% 100% 10.5% 10.50%10 : 10 4.0 90 11.0 10.3020 : 20 4.0 80 11.6 10.0830 : 30 4.2 70 12.4 9.94 ¬ù40 : 40 4.5 60 13.6 9.96 ú50 : 50 4.9 50 15.3 10.10 ú60 : 60 5.4 40 17.8 10.36 ú70 : 70 6.2 30 21.5 10.79 ú80 : 80 7.5 20 26.0 11.20 ú
ú(c) The optimal mix is 30% debt and 70% equity. At this mix, the cost of ¬û
capital reaches its minimum value of 9.94%.
(d) The traditionalists argue that both debt and equity investors increase their required rates of return as the firm takes on more debt due to the increasing risk they must bear. The change is slow at first, as a small amount of debt does not cause much risk, but required rates rise more rapidly as the mix continues to move toward more debt.
SOLUTION - PROBLEM 15-8
(a)

Leverage and the Debt-Equity Mix 15-15
Debt Percent Cost of Percent Cost of Cost ofratio : debt × debt + equity × equity = capital 0% : 0% 3.5% 100% 9.0% 9.00%10 : 10 3.5 90 9.0 8.4520 : 20 3.5 80 9.2 8.0630 : 30 3.5 70 9.6 7.7740 : 40 3.7 60 10.2 7.60 ¬ù50 : 50 4.0 50 11.4 7.70 ú60 : 60 4.5 40 13.0 7.90 ú70 : 70 5.2 30 15.2 8.20 ú80 : 80 6.2 20 18.2 8.60 ú
ú(b) The optimal mix is 40% debt and 60% equity. At this mix, the cost of ¬û
capital reaches its minimum value of 7.60%.
(c)Debt Cost of Cost ofratio debt Increase equity Increase 0% 3.5%ñ 0 9.0%ñ 010 3.5 ñ 0 9.0 ñ 0.2%20 3.5 ñ 0 9.2 ñ 0.4%30 3.5 ñ 0.2% 9.6 ñ 0.6%40 3.7 ñ 0.3% 10.2 ñ 1.2%50 4.0 ñ 0.5% 11.4 ñ 1.6%60 4.5 ñ 0.7% 13.0 ñ 2.2%70 5.2 ñ 1.0% 15.2 ñ 3.0%80 6.2 18.2
The pattern is the same for both debt and equity. Small increases in the debt ratio do not change creditors' nor stockholders' required returns. Larger debt ratios raise required returns, and by an accelerating rate. Stockholders' required rate of return rises faster than creditors' as they bear more risk.

15-16 Chapter 15
(d)Debt Cost of Cost ofratio : equity - debt = Difference
0% : 9.0% 3.5% 5.5%10 : 9.0 3.5 5.520 : 9.2 3.5 5.730 : 9.6 3.5 6.140 : 10.2 3.7 6.550 : 11.4 4.0 7.460 : 13.0 4.5 8.570 : 15.2 5.2 10.080 : 18.2 6.2 12.0
These differences confirm the observations of part (c). The cost of equity rises at a faster rate than the cost of debt due to the greater risk assumed by stockholders.
SOLUTION - PROBLEM 15-9
(a) The compromise theory relationship is:
VLEVERED = VUNLEVERED + CT - BC - AC
Debtratio : VUNLEVERED + CT - BC - AC = VLEVERED 0% : 35,000 0 0 0 35,00010 : ½ 1,000 0 200 35,800 ¬ù20 : ½ 2,000 1,000 400 35,600 ï30 : ½ 3,000 2,000 700 35,300 ï40 : ½ 4,000 4,000 1,100 33,900 ï50 : ½ 5,000 7,000 1,600 31,400 ï60 : ½ 6,000 11,000 2,200 27,800 ï70 : ½ 7,000 16,000 2,900 23,100 ï80 : ¯ 8,000 22,000 3,700 17,300 ï
ï(b) The optimal mix is 10% debt and 90% equity. At this mix, the value of ¬û
the firm reaches its highest (optimal) value of $35,800,000.
(c) The "acceptable range" appears to be from a little over 0% debt through about 30% debt. In this region, the firm's value seems to hold close to $35.5 million.
(d) The corporate tax numbers (CT) increase at a constant rate with the debt ratio since they are related to it in a linear fashion. More debt ® more interest ® more tax deductions ® more

Leverage and the Debt-Equity Mix 15-17
present value of tax benefits. The bankruptcy cost (BC) and agency cost (AC) numbers, on the other hand, reflect increasing risk perceptions which grow at an accelerating rate as the debt ratio increases.
SOLUTION - PROBLEM 15-10
(a) The compromise theory relationship is:VLEVERED = VUNLEVERED + CT - BC - AC
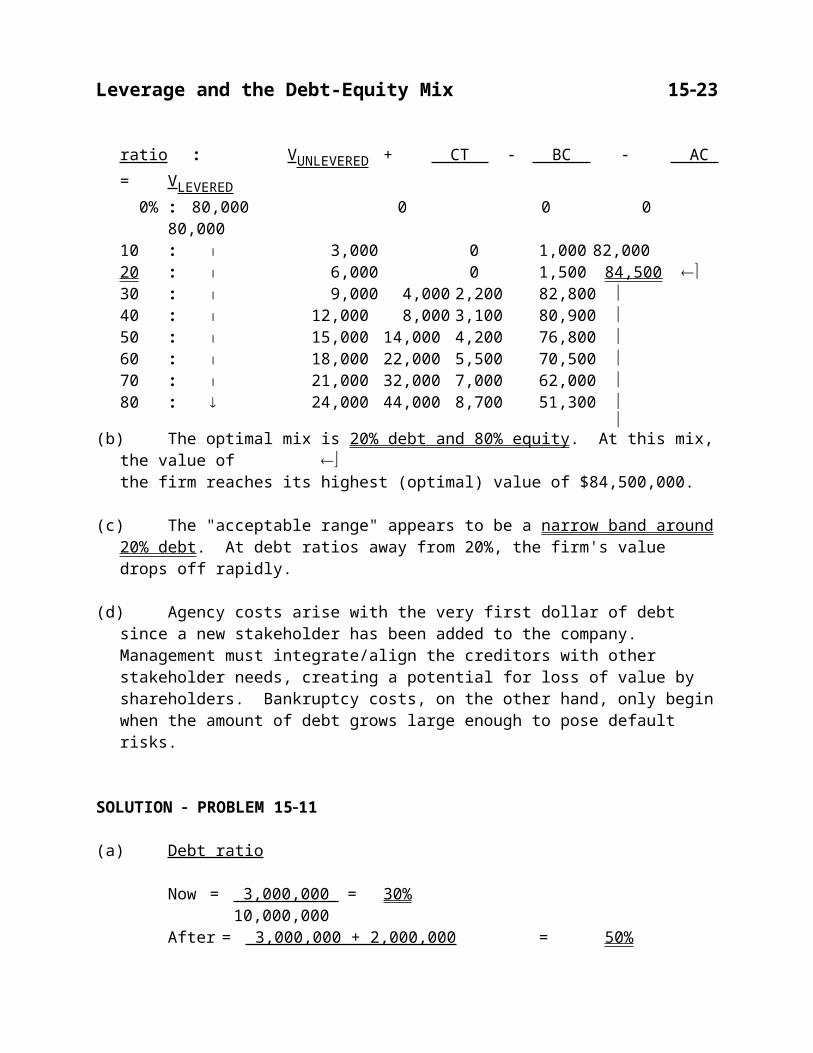
Debtratio : VUNLEVERED + CT - BC - AC = VLEVERED 0% : 80,000 0 0 0 80,00010 : ½ 3,000 0 1,000 82,00020 : ½ 6,000 0 1,500 84,500 ¬ù30 : ½ 9,000 4,000 2,200 82,800 ï40 : ½ 12,000 8,000 3,100 80,900 ï50 : ½ 15,000 14,000 4,200 76,800 ï60 : ½ 18,000 22,000 5,500 70,500 ï70 : ½ 21,000 32,000 7,000 62,000 ï80 : ¯ 24,000 44,000 8,700 51,300 ï
ï(b) The optimal mix is 20% debt and 80% equity. At this mix, the value of ¬û
the firm reaches its highest (optimal) value of $84,500,000.
(c) The "acceptable range" appears to be a narrow band around 20% debt. At debt ratios away from 20%, the firm's value drops off rapidly.
(d) Agency costs arise with the very first dollar of debt since a new stakeholder has been added to the company. Management must integrate/align the creditors with other stakeholder needs, creating a potential for loss of value by shareholders. Bankruptcy costs, on the other hand, only begin when the amount of debt grows large enough to pose default risks.
SOLUTION - PROBLEM 15-11
(a) Debt ratio
Now = 3,000,000 = 30%10,000,000
After = 3,000,000 + 2,000,000 = 50%10,000,000

15-18 Chapter 15
(b) There would be $5,000,000 of debt after the change:
Amount Proportion Cost Proportion ́ Cost 3,000,000 60% 5% 3.00%2,000,000 40% 6.5% 2.60
5.60%
(c) Now:Proportion Cost Proportion ́ Cost
Debt 30% 5% 1.50%Equity 70% 12% 8.40
9.90%After:
Debt 50% 5.6% 2.80%Equity 50% 14.0% 7.00
9.80%
(d) Other things equal, yes - alter the debt-equity mix. This will reduce the cost of capital and increase the value of the firm.
SOLUTION - PROBLEM 15-12
(a) Debt ratio
Now = 40,000,000 = 80%50,000,000
After = 40,000,000 - 15,000,000 = 50%50,000,000
(b) Cost of Capital
Now:Proportion Cost Proportion ́ Cost
Debt 80% 10% 8.00%Equity 20% 19% 3.80
11.80%
After:Debt 50% 10% 5.00%Equity 50% 12% 6.00
11.00%

Leverage and the Debt-Equity Mix 15-19
(c) Refunding the 10% debt:
Debt 50% 6% 3.00%Equity 50% 12% 6.00
9.00%
(d) Yes - alter the mix and refund the expensive debt. The combined refinancing reduces the cost of capital from 11.80% to 9%, significantly increasing the value of the firm.

15B-1
APPENDIX 15B
Measuring the Degree of Leverage
PROBLEMS
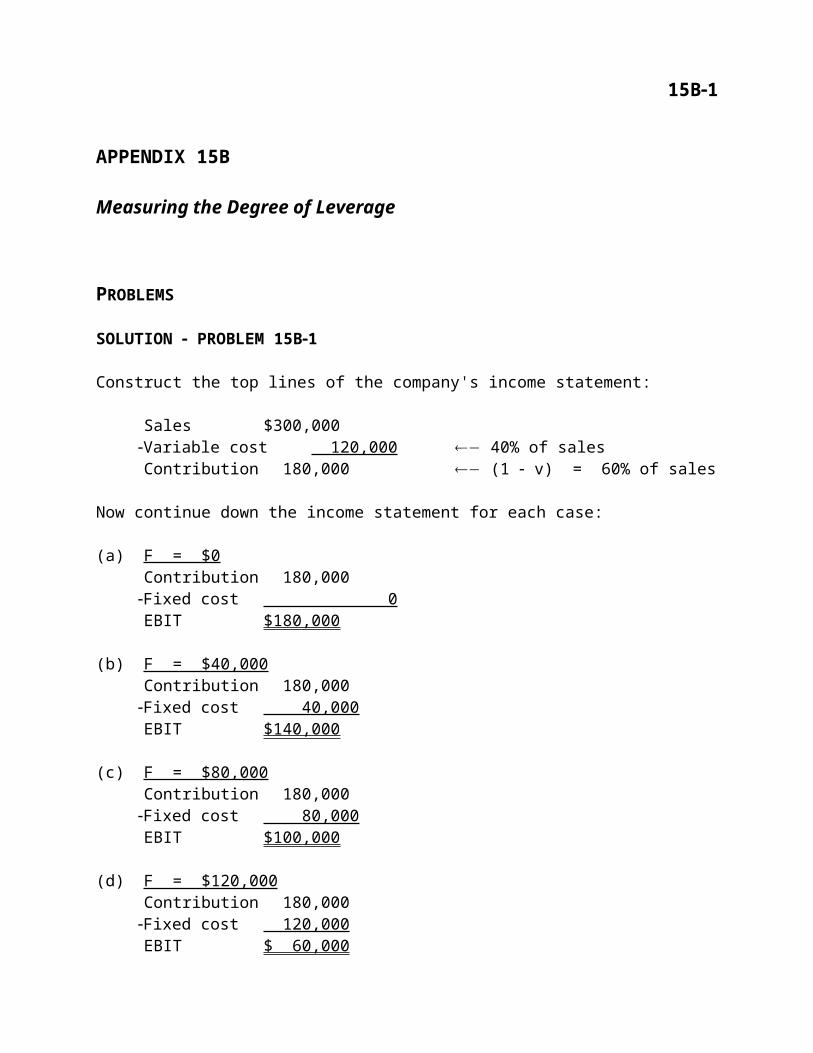
SOLUTION - PROBLEM 15B-1
Construct the top lines of the company's income statement:
Sales $300,000-Variable cost 120,000 ¬¾ 40% of salesContribution 180,000 ¬¾ (1 - v) = 60% of sales
Now continue down the income statement for each case:
(a) F = $0Contribution 180,000
-Fixed cost 0EBIT $180,000
(b) F = $40,000Contribution 180,000
-Fixed cost 40,000EBIT $140,000
(c) F = $80,000Contribution 180,000
-Fixed cost 80,000EBIT $100,000
(d) F = $120,000Contribution 180,000
-Fixed cost 120,000EBIT $ 60,000
SOLUTION - PROBLEM 15B-2

15B-2 Appendix 15B
Construct the top lines of the company's income statement:
Sales $1,750,000-Variable cost 1,137,500 ¬¾ 65% of salesContribution 612,500 ¬¾ (1 - v) = 35% of sales
Now continue down the income statement for each case:
(a) F = $0Contribution 612,500
-Fixed cost 0EBIT $612,500
(b) F = $150,000Contribution 612,500
-Fixed cost 150,000EBIT $462,500
(c) F = $300,000Contribution 612,500
-Fixed cost 300,000EBIT $312,500
(d) F = $450,000Contribution 612,500
-Fixed cost 450,000EBIT $162,500
SOLUTION - PROBLEM 15B-3

Measuring the Degree of Leverage 15B-3
Redo the income statements of problem 15B-1 with sales of $400,000:
(a) (b) (c) (d) Sales $400,000 $400,000 $400,000 $400,000
-Variable cost� 160,000 160,000 160,000 160,000Contribution 240,000 240,000 240,000 240,000
-Fixed cost 0 40,000 80,000 120,000EBIT $240,000 $200,000 $160,000 $120,000
EBIT was 180,000 140,000 100,000 60,000
Change to EBIT $ 60,000 $ 60,000 $ 60,000 $ 60,000
Measured in absolute dollars, EBIT increases by $60,000 in all four cases.
Note �: 40% of sales, from problem 15B-1
Percentage change to EBIT(a) $60,000/$180,000 = 33.33% Note: greater percentage change with (b) $60,000/$140,000 = 42.86% higher fixed costs.(c) $60,000/$100,000 = 60.00%(d) $60,000/$60,000 = 100.00%
SOLUTION - PROBLEM 15B-4
Redo the income statements of problem 15B-2 with sales of $2,000,000:
(a) (b) (c) (d) Sales $2,000,000 $2,000,000 $2,000,000 $2,000,000
-Variable cost� 1,300,000 1,300,000 1,300,000 1,300,000Contribution 700,000 700,000 700,000 700,000
-Fixed cost 0 150,000 300,000 450,000EBIT $ 700,000 $ 550,000 $ 400,000 $ 250,000
EBIT was 612,500 462,500 312,500 162,500
Change to EBIT $ 87,500 $ 87,500 $ 87,500 $ 87,500
Measured in absolute dollars, EBIT increases by $87,500 in all four cases.
Note �: 65% of sales, from problem 15B-2
15B-4 Appendix 15B
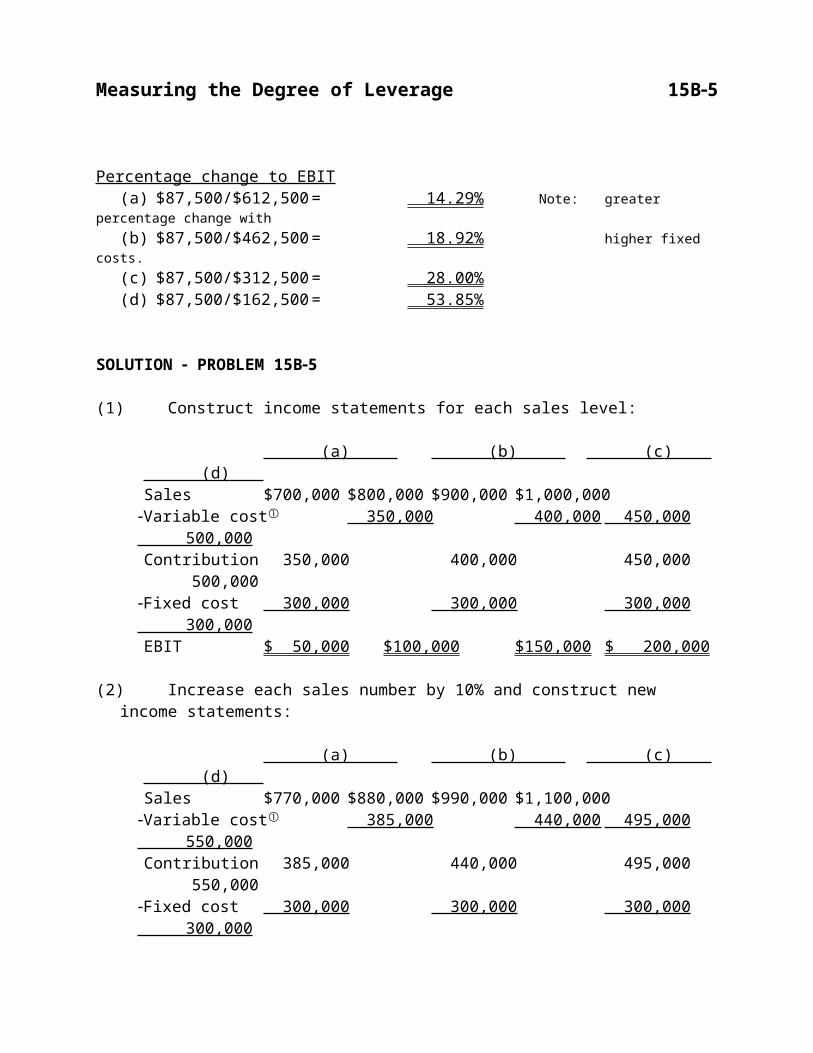
Percentage change to EBIT(a) $87,500/$612,500 = 14.29% Note: greater percentage change with (b) $87,500/$462,500 = 18.92% higher fixed costs.(c) $87,500/$312,500 = 28.00%(d) $87,500/$162,500 = 53.85%
SOLUTION - PROBLEM 15B-5
(1) Construct income statements for each sales level:
(a) (b) (c) (d) Sales $700,000 $800,000 $900,000 $1,000,000
-Variable cost� 350,000 400,000 450,000 500,000Contribution 350,000 400,000 450,000 500,000
-Fixed cost 300,000 300,000 300,000 300,000EBIT $ 50,000 $100,000 $150,000 $ 200,000
(2) Increase each sales number by 10% and construct new income statements:
(a) (b) (c) (d) Sales $770,000 $880,000 $990,000 $1,100,000
-Variable cost� 385,000 440,000 495,000 550,000Contribution 385,000 440,000 495,000 550,000
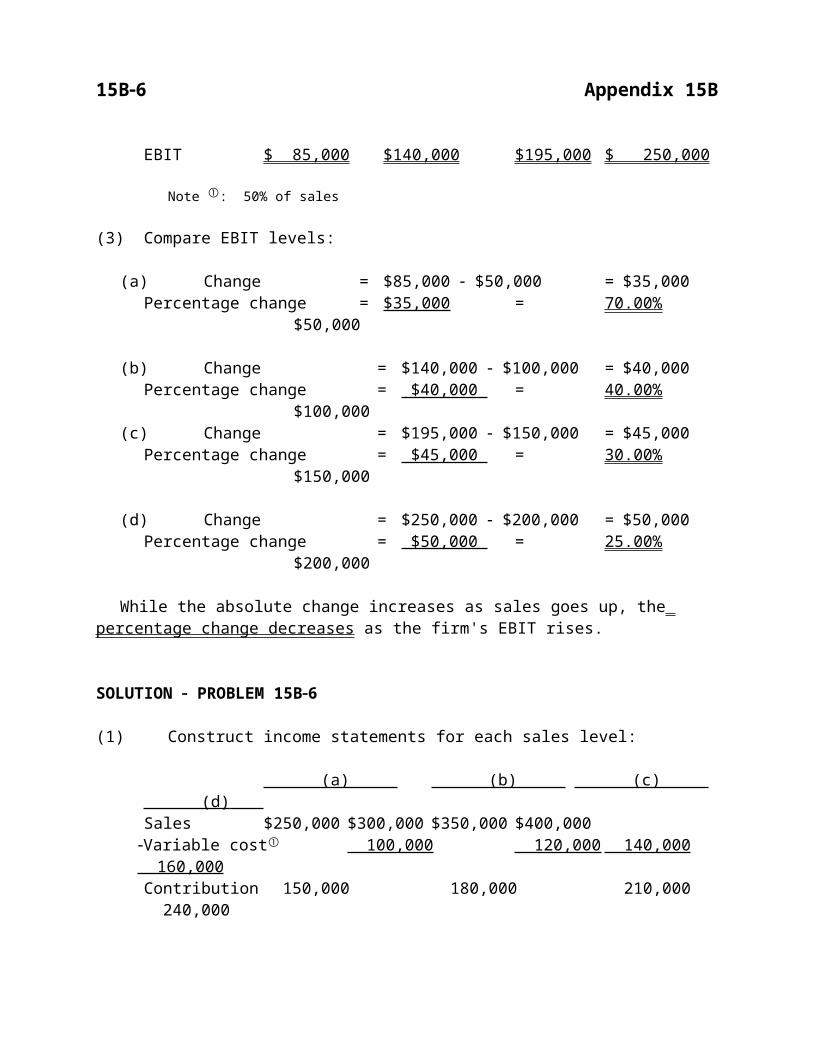
-Fixed cost 300,000 300,000 300,000 300,000EBIT $ 85,000 $140,000 $195,000 $ 250,000
Note �: 50% of sales
(3) Compare EBIT levels:
(a) Change = $85,000 - $50,000 = $35,000Percentage change = $35,000 = 70.00%
$50,000
(b) Change = $140,000 - $100,000 = $40,000Percentage change = $40,000 = 40.00%
$100,000(c) Change = $195,000 - $150,000 = $45,000
Percentage change = $45,000 = 30.00%$150,000
(d) Change = $250,000 - $200,000 = $50,000Percentage change = $50,000 = 25.00%

Measuring the Degree of Leverage 15B-5
$200,000
While the absolute change increases as sales goes up, the percentage change decreases as the firm's EBIT rises.
SOLUTION - PROBLEM 15B-6
(1) Construct income statements for each sales level:
(a) (b) (c) (d) Sales $250,000 $300,000 $350,000 $400,000
-Variable cost� 100,000 120,000 140,000 160,000Contribution 150,000 180,000 210,000 240,000
-Fixed cost 120,000 120,000 120,000 120,000EBIT $ 30,000 $ 60,000 $ 90,000 $120,000
(2) Increase each sales number by 25% and construct new income statements:
(a) (b) (c) (d) Sales $312,500 $375,000 $437,500 $500,000
-Variable cost� 125,000 150,000 175,000 200,000Contribution 187,500 225,000 262,500 300,000
-Fixed cost 120,000 120,000 120,000 120,000EBIT $ 67,500 $105,000 $142,500 $180,000
Note �: 40% of sales
(3) Compare EBIT levels:
(a) Change = $67,500 - $30,000 = $37,500Percentage change = $37,500 = 125.00%
$30,000
(b) Change = $105,000 - $60,000 = $45,000Percentage change = $45,000 = 75.00%
$60,000
(c) Change = $142,500 - $90,000 = $52,500Percentage change = $52,500 = 58.33%
$90,000

15B-6 Appendix 15B
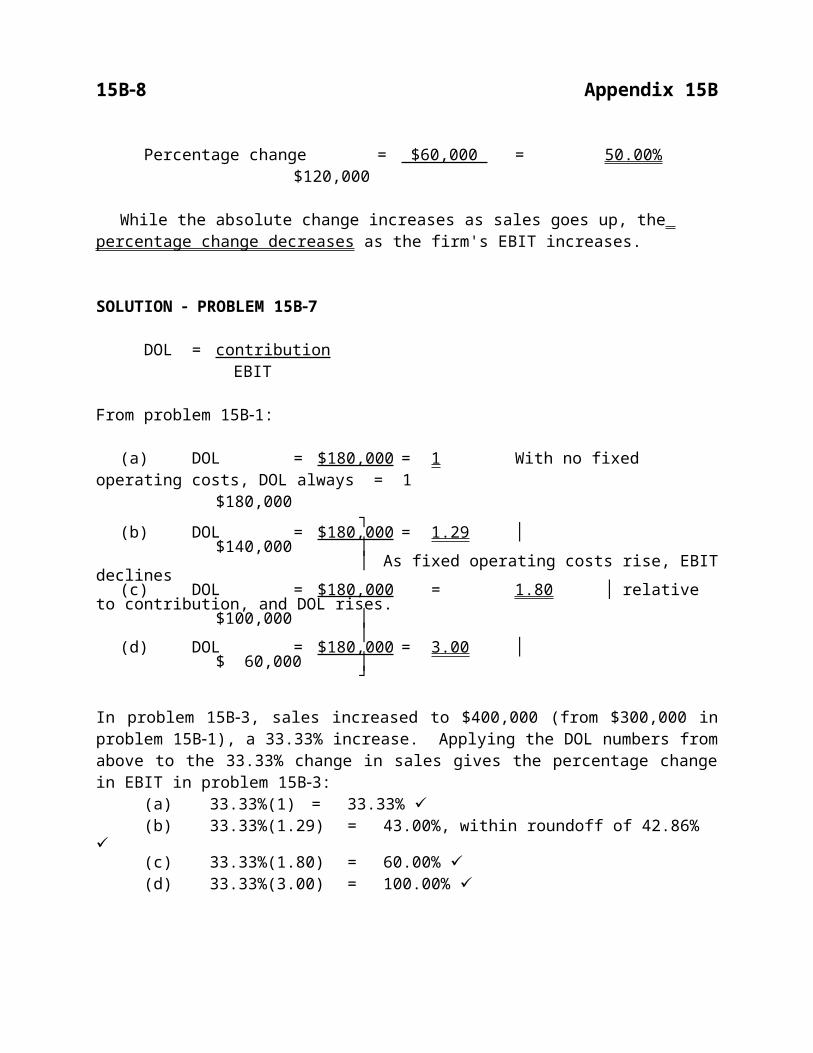
(d) Change = $180,000 - $120,000 = $60,000Percentage change = $60,000 = 50.00%
$120,000
While the absolute change increases as sales goes up, the percentage change decreases as the firm's EBIT increases.
SOLUTION - PROBLEM 15B-7
DOL = contributionEBIT
From problem 15B-1:
(a) DOL = $180,000 = 1 With no fixed operating costs, DOL always = 1$180,000
┐(b) DOL = $180,000 = 1.29 │
$140,000 ││ As fixed operating costs rise, EBIT declines
(c) DOL = $180,000 = 1.80 │ relative to contribution, and DOL rises.$100,000 │
│(d) DOL = $180,000 = 3.00 │
$ 60,000 │┘
In problem 15B-3, sales increased to $400,000 (from $300,000 in problem 15B-1), a 33.33% increase. Applying the DOL numbers from above to the 33.33% change in sales gives the percentage change in EBIT in problem 15B-3:
(a) 33.33%(1) = 33.33% ü(b) 33.33%(1.29) = 43.00%, within roundoff of 42.86% ü(c) 33.33%(1.80) = 60.00% ü(d) 33.33%(3.00) = 100.00% ü
SOLUTION - PROBLEM 15B-8
DOL = contributionEBIT
From problem 15B-2:
(a) DOL = $612,500 = 1 With no fixed operating costs, DOL always = 1$612,500
Measuring the Degree of Leverage 15B-7
┐(b) DOL = $612,500 = 1.32 │
$462,500 ││ As fixed operating costs rise, EBIT declines
(c) DOL = $612,500 = 1.96 │ relative to contribution, and DOL rises.$312,500 │
│(d) DOL = $612,500 = 3.77 │
$162,500 │┘
In problem 15B-4, sales increased to $2,000,000 (from $1,750,000 in problem 15B-2), a 14.29% increase. Applying the DOL numbers from above to the 14.29% change in sales gives the percentage change in EBIT in problem 15B-4:
(a) 14.29%(1) = 14.29% ü ┐(b) 14.29%(1.32) = 18.86%, │(c) 14.29%(1.96) = 28.01% │ ü within roundoff error(d) 14.29%(3.77) = 53.87% │
┘
SOLUTION - PROBLEM 15B-9
DOL = contributionEBIT
Prior to the sales increase:
(a) DOL = $350,000 = 7.00$ 50,000
(b) DOL = $400,000 = 4.00$100,000
(c) DOL = $450,000 = 3.00$150,000
(d) DOL = $500,000 = 2.50$200,000
After the sales increase:
(a) DOL = $385,000 = 4.53$ 85,000
(b) DOL = $440,000 = 3.14$140,000
(c) DOL = $495,000 = 2.54$195,000
(d) DOL = $550,000 = 2.20$250,000

15B-8 Appendix 15B
Note how as sales, hence EBIT, rises, DOL declines.
SOLUTION - PROBLEM 15B-10
DOL = contributionEBIT
Prior to the sales increase:
(a) DOL = $150,000 = 5.00$ 30,000
(b) DOL = $180,000 = 3.00$ 60,000
(c) DOL = $210,000 = 2.33$ 90,000
(d) DOL = $240,000 = 2.00$120,000
After the sales increase:
(a) DOL = $187,500 = 2.78$ 67,500
(b) DOL = $225,000 = 2.14$105,000
(c) DOL = $262,500 = 1.84$142,500
(d) DOL = $300,000 = 1.67$180,000
Note how as sales, hence EBIT, rises, DOL declines.
SOLUTION - PROBLEM 15B-11
Construct the bottom lines of the company's income statement:
(a) (b) (c) (d) EBIT $500,000 $500,000 $500,000 $500,000
-Interest 0 100,000 200,000 300,000EBT 500,000 400,000 300,000 200,000
-Taxes 175,000 140,000 105,000 70,000EAT 325,000 260,000 195,000 130,000

Measuring the Degree of Leverage 15B-9
¸# Shares 20,000 20,000 20,000 20,000EPS $ 16.25 $ 13.00 $ 9.75 $ 6.50
SOLUTION - PROBLEM 15B-12
Construct the bottom lines of the company's income statement:
(a) (b) (c) (d) EBIT $2,500,000 $2,500,000 $2,500,000 $2,500,000
-Interest 0 500,000 1,000,000 1,500,000EBT 2,500,000 2,000,000 1,500,000 1,000,000
-Taxes 875,000 700,000 525,000 350,000EAT 1,625,000 1,300,000 975,000 650,000
¸# Shares 150,000 150,000 150,000 150,000EPS $ 10.83 $ 8.67 $ 6.50 $ 4.33
SOLUTION - PROBLEM 15B-13
Redo the income statements of problem 15B-11 with EBIT of $550,000:
(a) (b) (c) (d) EBIT $550,000 $550,000 $550,000 $550,000
-Interest 0 100,000 200,000 300,000EBT 550,000 450,000 350,000 250,000
-Taxes 192,500 157,500 122,500 87,500EAT 357,500 292,500 227,500 162,500
¸# Shares 20,000 20,000 20,000 20,000

15B-10 Appendix 15B
EPS $ 17.88 $ 14.63 $ 11.38 $ 8.13
EPS was $16.25 $13.00 $ 9.75 $ 6.50
Change to EPS $ 1.63 $ 1.63 $ 1.63 $ 1.63
Measured in absolute dollars, EPS increases by $1.63 in all four cases.
Percentage change to EPS(a) $1.63/$16.25 = 10.03% (10% without roundoff error) Note: greater percentage (b) $1.63/$13.00 = 12.54% (12.50% without roundoff error) change with higher (c) $1.63/$ 9.75 = 16.72% (16.67% without roundoff error) fixed costs (interest).(d) $1.63/$ 6.50 = 25.08% (25.00% without roundoff error)
SOLUTION - PROBLEM 15B-14
Redo the income statements of problem 15B-12 with EBIT of $3,000,000:
(a) (b) (c) (d) EBIT $3,000,000 $3,000,000 $3,000,000 $3,000,000
-Interest 0 500,000 1,000,000 1,500,000EBT 3,000,000 2,500,000 2,000,000 1,500,000
-Taxes 1,050,000 875,000 700,000 525,000EAT 1,950,000 1,625,000 1,300,000 975,000
¸# Shares 150,000 150,000 150,000 150,000EPS $ 13.00 $ 10.83 $ 8.67 $ 6.50
EPS was $ 10.83 $ 8.67 $ 6.50 $ 4.33
Change to EPS $ 2.17 $ 2.17 $ 2.17 $ 2.17 Measured in absolute dollars, EPS increases by $2.17 in all four cases.
Percentage change to EPS(a) $2.17/$10.83 = 20.04% (20% without roundoff error) Note: greater percentage (b) $2.17/$ 8.67 = 25.03% (25% without roundoff error) change with higher (c) $2.17/$ 6.50 = 33.38% (33.33% without roundoff error) fixed costs (interest).(d) $2.17/$ 4.33 = 50.12% (50% without roundoff error)
SOLUTION - PROBLEM 15B-15
(1) Construct income statements for each EBIT level:
Measuring the Degree of Leverage 15B-11
(a) (b) (c) (d) EBIT $400,000 $600,000 $800,000 $1,000,000
-Interest 200,000 200,000 200,000 200,000EBT 200,000 400,000 600,000 800,000
-Taxes 70,000 140,000 210,000 280,000EAT 130,000 260,000 390,000 520,000
¸# Shares 35,000 35,000 35,000 35,000EPS $ 3.71 $ 7.43 $ 11.14 $ 14.86
(2) Increase each EBIT number by 10% and construct new income statements:
(a) (b) (c) (d) EBIT $440,000 $660,000 $880,000 $1,100,000
-Interest 200,000 200,000 200,000 200,000EBT 240,000 460,000 680,000 900,000
-Taxes 84,000 161,000 238,000 315,000EAT 156,000 299,000 442,000 585,000
¸# Shares 35,000 35,000 35,000 35,000EPS $ 4.46 $ 8.54 $ 12.63 $ 16.71
(3) Compare EPS levels:
(a) Change = $4.46 - $3.71 = $0.75Percentage change = $0.75 = 20.22%
$3.71
(b) Change = $8.54 - $7.43 = $1.11Percentage change = $1.11 = 14.94%
$7.43(c) Change = $12.63 - $11.14 = $1.49
Percentage change = $1.49 = 13.38%$11.14
(d) Change = $16.71 - $14.86 = $1.85Percentage change = $1.85 = 12.45%
$14.86
While the absolute change increases as EBIT goes up, the percentage change decreases as the firm's EBT rises.
SOLUTION - PROBLEM 15B-16
15B-12 Appendix 15B
(1) Construct income statements for each EBIT level:
(a) (b) (c) (d) EBIT $250,000 $300,000 $350,000 $400,000
-Interest 80,000 80,000 80,000 80,000EBT 170,000 220,000 270,000 320,000
-Taxes 59,500 77,000 94,500 112,000EAT 110,500 143,000 175,500 208,000
¸# Shares 12,000 12,000 12,000 12,000EPS $ 9.21 $ 11.92 $ 14.63 $ 17.33
(2) Increase each EBIT number by 25% and construct new income statements:
(a) (b) (c) (d) EBIT $312,500 $375,000 $437,500 $500,000
-Interest 80,000 80,000 80,000 80,000EBT 232,500 295,000 357,500 420,000
-Taxes 81,375 103,250 125,125 147,000EAT 151,125 191,750 232,375 273,000
¸# Shares 12,000 12,000 12,000 12,000EPS $ 12.59 $ 15.98 $ 19.36 $ 22.75
(3) Compare EPS levels:
(a) Change = $12.59 - $9.21 = $3.38Percentage change = $3.38 = 36.70%
$9.21
(b) Change = $15.98 - $11.92 = $4.06Percentage change = $4.06 = 34.05%
$11.92
(c) Change = $19.36 - $14.63 = $4.73Percentage change = $4.73 = 32.33%
$14.63
(d) Change = $22.75 - $17.33 = $5.42Percentage change = $5.42 = 31.28%
$17.33
While the absolute change increases as EBIT goes up, the percentage change decreases as the firm's EBT rises.

Measuring the Degree of Leverage 15B-13
SOLUTION - PROBLEM 15B-17
DFL = EBIT earnings before taxes
From problem 15B-11:
(a) DFL = $500,000 = 1 With no fixed financing costs (interest),$500,000 DFL always = 1
┐(b) DFL = $500,000 = 1.25 │
$400,000 ││ As fixed financing costs (interest) rise, EBT
(c) DFL = $500,000 = 1.67 │ declines relative to EBIT, and DFL rises.$300,000 │
│(d) DFL = $500,000 = 2.50 │
$200,000 │┘
In problem 15B-13, EBIT increased to $550,000 (from $500,000 in problem 15B-11), a 10% increase. Applying the DFL numbers from above to the 10% change in EBIT gives the percentage change to EPS in problem 15B-13:
(a) 10%(1) = 10.00% ü(b) 10%(1.25) = 12.50% ü(c) 10%(1.67) = 16.67% ü(d) 10%(2.50) = 25.00% ü
SOLUTION - PROBLEM 15B-18
DFL = EBIT earnings before taxes
From problem 15B-12:
(a) DFL = $2,500,000 = 1 With no fixed financing costs (interest),$2,500,000 DFL always = 1
┐(b) DFL = $2,500,000 = 1.25 │
$2,000,000 ││ As fixed financing costs (interest) rise, EBT
(c) DFL = $2,500,000 = 1.67 │ declines relative to EBIT, and DFL rises.$1,500,000 │
│
15B-14 Appendix 15B
(d) DFL = $2,500,000 = 2.50 │$1,000,000 │
┘In problem 15B-14, EBIT increased to $3,000,000 (from $2,500,000 in problem 15B-12), a 20% increase. Applying the DFL numbers from above to the 20% change in EBIT gives the percentage change to EPS in problem 15B-14:
(a) 20%(1) = 20.00% ü(b) 20%(1.25) = 25.00% ü(c) 20%(1.67) = 33.33% ü(d) 20%(2.50) = 50.00% ü
SOLUTION - PROBLEM 15B-19
DFL = EBIT__ earnings before taxes
Prior to the EBIT increase:
(a) DFL = $400,000 = 2.00$200,000
(b) DFL = $600,000 = 1.50$400,000
(c) DFL = $800,000 = 1.33$600,000
(d) DFL = $1,000,000 = 1.25 $800,000
After the EBIT increase:
(a) DFL = $440,000 = 1.83$240,000
(b) DFL = $660,000 = 1.43$460,000
(c) DFL = $880,000 = 1.29$680,000
(d) DFL = $1,100,000 = 1.22 $900,000
Note how as EBIT, hence EBT rises, DFL declines.
SOLUTION - PROBLEM 15B-20
DFL = EBIT

Measuring the Degree of Leverage 15B-15
earnings before taxes
Prior to the EBIT increase:
(a) DFL = $250,000 = 1.47$170,000
(b) DFL = $300,000 = 1.36$220,000
(c) DFL = $350,000 = 1.30$270,000
(d) DFL = $400,000 = 1.25$320,000
After the EBIT increase:
(a) DFL = $312,500 = 1.34$232,500
(b) DFL = $375,000 = 1.27$295,000
(c) DFL = $437,500 = 1.22$357,500
(d) DFL = $500,000 = 1.19$420,000
Note how as EBIT, hence EBT rises, DFL declines.
SOLUTION - PROBLEM 15-B21
(a)Sales $2,000,000
-Variable cost 1,100,000 ¬¾ 55% of salesContribution 900,000
-Fixed cost 600,000EBIT 300,000
-Interest 100,000EBT 200,000
-Taxes 70,000EAT 130,000
¸ #shares 150,000EPS $0.87
(b)

15B-16 Appendix 15B
DOL = contribution = $900,000 = 3.00EBIT $300,000
DFL = EBIT = $300,000 = 1.50EBT $200,000
DTL = contribution = $900,000 = 4.50EBT $200,000
(c) DOL ´ DFL = 3.00 ´ 1.50 = 4.50 ü
(d)Sales $2,300,000 up 15%
-Variable cost 1,265,000 (55% of sales)Contribution 1,035,000
-Fixed cost 600,000EBIT 435,000 up 45%
-Interest 100,000EBT 335,000
-Taxes 117,250EAT 217,750
¸ #shares 150,000EPS $1.45 up 67%
From DOL, EBIT should increase by 15%(3.00) = 45% ü
From DFL, EPS should increase by 45%(1.50) = 67.5% ü(roundoff error)
From DTL, EPS should increase by 15%(4.50) = 67.5% ü
SOLUTION - PROBLEM 15-B22
(a)Sales $500,000
-Variable cost 175,000 ¬¾ 35% of salesContribution 325,000
-Fixed cost 125,000EBIT 200,000
-Interest 50,000EBT 150,000
-Taxes 52,500EAT 97,500

Measuring the Degree of Leverage 15B-17
¸ #shares 75,000EPS $1.30
(b)DOL = contribution = $325,000 = 1.63
EBIT $200,000
DFL = EBIT = $200,000 = 1.33EBT $150,000
DTL = contribution = $325,000 = 2.17EBT $150,000
(c) DOL ´ DFL = 1.63 ´ 1.33 = 2.17 ü
(d)Sales $625,000 up 25%
-Variable cost 218,750 (35% of sales)Contribution 406,250
-Fixed cost 125,000EBIT 281,250 up 40.6%
-Interest 50,000EBT 231,250
-Taxes 80,938EAT 150,312
¸ #shares 75,000EPS $2.00 up 53.9%
From DOL, EBIT should increase by 25%(1.63) = 40.8% ü (roundoff error)
From DFL, EPS should increase by 40.6%(1.33) = 54.0% ü (roundoff error)

15B-18 Appendix 15B
From DTL, EPS should increase by 25%(2.17) =54.3% ü (roundoff error)18