chapter 14 substance use disorders p - boston public … · changes in the brain caused by...
TRANSCRIPT

592
pChapter 14Substance Use Disorders

Health of Boston 2016-2017
593

14 | Substance Misuse
594
Substance Use DisordersSubstance misuse and substance dependence are classified as substance use disorders. In 2015, an estimated
20.8 million people ages 12 or older were classified with substance dependence or misuse in the United States
(1). A person is said to have an addiction to a substance when the nature and intensity of the cravings for the
substance contributes to a pattern of unhealthy or self-destructive behaviors with the purpose of satisfying
the perceived need for the substance. Individual-level risk factors such as socioeconomic status, family history,
incarceration, and stressful life events are associated with drug use (2). Increasingly, evidence suggests that
the social determinants of health may contribute to one’s decision to initiate drug use and shape other
substance use behaviors (3). For example, the lack of a supportive social network or circumstances related
to neighborhood poverty may influence substance use behaviors (3). Additionally, addiction is a chronic
neurological disorder and needs to be treated as other chronic conditions (4).
Substance use disorders and mental healthIn 2015, among the 19.6 million adults ages 18 years and over in the U.S. who experienced a substance use
disorder, 41% also had had a mental illness in the past year (1). Causality and connection cannot always be
proved; however, research shows that some mental illnesses are risk factors for substance use disorders (5).
Some of the same areas that are disrupted in the brain due to mental illnesses are also disrupted due to
changes in the brain caused by substance use disorders (5). Additionally, people will often use substances as
self-medication for their mental illness which can result in substance misuse (5).
Connection to physical healthMisuse of alcohol or other drugs over time can lead to physical and/or psychological dependence on these
substances, despite negative consequences. Substance misuse alters judgment, perception, attention, and
physical control (6), which can lead to the repeated failure to fulfill responsibilities and can increase social
and interpersonal problems (7). There is a substantially increased risk of morbidity and death associated with
alcohol and drug misuse (3). The effects of substance misuse are cumulative, significantly contributing to
costly social, physical, mental, and public health challenges. Examples of these include domestic violence,
child abuse, motor vehicle crashes, physical fights, crime, homicide, suicide, human immunodeficiency virus/
acquired immunodeficiency syndrome (HIV/AIDS), and other sexually transmitted infections (6). Substance
misuse can also impact one’s social determinants of health, such as employment, income, social network, and
housing (4).

Health of Boston 2016-2017
595
Fentanyl and opioidsThe U.S. drug overdose death rate was 16.3 per 100,000 population in 2015 with 18% of all drug overdose
deaths in 2015 involving synthetic opioids other than methadone (i.e. pain relievers including fentanyl) (8).
Fentanyl is a strong synthetic (man-made) opioid often used as a cutting agent (i.e., adulterant) in combination
with other drugs sold on the street (9).The rate of drug overdose deaths involving synthetic opioids other than
methadone increased by 72% from 1.8 in 2014 to 3.1 in 2015 (10). Massachusetts residents experienced a 109%
increase in the rate of drug overdose deaths involving synthetic opioids other than methadone from 6.9 in 2014
to 14.4 in 2015 (10).
From January to September of 2016, opioid overdose deaths among Massachusetts residents occurred
disproportionately more often among White residents and males. Seventy-four percent of the population were
White residents, yet White residents made up 82% of opioid deaths. Fourty-eight percent of the population
were male, yet males comprised 75% of opioid deaths. Additionally, nearly two-thirds of opioid overdose
deaths were among residents under age 45, yet deaths in this age group account for only 6% of deaths overall
(11). The number of fentanyl-related deaths in Massachusetts continues to increase. Among the 1,374 residents
in Massachusetts whose deaths in 2016 were opioid-related and where a toxicology screen was also available,
1,031 of them (75%) had a positive screen result for fentanyl (12).
Substance misuse response and treatmentIn November 2016, the U.S. Department of Health and Human Services released a call to action report,
“Facing Addiction in America: The Surgeon General’s Report on Alcohol, Drugs, and Health”, which asks
Americans to “change the way we address substance misuse and substance use disorders in our society. Now
is the time to acknowledge that these disorders must be addressed with compassion and as preventable and
treatable medical conditions” (4). Reflecting these sentiments, the response to the current opioid epidemic,
which disproportionately impacts White residents has been quite different than the response to the past crack
cocaine epidemic, which disproportionately impacted communities of color. The crack cocaine epidemic was
predominately managed with a “War on Drugs” approach, which included a heavy criminal justice response,
while the current opioid epidemic is being addressed with increased funding for prevention, intervention,
treatment, rehabilitation, and recovery (12-15).

14 | Substance Misuse
596
In 2015, it was estimated that of the individuals who
needed treatment for substance use disorders in
the U.S., 89% did not receive treatment (16). While
Massachusetts has services to treat substance use
disorders, there are many barriers to accessing these
services. The 2015 report “Access to Substance Use
Disorder Treatment in Massachusetts” describes
barriers that exist for those who need treatment (17).
These barriers to treatment include:
• Not enough counselors to keep up with demand;
• Not enough beds to keep up with demand;
• Lack of coordination between primary care,
substance use treatment providers, and mental
health professionals;
• Long wait times to access services;
• Difficulty understanding what services are
available;
• Varying health insurance coverage (treatment
intensity can vary based on health insurance plan
type), and;
• Lack of sufficient cultural competency (racial
and ethnic groups who need treatment are less
likely to access services when controlling for
socioeconomic status and criminal justice history)
Additionally, stigma related to substance misuse
and addiction can often dissuade people with a
substance misuse problem from seeking treatment
(4). Depending on the substance(s) involved,
treatment may include medications, behavioral
treatments, or a combination of both. A doctor,
substance use treatment counselor, or other health
professional can determine the right treatment
based on an individual’s needs (19).
In this section, we will examine the following
indicators related to substance use disorders:
drug and alcohol use among high school students,
substance misuse treatment admissions, hospital
patient encounters for substance dependence,
misuse and unintentional drug overdose/poisonings,
and death rates for substance misuse, including
unintentional drug overdose/poisonings.

Health of Boston 2016-2017
597
pIn 2015, a large portion of Boston public high school students reported ever using drugs such as alcohol (55%), marijuana (38%), synthetic marijuana (6%), heroin (2%), methamphetamines (2%), and prescription drugs used without a prescription or not as prescribed (8%).
DATA SOURCE: Youth Risk Behavior Survey (2015), Centers for Disease Control and Prevention and Boston Public Schools
pIn 2016, the rate of all substance misuse treatment admissions, including duplicate visits by the same individual, was 264.1 admissions per 10,000 residents ages 12 and older. The rate of unique-person visits was 126.3. Between 2012 and 2016, these rates decreased by 14% and 17%, respectively.
* Statistically significant change over time† Age-adjusted rates per 10,000 residents ages 12 and older
DATA SOURCE: Bureau of Substance Abuse Services, Massachusetts Department of Public Health (data as of December 2016)

14 | Substance Misuse
598
p Between 2012 and 2016, the rate of unique-person substance misuse treatment admissions decreased by 18% for Black residents, 12% for Latino residents, and 15% for White residents. There was no significant change over time for Asian residents.
In 2016, unique-person treatment admission rates were lower among Asian (13.0 admissions per 10,000 residents ages 12 and older), Black (132.9), and Latino residents (123.7) compared with White residents (145.3). These rates were 91%, 9%, and 15% lower, respectively.
* Statistically significant change over time† Age-adjusted rates per 10,000 residents ages 12 and older
DATA SOURCE: Bureau of Substance Abuse Services, Massachusetts Department of Public Health (data as of December 2016)
p In 2016, alcohol was cited most often as a primary, secondary, or tertiary drug of misuse among unique-person treatment admissions in Boston, with a rate of 71.3 admissions per 10,000 residents ages 12 and older. Between 2012 and 2016, the rates of unique-person treatment admissions decreased by 25% for alcohol, 29% for cocaine, 17% for marijuana, and 26% for prescription drugs.
* Statistically significant change over time† Age-adjusted rates per 10,000 residents ages 12 and older1 Self-identified as primary, secondary, or tertiary drug of misuseDATA SOURCE: Bureau of Substance Abuse Services, Massachusetts Department of Public Health (data as of December 2016)

Health of Boston 2016-2017
599
* Statistically significant difference when compared to reference group† Age-adjusted rates per 10,000 residents ages 12 and older‡ Rates not presented due to a small number of cases§ Rates are based on 20 or fewer cases and should be interpreted with caution1 Self-identified as primary, secondary, or tertiary drug of misuse
NOTE: Bars with patterns indicate the reference group within each selected indicator. DATA SOURCE: Bureau of Substance Abuse Services, Massachusetts Department of Public Health (data as of December 2016)
p
In 2016, the rates of unique-person treatment admissions for alcohol as primary, secondary, or tertiary drug of misuse were 92% lower for Asian residents (5.9 admissions per 10,000 residents ages 12 and older),18% lower for Latino residents (62.9), and 22% higher for Black residents (93.9) compared with White residents (77.0). For cocaine-related treatment admissions, the rate was 93% lower for Asian residents (2.8) compared with White residents (43.0). The rate of treatment admissions for heroin were lower for Asian (6.6), Black (42.3), and Latino residents (73.6) compared with White residents (91.0). These rates were 93%, 54%, and 19% lower, respectively. For marijuana-related treatment admissions, rates were 91% lower for Asian residents (2.0), 99% higher for Black residents (43.9), and 35% higher for Latino residents (29.7) compared with White residents (22.0). The rate of treatment admissions for prescription drugs was 73% lower for Black residents (12.0) and 69% lower for Latino residents (13.6), compared with White residents (43.6).

14 | Substance Misuse
600
* Statistically significant difference when compared to reference group† Age-adjusted rates per 10,000 residents ages 12 and older1 Self-identified as primary, secondary, or tertiary drug of misuseNOTE: Bars with patterns indicate the reference group within each selected indicator. DATA SOURCE: Bureau of Substance Abuse Services, Massachusetts Department of Public Health (data as of December 2016)
In 2016, the rates of unique-person treatment admissions for alcohol, cocaine, heroin, marijuana, and prescription drugs as primary, secondary, or tertiary drug of misuse were lower for female residents compared with male residents. The largest differences between the rates for females and males occurred for treatment admissions related to alcohol, heroin, and marijuana.
For alcohol, the rate for females (33.8 admissions per 10,000 residents ages 12 and older) was 70% lower than the rate for males (110.8). For heroin, the rate for females (35.2) was 66% lower than the rate for males (104.8). For marijuana, the rate for females (11.2) was 73% lower than the rate for males (41.6).
p

Health of Boston 2016-2017
601
* Statistically significant change over time† Age-adjusted rates per 10,000 residents ages 12 and older
NOTE: Hospital patient encounters include in-patient hospital and emergency department discharges but exclude observational stay discharges.DATA SOURCE: Acute hospital case-mix databases, Massachusetts Center for Health Information and Analysis
pp
In 2015, the rate of hospital patient encounters (including emergency department visits and in-patient hospitalizations) for substance misuse was 510.4 per 10,000 residents ages 12 and older. From 2011 to 2015, the rate increased by 12%. During this same time period, the rates for drug and alcohol misuse encounters increased by 25% and 2%, respectively.
In 2015, the rate of hospital patient encounters for substance misuse-related unintentional overdoses/poisonings was 26.6 encounters per 10,000 residents ages 12 and older. From 2011 to 2015, the rate increased by 13%. The rate for drug-related unintentional overdoses/poisonings increased by 40%, while the rate for alcohol-related overdoses/poisonings decreased by 68%.

14 | Substance Misuse
602
* Statistically significant change over time† Age-adjusted rates per 10,000 residents ages 12 and older
NOTE: Hospital patient encounters include in-patient hospital and emergency department discharges but exclude observational stay discharges.DATA SOURCE: Acute hospital case-mix databases, Massachusetts Center for Health Information and Analysis
pBy drug type, the rates of hospital patient encounters for unintentional overdoses/poisonings in 2015 were 18.1 per 10,000 residents ages 12 and older for opioids, 2.1 for cocaine, and 3.1 for benzodiazepines. From 2011 to 2015, the rate increased by 94% for opioids and decreased by 21% for cocaine. There was no significant change over time for benzodiazepines.

Health of Boston 2016-2017
603
* Statistically significant difference when compared to reference group† Age-adjusted rates per 10,000 residents ages 12 and older§ Rates are based on 20 or fewer cases and should be interpreted with caution
NOTE: Bars with patterns indicate the reference group within each selected indicator. Rates not presented due to a small number of cases for Asian residents. Hospital patient encounters include in-patient hospital and emergency department discharges but exclude observational stay discharges.DATA SOURCE: Acute hospital case-mix databases, Massachusetts Center for Health Information and Analysis
p
In 2015, the rates of hospital patient encounters for unintentional overdose/poisoning from opioids and benzodiazepines were lower for Black and Latino residents compared with White residents.
For opioids, the rates were 55% lower for Black residents (11.6 hospital patient encounters per 10,000 residents ages 12 and older) and 49% lower for Latino residents (13.4) compared with White residents (26.1), respectively. For benzodiazepines, the rates were 67% lower for Black residents (1.7) and 72% lower for Latino residents (1.4) compared with White residents (5.1).
In contrast, the rate of cocaine-related overdose/poisoning hospital patient encounters for Black residents (3.8) was 2.5 times the rate for White residents (1.5).

14 | Substance Misuse
604
p In 2015, the rates of hospital patient encounters for unintentional overdose/poisoning were lower for females compared with males for opioids (including heroin), cocaine, and benzodiazepines.
For opioids (including heroin), the rate for females (9.9 encounters per 10,000 residents ages 12 and older) was 63% lower than the rate for males (26.6). For cocaine, the rate for females (0.9) was 73% lower than for males (3.3). For benzodiazepines, the rate for females (2.3) was 44% lower than the rate for males (4.0).
* Statistically significant difference when compared to reference group† Age-adjusted rates per 10,000 residents ages 12 and older
NOTE: Bars with patterns indicate the reference group within each selected indicator. Hospital patient encounters include in-patient hospital and emergency department discharges but exclude observational stay discharges.DATA SOURCE: Acute hospital case-mix databases, Massachusetts Center for Health Information and Analysis
p In 2015, the substance misuse mortality rate in Boston was 39.8 deaths per 100,000 residents ages 12 and older. From 2011 to 2015, the rate increased by 54% for Boston overall. Rates also increased by 83% for Black residents, 73% for Latino residents, and 42% for White residents.
In 2015, mortality due to substance misuse was lower for Black (32.7) and Latino residents (29.1) compared with White residents (55.8). These rates were 41% and 48% lower, respectively.
* Statistically significant change over time† Age-adjusted rates per 100,000 residents ages 12 and older
NOTE: Hollowed-out symbols represent rates based on 20 or fewer cases and should be interpreted with caution. Rates not presented due to a small number of cases for Asian residents. Beginning in October 2014, the method for collecting race/ethnicity for mortality data changed. Interpret trends with caution. Unintentional overdose death totals for 2015 are likely an undercount due to deaths awaiting causal determinations. For more information see “Cause of Death Undercount” in the Technical Notes.DATA SOURCE: Boston resident deaths, Massachusetts Department of Public Health (data as of December 2016). Data will be updated as more information becomes available.

Health of Boston 2016-2017
605
For 2011-2015, the substance misuse mortality rate was higher for Charlestown, Dorchester (zip codes 02122, 02124), and South Boston compared with the rest of Boston. The rate was lower for Allston/Brighton and Back Bay compared with the rest of Boston.
p

14 | Substance Misuse
606
p In 2015, the overall substance misuse mortality rate in Boston was 39.8 deaths per 100,000 residents ages 12 and older. The mortality rates for alcohol misuse and drug misuse were 18.4 and 31.3, respectively. From 2011 to 2015, the mortality rates for overall substance misuse, alcohol misuse, and drug misuse increased by 54%, 49%, and 71%, respectively.
* Statistically significant change over time† Age-adjusted rates per 100,000 residents ages 12 and older
NOTE: Unintentional overdose death totals for 2015 are likely an undercount due to deaths awaiting causal determi-nations. For more information see “Cause of Death Undercount” in the Technical Notes.DATA SOURCE: Boston resident deaths, Massachusetts Department of Public Health (data as of December 2016). Data will be updated as more information becomes available.
Health of Boston 2016-2017
607
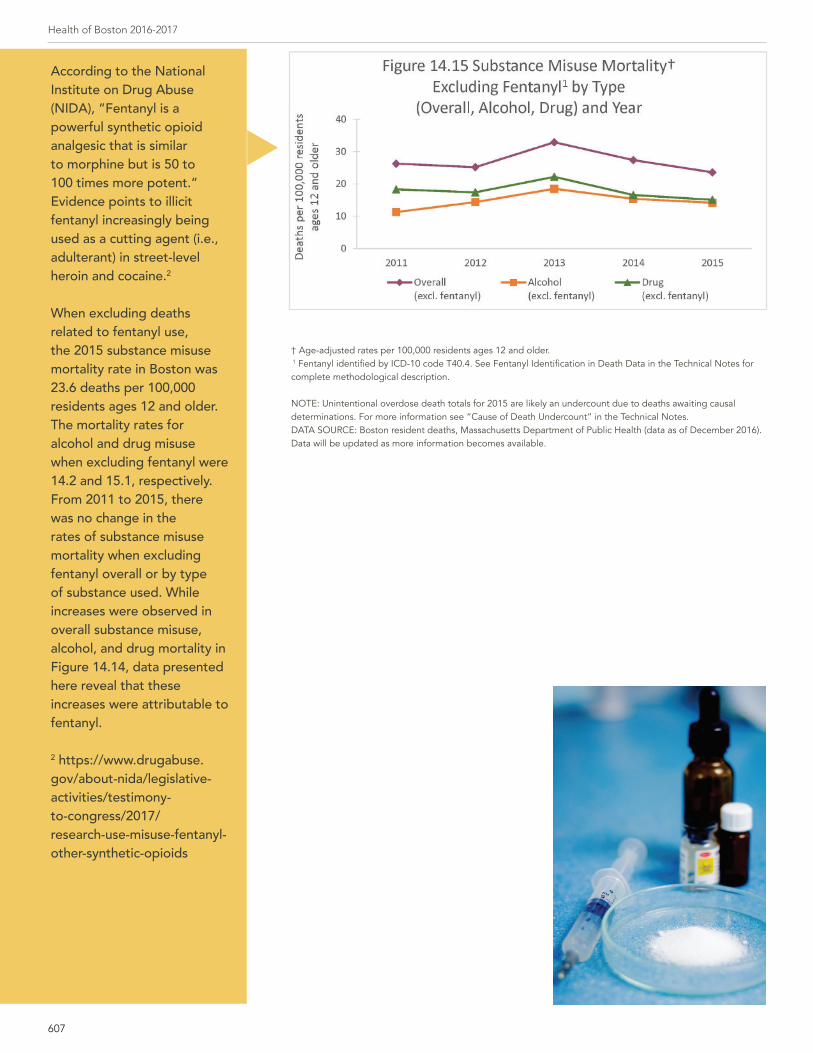
p
According to the National Institute on Drug Abuse (NIDA), “Fentanyl is a powerful synthetic opioid analgesic that is similar to morphine but is 50 to 100 times more potent.” Evidence points to illicit fentanyl increasingly being used as a cutting agent (i.e., adulterant) in street-level heroin and cocaine.2
When excluding deaths related to fentanyl use, the 2015 substance misuse mortality rate in Boston was 23.6 deaths per 100,000 residents ages 12 and older. The mortality rates for alcohol and drug misuse when excluding fentanyl were 14.2 and 15.1, respectively. From 2011 to 2015, there was no change in the rates of substance misuse mortality when excluding fentanyl overall or by type of substance used. While increases were observed in overall substance misuse, alcohol, and drug mortality in Figure 14.14, data presented here reveal that these increases were attributable to fentanyl.
2 https://www.drugabuse.gov/about-nida/legislative-activities/testimony-to-congress/2017/research-use-misuse-fentanyl-other-synthetic-opioids
† Age-adjusted rates per 100,000 residents ages 12 and older. 1 Fentanyl identified by ICD-10 code T40.4. See Fentanyl Identification in Death Data in the Technical Notes for complete methodological description.
NOTE: Unintentional overdose death totals for 2015 are likely an undercount due to deaths awaiting causal determinations. For more information see “Cause of Death Undercount” in the Technical Notes.DATA SOURCE: Boston resident deaths, Massachusetts Department of Public Health (data as of December 2016). Data will be updated as more information becomes available.

14 | Substance Misuse
608
* Statistically significant change over time† Age-adjusted rates per 100,000 residents ages 12 and older
NOTE: Unintentional overdose includes overdose with undetermined intent. Unintentional overdose death totals for 2015 are likely an undercount due to deaths awaiting causal determinations. For more information see “Cause of Death Undercount” in the Technical Notes.DATA SOURCE: Boston resident deaths, Massachusetts Department of Public Health (data as of December 2016). Data will be updated as more information becomes available.
* Statistically significant change over time† Age-adjusted rates per 100,000 residents ages 12 and older1 Fentanyl identified by ICD-10 code T40.4. See Fentanyl Identification in Death Data in the Technical Notes for complete methodological description.
NOTE: Hollowed-out symbols represent rates based on 20 or fewer cases and should be interpreted with caution. Rates not presented due to a small number of cases of unintentional overdose deaths due to fentanyl in 2012. Unintentional overdose includes overdose with undetermined intent. Unintentional overdose death totals for 2015 are likely an undercount due to deaths awaiting causal determinations. For more information see “Cause of Death Undercount” in the Technical Notes.DATA SOURCE: Boston resident deaths, Massachusetts Department of Public Health (data as of December 2016). Data will be updated as more information becomes available.
p
p
In 2015, the rate of mortality due to unintentional drug overdose in Boston was 27.5 deaths per 100,000 residents ages 12 and older. The rates of unintentional overdose deaths from opioids (including heroin) and cocaine were 25.8 and 11.4, respectively. From 2011 to 2015, the rates for all drugs, opioids, and cocaine increased by 108%, 130%, and 130%, respectively.
Note: Rates reflect presence of specified drug either alone or in combination with other drugs. Increases in rates over time are likely attributable to combinations including fentanyl and increasing fentanyl-related mortality over time.
In 2015, the rate of unintentional overdose mortality due to fentanyl use alone or in combination with other drugs was 16.2 deaths per 100,000 residents ages 12 and older compared with 1.1 in 2011. From 2011 to 2015, the rate increased by more than 40 times. In contrast, there was no significant change over time for the rates of unintentional overdose death due to the use of other opioids including heroin (excluding fentanyl) or the use of cocaine (excluding fentanyl). While increases in unintentional overdose mortality were observed in opioids (including heroin) and cocaine in Figure 14.16, data presented here reveal that these increases were attributable to fentanyl.

Health of Boston 2016-2017
609
1 Fentanyl identified by ICD-10 code T40.4 which may include other synthetic opioids. See Fentanyl Identification in Death Data in the Technical Notes for complete methodological description.
NOTE: Unintentional overdose includes overdose with undetermined intent. Unintentional overdose death totals for 2015 are likely an undercount due to deaths awaiting causal determinations. For more information see “Cause of Death Undercount” in the Technical Notes.DATA SOURCE: Boston resident deaths, Massachusetts Department of Public Health (data as of December 2016). Data will be updated as more information becomes available.
pp
In 2015, the rate of unintentional overdose deaths from all drugs was 38% lower for Black residents (24.2 deaths per 100,000 residents ages 12 and older) and 48% lower for Latino residents (20.0) compared with White residents (38.7). The mortality rate from unintentional opioid overdoses was 44% lower for Black residents (20.5) and 42% lower for Latino residents (21.2) compared with White residents (36.4). There were no significant differences in the rates of unintentional cocaine overdose mortality by race/ethnicity.
* Statistically significant difference when compared to reference group† Age-adjusted rates per 100,000 residents ages 12 and older § Rates are based on 20 or fewer cases and should be interpreted with caution
NOTE: Bars with patterns indicate the reference group within each selected indicator. Rates not presented due to a small number of cases for Asian residents. Unintentional overdose includes overdose with undetermined intent. Unintentional overdose death totals for 2015 are likely an undercount due to deaths awaiting causal determinations. For more information see “Cause of Death Undercount” in the Technical Notes.DATA SOURCE: Boston resident deaths, Massachusetts Department of Public Health (data as of December 2016). Data will be updated as more information becomes available.
In 2015, 56% of unintentional drug overdose deaths (n=83) were associated with fentanyl use (data not shown). Of these, 27% were due to fentanyl without other opioids (including heroin) or cocaine, 39% were due to fentanyl in combination with other opioids but without cocaine, 20% were due to fentanyl in combination with other opioids and cocaine, and 14% were due to fentanyl with cocaine but no other opioid specified.

14 | Substance Misuse
610
* Statistically significant difference when compared to reference group† Age-adjusted rates per 100,000 residents ages 12 and older§ Rates are based on 20 or fewer cases and should be interpreted with caution
NOTE: Bars with patterns indicate the reference group within each selected indicator. Unintentional overdose includes overdose with undetermined intent. Unintentional overdose death totals for 2015 are likely an undercount due to deaths awaiting causal determinations. For more information see “Cause of Death Undercount” in the Technical Notes.DATA SOURCE: Boston resident deaths, Massachusetts Department of Public Health (data as of December 2016). Data will be updated as more information becomes available.
pIn 2015, the unintentional drug overdose mortality rate for all drugs was 56% lower for females (16.9 deaths per 100,000 residents ages 12 and older) compared with males (38.8). Similar patterns held for unintentional drug overdose deaths due to opioids (including heroin) and cocaine. The rate for females was 59% lower for opioids (including heroin) and 61% lower for cocaine compared with males.

Health of Boston 2016-2017
611
For 2011 to 2015, the unintentional opioid overdose mortality rate was higher for Dorchester (zip codes 02122, 02124) compared with the rest of Boston. The rate was lower in Allston/Brighton and Fenway compared with the rest of Boston.
p
14 | Substance Misuse
612
SummaryThe analysis of Boston resident substance use disorders indicators from 2011 to 2015 found increasing rates of
mortality and hospital patient encounters and decreasing rates of treatment admissions.
From 2011 to 2015, Boston and Massachusetts experienced similar levels of and significant increases in
unintentional opioid overdose mortality (from 11.6 and 9.3 deaths per 100,000 residents ages 12 and older,
respectively, in 2011 to 25.8 for both in 2015) (12). The increase in unintentional opioid overdose mortality
appears to be attributable to fentanyl, a highly potent opioid often used as an adulterant (i.e., mixed with
street-level heroin, cocaine, and other drugs). In Boston, increases in all of the substance misuse mortality
indicators (including alcohol misuse mortality) appear to be attributable to fentanyl, often found to have been
used in combination with other drugs and alcohol. The number of fentanyl-related unintentional overdose
deaths increased from fewer than 10 per year during the three-year period 2011-2013 to 43 deaths in 2014 and
83 deaths in 2015.
With the exception of alcohol-related and cocaine-related unintentional overdose/poisonings which
decreased over time, the rates of hospital patient encounters for drug and alcohol-related substance misuse
(which includes dependence, misuse, and overdose), as well as for unintentional drug and opioid overdose/
poisoning, increased from 2011 to 2015. In contrast, the rates of total treatment admissions and unique-person
treatment admissions decreased during the same time period. With the exception of heroin, for which the rate
remained stable over time, the rate of unique-person treatment admissions decreased for alcohol, marijuana,
cocaine, and prescription drugs.
For substance misuse indicators evaluated for 2015, inequities across categories of race/ethnicity, sex, and
neighborhood were found. The rates of mortality and hospital patient encounters for substance misuse and
unintentional overdoses tended to disproportionately affect White residents. However, the overall substance
misuse death rate increased almost two-fold from 2011 to 2015 for Black and Latino residents and to a lesser
extent for White residents, which suggests the impact of fentanyl was experienced by all three of these racial/
ethnic groups and lessened relative inequities as rates increased. Racial/ethnic differences in unique-person
treatment admissions varied across drug type. For example, the rates of unique-person treatment admissions
for heroin and prescription drugs were higher for White residents compared with Black and Latino residents.
For marijuana, the rate was higher for Black and Latino residents compared with White residents. Across most
drug types, the rate of unique-person treatment admissions was lowest among Asian residents.
The rates of substance misuse deaths, unintentional drug overdose hospital patient encounters, and unique-
person treatment admissions were higher for men than women. At the neighborhood level, the rate of overall
substance misuse deaths (including alcohol misuse, drug misuse, and unintentional opioid overdose/poisoning
deaths) during the five-year time period 2011-2015 was higher for Charlestown, Dorchester (zip codes 02122,
02124), and South Boston compared with the rest of Boston.

Health of Boston 2016-2017
613

14 | Substance Misuse
614
Our Point of View: Thoughts from public healthUsing Medication to Treat Opioid Addiction
By Association for Behavioral Healthcare
Dependence on heroin, fentanyl and opioid-based pain medications has grown to epidemic proportions in Massachusetts. Despite many efforts to curb this rising tide, the overdose death rate continues to climb. The toll of addiction on our citizens, communities and the economy has been devastating with no end in sight. Medication-assisted treatment (MAT), like its name implies, is a whole-patient approach that combines medication, counseling and behavioral therapy. The medications prescribed for opioid treatment include methadone, buprenorphine (Suboxone), and injectable naltrexone (Vivitrol). These medications stabilize brain chemistry, block the euphoric effects of opioids, and stop cravings. Each have their own strengths and are recommended for different populations.
When it comes to treating illness, people rarely hesitate to use medication. Be it allergies or heart disease, depression or strep throat, people rely on medication for relief and for a cure. With addiction, however, there remains deep-rooted stigma, shame and misinformation. Despite overwhelming evidence of its benefits, many patients do not use MAT, even when it is the most clinically appropriate treatment. Every person who is struggling with opioid addiction should be familiar with their options.
Methadone is the most widely studied medication and treatment for any disease in the world. Since its development in 1964, methadone has been studied as a medical response to the post-World War II and the Vietnam opioid epidemics.1 Methadone maintenance is recommended for chronic, relapsing opioid-addicted individuals including pregnant women, those with heavier use of opioids, concurrent use of alcohol and other drugs, unstable psychiatric disorders, and limited social supports.
Buprenorphine (brand name Suboxone) is another treatment of opioid dependence. It is a preferred formulation for patients with liver disease and those transferring from a methadone clinic, including pregnant women. For individuals already stable on a low to moderate dose of buprenorphine, an implant that delivers a long-lasting dose can be surgically inserted and removed. 2
Naltrexone (brand name Vivitrol) can be used to treat alcohol and/or opioid dependence. It blocks opioid receptors, reduces cravings, and diminishes the rewarding effects of alcohol and opioids. Extended-release injectable naltrexone is recommended to prevent relapse to opioids or alcohol.
Given the chance, individuals stabilized with the use of medication and counseling can achieve true recovery. Numerous studies show that because MAT reduces drug use, the transmission of viral disease and criminal activity also go down.3 It’s time to think and treat opioid addiction like every other disease out there. Let’s use all the tools at our disposal.
1 Medication-Assisted Treatment for Opioid Addiction in Opioid Treatment Programs, A Treatment Improvement Protocol, TIP 43, Substance Abuse and Mental Health Services Administration, available at http://store.samhsa.gov/shin/content//SMA12-4214/SMA12-4214.pdf
2 Medication-Assisted Treatment For Opioid Addiction: Myths & Facts, Legal Action Center, 225 Varick Street, 4th Floor, New York, NY 10014 | August 2016.
3 Medication-Assisted Treatment For Opioid Addiction: Myths & Facts, Legal Action Center, 225 Varick Street, 4th Floor, New York, NY 10014 | August 2016

Health of Boston 2016-2017
615
Our Point of View: Thoughts from a community residentI tried different treatments and found one that is working
By Consumer of Boston Public Health Commission services
My grandmother raised me and my brother. I never met my biological dad. My mom also struggles with
addiction. I was four when my grandmother passed away from a brain aneurysm. It was traumatic. She was my
whole world.
I started skipping school, drinking and smoking weed. I moved onto Percocet and OxyContin. The first time I
remember being “dope sick” I didn’t know what was happening. A friend offered me heroin. I started sniffing
but quickly moved onto needles. At first, everything seemed better, but then I ended up jumping from couch
to couch and stealing from family. I was only 16 and I lost everything. Nobody wanted anything to do with me.
I ended up with my mom. She taught me how to hit myself with a needle. All I wanted was for her to love me
– to be proud of me. But I stole from her too and she kicked me out. I was homeless living on the streets of
Boston. It was scary. I was only 21. I should have been in college. I swore I’d never be like my mom. I wanted to
be a veterinarian.
The last months of 2016 were the worst – sleeping on loading docks, on concrete bricks and cardboard trying
not to freeze to death. I visited AHOPE to get clean needles. The staff there treated me like a human being
and helped me get back into a residential treatment program.
I tried Suboxone. It took away the cravings so I didn’t think about getting high as much, but for me, it was too
easy to abuse. I’m on methadone now. My mom, who has been on it for ten years now, convinced me to give it
a try. Going to the clinic every day provides accountability. There are lots of groups and you have to go to them
if you want to get dosed and come up with a treatment plan. I’m only 26. I don’t want to be on it for the rest of
my life but I don’t want to rush off either because I know it will lead to relapse.
Right now, my goal is to not stick a needle in my arm. I know I’m here for a purpose – whether it’s God or
whatever and that if I do what I have to do –follow my treatment plan and go to groups – I’ll be okay.

14 | Substance Misuse
616
References1. Center for Behavioral Health Statistics and Quality. Key substance use and mental health indicators in the United States: Results from
the 2015 National Survey on Drug Use and Health 2016.
2. Galea S, Rudenstine S, Vlahov D. Drug Use, Misuse and the Urban Environment. Drug and Alcohol Review. 2005;24.
3. Galea S, Nandi, A. and Vlahov, D. The Social Epidemiology of Substance Use. Epidemiologic reviews. 2004;26.
4. Office of the Surgeon General. Facing Addiction in America: The Surgeon General’s Report on Alcohol, Drugs, and Health,. Washing-
ton, DC2016.
5. National Institute on Drug Abuse. Comorbidity: Addiction and Other Mental Illnesses. Washington, D.C.: U.S. Department of Health
and Human Services 2010.
6. Center for Substance Abuse Treatment. Substance Abuse Treatment for Persons With Co-Occurring Disorders,. In: Substance Abuse
and Mental Health Services Administration, editor. Rockville, MD,2005.
7. Mayo Foundation for Medical Education and Research. Diseases Condition: Drug Addiction 2014 [Available from: http://www.mayoc-
linic.org/diseases-conditions/drug-addiction/basics/definition/con-20020970.
8. Hedegaard H, Warner M, Minino AM. Drug Overdose Deaths in the United States, 1999-2015. NCHS data brief. 2017(273):1-8.
9. Rudd RA, Seth P, David F, Scholl L. Increases in Drug and Opioid-Involved Overdose Deaths - United States, 2010-2015. MMWR Mor-
bidity and mortality weekly report. 2016;65(5051):1445-52.
10. Massachusetts Department of Public Health. Confirmed Unintentional/Undetermined Opioid-related Overdose Deaths Among
Massachusetts Residents – Demographic Data Highlights. November 2016.
11. Massachusetts Department of Public Health. Data Brief: Opioid-related Overdose Deaths Among Massachusetts Residents. Febru-
ary 2017.
12. Stroud HD. Our Opioid Crisis Reveals Deep Racial Bias In Addiction Treatment. Time 2016.
13. Yankah EN. When Addiction Has a White Face. New York Times. 2016.
14. Ryder D. How White Users Made Heroin a Public-Health Problem. The Atlantic. 2015.
15. Lopez G. When a drug epidemic’s victims are white: How racial bias and segregation molded a gentler response to the opioid crisis.
2017.
16. Lipari RN, Park-Lee E, Van Horn S. America’s need for and receipt of substance use treatment in 2015. Rockville, MD: Substance
Abuse and Mental Health Services Administration, 2016.
17. Center for Health Information and Analysis. Access to Substance Use Disorder Treatment in Massachusetts. Boston, MA: 2015 15-
112-CHIA-01
18. National Institute on Aging. Prescription and Illicit Drug Abuse. In: National Institute on Aging, editor. 2014.