chapter – 14 : review of urban financeccs.in/sites/default/files/files/ch14_review of urban...
TRANSCRIPT
IL&FS ECOSMART
Chapter – 14 : Review of Urban Finance
Chapter – 14 Review of Urban Finance
Client : Dept. of Urban Development, Govt. of Delhi Consultant : IL&FS Ecosmart Limited
14-1
CHAPTER - 14 REVIEW OF URBAN FINANCE
14.1 TOWARDS A CITY DEVELOPMENT PLAN – FINANCIAL ASPECTS
The financial aspects of the City Development Plan (CDP) of Delhi is anchored onto the primary goal of the Jawaharlal Nehru National Urban Renewal Mission (JNNURM), of creating economically productive, efficient, equitable and responsive cities. This chapter details the municipal finances of the Municipal Corporation and other entities involved in the provision of services and outline the receipts and expenditure over the last five years, which would form the base for the preparation of Financial & Operating Plan (FOP).
14.2 REVIEW OF THE EXISTING FISCAL AND FINANCIAL SITUATION
The purpose of this section is to review and analyze the existing financial situation in terms of trends in revenues and expenditures by authorities concerned with the development of the city. The entities, which have been studied, are:
• Municipal Corporation of Delhi (Annex. 14-1) • New Delhi Municipal Council (Annex. 14-2) • Delhi Jal Board (Annex. 14-3)
14.3 OVERVIEW OF MCD FINANCES
MCD income and expenditure are maintained on cash basis. However MCD has shifted to accrual accounting system from FY 2002-03, but it is maintaining the accounts on cash system also as the accrual system has not been fully adopted due to lack of correct information on all assets and liabilities particularly property tax arrears. Municipal finances of Municipal Corporation of Delhi (MCD) have been reviewed for the last five years, commencing from the financial year (FY) 2000-01. Revenue income of MCD has grown to a level of Rs. 2258.47 crores in the FY 2004-05 from Rs. 1372.85 crores in FY 2000-01; the revenue income had registered an average annual growth rate of 11.47 percent whereas the revenue expenditure increased at an average annual rate of 7.68 percent, thus indicating a surplus position during this period. Capital income of MCD comprises of loans and grants, in the form of loan for infrastructure development and grants for improvement of basic services. A major share of capital income is in the form of grants. As observed in Table 14.1, the capital expenditure has been relatively consistent during the review period. During FY 2004-05, capital expenditure had increased to Rs. 727.11 crore from Rs. 596.29 crore in the FY 2000-01. The highest percentage of expenditure was on providing infrastructure for colonies.

Chapter – 14 Review of Urban Finance
Client : Dept. of Urban Development, Govt. of Delhi Consultant : IL&FS Ecosmart Limited
14-2
Table 14.1: Financial Status of MCD (in Rs. crore)
Item 2000-01 2001-02 2002-03 2003-04 2004-05
A. Revenue Account Opening balance 0.12 0.16 0.17 35.60 9.98 Income 1372.85 1570.66 1659.50 1652.11 2258.48 Expenditure 1372.80 1570.65 1624.07 1677.73 1950.47
Surplus 0.16 0.17 35.60 9.98 317.99 B. Capital Account Opening balance 139.50 121.15 127.87 168.86 105.64 Income 577.94 619.35 734.24 713.21 803.29 Expenditure 596.29 612.62 693.26 776.42 727.11
Surplus 121.15 127.88 168.86 105.65 181.83 Source: Non-Plan Income & Expenditure Budget 2001-02 to 2005-06, MCD
Plan & Resettlement Colonies Budget, 2001-02 to 2005-06, MCD The above table shows that the capital account has witnessed a surplus, implying that capital receipts are not being fully utilised. Further review of the revenue and capital accounts indicates that surplus has increased over period of 2000-01 to 2004-05. The sharp rise in the surplus of the revenue account in 2004-05 has been attributed to an abnormal rise in the Ways and Means advance.
Revenue Account
0
500
1000
1500
2000
2500
2000-01 2001-02 2002-03 2003-04 2004-05
In R
s. c
rore
Revenue Income
Revenue Expenditure

Chapter – 14 Review of Urban Finance
Client : Dept. of Urban Development, Govt. of Delhi Consultant : IL&FS Ecosmart Limited
14-3
Capital Account
0
100
200
300
400
500
600
700
800
900
2000-01 2001-02 2002-03 2003-04 2004-05
In R
s. c
rore
Capital Income
Capital Expenditure
14.3.1 Revenue Account
The revenue account comprises of two components, revenue income and revenue expenditure. Revenue income comprises of internal/own resources in the form of tax and non-tax items and external resources in the form of shared taxes/transfers and revenue grants from the State Government. Revenue expenditure comprises of expenditure incurred on salaries, operation & maintenance expenditure and debt servicing.
Revenue Income
The source wise revenue income is given in Table 14.2. Own sources comprises 68 percent of the income whereas, external source contributes 32 percent of the revenue income. Table 14.3 presents major head wise revenue income for 5-year review period.
Table 14.2: Source-wise Revenue income (in Rs. crore)
Item 2000-01 2001-02 2002-03 2003-04 2004-05
Own sources 971.35 1161.21 1185.53 1237.09 1243.05 Grants (Including Ways & Means Advance) 173.95 161.51 177.17 119.73 668.42 Assigned revenue 227.55 247.94 296.80 295.29 347.01
Total 1372.85 1570.66 1659.50 1652.11 2258.48 Source: Non-Plan Income & Expenditure Budget 2001-02 to 2005-06, MCD
Own Sources
Own-source income includes income from resource mobilisation activities of MCD in the form of taxes, user fees, fines, trade licences, etc. Own revenue sources are further classified as tax and non-tax sources that are generated by various sections of the MCD.

Chapter – 14 Review of Urban Finance
Client : Dept. of Urban Development, Govt. of Delhi Consultant : IL&FS Ecosmart Limited
14-4
• Tax Sources: About 56 percent of the revenue is contributed by tax sources, which includes Property Tax, Tax on Consumption and Sale of Electricity and Animal & Toll Tax.
Some of the main features of this head of revenue income are listed below: Income from own sources accounts to about 70 percent of revenue income
Income from tax sources has shown an average annual growth rate of 8.07
percent over the 5 year period, compounded annual growth rate of 7.52 percent and income from fines and fees increased at an average annual growth rate of 30 percent over the same period.
Major items of own-source income, contributing towards revenue income,
include property tax (41%) and other income (6%) which includes income from commercial ventures, development charges etc.
Table 14.3: Major head-wise break-up of Revenue Income (in Rs. Crore)
S. No. Item 2000-01 2001-02 2002-03 2003-04 2004-05
1 Municipal Taxes and Rates 803.56 900.41 958.52 1080.25 1074.13
2 Rents and Fees 21.62 20.57 27.71 31.74 60.53 3 Others 146.16 240.23 199.30 125.10 108.39
4 Global Sharing of Taxes- Assigned 227.55 247.94 296.80 295.29 347.01
5 Education Grant- Reimbursement Grant 93.95 101.51 117.17 119.73 358.42
6 Ways and Means Advance 80.00 60.00 60.00 0.00 310.00 Total Revenue Income 1372.85 1570.66 1659.50 1652.11 2258.48
Source: Non-Plan Income & Expenditure Budget 2001-02 to 2005-06, MCD
Income through own-source heads that contribute substantially towards revenue income include:
Source wise break-up of Revenue income
Own sources68%
Grants15%
Assigned revenue
17%
Own sources
GrantsAssigned revenue

Chapter – 14 Review of Urban Finance
Client : Dept. of Urban Development, Govt. of Delhi Consultant : IL&FS Ecosmart Limited
14-5
Property Tax
Income from property tax is the single largest and most elastic source of revenue, contributing about 40-45 percent to the total revenue. Income through Property Tax up till 31-3-2004 was based on the Annual Rental Value of the property. From 1-4-2004 a new system for assessing properties has been introduced called the Unit Area Method of property tax.
Unit Area Assessment The Unit Area Method of Assessment is based on fixing a unit area value per square meter of covered space for calculation of property tax. The tax for a particular property is based on the annual value of the property arrived at, by multiplying unit area value assigned to the colonies/localities with the covered area of the property and the multiplicative factors for occupancy, age, structure and use. The Unit Area Values category wise is given in the table below:
Category A B C D E F G H Value: (in Rs. Per square meter) 630 500 400 320 270 230 200 100
The above values are valid up till Assessment Year 2006 -2007 The Unit Area Value for vacant land in excess of 75 % of the total plot area would be computed at a factor of 0.3 of the base unit value of the colony. The Multiplicative factors are given below:
A. Structure Factor (SF)
Structure Type Pucca Semi Pucca Kucha Factor (SF) 1.0 0.7 0.5
B. Age Factor
Year of
completion Prior to
April 1960 April 1960 to March
1969
April 1970 to March
1979
April 1980 to March
1989
April 1990 to March
1999
April 2000 Onwards
Factor (AF) 0.5 0.6 0.7 0.8 0.9 1.0
C. Occupancy Factor (OF) - For Residential Properties
Category A B C D E F G H Factor (OF)
2.0 2.0 2.0 2.0 2.0 2.0 2.0 2.0
D. Use Factor (UF) For Non Residential Uses:
Use I II III IV V
Factor (UF) 1 2 3 4 10
Where: (I) Public Purpose (II) Public Utility/Telecom towers (III) Industry, Entertainment, Recreation and Clubs (IV) Business, restaurants, Hotels up to 2 star (V) 3 Star and above Hotels/Towers/ Hoardings.
Self-Assessment and Calculation of Tax Under Unit Area Method: In the old system of property taxation the onus for raising demand rested with the corporation, whereas in the current system of property taxation, concept of self-assessment has been introduced for the first time whereby, the onus for filing returns and paying taxes is that of the owner/occupier. The method of calculating Self-assessment tax is as follows:

Chapter – 14 Review of Urban Finance
Client : Dept. of Urban Development, Govt. of Delhi Consultant : IL&FS Ecosmart Limited
14-6
Step 1: Measure the covered area of property; Step 2: Take the unit area value of the locality /category notified by the corporation; Step 3: Calculate the annual value by using the following formula:
Annual Value = Unit Area Value X Covered Area X Multiplicative Factors Step 4: Where different portions of property are put to different uses or other parameters like concessions/rebates applicable are different, the annual value will be calculated for each portion separately. Step 5: Calculate tax by multiplying the above value by the respective rate of tax as notified by the corporation from year to year.
Duty on transfer of properties Any property transaction in MCD limits attracts duty on transfer of properties at
rate 5% of the stamp duty amount. Toll Tax Toll tax is payable on all vehicles entering National capital Territory of Delhi
and ranges from Rs. 25 - Rs. 500 per day for various categories of vehicles, MCD also offers monthly and quarterly passes also for toll tax.
Tax on Consumption and sale of Electricity Any consumer in MCD is liable to pay tax to MCD on electricity consumption;
currently it is at 5% of billing amount. If consumers have captive power plants than the rate payable is 10 paise for KWH and tax on electricity suppliers is also 10 paise for KWH.
• Non-Tax Sources: Non-tax
sources include all non-tax revenues such as fees and charges levied by the MCD. Such revenue sources include income from education fee, fines for cattle pounds, fees from hospitals, fees from vehicles licenses, special registration for trades, rents on land, buildings and car parking etc.
The income from non-tax revenue receipts has increased marginally from Rs 167.78 crores in FY 2000-01 to Rs. 168.92 crores in FY 2004–05. External Sources
The external sources of MCD include income from global sharing of taxes from Government of Delhi, education grant and ways and means advances. Government of Delhi transfers about 5.5% of its income to MCD under the head of as global sharing of taxes as per SFC recommendation, this source contributes only 17% of municipal revenue income and have registered an average annual growth rate of about 12%.
Composition of Revenue Income(5-year Average)
Education Grant- Reimbursement
Grant9%
Others10%
Rents and Fees2%
Municipal Taxes and Rates
56%
Global Sharing of Taxes- Assigned
17%
Ways and Means Advance
6%

Chapter – 14 Review of Urban Finance
Client : Dept. of Urban Development, Govt. of Delhi Consultant : IL&FS Ecosmart Limited
14-7
In addition MCD receives grant towards reimbursement of education expenditure and for improvements in resettlement colonies, though 60% of education expenditure and 100% of plan expenditure for resettlement colonies is reimbursable, however MCD gets 30% of education expenditure and for resettlement colonies the receipt is almost nil and this grant is limited to maximum of 5% of Government of Delhi income. These grants contribute only 9% of municipal revenue income and have registered an average annual growth rate of about 3.76%.
In addition to SFC and education grants MCD receives some advances towards
ways and means to meet the expenditure. The ways and means advance is inconsistent and on an average it accounts for about 6% of municipal revenue income.
Revenue Expenditure
Revenue expenditure of MCD has been analyzed department wise, which includes both establishment and operations & maintenance expenditure; the MCD doesn’t classify establishment expenditure separately. Thus the expenditure analysis is discussed on each department basis, which is General Supervision, Collection of Revenues, Education, Public Health and Medical Relief, Conservancy Scavenging and Street Cleaning, Roads and Public Lighting and Others.
Revenue expenditure grew from Rs.1372.80 crores in the year FY 2000-‘01 to Rs.1950.47 crores in FY 2004-‘05 at an average annual growth rate of 7.68 percent. The major items of expenditure include Education (23%), Conservancy and Street Cleaning (20%) and Others (33%). The head “Others” comprises of expenses on garden & open spaces, libraries, licensing and miscellaneous items. Table 14.4 gives a major head wise break-up of revenue expenditure for 5-year review period.
Com position of Revenue Expenditure(5-year Average)
Education23%
General Supervision, collection of
revenues etc3%
Roads and Public Lighting
9%
Others33%
Conservancy Scavenging and Street Cleaning
20%
Public Health and Medical Relief
12%

Chapter – 14 Review of Urban Finance
Client : Dept. of Urban Development, Govt. of Delhi Consultant : IL&FS Ecosmart Limited
14-8
Table 14.4: Major head wise break-up of Revenue Expenditure (in Rs. Crore)
No. Item 2000-01 2001-02 2002-03 2003-04 2004-05
1 General Supervision, collection of revenues etc 48.00 53.20 53.12 56.14 65.75
2 Social Welfare & Development Services
i Education 338.94 333.25 369.41 390.83 455.88 ii Public Health 37.42 37.74 39.22 40.92 48.38
iii Conservancy and Street Cleaning 263.40 275.98 298.98 334.82 378.60
iv Scavenging, Drains and Sewers 11.13 8.83 11.40 11.22 11.60
v Medical Relief 124.45 127.52 147.10 166.18 190.28 3 Recreational Activity i Gardens and Open Spaces 61.87 65.07 63.90 69.82 82.69 ii Libraries 0.66 0.66 0.66 0.97 1.31 4 Public Works & Safety i Roads and Public Lighting 107.65 154.71 132.04 152.27 192.61 ii Fire Fighting - - - - - 5 Land Development 26.49 24.44 23.96 28.95 33.21
6 Misc. including New Works 352.78 489.26 484.27 425.61 490.15
TOTAL 1,372.80 1,570.65 1,624.07 1,677.73 1,950.47 Source: Non-Plan Income & Expenditure Budget 2001-02 to 2005-06, MCD
Debt Servicing
A review of the loan statement of MCD reveals that as on 31-03-2005 MCD had a total outstanding debt of Rs. 755.66 crores and during the FY 2005-2006 it had done a debt servicing of Rs. 64.20 crores.
14.3.2 Capital Account
Income and expenditure items under this account are primarily nonrecurring in nature. Income items include loans, contributions by Government of National Capital Territory of Delhi, other agencies and capital grants under various State and Central Government programmes. Expenditure items include expenses booked under developmental works and purchase of capital assets.
Capital Income
Analysis of this account indicates that 19 percent of capital income is in the form of loans and 81 percent by way of grants. Table 14.5: Source wise break-up of Capital income (in Rs. crore)
Item 2000-01 2001-02 2002-03 2003-04 2004-05
Grants 515.00 549.45 629.18 600.46 651.46 Loans 62.94 69.90 105.06 112.75 151.84 Total 577.94 619.35 734.24 713.21 803.29
Source: Plan & Resettlement Colonies Budget, 2001-02 to 2005-06, MCD

Chapter – 14 Review of Urban Finance
Client : Dept. of Urban Development, Govt. of Delhi Consultant : IL&FS Ecosmart Limited
14-9
Capital Expenditure
Capital expenditure has been directed towards new parks, water supply, sewerage and works for improvement of slums. The highest percentage has been expended on infrastructure for colonies (27%) and roads (17%). The amount of expenditure has increased from Rs.596.29 crore in FY 2000-01 to Rs.727.11 crore in FY 2004-05.
Table 14.6: Major head wise break-up of Capital Expenditure (in Rs. Crore)
Items 2000-01
2001-02
2002-03
2003-04 2004-05
Education Related Items 119.31 NA 99.42 101.19 141.96
Public Health and Medical 105.88 NA 136.45 127.00 122.05
Roads 97.32 NA 114.18 104.37 124.91 Infrastructure Facilities in Colonies 150.25 NA 177.24 177.40 198.29
Environmental Improvement 3.53 NA 9.95 16.75 15.77
MLA and MP LAD Schemes 81.44 NA 112.29 179.94 58.55
Trans- Yamuna 23.84 NA 30.79 48.85 44.09
Others 14.73 NA 12.94 20.93 21.47
Total Expenditure 596.29 612.62 693.26 776.42 727.11 Source: Plan & Resettlement Colonies Budget, 2001-02 to 2005-06, MCD
There is an overall surplus in the capital account indicating a capital utilization ratio of less than 1.
14.3.3 Key Issues and Conclusions
Table 14.7: Key Indicators
Sl. Item 2000-01 2001-02 2002-03 2003-04 2004-05
1 Operating Ratio 1.00 1.00 0.98 1.02 0.86
2 Share of Property Tax 44.66% 43.74% 42.43% 46.54% 28.60%
3 Share of Internal Revenues 70.75% 73.93% 71.44% 74.88% 55.04%
4 Share of Assigned Revenues 16.57% 15.79% 17.88% 17.87% 15.36%
5 Share of Grants 6.84% 6.46% 7.06% 7.25% 15.87%
6 Ways & Means advance 5.83% 3.82% 3.62% 0.00% 13.73%
7 Capital Utilization ratio 0.83 0.83 0.80 0.88 0.79
The following issues emerge from the above analysis carried out on the finances of MCD:

Chapter – 14 Review of Urban Finance
Client : Dept. of Urban Development, Govt. of Delhi Consultant : IL&FS Ecosmart Limited
14-10
Revenue Account Status The revenue account of MCD from the year 2002-03 has shown a healthy surplus. The operating ratio over the period of analysis has hovered around unity indicating that revenue income is being wholly utilized to meet revenue expenditure.
Revenue Income MCD has generated over 68 percent of its revenue through its own sources. Dependency on the grants is to the extent of 15 percent. Though Property tax is the largest own source revenue income, there is still a scope for improvement by expanding the base by way of covering un-assessed properties. The average collection on current demand is around 55 percent whereas average collection against recovery of arrears is just about 6% giving an overall collection performance of 19 percent. Revenue Expenditure It is observed that about 60-65% of the total revenue income is being spent on the salaries and other related costs which is well above the average when compared to other local bodies – the range being 30-40 percent of revenue income. Capital Account status The capital account has consistently given a surplus indicating that there is an underutilization of funds available for carrying out the development work.
14.4 OVERVIEW OF NDMC FINANCES
This section covers the details of financial performance of New Delhi Municipal Council (NDMC) during the last five years. NDMC performs the same functions as MCD. The difference being, NDMC covers a much smaller area. NDMC generates its revenue mostly through provision of electricity; water supply etc. and its major expenditure heads are education, water supply & sanitation, social welfare etc. Revenue income of NDMC has grown to a level of Rs. 1078.98 crores in the FY 2004-05 from the level of Rs. 749.52 crores in the FY 2000-01. The revenue income has grown at an average annual growth rate of 10.04 percent against an annual average rate of increase of 6.57 percent in case of revenue expenditure thus indicating a surplus position during this period.
Table 14.8: Final Status of NDMC (in Rs. Crores)
Item 2000-01 2001-02 2002-03 2003-04 2004-05 A. Revenue Account Income 749.52 770.87 883.38 863.35 1078.98 Expenditure 747.22 743.68 775.72 801.48 954.84
Surplus 2.3 27.19 107.66 61.87 124.14 B. Capital Account
Income 11.21 11.71 10.18 15.08 13.74
Expenditure 14.99 19.61 9.8 15.8 11.64
Chapter – 14 Review of Urban Finance
Client : Dept. of Urban Development, Govt. of Delhi Consultant : IL&FS Ecosmart Limited
14-11
Item 2000-01 2001-02 2002-03 2003-04 2004-05 Surplus/(Deficit) (-3.78) (-7.9) 0.38 (-0.72) 2.1
Source: Budgets 2002-03 to 2006-07, NDMC
The capital account consists of grants & loans for activities relating to infrastructure development & improvement of basic services such as medical, education etc.
14.4.1 Revenue Account
The revenue account comprises of two components, revenue income and revenue expenditure. Revenue income comprises of internal/own resources in the form of tax and non-tax items. External resources are in the form of shared taxes/transfers and revenue grants from the State Government. Revenue expenditure comprises of expenditure incurred on salaries, operation & maintenance expenditure and debt servicing.
Revenue Income
Revenue income comprises receipts generated through Own Sources as well as receipts in the form of Assigned Revenues and Grants. Own sources
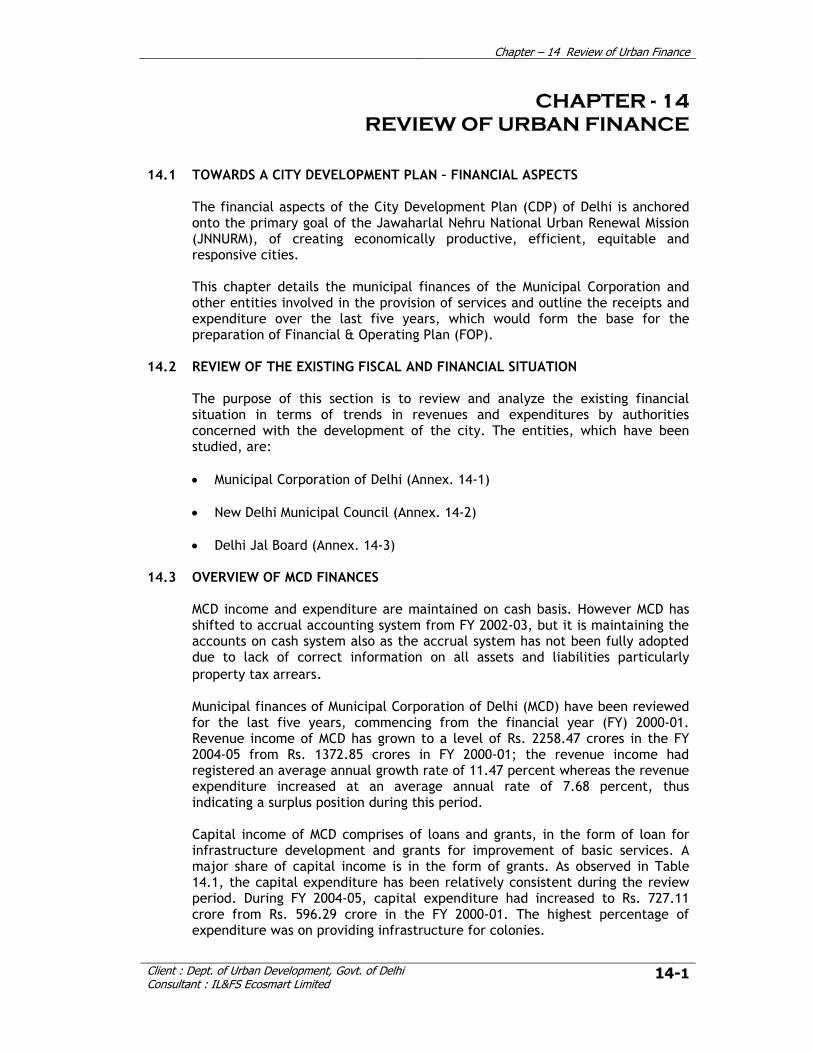
Own source of revenue income includes income in the form of taxes, fees & fines, supply of electricity, supply of water etc. Own sources are further classified into tax and non-tax sources. • Tax Sources: About 19 percent of the total revenues are derived from the
Tax sources which include House Tax, Duty on Transfer of Property, Advertisement Tax and other taxes.
• Non-Tax Sources: NDMC’s major earnings are through non-tax sources,
which include income, generated through supply of electricity, which forms 60 percent of the total revenue. The revenue income has increased from Rs. 749.51 crore in FY 2000-01 to Rs.1078.97 crore in FY 2004-05.
Table 14.9: Source wise break-up of Revenue income (in Rs. Crore)
Item 2000-01 2001-02 2002-03 2003-04 2004-05
Own sources 726.79 743.06 853.30 827.79 1022.90 Grants 19.37 23.54 23.81 29.17 44.79 Assigned revenue 3.36 4.28 6.28 6.39 11.29
Total 749.51 770.88 883.40 863.35 1078.97Source: Budgets 2002-03 to 2006-07, NDMC

Chapter – 14 Review of Urban Finance
Client : Dept. of Urban Development, Govt. of Delhi Consultant : IL&FS Ecosmart Limited
14-12
External Assistance
This head comprises receipts in the form of Assigned Revenue and Grants, which form 4 percent of the total revenue.
Main Features of Revenue account (Receipts) are as follows:
Income from own sources accounts for about 96 percent of the total revenue.
Revenue from sale of electricity accounts for about 59 percent of the total revenue and has shown an average annual growth rate of 3.47 percent
Income from tax sources has shown an average annual growth rate of 15 percent.
Table 14.10: Major head wise break-up of revenue Income (in Rs. Crore)
Item 2000-01
2001-02
2002-03
2003-04 2004-05 Average % of total
revenue Taxes & other duties 102.83 123.95 152.17 145.92 176.53 140.28 16.14% Interest 30.28 24.55 32.53 27.43 178.94 58.75 6.76% Administrative Department 6.83 0.41 5.32 0.46 1.28 2.86 0.33% Social & Development Services 4.24 3.43 3.31 3.43 4.17 3.72 0.43% Electricity 470.32 483.71 534.14 534.70 537.34 512.04 58.91% Water Supply 0.00 2.02 0.00 15.02 14.46 6.30 0.72% Roads 0.00 0.00 0.00 0.00 0.00 0.00 0.00% Other Municipal Works 94.23 97.14 112.40 97.92 109.75 102.29 11.77% Loans & Advances to Employees 1.56 1.46 1.29 1.38 1.06 1.35 0.16% Misc. External Assistance 19.37 23.54 23.81 29.17 44.79 28.14 3.24% Deposit Works 19.86 10.66 18.41 7.92 10.66 13.50 1.55% TOTAL 749.52 770.87 883.38 863.35 1078.98 869.22 100%
Source: Budgets 2002-03 to 2006-07, NDMC
Source wise break-up of RevenueAssigned revenue
1%Grants
3%
Own sources96%
Own sources
Grants
Assigned revenue

Chapter – 14 Review of Urban Finance
Client : Dept. of Urban Development, Govt. of Delhi Consultant : IL&FS Ecosmart Limited
14-13
Revenue Expenditure
Revenue expenditure has been analysed based on expenditure heads broadly classified under the following heads: Taxes & other Duties, Interest, Administrative Department, Social & Development Services, Electricity, Water Supply, Roads and Other Municipal Works etc. Revenue expenditure grew from Rs.747.22 crores in the FY 2000-01 to Rs. 954.84 crores in FY 2004-05 at an average annual growth rate of 6.57 percent. The major items of expenditure include Electricity (41%), Social & Development Services (16%), Water Supply (6%) and Administrative Department (19%).
Table 14.11: Major Head wise break-up of Revenue Expenditure (in Rs. Crore)
Item 2000-01
2001-02
2002-03
2003-04
2004-05 Average
% of total
revenue Taxes & other duties 0.92 0.95 1.20 1.27 1.33 1.13 0.14 Interest 42.85 7.11 5.44 4.83 1.89 12.42 1.54 Administrative Department 110.59 125.26 168.02 139.42 228.36 154.33 19.18 Social & Development Services 123.01 124.21 121.65 136.24 144.62 129.95 16.15 Electricity 272.62 334.86 335.46 354.49 370.49 333.58 41.46 Water Supply 55.61 47.20 39.57 47.85 61.53 50.35 6.26
Components of Revenue Expenditure
Taxes & other duties0.14%
Loans & Advances to Employees
0.14%
Interest2%
Administrative Department
19%
Misc. External Assistance
3% Deposit Works1%
Water Supply6%
Other Municipal Works9%
Roads2%
Electricity42%
Social&Dvlpmnt Services
16%
Taxes & otherdutiesInterest
Adminis trativeDepartmentSocial&DvlpmntServicesElectricity
Water Supply
Roads
Other MunicipalWorksLoans & Advancesto EmployeesMisc. ExternalAssistanceDeposit Works

Chapter – 14 Review of Urban Finance
Client : Dept. of Urban Development, Govt. of Delhi Consultant : IL&FS Ecosmart Limited
14-14
Item 2000-01
2001-02
2002-03
2003-04
2004-05 Average
% of total
revenue Roads 12.23 15.05 16.43 25.84 13.30 16.57 2.06 Other Municipal Works 72.12 63.20 68.42 77.15 93.13 74.80 9.30 Loans & Advances to Employees 1.44 1.43 1.04 0.94 0.62 1.09 0.14 Misc. External Assistance 40.23 12.25 10.46 7.34 33.83 20.82 2.59 Deposit Works 15.60 12.16 8.03 6.11 5.74 9.53 1.18
TOTAL 747.22 743.68 775.72 801.48 954.84 804.59 100
Source: Budgets 2002-03 Debt Servicing A review of the loan statement of NDMC reveals that as on 31.3.2004 NDMC had Rs.32.01 crores as outstanding loan. During the FY 2004-2005 it repaid the whole of this amount together with an outflow on account of interest of Rs.1.88 crores. NDMC has become a zero debt corporation since then. Establishment Expenditure Establishment expenditure (inclusive of Bonus, Gratuity, Pension & other employee benefits) of all sections accounts for just about 36 percent of the total revenue expenditure. The growth in this component has been at an overall average annual growth rate of 6.04 percent.
Components of Revenue ExpenditureTaxes & other
duties0.14%
Loans & Advances to Employees
0.14%
Interest2%
Administrative Department
19%
Misc. External Assistance
3%Deposit Works
1%
Water Supply6%
Other Municipal Works
9%
Roads2%
Electricity42%
Social&Dvlpmnt Services
16%
Taxes & otherdutiesInterest
AdministrativeDepartmentSocial&DvlpmntServicesElectricity
Water Supply
Roads
Other MunicipalWorksLoans & Advancesto EmployeesMisc. ExternalAssistance

Chapter – 14 Review of Urban Finance
Client : Dept. of Urban Development, Govt. of Delhi Consultant : IL&FS Ecosmart Limited
14-15
Table 14.12: Establishment Expenditure Items 2000-01 2001-02 2002-03 2003-04 2004-05 Average Salary & Allowance 208.58 221.01 231.59 254.40 265.91 236.30
Other Employee Cost 47.25 44.02 47.51 56.86 56.99 50.52
Total 255.83 265.03 279.10 311.26 322.89 286.82 % of Revenue Expenditure 34.24 35.64 35.98 38.84 33.82 35.70
% of Revenue Income 34.13 34.38 31.59 36.05 29.93 33.22
Source: Budgets 2002-03 to 2006-07, NDMC 14.4.2 Capital Account
Capital Income : Capital income is basically the plan funding received from various agencies for carrying out work under the various heads. A major portion of the receipts received under this head is allocated for Roads & Bridges. MLA Constituency Fund gets the second largest share. The figure for the five-year period is as given below:
Table 14.13: Plan funding for 5 Years (in Rs. Crore) Items 2000-01 2001-02 2002-03 2003-04 2004-05 Roads & Bridges 1.68 3.00 1.75 7.42 5.75 Water Supply & Sanitation 1.50 0.50 0.63 1.25 0.63 Housing - - - - - Urban development 2.01 1.68 1.50 0.32 0.60 Education 1.73 1.58 1.08 0.63 0.50 Welfare of SC/ST/OBC 0.15 - - - - Medical 0.31 0.50 0.50 0.50 1.00 Public Health 0.00 0.00 0.13 0.30 0.21 Agriculture & Allied Services - - -
- -
Power - - - - - Economic Services - - - - - Nutrition 0.27 0.30 0.25 0.30 0.75 Labour & Labour Welfare 0.05 0.01 - 0.01 - Social Welfare 0.53 - - - - Sports & Youth Services 0.04 - - - - MLA Constituency Fund 2.94 4.14 4.35 4.35 4.30 TOTAL 11.21 11.71 10.18 15.08 13.74
Source: Budgets 2002-03 to 2006-07, NDMC
0
10
20
30
40
50
60
2000-01 2001-02 2002-03 2003-04 2004-05
Capital ExpenditureCapital Receipts

Chapter – 14 Review of Urban Finance
Client : Dept. of Urban Development, Govt. of Delhi Consultant : IL&FS Ecosmart Limited
14-16
Capital Expenditure
The trend for capital expenditure has been varying over the five-year period. It saw a sharp fall in the year 2002-03. The major heads of capital expenditure include Roads & Bridges, Water Supply & Sanitation, and Social Welfare etc. The break up for major heads has been presented in a table below.
Table 14.14: Plan expenditure for 5 Years (In Rs. Crore)
Items 2000-01 2001-02 2002-03 2003-04 2004-05 Roads & Bridges 3.40 4.46 2.48 6.30 5.75 Water Supply & Sanitation 1.93 1.66 0.68 0.82 0.77 Housing - - - - - Urban development 1.19 0.70 0.20 0.41 0.68 Education 2.52 1.68 0.87 1.32 0.58 Welfare of SC/ST/OBC 0.10 0.10 - 0.19 - Medical 0.40 0.21 0.08 0.45 1.47 Public Health 0.08 0.07 0.23 0.39 0.29 Agriculture & Allied Services 0.32 0.02 0.14 0.12 - Power 2.89 6.70 - - - Economic Services - 0.00 - - - Nutrition 0.25 0.39 0.21 0.22 0.42 Labour & Labour Welfare 0.02 0.01 0.01 0.09 - Social Welfare 0.47 0.50 0.22 0.15 (0.00) Sports & Youth Services 0.06 - 0.02 - - MLA Constituency Fund 1.35 3.12 4.64 5.33 1.68 TOTAL 14.99 19.61 9.80 15.80 11.64
Source: Budgets 2002-03 to 2006-07, NDMC 14.4.3 Key Issues and Conclusions
Table 14.15: Key Indicators
Item 2000-01 2001-02 2002-03 2003-04 2004-05 Operating Ratio 1.00 0.96 0.88 0.93 0.88 Share of assigned revenue (%) 0.45 0.56 0.71 0.74 1.05
Share of grants (%) 2.58 3.05 2.70 3.38 4.15 Share of internal sources (%) 96.97 96.39 96.59 95.88 94.80
Share of Establishment Expenditure to Revenue Expenditure (%)
34.24 35.64 35.98 38.84 33.82
Share of Establishment Expenditure to Revenue Income (%)
34.13 34.38 31.59 36.05 29.93

Chapter – 14 Review of Urban Finance
Client : Dept. of Urban Development, Govt. of Delhi Consultant : IL&FS Ecosmart Limited
14-17
The following issues emerge from the above analysis carried out on the finances of NDMC.
Revenue Account Status The revenue account of NDMC from the year 2002-03 has shown a healthy surplus. The operating ratio over the period of analysis has hovered around unity indicating that revenue income is being wholly utilized to meet expenditure. Revenue Income NDMC is generating about 96% of income through its own sources which clearly indicates that it is able to self sustain and the reliance on the grants is minimal. The surplus in the account implies that the funds are available to meet the deficiency in the Capital account as and when it arises Revenue Expenditure It is observed that about 30-35% of the total revenue income is being spent on the salaries and other related costs which is well below the average when compared to other local bodies.
14.5 OVERVIEW OF DJB FINANCES
This section briefly covers the financial status of the Delhi Jal Board (DJB). DJB is committed for augmentation of water supply in Delhi and has taken several steps in this direction. The main sources of revenue for DJB are water charges, gas charges, scavenging tax, and development charges. On carrying out the analysis from the limited data made available, it can be seen that DJB finances are not in good condition, since, in five years under review, there was a deficient balance on revenue account on year to year basis without considering previous year balances. On the other hand the capital account has consistently shown a surplus thereby implying that capital income is being utilized to fund revenue expenditure.
14.5.1 Revenue Account
Table 14.16: Revenue Account status of DJB (in Rs. Crore)
Items 2000-01 2001-02 2002-03 2003-04 2004-05
A. Revenue Account
Income 286.18 403.84 841.45 542.87 530.20 Expenditure (inclusive of Loan & Interest repayment) 700.77 891.64 1071.28 1025.26 1344.05
Surplus/(Deficit) (414.59) (487.80) (229.83) (482.39) (813.85) Source: Information supplied by DJB, 2006
Chapter – 14 Review of Urban Finance
Client : Dept. of Urban Development, Govt. of Delhi Consultant : IL&FS Ecosmart Limited
14-18
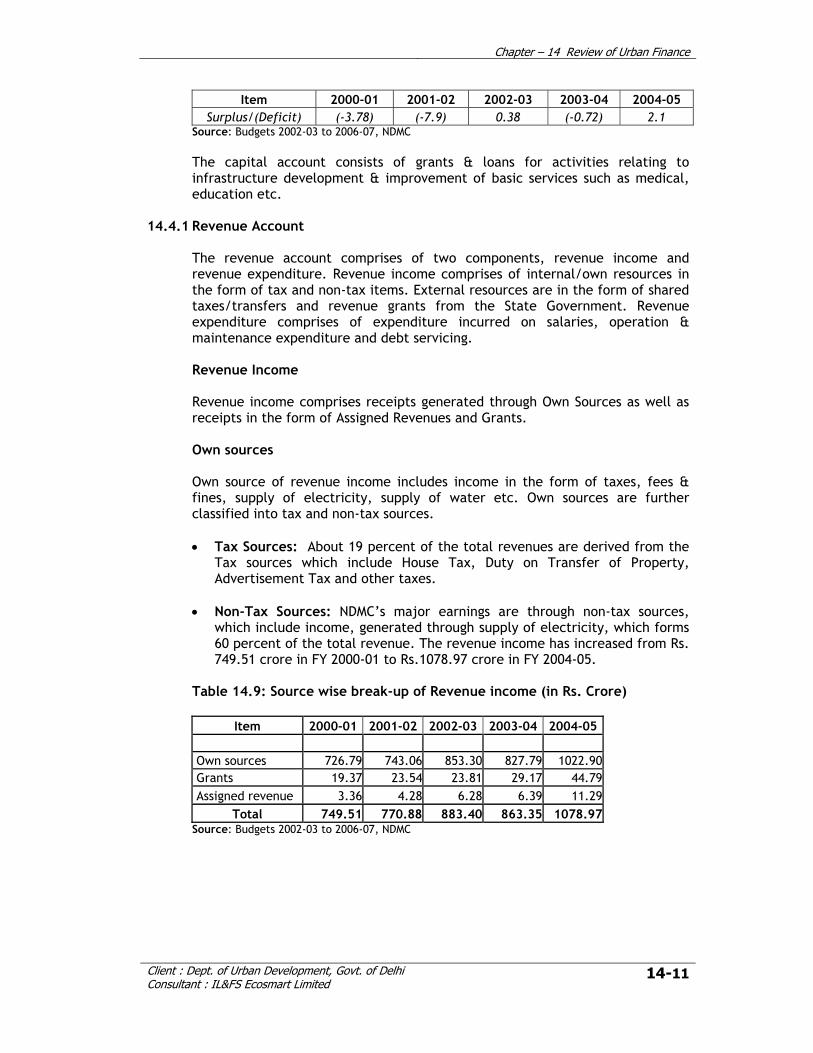
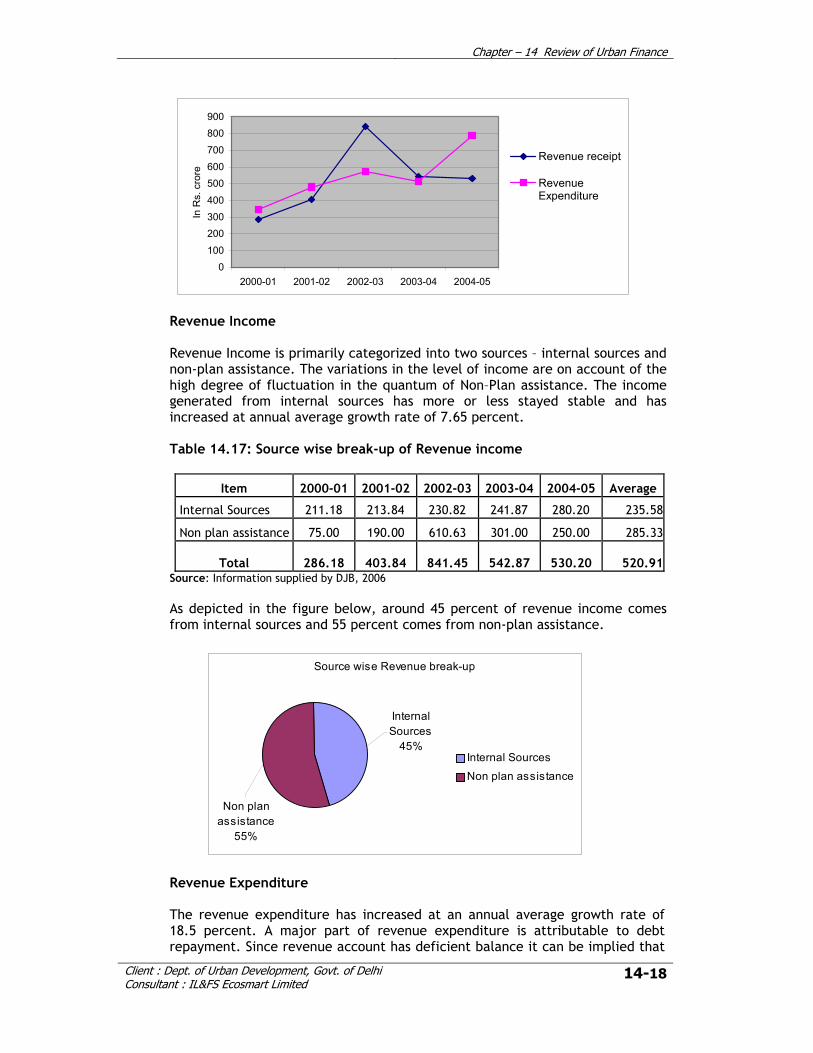
Revenue Income
Revenue Income is primarily categorized into two sources – internal sources and non-plan assistance. The variations in the level of income are on account of the high degree of fluctuation in the quantum of Non–Plan assistance. The income generated from internal sources has more or less stayed stable and has increased at annual average growth rate of 7.65 percent. Table 14.17: Source wise break-up of Revenue income
Item 2000-01 2001-02 2002-03 2003-04 2004-05 Average
Internal Sources 211.18 213.84 230.82 241.87 280.20 235.58
Non plan assistance 75.00 190.00 610.63 301.00 250.00 285.33
Total 286.18 403.84 841.45 542.87 530.20 520.91Source: Information supplied by DJB, 2006
As depicted in the figure below, around 45 percent of revenue income comes from internal sources and 55 percent comes from non-plan assistance.
Source wise Revenue break-up
Internal Sources
45%
Non plan assistance
55%
Internal Sources
Non plan assistance
Revenue Expenditure
The revenue expenditure has increased at an annual average growth rate of 18.5 percent. A major part of revenue expenditure is attributable to debt repayment. Since revenue account has deficient balance it can be implied that
0100
200300400
500600700
800900
2000-01 2001-02 2002-03 2003-04 2004-05
In R
s. c
rore
Revenue receipt
RevenueExpenditure

Chapter – 14 Review of Urban Finance
Client : Dept. of Urban Development, Govt. of Delhi Consultant : IL&FS Ecosmart Limited
14-19
not just the operational costs but also the repayments of Principal amount of loans is being funded through the Capital account. The operational expenses have increased at an average annual growth rate of 25.5 percent.
Table 14.18: Revenue Expenditure
Expenditure Year
Total expense Repayment of loan
and interest Net Operational
expenses 2000-01 700.77 357.15 343.62 2001-02 891.64 410.97 480.67 2002-03 1071.28 499.14 572.14 2003-04 1025.26 509.88 515.38 2004-05 1344.05 555.52 788.53
Source: Information supplied by DJB, 2006
14.5.2 Capital Account
Capital Income : The capital income comprises of grants & loans received from Government of NCT of Delhi. It is paid to DJB on submission of request to Delhi Government. The grants are primarily utilized for providing water supply to weaker sections supply of water through tankers to unauthorized colonies. The receipts on capital account are mainly under heads: Water & Sewerage. Loans account for 93 percent of the total capital receipts and the balance is received in the form of Grants.
Table 14.19: Source-wise Breakup of Capital Receipts
Item 2000-01 2001-02 2002-03 2003-04 2004-05 Grants 64.1 60.02 58.15 7.50 7.80 Loans 381.43 439.45 570.45 601.23 686.96 Total 445.53 499.47 628.60 608.73 694.76
Source: Information supplied by DJB, 2006
Capital Expenditure : Capital expenditure is directed towards development of fixed assets under the broad classification of Water & Sewerage. The analysis of last five years shows that capital expenditure varies between Rs. 375.75 crores to Rs. 674.89 crores.
Source Wise Break-up of Capital Receipts
Grants7%
Loans93%
Grants
Loans

Chapter – 14 Review of Urban Finance
Client : Dept. of Urban Development, Govt. of Delhi Consultant : IL&FS Ecosmart Limited
14-20
Table 14.20: Capital income and expenditure of DJB (in Rs. Crore)
Year Receipt Expenditure Water Sewerage Total Water Sewerage Total
2000-01 259.3 186.23 445.53 239.56 136.19 375.75 2001-02 317.3 182.17 499.47 393.56 176.85 570.41 2002-03 454.49 174.11 628.6 456.64 137.8 594.44 2003-04 446.55 162.18 608.73 453.43 140.19 593.62 2004-05 492.74 202.02 694.76 473.49 201.4 674.89
Source: Information supplied by DJB, 2006 14.5.3 Key Issues & Conclusions
The revenue and capital balances indicate that DJB is not quite able to meet its recurrent expenditure out of its own sources. As explained above the capital receipts generate maximum revenues. The operating ratio has been more than unity indicating a trend of going beyond means. The authority has been servicing its debts by utilizing capital receipts thus implying that instead of asset creation the capital receipts are being diverted towards meeting recurring expenses.

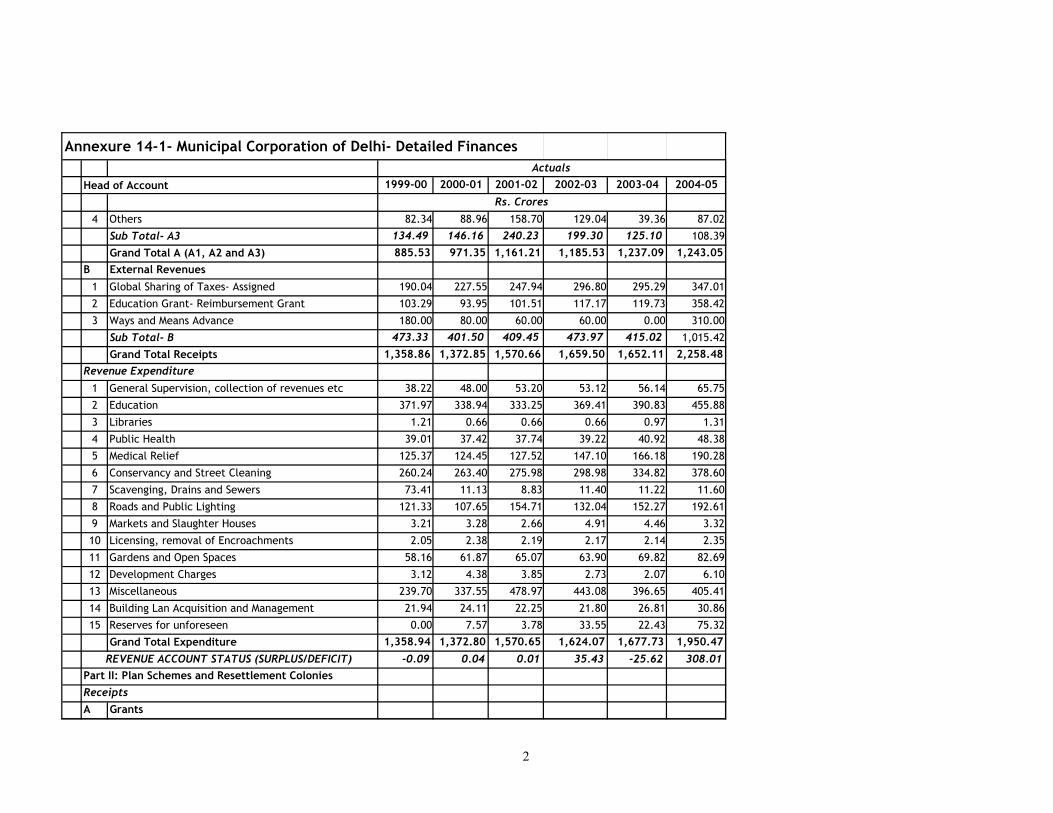
Annexure 14-1- Municipal Corporation of Delhi- Detailed Finances
Head of Account 1999-00 2000-01 2001-02 2002-03 2003-04 2004-05
Part I: Non Plan Income and Expenditure OPENING BALANCE 0.20 139.61 145.96 128.04 204.45 115.62Revenue ReceiptsA Internal RevenuesA1 Municipal Taxes and Rates
1 General Tax from Urban and Rural Areas 558.94 613.11 687.00 704.15 768.94 645.88
2 Taxes on Vehicles and Animals 0.40 0.43 0.49 0.63 0.87 1.10
3 Theater Tax 0.66 0.73 0.82 0.09 0.13 0.09
4 Tax on Advertisement 6.92 7.59 8.51 10.38 11.59 17.51
5 Tax on Building Permission 0.47 0.51 0.57 0.39 2.88 1.10
6 Toll tax 46.26 50.74 56.85 53.98 68.03 78.06
7 Duty on Transfer of Property 64.28 70.51 79.01 112.98 143.37 167.94
8 Tax on consumption and Sale of Electricity 54.63 59.93 67.15 75.92 84.44 162.46
Sub Total- A1 732.57 803.56 900.41 958.52 1,080.25 1,074.13
A2 Rents and Fees
1 Fines and Process Fee 3.16 3.47 3.29 3.65 6.70 8.89
2 Education Fee 0.23 0.47 0.51 0.25 0.24 0.26
3 Fines for Cattle Pounds 0.00 0.00 0.00 0.18 0.19 0.13
4 Fees from Hospitals 0.99 1.09 1.27 1.13 1.16 1.22
5 Fees from Vehicles Licenses 0.00 0.00 0.00 0.74 1.25 0.27
6 Tehbazari fee etc 0.00 0.00 0.00 3.94 3.79 28.23
7 Rents on Land, Buildings and Car Parkings 3.83 4.20 4.10 8.00 8.27 11.40
8 Special Registration for Trades 3.39 3.72 4.01 4.28 3.99 3.80
9 Public Health, Conservancy & Street Cleaning 3.12 4.78 3.21 4.23 4.89 5.03
10 Miscellaneous 3.75 3.90 4.19 1.31 1.27 1.28
Sub Total- A2 18.47 21.62 20.57 27.71 31.74 60.53
A3 Others
1 Development Charges 13.69 15.02 13.93 3.78 6.03 5.99
2 Road Restoration Charges 38.46 42.19 64.45 41.72 17.11 5.57
3 Reimbursement of Cost from diff schemes 0.00 0.00 3.14 24.76 62.61 9.81
Actuals
Rs. Crores
1
Annexure 14-1- Municipal Corporation of Delhi- Detailed Finances
Head of Account 1999-00 2000-01 2001-02 2002-03 2003-04 2004-05Actuals
Rs. Crores
4 Others 82.34 88.96 158.70 129.04 39.36 87.02
Sub Total- A3 134.49 146.16 240.23 199.30 125.10 108.39
Grand Total A (A1, A2 and A3) 885.53 971.35 1,161.21 1,185.53 1,237.09 1,243.05B External Revenues
1 Global Sharing of Taxes- Assigned 190.04 227.55 247.94 296.80 295.29 347.01
2 Education Grant- Reimbursement Grant 103.29 93.95 101.51 117.17 119.73 358.42
3 Ways and Means Advance 180.00 80.00 60.00 60.00 0.00 310.00
Sub Total- B 473.33 401.50 409.45 473.97 415.02 1,015.42
Grand Total Receipts 1,358.86 1,372.85 1,570.66 1,659.50 1,652.11 2,258.48Revenue Expenditure
1 General Supervision, collection of revenues etc 38.22 48.00 53.20 53.12 56.14 65.75
2 Education 371.97 338.94 333.25 369.41 390.83 455.88
3 Libraries 1.21 0.66 0.66 0.66 0.97 1.31
4 Public Health 39.01 37.42 37.74 39.22 40.92 48.38
5 Medical Relief 125.37 124.45 127.52 147.10 166.18 190.28
6 Conservancy and Street Cleaning 260.24 263.40 275.98 298.98 334.82 378.60
7 Scavenging, Drains and Sewers 73.41 11.13 8.83 11.40 11.22 11.60
8 Roads and Public Lighting 121.33 107.65 154.71 132.04 152.27 192.61
9 Markets and Slaughter Houses 3.21 3.28 2.66 4.91 4.46 3.32
10 Licensing, removal of Encroachments 2.05 2.38 2.19 2.17 2.14 2.35
11 Gardens and Open Spaces 58.16 61.87 65.07 63.90 69.82 82.69
12 Development Charges 3.12 4.38 3.85 2.73 2.07 6.10
13 Miscellaneous 239.70 337.55 478.97 443.08 396.65 405.41
14 Building Lan Acquisition and Management 21.94 24.11 22.25 21.80 26.81 30.86
15 Reserves for unforeseen 0.00 7.57 3.78 33.55 22.43 75.32
Grand Total Expenditure 1,358.94 1,372.80 1,570.65 1,624.07 1,677.73 1,950.47
-0.09 0.04 0.01 35.43 -25.62 308.01Part II: Plan Schemes and Resettlement Colonies Receipts
A Grants
REVENUE ACCOUNT STATUS (SURPLUS/DEFICIT)
2
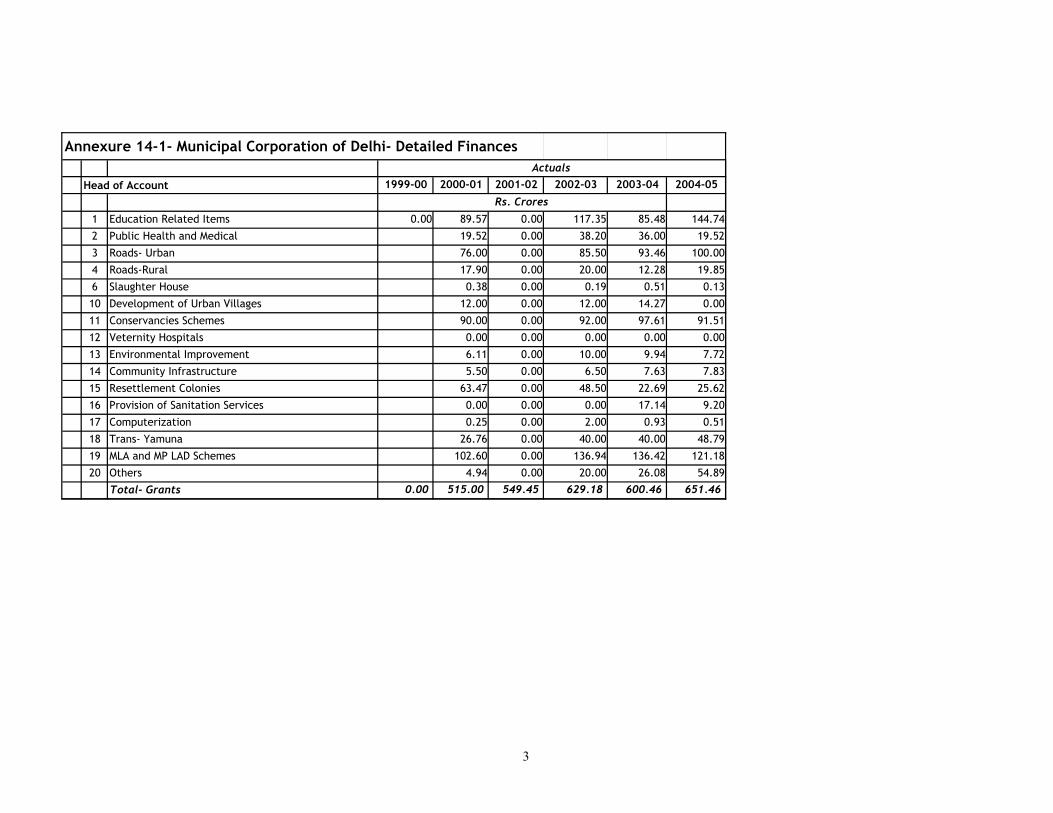
Annexure 14-1- Municipal Corporation of Delhi- Detailed Finances
Head of Account 1999-00 2000-01 2001-02 2002-03 2003-04 2004-05Actuals
Rs. Crores
1 Education Related Items 0.00 89.57 0.00 117.35 85.48 144.74
2 Public Health and Medical 19.52 0.00 38.20 36.00 19.52
3 Roads- Urban 76.00 0.00 85.50 93.46 100.00
4 Roads-Rural 17.90 0.00 20.00 12.28 19.85
6 Slaughter House 0.38 0.00 0.19 0.51 0.13
10 Development of Urban Villages 12.00 0.00 12.00 14.27 0.00
11 Conservancies Schemes 90.00 0.00 92.00 97.61 91.51
12 Veternity Hospitals 0.00 0.00 0.00 0.00 0.00
13 Environmental Improvement 6.11 0.00 10.00 9.94 7.72
14 Community Infrastructure 5.50 0.00 6.50 7.63 7.83
15 Resettlement Colonies 63.47 0.00 48.50 22.69 25.62
16 Provision of Sanitation Services 0.00 0.00 0.00 17.14 9.20
17 Computerization 0.25 0.00 2.00 0.93 0.51
18 Trans- Yamuna 26.76 0.00 40.00 40.00 48.79
19 MLA and MP LAD Schemes 102.60 0.00 136.94 136.42 121.18
20 Others 4.94 0.00 20.00 26.08 54.89
Total- Grants 0.00 515.00 549.45 629.18 600.46 651.46
3

Annexure 14-1- Municipal Corporation of Delhi- Detailed Finances
Head of Account 1999-00 2000-01 2001-02 2002-03 2003-04 2004-05Actuals
Rs. Crores
B Loans
1 Housing 0.00 0.00 2.00 2.00 0.00
2 Infrastructure 0.00 0.00 0.00 0.00 0.00
3 Deve.of authorised & unauthroised Colonies 44.77 0.00 103.00 75.59 83.59
4 Others 0.13 0.00 0.06 2.52 4.29
5 Development of Rural Villages 18.04 0.00 0.00 32.65 44.70
6 Development of Urban Villages 0.00 0.00 19.25
Total- Loans 0.00 62.94 69.90 105.06 112.75 151.84
Total Plan Income 0.00 577.94 619.35 734.24 713.21 803.29Expenditure
RevenueMiscellaneous Schemes 0.24 0.00 0.98 1.92 0.61
Education Related Items 56.21 0.00 38.13 48.97 52.97
Public Health and Medical 92.71 0.00 112.48 107.81 102.72
Medical 7.51 0.00 11.36 8.62 12.25
CapitalEducation Related Items 63.10 0.00 61.29 52.22 88.98
Public Health and Medical 5.66 0.00 12.61 10.57 7.09
Roads 97.32 0.00 114.18 104.37 124.91
Infrastructure Facilities in Colonies 150.25 0.00 177.24 177.40 198.29
Environmental Improvement 3.53 0.00 9.95 16.75 15.77
MLA and MP LAD Schemes 81.44 0.00 112.29 179.94 58.55
Trans- Yamuna 23.84 0.00 30.79 48.85 44.09
Others 14.49 0.00 11.96 19.00 20.86
Total Expenditure 0.00 596.29 612.62 693.26 776.42 727.110.00 -18.35 6.73 40.98 -63.21 76.19
-0.09 -18.31 6.74 76.41 -88.83 384.20CLOSING BALANCE 0.12 121.31 152.70 204.45 115.62 499.82
Summary of Municipal Accounts
CAPITALACCOUNT STATUS (SURPLUS/DEFICIT)OVERALL ACCOUNT STATUS-CURRENT YEAR
4

Annexure 14-1- Municipal Corporation of Delhi- Detailed Finances
Head of Account 1999-00 2000-01 2001-02 2002-03 2003-04 2004-05Actuals
Rs. Crores
Opening Balance 0.20 139.61 145.96 128.04 204.45 115.62Receipts
1 Revenue Account 1,358.86 1,372.85 1,570.66 1,659.50 1,652.11 2,258.482 Capital Account 0.00 577.94 619.35 734.24 713.21 803.293 Advances and Deposits 0.00 0.00 0.00 0.00 0.00 0.00
Grand Municipal Income 1,358.86 1,950.79 2,190.00 2,393.74 2,365.32 3,061.77Expenditure
1 Revenue Account 1,358.94 1,372.80 1,570.65 1,624.07 1,677.73 1,950.472 Capital Account 0.00 596.29 612.62 693.26 776.42 727.113 Advances and Deposits 0.00 0.00 0.00 0.00 0.00 0.00
Grand Municipal Expenditure 1,358.94 1,969.10 2,183.27 2,317.33 2,454.15 2,677.57Municipal Account Status
Closing Balance 0.12 121.31 152.70 204.45 115.62 499.82
Summary of Financial Indicators1 Operating Ratio 1.00 1.00 1.00 0.98 1.02 0.86
2 Capital Utilisation Ratio - 1.03 0.99 0.94 1.09 0.91
3 % Establishment cost in Total Rev.Exp.
4 % of Revenue Income on Establishment
5 Debt Servicing Cost as % of Rev.Inc.
5
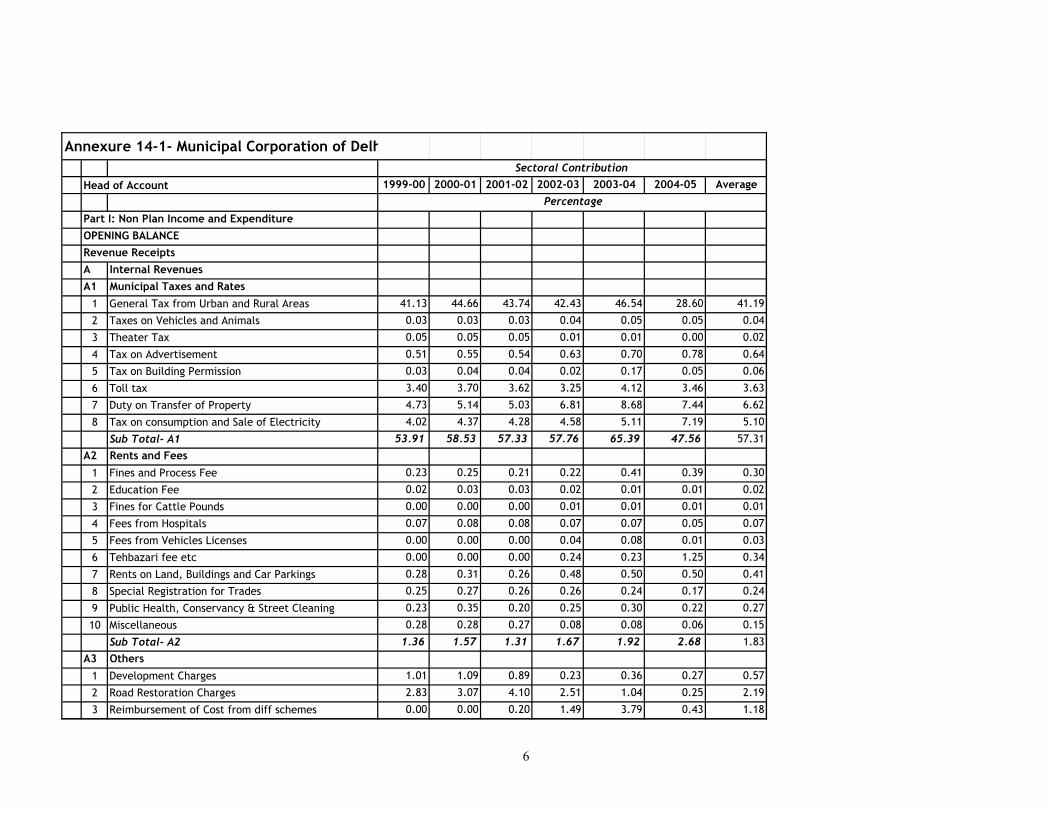
Annexure 14-1- Municipal Corporation of Delh
Head of Account
Part I: Non Plan Income and Expenditure OPENING BALANCERevenue ReceiptsA Internal RevenuesA1 Municipal Taxes and Rates
1 General Tax from Urban and Rural Areas
2 Taxes on Vehicles and Animals
3 Theater Tax
4 Tax on Advertisement
5 Tax on Building Permission
6 Toll tax
7 Duty on Transfer of Property
8 Tax on consumption and Sale of Electricity
Sub Total- A1A2 Rents and Fees
1 Fines and Process Fee
2 Education Fee
3 Fines for Cattle Pounds
4 Fees from Hospitals
5 Fees from Vehicles Licenses
6 Tehbazari fee etc
7 Rents on Land, Buildings and Car Parkings
8 Special Registration for Trades
9 Public Health, Conservancy & Street Cleaning
10 Miscellaneous
Sub Total- A2A3 Others
1 Development Charges
2 Road Restoration Charges
3 Reimbursement of Cost from diff schemes
1999-00 2000-01 2001-02 2002-03 2003-04 2004-05 Average
41.13 44.66 43.74 42.43 46.54 28.60 41.19
0.03 0.03 0.03 0.04 0.05 0.05 0.04
0.05 0.05 0.05 0.01 0.01 0.00 0.02
0.51 0.55 0.54 0.63 0.70 0.78 0.64
0.03 0.04 0.04 0.02 0.17 0.05 0.06
3.40 3.70 3.62 3.25 4.12 3.46 3.63
4.73 5.14 5.03 6.81 8.68 7.44 6.62
4.02 4.37 4.28 4.58 5.11 7.19 5.10
53.91 58.53 57.33 57.76 65.39 47.56 57.31
0.23 0.25 0.21 0.22 0.41 0.39 0.30
0.02 0.03 0.03 0.02 0.01 0.01 0.02
0.00 0.00 0.00 0.01 0.01 0.01 0.01
0.07 0.08 0.08 0.07 0.07 0.05 0.07
0.00 0.00 0.00 0.04 0.08 0.01 0.03
0.00 0.00 0.00 0.24 0.23 1.25 0.34
0.28 0.31 0.26 0.48 0.50 0.50 0.41
0.25 0.27 0.26 0.26 0.24 0.17 0.24
0.23 0.35 0.20 0.25 0.30 0.22 0.27
0.28 0.28 0.27 0.08 0.08 0.06 0.15
1.36 1.57 1.31 1.67 1.92 2.68 1.83
1.01 1.09 0.89 0.23 0.36 0.27 0.57
2.83 3.07 4.10 2.51 1.04 0.25 2.19
0.00 0.00 0.20 1.49 3.79 0.43 1.18
Percentage
Sectoral Contribution
6

Annexure 14-1- Municipal Corporation of Delh
Head of Account
4 Others
Sub Total- A3
Grand Total A (A1, A2 and A3)B External Revenues
1 Global Sharing of Taxes- Assigned
2 Education Grant- Reimbursement Grant
3 Ways and Means Advance
Sub Total- B
Grand Total ReceiptsRevenue Expenditure
1 General Supervision, collection of revenues etc
2 Education
3 Libraries
4 Public Health
5 Medical Relief
6 Conservancy and Street Cleaning
7 Scavenging, Drains and Sewers
8 Roads and Public Lighting
9 Markets and Slaughter Houses
10 Licensing, removal of Encroachments
11 Gardens and Open Spaces
12 Development Charges
13 Miscellaneous
14 Building Lan Acquisition and Management
15 Reserves for unforeseen
Grand Total Expenditure
Part II: Plan Schemes and Resettlement Colonies Receipts
A Grants
REVENUE ACCOUNT STATUS (SURPLUS/DEFICIT)
1999-00 2000-01 2001-02 2002-03 2003-04 2004-05 Average Percentage
Sectoral Contribution
6.06 6.48 10.10 7.78 2.38 3.85 6.12
9.90 10.65 15.30 12.01 7.57 4.80 10.06
65.17 70.75 73.93 71.44 74.88 55.04 69.21
13.99 16.57 15.79 17.88 17.87 15.36 16.70
7.60 6.84 6.46 7.06 7.25 15.87 8.70
13.25 5.83 3.82 3.62 0.00 13.73 5.40
34.83 29.25 26.07 28.56 25.12 44.96 30.79
100.00 100.00 100.00 100.00 100.00 100.00 100.00
2.81 3.50 3.39 3.27 3.35 3.37 3.37
27.37 24.69 21.22 22.75 23.30 23.37 23.06
0.09 0.05 0.04 0.04 0.06 0.07 0.05
2.87 2.73 2.40 2.41 2.44 2.48 2.49
9.23 9.07 8.12 9.06 9.91 9.76 9.18
19.15 19.19 17.57 18.41 19.96 19.41 18.91
5.40 0.81 0.56 0.70 0.67 0.59 0.67
8.93 7.84 9.85 8.13 9.08 9.88 8.95
0.24 0.24 0.17 0.30 0.27 0.17 0.23
0.15 0.17 0.14 0.13 0.13 0.12 0.14
4.28 4.51 4.14 3.93 4.16 4.24 4.20
0.23 0.32 0.24 0.17 0.12 0.31 0.23
17.64 24.59 30.50 27.28 23.64 20.79 25.36
1.61 1.76 1.42 1.34 1.60 1.58 1.54
0.00 0.55 0.24 2.07 1.34 3.86 1.61
100.00 100.00 100.00 100.00 100.00 100.00 100.00
7

Annexure 14-1- Municipal Corporation of Delh
Head of Account
1 Education Related Items
2 Public Health and Medical
3 Roads- Urban
4 Roads-Rural
6 Slaughter House
10 Development of Urban Villages
11 Conservancies Schemes
12 Veternity Hospitals
13 Environmental Improvement
14 Community Infrastructure
15 Resettlement Colonies
16 Provision of Sanitation Services
17 Computerization
18 Trans- Yamuna
19 MLA and MP LAD Schemes
20 Others
Total- Grants
1999-00 2000-01 2001-02 2002-03 2003-04 2004-05 Average Percentage
Sectoral Contribution
15.50 0.00 15.98 11.99 18.02 12.30
3.38 0.00 5.20 5.05 2.43 3.21
13.15 0.00 11.64 13.10 12.45 10.07
3.10 0.00 2.72 1.72 2.47 2.00
0.06 0.00 0.03 0.07 0.02 0.04
2.08 0.00 1.63 2.00 0.00 1.14
15.57 0.00 12.53 13.69 11.39 10.64
0.00 0.00 0.00 0.00 0.00 0.00
1.06 0.00 1.36 1.39 0.96 0.95
0.95 0.00 0.89 1.07 0.97 0.78
10.98 0.00 6.61 3.18 3.19 4.79
0.00 0.00 0.00 2.40 1.15 0.71
0.04 0.00 0.27 0.13 0.06 0.10
4.63 0.00 5.45 5.61 6.07 4.35
17.75 0.00 18.65 19.13 15.09 14.12
0.85 0.00 2.72 3.66 6.83 2.81
89.11 88.71 85.69 84.19 81.10 85.76
8

Annexure 14-1- Municipal Corporation of Delh
Head of Account
B Loans
1 Housing
2 Infrastructure
3 Deve.of authorised & unauthroised Colonies
4 Others
5 Development of Rural Villages
6 Development of Urban Villages
Total- Loans
Total Plan IncomeExpenditure
RevenueMiscellaneous Schemes
Education Related Items
Public Health and Medical
Medical
CapitalEducation Related Items
Public Health and Medical
Roads
Infrastructure Facilities in Colonies
Environmental Improvement
MLA and MP LAD Schemes
Trans- Yamuna
Others
Total Expenditure
CLOSING BALANCE
Summary of Municipal Accounts
CAPITALACCOUNT STATUS (SURPLUS/DEFICIT)OVERALL ACCOUNT STATUS-CURRENT YEAR
1999-00 2000-01 2001-02 2002-03 2003-04 2004-05 Average Percentage
Sectoral Contribution
0.00 0.00 0.27 0.28 0.00 0.11
0.00 0.00 0.00 0.00 0.00 0.00
7.75 0.00 14.03 10.60 10.41 8.56
0.02 0.00 0.01 0.35 0.53 0.18
3.12 0.00 0.00 4.58 5.57 2.65
10.89 11.29 14.31 15.81 18.90 14.24
100.00 100.00 100.00 100.00 100.00 100.00
0.04 0.00 0.14 0.25 0.08 0.10
9.43 0.00 5.50 6.31 7.29 5.70
15.55 0.00 16.23 13.89 14.13 11.96
1.26 0.00 1.64 1.11 1.68 1.14
0.00 0.00 0.00 0.00
10.58 0.00 8.84 6.73 12.24 7.68
0.95 0.00 1.82 1.36 0.98 1.02
16.32 0.00 16.47 13.44 17.18 12.68
25.20 0.00 25.57 22.85 27.27 20.18
0.59 0.00 1.43 2.16 2.17 1.27
13.66 0.00 16.20 23.18 8.05 12.22
4.00 0.00 4.44 6.29 6.06 4.16
2.43 0.00 1.73 2.45 2.87 1.89
100.00 100.00 100.00 100.00 100.00 100.00
9
Annexure 14-1- Municipal Corporation of Delh
Head of Account
Opening Balance
Receipts
1 Revenue Account
2 Capital Account
3 Advances and Deposits
Grand Municipal IncomeExpenditure
1 Revenue Account
2 Capital Account
3 Advances and Deposits
Grand Municipal ExpenditureMunicipal Account Status
Closing Balance
Summary of Financial Indicators1 Operating Ratio
2 Capital Utilisation Ratio
3 % Establishment cost in Total Rev.Exp.
4 % of Revenue Income on Establishment
5 Debt Servicing Cost as % of Rev.Inc.
1999-00 2000-01 2001-02 2002-03 2003-04 2004-05 Average Percentage
Sectoral Contribution
10

Annexure 14-1- Municipal Corporation of Delh
Head of Account
Part I: Non Plan Income and Expenditure OPENING BALANCERevenue ReceiptsA Internal RevenuesA1 Municipal Taxes and Rates
1 General Tax from Urban and Rural Areas
2 Taxes on Vehicles and Animals
3 Theater Tax
4 Tax on Advertisement
5 Tax on Building Permission
6 Toll tax
7 Duty on Transfer of Property
8 Tax on consumption and Sale of Electricity
Sub Total- A1A2 Rents and Fees
1 Fines and Process Fee
2 Education Fee
3 Fines for Cattle Pounds
4 Fees from Hospitals
5 Fees from Vehicles Licenses
6 Tehbazari fee etc
7 Rents on Land, Buildings and Car Parkings
8 Special Registration for Trades
9 Public Health, Conservancy & Street Cleaning
10 Miscellaneous
Sub Total- A2A3 Others
1 Development Charges
2 Road Restoration Charges
3 Reimbursement of Cost from diff schemes
1999-00 2000-01 2001-02 2002-03 2003-04 2004-05 Average CAGR
3.49
-- 9.69 12.05 2.50 9.20 -16.00 3.49 1.31
-- 9.69 12.05 29.48 38.61 26.41 23.25 26.27
-- 9.69 12.05 -89.50 49.59 -28.63 -9.36 -40.47
-- 9.69 12.05 21.97 11.66 51.04 21.28 23.21
-- 9.69 12.05 -32.15 638.15 -61.76 113.20 21.03
-- 9.69 12.05 -5.06 26.04 14.75 11.49 11.37
-- 9.69 12.05 43.00 26.90 17.13 21.75 24.23
-- 9.69 12.05 13.07 11.22 92.39 27.68 28.32
-- 9.69 12.05 6.45 12.70 -0.57 8.07 7.52
--
-- 9.69 -5.05 10.74 83.86 32.71 26.39 26.56
-- 106.93 8.42 -50.00 -5.58 10.99 14.15 -13.18
-- 1.75 -27.40 -12.82 NA
-- 9.69 16.93 -11.32 3.00 4.89 4.64 2.88
-- 67.52 -78.08 -5.28 NA
-- -3.81 645.52 320.86 NA
-- 9.69 -2.50 95.26 3.38 37.87 28.74 28.35
-- 9.69 7.86 6.81 -6.85 -4.72 2.56 0.56
-- 53.27 -32.87 31.84 15.63 2.81 14.14 1.28
-- 3.86 7.36 -68.68 -3.39 1.11 -11.95 -24.30
-- 17.05 -4.85 34.72 14.52 90.72 30.43 29.35
-- 9.69 -7.22 -72.86 59.30 -0.60 -2.34 -20.53
-- 9.69 52.78 -35.28 -58.98 -67.45 -19.85 -39.72
-- 688.02 152.88 -84.33 252.19 NA
Growth over Previous Year
Percentage
11

Annexure 14-1- Municipal Corporation of Delh
Head of Account
4 Others
Sub Total- A3
Grand Total A (A1, A2 and A3)B External Revenues
1 Global Sharing of Taxes- Assigned
2 Education Grant- Reimbursement Grant
3 Ways and Means Advance
Sub Total- B
Grand Total ReceiptsRevenue Expenditure
1 General Supervision, collection of revenues etc
2 Education
3 Libraries
4 Public Health
5 Medical Relief
6 Conservancy and Street Cleaning
7 Scavenging, Drains and Sewers
8 Roads and Public Lighting
9 Markets and Slaughter Houses
10 Licensing, removal of Encroachments
11 Gardens and Open Spaces
12 Development Charges
13 Miscellaneous
14 Building Lan Acquisition and Management
15 Reserves for unforeseen
Grand Total Expenditure
Part II: Plan Schemes and Resettlement Colonies Receipts
A Grants
REVENUE ACCOUNT STATUS (SURPLUS/DEFICIT)
1999-00 2000-01 2001-02 2002-03 2003-04 2004-05 Average CAGRGrowth over Previous Year
Percentage
-- 8.04 78.40 -18.69 -69.50 121.11 23.87 -0.55
-- 8.68 64.36 -17.04 -37.23 -13.36 1.08 -7.20
-- 9.69 19.55 2.09 4.35 0.48 7.23 6.36--
-- 19.74 8.96 19.71 -0.51 17.51 13.08 11.13
-- -9.04 8.04 15.43 2.18 199.36 43.19 39.76
-- -55.56 -25.00 0.00 -100.00 -45.14 40.30
-- -15.18 1.98 15.76 -12.44 144.67 26.96 26.11
-- 1.03 14.41 5.66 -0.45 36.70 11.47 13.25
-- 25.58 10.83 -0.15 5.68 17.11 11.81 8.18
-- -8.88 -1.68 10.85 5.80 16.64 4.55 7.69
-- -45.75 -0.02 0.64 47.43 35.07 7.47 18.98
-- -4.07 0.85 3.92 4.33 18.25 4.66 6.63
-- -0.73 2.46 15.36 12.97 14.50 8.91 11.20
-- 1.21 4.77 8.34 11.99 13.08 7.88 9.49
-- -84.84 -20.66 29.09 -1.62 3.46 -14.91 1.04
-- -11.27 43.71 -14.65 15.32 26.50 11.92 15.65
-- 1.97 -18.72 84.49 -9.27 -25.45 6.60 0.35
-- 16.17 -7.94 -1.02 -1.10 9.52 3.13 -0.33
-- 6.39 5.16 -1.79 9.27 18.43 7.49 7.52
-- 40.30 -12.19 -29.04 -24.24 194.77 33.92 8.61
-- 40.82 41.90 -7.49 -10.48 2.21 13.39 4.69
-- 9.88 -7.71 -2.05 23.00 15.12 7.65 6.37
-- -50.07 787.47 -33.14 235.77 235.01 77.60
-- 1.02 14.41 3.40 3.30 16.26 7.68 9.18
12
Annexure 14-1- Municipal Corporation of Delh
Head of Account
1 Education Related Items
2 Public Health and Medical
3 Roads- Urban
4 Roads-Rural
6 Slaughter House
10 Development of Urban Villages
11 Conservancies Schemes
12 Veternity Hospitals
13 Environmental Improvement
14 Community Infrastructure
15 Resettlement Colonies
16 Provision of Sanitation Services
17 Computerization
18 Trans- Yamuna
19 MLA and MP LAD Schemes
20 Others
Total- Grants
1999-00 2000-01 2001-02 2002-03 2003-04 2004-05 Average CAGRGrowth over Previous Year
Percentage
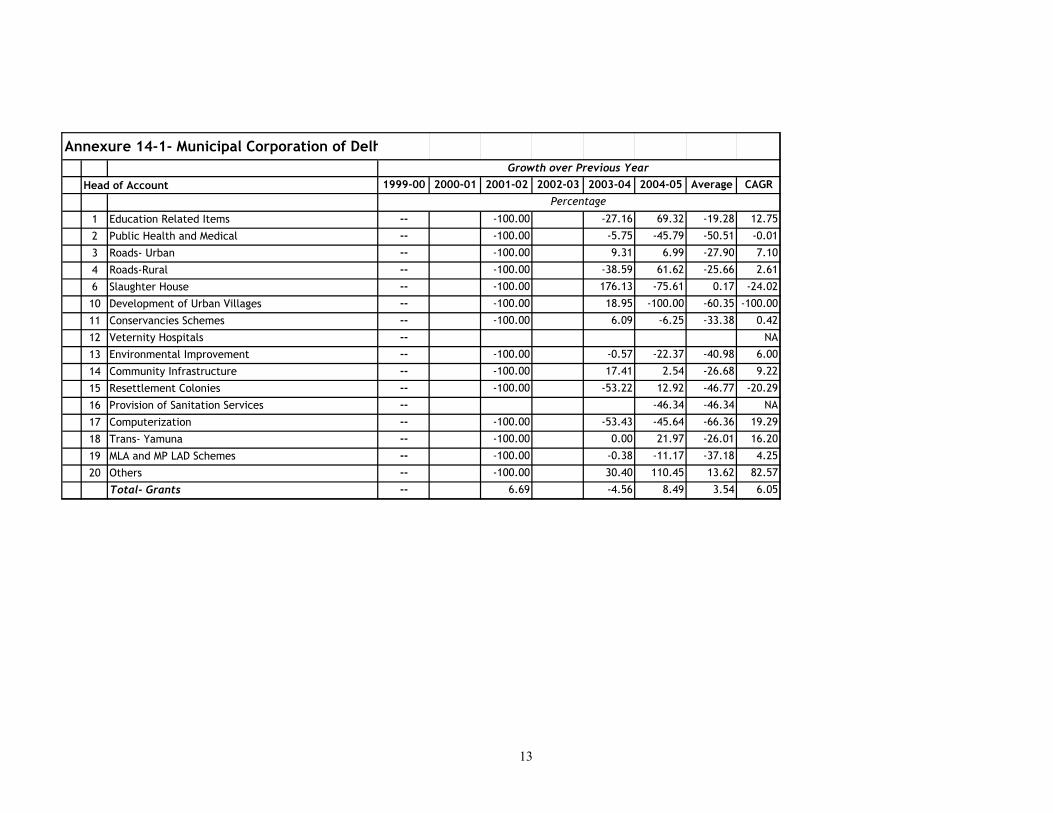
-- -100.00 -27.16 69.32 -19.28 12.75
-- -100.00 -5.75 -45.79 -50.51 -0.01
-- -100.00 9.31 6.99 -27.90 7.10
-- -100.00 -38.59 61.62 -25.66 2.61
-- -100.00 176.13 -75.61 0.17 -24.02
-- -100.00 18.95 -100.00 -60.35 -100.00
-- -100.00 6.09 -6.25 -33.38 0.42
-- NA
-- -100.00 -0.57 -22.37 -40.98 6.00
-- -100.00 17.41 2.54 -26.68 9.22
-- -100.00 -53.22 12.92 -46.77 -20.29
-- -46.34 -46.34 NA
-- -100.00 -53.43 -45.64 -66.36 19.29
-- -100.00 0.00 21.97 -26.01 16.20
-- -100.00 -0.38 -11.17 -37.18 4.25
-- -100.00 30.40 110.45 13.62 82.57
-- 6.69 -4.56 8.49 3.54 6.05
13
Annexure 14-1- Municipal Corporation of Delh
Head of Account
B Loans
1 Housing
2 Infrastructure
3 Deve.of authorised & unauthroised Colonies
4 Others
5 Development of Rural Villages
6 Development of Urban Villages
Total- Loans
Total Plan IncomeExpenditure
RevenueMiscellaneous Schemes
Education Related Items
Public Health and Medical
Medical
CapitalEducation Related Items
Public Health and Medical
Roads
Infrastructure Facilities in Colonies
Environmental Improvement
MLA and MP LAD Schemes
Trans- Yamuna
Others
Total Expenditure
CLOSING BALANCE
Summary of Municipal Accounts
CAPITALACCOUNT STATUS (SURPLUS/DEFICIT)OVERALL ACCOUNT STATUS-CURRENT YEAR
1999-00 2000-01 2001-02 2002-03 2003-04 2004-05 Average CAGRGrowth over Previous Year
Percentage
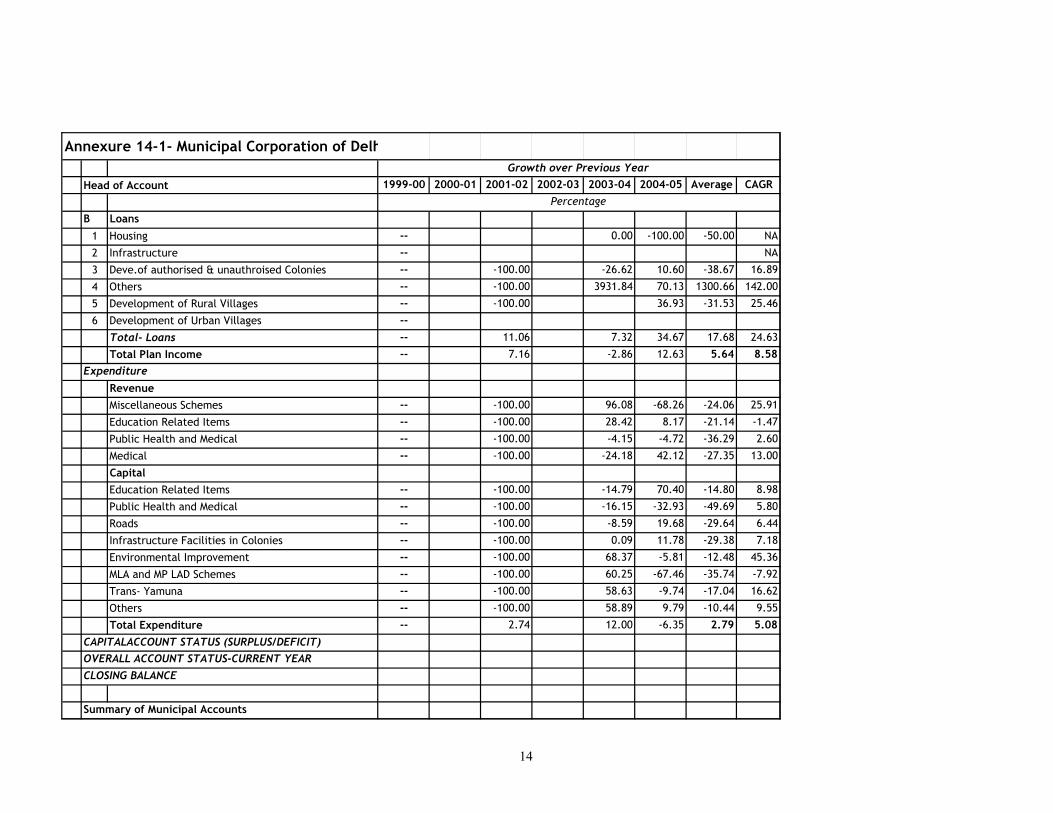
-- 0.00 -100.00 -50.00 NA
-- NA
-- -100.00 -26.62 10.60 -38.67 16.89
-- -100.00 3931.84 70.13 1300.66 142.00
-- -100.00 36.93 -31.53 25.46
---- 11.06 7.32 34.67 17.68 24.63
-- 7.16 -2.86 12.63 5.64 8.58
-- -100.00 96.08 -68.26 -24.06 25.91
-- -100.00 28.42 8.17 -21.14 -1.47
-- -100.00 -4.15 -4.72 -36.29 2.60
-- -100.00 -24.18 42.12 -27.35 13.00
-- -100.00 -14.79 70.40 -14.80 8.98
-- -100.00 -16.15 -32.93 -49.69 5.80
-- -100.00 -8.59 19.68 -29.64 6.44
-- -100.00 0.09 11.78 -29.38 7.18
-- -100.00 68.37 -5.81 -12.48 45.36
-- -100.00 60.25 -67.46 -35.74 -7.92
-- -100.00 58.63 -9.74 -17.04 16.62
-- -100.00 58.89 9.79 -10.44 9.55
-- 2.74 12.00 -6.35 2.79 5.08
14

Annexure 14-1- Municipal Corporation of Delh
Head of Account
Opening Balance
Receipts
1 Revenue Account
2 Capital Account
3 Advances and Deposits
Grand Municipal IncomeExpenditure
1 Revenue Account
2 Capital Account
3 Advances and Deposits
Grand Municipal ExpenditureMunicipal Account Status
Closing Balance
Summary of Financial Indicators1 Operating Ratio
2 Capital Utilisation Ratio
3 % Establishment cost in Total Rev.Exp.
4 % of Revenue Income on Establishment
5 Debt Servicing Cost as % of Rev.Inc.
1999-00 2000-01 2001-02 2002-03 2003-04 2004-05 Average CAGRGrowth over Previous Year
Percentage
15
Annexure 14-2- New Delhi Municipal Corporation- Detailed Finances
2000-01 2001-02 2002-03 2003-04 2004-05
PART I: REVENUE INCOME & EXPENDITURE
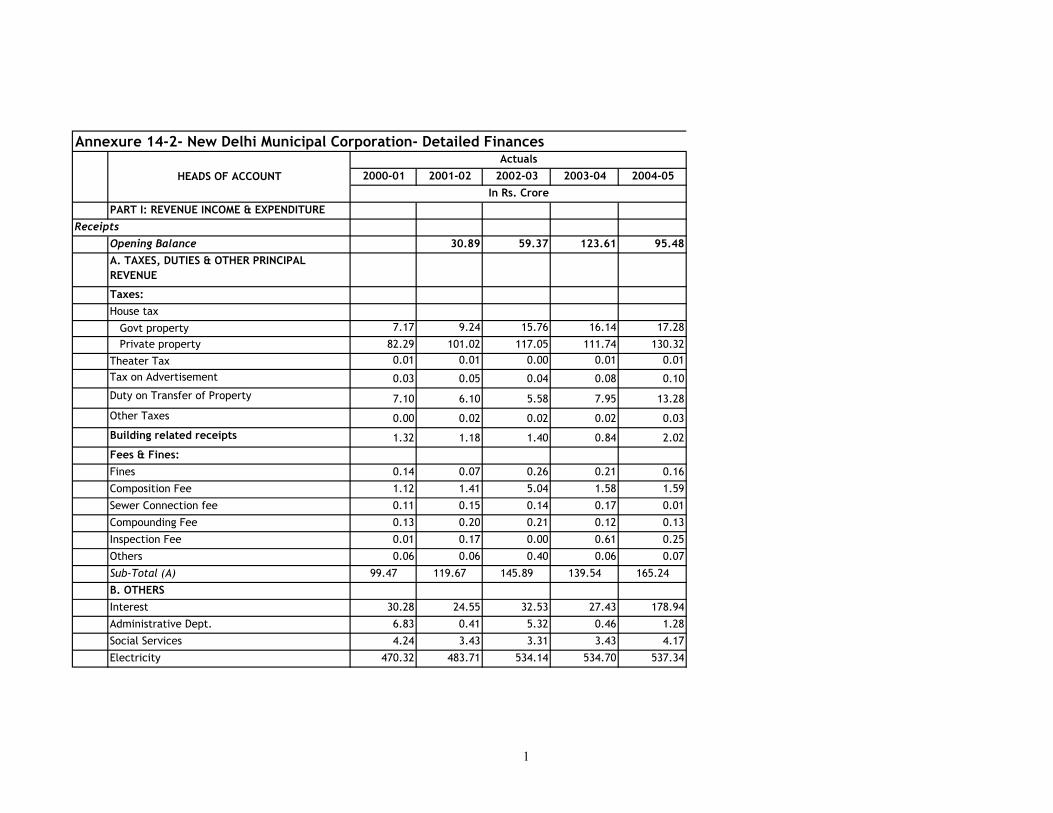
Opening Balance 30.89 59.37 123.61 95.48A. TAXES, DUTIES & OTHER PRINCIPAL REVENUE
Taxes:House tax
Govt property 7.17 9.24 15.76 16.14 17.28
Private property 82.29 101.02 117.05 111.74 130.32
Theater Tax 0.01 0.01 0.00 0.01 0.01
Tax on Advertisement 0.03 0.05 0.04 0.08 0.10
Duty on Transfer of Property 7.10 6.10 5.58 7.95 13.28
Other Taxes 0.00 0.02 0.02 0.02 0.03
Building related receipts 1.32 1.18 1.40 0.84 2.02
Fees & Fines:Fines 0.14 0.07 0.26 0.21 0.16
Composition Fee 1.12 1.41 5.04 1.58 1.59
Sewer Connection fee 0.11 0.15 0.14 0.17 0.01
Compounding Fee 0.13 0.20 0.21 0.12 0.13
Inspection Fee 0.01 0.17 0.00 0.61 0.25
Others 0.06 0.06 0.40 0.06 0.07
Sub-Total (A) 99.47 119.67 145.89 139.54 165.24
B. OTHERSInterest 30.28 24.55 32.53 27.43 178.94
Administrative Dept. 6.83 0.41 5.32 0.46 1.28
Social Services 4.24 3.43 3.31 3.43 4.17
Electricity 470.32 483.71 534.14 534.70 537.34
Receipts
In Rs. Crore
Actuals
HEADS OF ACCOUNT
1

2000-01 2001-02 2002-03 2003-04 2004-05In Rs. Crore
Actuals
HEADS OF ACCOUNT
Water Supply 0.00 2.02 0.00 15.02 14.46
Other Municipal works 94.23 97.14 112.40 97.92 109.75
Sub-Total (B) 605.89 611.26 687.71 678.96 845.93
C. EXTERNAL REVENUEAdvances to Employees 1.56 1.46 1.29 1.38 1.06
External Asistance 12.39 15.53 17.10 15.60 34.05
Assigned Taxes 3.36 4.28 6.28 6.39 11.29
Sub-Total (C) 17.32 21.27 24.67 23.36 46.40
TOTAL RECEIPTS (A+B+C) 722.68 752.20 858.27 841.86 1057.57
Collection of Taxes & Duties 0.92 0.95 1.20 1.27 1.33
Interest 42.85 7.11 5.44 4.83 1.89
Administrative Dept 110.58 125.15 167.92 139.38 228.33
Education 38.88 37.74 39.38 43.53 45.72
Medical & Public Health 51.05 51.69 51.08 63.60 73.51
Animal Husbandry 0.38 0.40 0.46 0.40 0.35
Other social services 17.86 22.04 18.75 19.20 20.57
Palika Parking 0.88 0.87 0.68 0.57 0.55
Indoor Stadium 0.62 0.80 0.73 0.64 0.86
Night Shelters 0.43 0.31 0.35 0.39 0.08
Contribution to NDF 2.98 0.00 0.00 0.00 1.00
Electricity Supply 268.66 326.44 330.80 344.49 367.27
Water Supply 54.40 45.05 37.96 46.87 61.13
Roads 4.25 8.41 10.35 11.32 9.44
Other Municipal Works 55.36 52.18 58.09 61.59 87.16
Advances to Employees 1.44 1.43 1.04 0.94 0.62
External Assistance 40.23 12.25 10.46 7.34 33.83
TOTAL EXPENDITURE 691.79 692.83 734.66 746.38 933.65Closing Balance 30.89 59.37 123.61 95.48 123.93
Expenditure
2
2000-01 2001-02 2002-03 2003-04 2004-05In Rs. Crore
Actuals
HEADS OF ACCOUNT
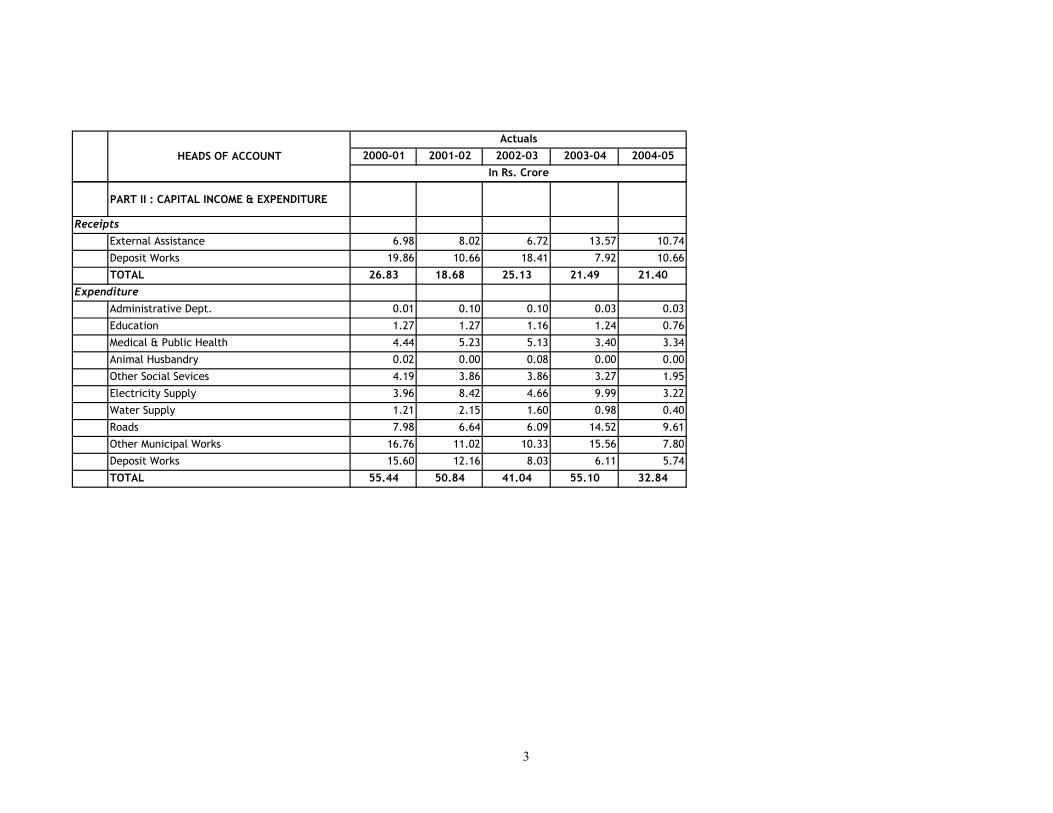
PART II : CAPITAL INCOME & EXPENDITURE
External Assistance 6.98 8.02 6.72 13.57 10.74
Deposit Works 19.86 10.66 18.41 7.92 10.66
TOTAL 26.83 18.68 25.13 21.49 21.40
Administrative Dept. 0.01 0.10 0.10 0.03 0.03
Education 1.27 1.27 1.16 1.24 0.76
Medical & Public Health 4.44 5.23 5.13 3.40 3.34
Animal Husbandry 0.02 0.00 0.08 0.00 0.00
Other Social Sevices 4.19 3.86 3.86 3.27 1.95
Electricity Supply 3.96 8.42 4.66 9.99 3.22
Water Supply 1.21 2.15 1.60 0.98 0.40
Roads 7.98 6.64 6.09 14.52 9.61
Other Municipal Works 16.76 11.02 10.33 15.56 7.80
Deposit Works 15.60 12.16 8.03 6.11 5.74
TOTAL 55.44 50.84 41.04 55.10 32.84
Receipts
Expenditure
3

Annexure 14-2- New Delhi Municipal Cor
PART I: REVENUE INCOME & EXPENDITURE
Opening Balance
A. TAXES, DUTIES & OTHER PRINCIPAL REVENUE
Taxes:House tax
Govt property Private property
Theater TaxTax on Advertisement
Duty on Transfer of Property
Other Taxes
Building related receipts
Fees & Fines:Fines
Composition Fee
Sewer Connection fee
Compounding Fee
Inspection Fee
Others
Sub-Total (A)
B. OTHERSInterest
Administrative Dept.
Social Services
Electricity
Receipts
HEADS OF ACCOUNT 2000-01 2001-02 2002-03 2003-04 2004-05 Average
0.99 1.23 1.84 1.92 1.63 1.52
11.39 13.43 13.64 13.27 12.32 12.810.00 0.00 0.00 0.00 0.00 0.00
0.00 0.01 0.00 0.01 0.01 0.01
0.98 0.81 0.65 0.94 1.26 0.93
0.00 0.00 0.00 0.00 0.00 0.00
0.18 0.16 0.16 0.10 0.19 0.16
0.02 0.01 0.03 0.03 0.02 0.02
0.15 0.19 0.59 0.19 0.15 0.25
0.02 0.02 0.02 0.02 0.00 0.01
0.02 0.03 0.02 0.01 0.01 0.02
0.0015 0.0224 0.00 0.07 0.02 0.02
0.01 0.01 0.05 0.01 0.01 0.02
4.19 3.26 3.79 3.26 16.92 6.28
0.94 0.05 0.62 0.06 0.12 0.36
0.59 0.46 0.39 0.41 0.39 0.45
65.08 64.31 62.23 63.51 50.81 61.19
Sectoral Contribution
4

HEADS OF ACCOUNT
Water Supply
Other Municipal works
Sub-Total (B)
C. EXTERNAL REVENUEAdvances to Employees
External Asistance
Assigned Taxes
Sub-Total (C)
TOTAL RECEIPTS (A+B+C)
Collection of Taxes & Duties
Interest
Administrative Dept
Education
Medical & Public Health
Animal Husbandry
Other social services
Palika Parking
Indoor Stadium
Night Shelters
Contribution to NDF
Electricity Supply
Water Supply
Roads
Other Municipal Works
Advances to Employees
External Assistance
TOTAL EXPENDITUREClosing Balance
Expenditure
2000-01 2001-02 2002-03 2003-04 2004-05 AverageSectoral Contribution
0.00 0.27 0.00 1.78 1.37 0.68
13.04 12.91 13.10 11.63 10.38 12.21
0.22 0.19 0.15 0.16 0.10 0.17
1.71 2.06 1.99 1.85 3.22 2.17
0.47 0.57 0.73 0.76 1.07 0.72
100.00 100.00 100.00 100.00 100.00 100.00
0.13 0.14 0.16 0.17 0.14 0.15
6.19 1.03 0.74 0.65 0.20 1.76
15.99 18.06 22.86 18.67 24.46 20.01
5.62 5.45 5.36 5.83 4.90 5.43
7.38 7.46 6.95 8.52 7.87 7.64
0.05 0.06 0.06 0.05 0.04 0.05
2.58 3.18 2.55 2.57 2.20 2.62
0.13 0.13 0.09 0.08 0.06 0.10
0.09 0.12 0.10 0.09 0.09 0.10
0.06 0.05 0.05 0.05 0.01 0.04
0.43 0.00 0.00 0.00 0.11 0.11
38.84 47.12 45.03 46.16 39.34 43.29
7.86 6.50 5.17 6.28 6.55 6.47
0.61 1.21 1.41 1.52 1.01 1.15
8.00 7.53 7.91 8.25 9.34 8.21
0.21 0.21 0.14 0.13 0.07 0.15
5.82 1.77 1.42 0.98 3.62 2.72
100.00 100.00 100.00 100.00 100.00 100.00
5

HEADS OF ACCOUNT
PART II : CAPITAL INCOME & EXPENDITURE
External Assistance
Deposit Works
TOTAL
Administrative Dept.
Education
Medical & Public Health
Animal Husbandry
Other Social Sevices
Electricity Supply
Water Supply
Roads
Other Municipal Works
Deposit Works
TOTAL
Receipts
Expenditure
2000-01 2001-02 2002-03 2003-04 2004-05 AverageSectoral Contribution
25.99 42.92 26.73 63.16 50.18 41.80
74.01 57.08 73.27 36.84 49.82 58.20
100.00 100.00 100.00 100.00 100.00 100.00
0.01 0.20 0.25 0.06 0.09 0.12
2.29 2.49 2.82 2.24 2.32 2.43
8.01 10.28 12.50 6.18 10.18 9.43
0.03 0.00 0.19 0.00 0.00 0.04
7.56 7.59 9.42 5.93 5.92 7.28
7.13 16.57 11.36 18.14 9.80 12.60
2.18 4.22 3.90 1.78 1.23 2.66
14.40 13.06 14.83 26.34 29.26 19.58
30.24 21.67 25.17 28.24 23.74 25.81
28.15 23.92 19.57 11.08 17.46 20.04
100.00 100.00 100.00 100.00 100.00 100.00
6

Annexure 14-2- New Delhi Municipal Cor
PART I: REVENUE INCOME & EXPENDITURE
Opening Balance
A. TAXES, DUTIES & OTHER PRINCIPAL REVENUE
Taxes:House tax
Govt property Private property
Theater TaxTax on Advertisement
Duty on Transfer of Property
Other Taxes
Building related receipts
Fees & Fines:Fines
Composition Fee
Sewer Connection fee
Compounding Fee
Inspection Fee
Others
Sub-Total (A)
B. OTHERSInterest
Administrative Dept.
Social Services
Electricity
Receipts
HEADS OF ACCOUNT 2000-01 2001-02 2002-03 2003-04 2004-05 Average
23.84 49.56 4.40 -14.80 15.7517.94 1.54 -2.67 -7.16 2.41
-13.16 -66.44 285.14 -56.69 37.21
47.88 -31.99 123.12 2.26 35.32
-17.46 -19.75 45.09 33.03 10.23
247.51 8.26 14.09 11.78 70.41
-13.86 3.95 -38.54 90.83 10.59
-48.34 210.66 -15.81 -40.48 26.5121.01 213.60 -68.11 -19.58 36.7333.61 -22.23 28.96 -94.10 -13.4448.16 -9.19 -40.64 -17.02 -4.6714.44 -100.00 -68.19 -51.251.28 498.93 -85.92 1.42 103.93
-22.11 16.16 -14.03 419.23 99.81-94.27 1045.58 -91.13 119.32 244.87-22.15 -15.40 5.64 -3.32 -8.81-1.19 -3.22 2.06 -20.00 -5.59
Growth rate
7

HEADS OF ACCOUNT
Water Supply
Other Municipal works
Sub-Total (B)
C. EXTERNAL REVENUEAdvances to Employees
External Asistance
Assigned Taxes
Sub-Total (C)
TOTAL RECEIPTS (A+B+C)
Collection of Taxes & Duties
Interest
Administrative Dept
Education
Medical & Public Health
Animal Husbandry
Other social services
Palika Parking
Indoor Stadium
Night Shelters
Contribution to NDF
Electricity Supply
Water Supply
Roads
Other Municipal Works
Advances to Employees
External Assistance
TOTAL EXPENDITUREClosing Balance
Expenditure
2000-01 2001-02 2002-03 2003-04 2004-05 AverageGrowth rate
161851.75 -99.96 1531171.58 -23.36 423225.00-0.95 1.41 -11.19 -10.78 -5.38
-10.10 -22.58 8.54 -38.42 -15.6420.36 -3.50 -6.96 73.73 20.9122.44 28.59 3.59 40.68 23.83
0.00 0.00 0.00 0.00 0.00
2.76 18.91 4.19 -16.09 2.44-83.43 -27.88 -12.59 -68.77 -48.1713.00 26.53 -18.29 30.96 13.05-3.09 -1.60 8.82 -16.05 -2.981.09 -6.80 22.55 -7.60 2.315.78 7.61 -14.52 -29.43 -7.64
23.22 -19.79 0.82 -14.35 -2.53-1.28 -27.08 -17.21 -22.83 -17.1029.67 -14.64 -13.42 7.99 2.40
-27.25 7.05 8.54 -83.33 -23.75-100.00 -100.00
21.32 -4.43 2.51 -14.77 1.16-17.31 -20.53 21.53 4.26 -3.0197.91 15.97 7.72 -33.33 22.07-5.88 4.98 4.37 13.13 4.15-1.21 -31.44 -10.87 -47.11 -22.66
-69.60 -19.46 -30.90 268.28 37.080.00 0.00 0.00 0.00 0.00
8

HEADS OF ACCOUNT
PART II : CAPITAL INCOME & EXPENDITURE
External Assistance
Deposit Works
TOTAL
Administrative Dept.
Education
Medical & Public Health
Animal Husbandry
Other Social Sevices
Electricity Supply
Water Supply
Roads
Other Municipal Works
Deposit Works
TOTAL
Receipts
Expenditure
2000-01 2001-02 2002-03 2003-04 2004-05 AverageGrowth rate
65.12 -37.73 136.31 -20.56 35.79-22.87 28.37 -49.72 35.24 -2.25
0.00 0.00 0.00 0.00 0.00
1981.94 20.89 -74.83 45.07 493.278.78 13.01 -20.38 3.36 1.19
28.35 21.66 -50.59 64.69 16.03-100.00 -100.00 -100.00
0.41 24.10 -37.03 -0.13 -3.16132.17 -31.42 59.65 -45.99 28.6093.29 -7.51 -54.32 -31.17 0.07-9.34 13.60 77.62 11.09 23.24
-28.32 16.13 12.20 -15.92 -3.98-15.00 -18.22 -43.35 57.56 -4.75
0.00 0.00 0.00 0.00 0.00
9

2001-02 2002-03 2003-04 2004-05 2001-02 2002-03 2003-04 2004-05 Average
Opening Balance -3088.42 -3646.58 -3842.26 -4309.54
Revenue ReceiptsA Water Supply
1 Water charges 160.85 178.30 166.59 206.45 39.77 21.19 30.69 36.55 32.05
a NDMC 15.92 18.04 16.06 20.82 3.94 2.14 2.96 3.69 3.18
b MES 4.66 3.43 4.69 6.19 1.15 0.41 0.86 1.10 0.88
2Water charges (Transfer entry from Plants and offices of DJB) 0.00 0.00 0.00 0.00 0.00 0.00 0.00
3 Misc. Income 1.11 1.12 3.10 10.74 0.27 0.13 0.57 1.90 0.72
B Sewerage 1 Sewerage Charges (MCD) 16.85 11.80 0.00 0.00 4.17 1.40 0.00 0.00 1.39
a NDMC 10.20 12.27 9.84 13.83 2.52 1.46 1.81 2.45 2.06
b MES 2.99 3.65 2.87 4.11 0.74 0.43 0.53 0.73 0.61
2 Non-Plan Assistance 190.00 610.64 301.00 284.00 46.98 72.57 55.45 50.27 56.32
3 Misc. Income 1.83 2.19 38.72 18.77 0.45 0.26 7.13 3.32 2.79TOTAL REVENUE INCOME 404.41 841.44 542.87 564.91 100.00 100.00 100.00 100.00 100.00
Revenue Expenditure1 Establishment 161.57 177.66 192.49 238.07 18.12 16.58 18.77 21.22 18.67
2 Other adminstrative Expenses 10.80 29.49 0.00 0.00 1.05 2.63 0.92
3 Power 222.41 271.14 224.36 236.00 24.94 25.31 21.88 21.04 23.29
4 Repair & Maintenance 26.85 22.09 21.71 15.76 3.01 2.06 2.12 1.40 2.15
5 General Stores and Chemicals 14.99 14.21 15.84 17.08 1.68 1.33 1.55 1.52 1.52
6 Cost of Raw Water 5.69 7.38 22.94 22.00 0.64 0.69 2.24 1.96 1.38
7 Property Tax 45.62 75.87 27.23 5.00 5.12 7.08 2.66 0.45 3.82
8 Repayment of loan and Interest 410.97 499.14 509.88 555.52 46.09 46.59 49.73 49.51 47.98
10 Cess 3.54 3.78 3.02 0.40 0.35 0.00 0.27 0.25TOTAL REVENUE EXPENDITURE 891.64 1071.28 1025.26 1121.94
Status- Surplus/Deficit -487.22 -229.84 -482.39 -557.03
Annexure 14-3- Delhi Jal Board- Detailed Finances
Actual
Capital Account
Revenue Account
Sectoral Contribution
Rs in Crore PercentageHead of Account
1

2001-02 2002-03 2003-04 2004-05 2001-02 2002-03 2003-04 2004-05 Average
Annexure 14-3- Delhi Jal Board- Detailed Finances
Actual Sectoral Contribution
Head of AccountCapital Receipts
1 Water
Loan 265.30 399.84 439.05 484.94 53.12 63.61 72.13 69.80 64.66
Grant 52.00 54.65 7.50 7.80 10.41 8.69 1.23 1.12 5.36
2 Sewerage
Loan 174.15 170.61 162.18 202.02 34.87 27.14 26.64 29.08 29.43
Grant 8.02 3.50 0.00 0.00 1.61 0.56 0.00 0.00 0.54
Total Capital Receipts 499.47 628.60 608.73 694.76 100.00 100.00 100.00 100.00 100.00
Capital Expenditure1 Water 393.56 456.64 453.43 473.49 69.00 76.82 76.38 70.16 73.092 Sewerage 176.85 137.80 140.19 201.40 31.00 23.18 23.62 29.84 26.91
Total Capital Expenditure 570.41 594.44 593.62 674.89 100.00 100.00 100.00 100.00 100.00 Status- Surplus/Deficit -70.94 34.16 15.11 19.87OVERALL ACCOUNT STATUS -558.16 -195.68 -467.28 -537.16Closing Balance -3646.58 -3842.26 -4309.54 -4846.70
2

Opening Balance
Revenue ReceiptsA Water Supply
1 Water charges
a NDMC
b MES
2Water charges (Transfer entry from Plants and offices of DJB)
3 Misc. Income
B Sewerage 1 Sewerage Charges (MCD)
a NDMC
b MES
2 Non-Plan Assistance
3 Misc. Income
TOTAL REVENUE INCOME
Revenue Expenditure1 Establishment
2 Other adminstrative Expenses
3 Power
4 Repair & Maintenance
5 General Stores and Chemicals
6 Cost of Raw Water
7 Property Tax
8 Repayment of loan and Interest
10 Cess
TOTAL REVENUE EXPENDITURE Status- Surplus/Deficit
Annexure 14-3- Delhi Jal Board- D
Capital Account
Revenue Account
Head of Account 2001-02 2002-03 2003-04 2004-05 CAGR
-- 10.85 -6.57 23.93 8.68%
-- 13.32 -10.99 29.64 9.35%
-- -26.39 36.73 31.98 9.93%
--
1.03 176.69 113.15%
-- -29.97 -100.00 -100.00%
-- 20.29 -19.80 40.55 10.68%
-- 22.07 -21.37 43.21 11.19%
-- 221.39 -50.71 -5.65 14.34%
-- 19.44 1668.04 -51.52 117.13%
--
-- 9.96 8.35 23.68 13.79%
-- 172.95 172.95%
-- 21.91 -17.25 5.19 2.00%
-- -17.73 -1.74 -27.40 -16.28%
-- -5.21 11.49 7.80 4.44%
-- 29.80 210.69 -4.10 56.97%
-- 66.32 -64.11 -81.64 -52.14%
-- 21.46 2.15 8.95 10.57%
-- 6.81 -100.00 -5.16%
Percentage
Growth rate
3

Annexure 14-3- Delhi Jal Board- D
Head of AccountCapital Receipts
1 Water
Loan
Grant
2 Sewerage
Loan
Grant
Total Capital ReceiptsCapital Expenditure
1 Water2 Sewerage
Total Capital Expenditure Status- Surplus/Deficit
OVERALL ACCOUNT STATUSClosing Balance
2001-02 2002-03 2003-04 2004-05 CAGR
Growth rate
19.75 13.39 -3.22 22.27%
-16.49 -85.83 -8.88 -46.87%
-22.16 -1.84 9.14 5.07%
-65.32 -100.00 -49.35%
--
-- 11.34 -0.57 -8.15 6.36%
-- -25.23 1.87 26.36 4.43%
--
4