chapter 13 performance outcomes
TRANSCRIPT

2040 TRANSPORTATION POLICY PLAN | METROPOLITAN COUNCIL | 2020 UPDATE | Chapter 13: OUTCOMES | Page 13.1
CHAPTER 13
PERFORMANCE OUTCOMES
Overview
As discussed in Chapter 1, this document incorporates a performance-based planning approach that
includes a strategic vision and direction and a process to evaluate the effectiveness of the plan’s
implementation. This chapter provides detail on the process and outcomes of performance measures
used to evaluate the plan.
The performance measures outlined in this chapter are organized by the six overarching goals of the
Transportation Policy Plan, detailed in Chapter 1, which are:
• Transportation System Stewardship
• Safety and Security
• Access to Destinations
• Competitive Economy
• Healthy and Equitable Communities
• Leveraging Transportation Investments to Guide Land Use
These six goals are supported by 20 regional objectives listed in Chapter 1. Objectives are more
specific and achievable in the short term than goals and give direction to how the goals may ultimately
be achieved. Objectives are also used to inform the specific Strategies and Actions the Metropolitan
Council and its partners will employ to achieve the Transportation Policy Plan Goals and Objectives.
The strategies are listed in Chapter 2. Performance measures are intended to be clear, quantifiable
metrics that convey whether the region is achieving its goals, and which goals are not being fully met,
and therefore need additional emphasis and resources.
The performance measures included in this chapter can be broadly characterized as fitting into one of
the following two categories:
• Required federal performance measures that are tracked and must be reported upon on a
regular basis. The Metropolitan Council is required to set short-term performance targets for
these performance measures. The results of these measures are primarily concerned with the
overall trend and whether this trend is meeting the desired expectations. These performance
measures are important in that if a measure is not trending towards achieving the target,
federal funds may need to be re-directed to address the problem.
• Regional performance measures that directly support the Transportation Policy Plan’s
goals and objectives. These measures are tracked regularly to ensure they are consistent
with the desired outcomes as defined by the goals and objectives. Additionally, many of these
performance measures are modeled for 2040 conditions and provide a tool to guide the
actions the region could take to achieve the desired system vision. The establishment of

2040 TRANSPORTATION POLICY PLAN | METROPOLITAN COUNCIL | 2020 UPDATE | Chapter 13: OUTCOMES | Page 13.2
specific, quantifiable targets for these measures is included as a future work program item for
the Metropolitan Council.
The specifics of both the federally required performance measures and the regional performance
measures are outlined in the following sections.
Federally Required Performance Measures
Federal law (23 CFP 490.29) requires all state Departments of Transportation and Metropolitan
Planning Organizations (MPOs) to adopt a performance-based program to measure system
performance and set performance targets that monitor progress toward achieving the plan’s goals. The
federally required performance measures are divided into the following four five categories:
• Safety Performance Measures (PM1)
• Pavement/Bridge Performance Measures (PM2)
• System Performance Measures and Congestion Mitigation and Air Quality (PM3); and
• Transit Asset Management (TAM); and
• Transit Safety Performance..
For each of the non-transit performance measures, the state (through the Minnesota Department of
Transportation) has a required deadline to set a statewide target. After the state sets a performance
target, the MPO has 180 days to either concur with the DOT’s statewide target or set a different target
that is specific for its region. Targets for the safety performance measures and transit asset
management are set annually, while all other targets are set on a four-year basis with the option to
adjust after two yearson different schedules. Table 13-1 details the regional, federal targets adopted by
the Metropolitan Council for the federal performance measures.
The federally required performance measures have been woven into the TPP’s goals, objectives, and
strategies framework and are incorporated into the performance measures included within this chapter.
Each measure directly supports one or more of the goals and objectives of the plan, and the recent
trends corresponding with the specific measure have been included in the tables of this chapter. The
following table details the performance measures required for the four federal performance monitoring
programs and the applicable targets.
2040 TRANSPORTATION POLICY PLAN | METROPOLITAN COUNCIL | 2020 UPDATE | Chapter 13: OUTCOMES | Page 13.3
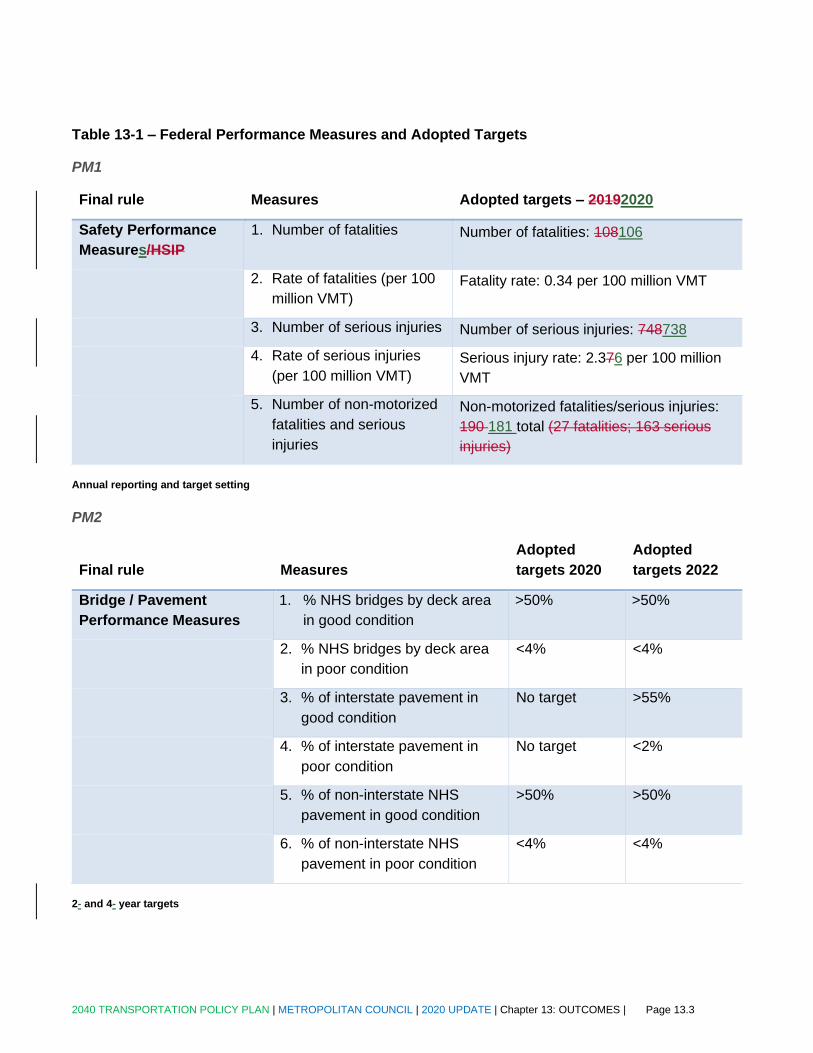
Table 13-1 – Federal Performance Measures and Adopted Targets
PM1
Final rule Measures Adopted targets – 20192020
Safety Performance
Measures/HSIP
1. Number of fatalities Number of fatalities: 108106
2. Rate of fatalities (per 100
million VMT)
Fatality rate: 0.34 per 100 million VMT
3. Number of serious injuries Number of serious injuries: 748738
4. Rate of serious injuries
(per 100 million VMT)
Serious injury rate: 2.376 per 100 million
VMT
5. Number of non-motorized
fatalities and serious
injuries
Non-motorized fatalities/serious injuries:
190 181 total (27 fatalities; 163 serious
injuries)
Annual reporting and target setting
PM2
Final rule Measures
Adopted
targets 2020
Adopted
targets 2022
Bridge / Pavement
Performance Measures
1. % NHS bridges by deck area
in good condition
>50% >50%
2. % NHS bridges by deck area
in poor condition
<4% <4%
3. % of interstate pavement in
good condition
No target >55%
4. % of interstate pavement in
poor condition
No target <2%
5. % of non-interstate NHS
pavement in good condition
>50% >50%
6. % of non-interstate NHS
pavement in poor condition
<4% <4%
2- and 4- year targets

2040 TRANSPORTATION POLICY PLAN | METROPOLITAN COUNCIL | 2020 UPDATE | Chapter 13: OUTCOMES | Page 13.4
PM3 – Non-CMAQ
Final rule Measures
Adopted
targets 2020
Adopted
targets 2022
System
Performance
1. % of reliable person-miles traveled on
the interstate
>70% >70%
2. % of reliable person-miles traveled on
non-interstate NHS
>75% >75%
3. % of interstate system mileage
providing for reliable truck travel time
<2.20 <2.20
2- and 4- year targets for interstate
4 year targets for non-interstate
PM3
Final rule Measures
Adopted
targets 2020
Adopted
targets 2022
CMAQ (Metro Aarea
Oonly)
1. On-road Mobile Source Emissions
measure. Sum of emissions
reductions of pollutants, in
kilograms per day, for all projects
funded with CMAQ funds.
>6,800 >6,800
2. Non-Single Occupancy Vehicle
measure. Percent of regional
travel by non-SOV modes.
>25% >25%
3. Peak-Hour Excessive Delay.
Measurement of annual hours of
excessive delay per capita.
Excessive delay is defined as
travel below 20 miles-per-hour or
60 percent of the posted speed
limit during peak travel hours (6
a.m. to 10 a.m. and 3 p.m. to 7
p.m.
no target <8.5
2- and 4- year targets while designated nonattainment/maintenance.
Only 4 year if in attainment – anticipated in November of 2019

2040 TRANSPORTATION POLICY PLAN | METROPOLITAN COUNCIL | 2020 UPDATE | Chapter 13: OUTCOMES | Page 13.5
TAM
Final rule Measures Adopted targets – 2019
Transit Asset
Management
1. Rolling Stock (revenue vehicles): %
exceeding useful life, by vehicle
type
Rolling Stock: % Exceeding Useful Life
1. Articulated bus: 8%
2. Bus: 2.4%
3. Cutaway: 14%
4. Light Rail Vehicle: 0%
2. Equipment (non-revenue): %
exceeding useful life, by vehicle
type
Equipment: % Exceeding Useful Life
1. Automobiles: 42%
2. Trucks/other rubber tire vehicles:
38%
3. Facility: % rated below a 3 on
condition scale, by facility type
Facility: % Rated Below 3 on Condition
Scale
1. Passenger/parking facilities: 0%
2. Administrative/maintenance
facilities: 0%
4. Infrastructure: % of track with
performance restrictions
Infrastructure: % of Track with
Performance Restrictions
1. Light Rail: 1%
Annual Reporting and Target Setting Required for Transit Providers
Final rule Measures Adopted targets
Transit Safety
Performance
1. Total number of fatalities Target adoption required
for MPO by 2021
2. Rate of fatalities per total vehicle revenue
miles
Target adoption required
for MPO by 2021
3. Total number of injuries Target adoption required
for MPO by 2021
4. Rate of fatalities per total vehicle revenue
miles
Target adoption required
for MPO by 2021
5. Total number of safety events Target adoption required
for MPO by 2021

2040 TRANSPORTATION POLICY PLAN | METROPOLITAN COUNCIL | 2020 UPDATE | Chapter 13: OUTCOMES | Page 13.6
Final rule Measures Adopted targets
6. Rate of safety events per total vehicle
revenue miles
Target adoption required
for MPO by 2021
7. Reliability: mean distance between major
mechanical failures by mode
Target adoption required
for MPO by 2021
Per federal requirements, the TPP should include an evaluation of how the system has performed,
including the identification of performance trends and the implications. The following sections discuss
the current metro area performance for each of thethe performance measure categories and, as
applicable, how performance is trending.
Safety Performance Measures
The region has implemented a number of strategies to improve safety for all users of all modes within
the metro area. The strategies include a commitment to aggressively reduce the number of fatal and
serious injury crashes annually, with an aspirational goal of achieving zero fatal and serious injury
crashes sometime in the future.
Pursuant to federal requirements, the Council must adopt short-range annual highway safety
performance targets that are both reasonable and achievable. The Council thus adopted 2019 2020
targets that reflect an annual reduction from the base-year data for fatal and serious injury crashes, as
shown in Table 13-1. While the methodology used to determine the targets is the same as that
employed by MnDOT for the state as a whole, itFor 2020, the Council is applied a reduction from the
2019 targets forto the metro area in order to produce a targets that is specific and meaningful for the
region.
Between 2015 and 2016 there was a significant change in the way that serious injury crashes were
reported. In 2015 and all years prior, only confirmed serious injuries were recorded and included in the
serious injury crash total. This changed in 2016, where the definition of serious injury crashes was
expanded to include both confirmed serious injuries and suspected serious injuries. As a result, the
number of bike/ped serious injuries reported in the metro area increased by 63% between 2015 and
2017. Critically, the 2018 metro-area bike/ped targets were based upon the lower 2015 data, which
only included confirmed serious injuries. The 2019 bike/ped targets reflected the new definition for
serious injury crashes and included both confirmed and suspected serious injuries. As a result, the
metro area’s bike/ped target increased from 2018 to 2019. This is anticipated to be one-time
adjustment, as moving forward the definition of serious injury crashes will continue to include both
suspected and confirmed serious injuries.
The 2019 2020 non-motorized targets reflects a 5% annualized reduction in fatalities from the 2017
base-year data and a 6% annualized reduction in serious injuries from the 2017 base-year data. In
total, there were 214 non-motorized serious injuries and fatalities in the metro area in 2017., 30 of
which were fatalities and 184 of which were serious injuries. This contrasts sharply with the 2015 base-

2040 TRANSPORTATION POLICY PLAN | METROPOLITAN COUNCIL | 2020 UPDATE | Chapter 13: OUTCOMES | Page 13.7
year data in which the 2018 targets were set, when there was a total of 131 combined non-motorized
serious injury crashes and fatalities in the metro area.
Overall, there are significantly fewer fatal and serious injury crashes per capita and a lower crash rate
in the metro than in Greater Minnesota. The fatal crash rate in the metro area is approximately half of
that of Greater Minnesota, while the serious injury rate is approximately 35% lower.
From 2018 2017 to 20192018, the total number of fatal crashes, serious injuries, and non-motorized
fatalities and serious injuries increased decreased within the metro area. Similarly, the rate of fatal and
serious injury crashes, which accounts for vehicle miles travelled, also increaseddecreased. The
Council will continue to monitor and report upon these safety measures on an annual basis, which
should will assist in determining whether these changes prove to be increase was an outlier or part of a
larger trend.
Pavement and Bridge Performance Measures
The Council chose to concur with MnDOT and apply the statewide bridge and pavement targets in the
metro area. The targets were adopted for the first time in 2018 and coordinated closely with MnDOT.
Overall, performance for the bridge and pavement measures was similar in the metro area to Greater
Minnesota as a whole.
Currently, the percent of NHS bridges whose deck area is in good condition is lower in the metro area
than the adopted 2020 and 2022 targets. This is offset, however, by the state-wide condition, which is
on track to meet the established targets. Bridge deck condition can fluctuate significantly from year to
year, and one major bridge project has the potential to skew the overall performance. While this is
likely the case within the metro area, the existing performance will be closely monitored and may
indicate a need to place a greater emphasis on bridge deck condition within the region over the coming
years.
Regarding pavement, while Interstate pavement condition within the metro area is performing at a level
greater than the targets, non-Interstate NHS pavement is not performing at the same levelas well. This
may indicate a need to focus more explicitly on non-Interstate NHS facilities in the future in an effort to
ensure the region continues to be on track to meet the 2020 and 2022 targets.
System Performance Measures
Due to the more urbanized nature of the metro area as opposed to the more rural character of Greater
Minnesota, the Council adopted system performance measures for system reliability that are specific to
the region. The existing metro area performance for the percent of reliable person-miles traveled on
the interstate system is approximately 69%. MnDOT established a state-wide target of greater than
80%, which would likely be unattainable for the near-term future within the metro area. Instead, the
Council has adopted a 2020 and 2022 target of greater than 70%. This target is appropriate in that it
still aspires to be better than current conditions, but is more attainable than the statewide target of 80%.
In addition to the interstate reliable person-miles target, the Council has also elected to adopt targets
that are different than MnDOT for the truck travel time reliability index measure. This is due to the fact

2040 TRANSPORTATION POLICY PLAN | METROPOLITAN COUNCIL | 2020 UPDATE | Chapter 13: OUTCOMES | Page 13.8
that the reliability of truck travel is lower in the metro area than in Greater Minnesota as a whole. The
adopted MnDOT target of less than 1.5 would be very difficult to attain given the traffic levels in the
metro area as compared to Greater Minnesota.
All of the adopted reliability targets aim for improvement over the existing conditions, and as such may
be considered aspirational given recent trends. There is, however, no consequence to the region for
not meeting these targets, and the State of Minnesota as a whole is likely to meet the statewide
adopted targets. The Council has chosen these targets as a mechanism to work towards improvement
in both the near- and long- term future.
Congestion Mitigation and Air Quality (CMAQ) Performance Measures
CMAQ measures are unique in that they only apply to areas which are not in full air quality attainment
and the targets must be jointly agreed to by both the Council and MnDOT. As such, the Council
worked closely with MnDOT staff to set the 2020 and 2022 CMAQ measures shown in Table 13-1.
On-road mobile source emissions reductions can vary considerably from year to year, as they reflect
the result of projects programmed in the Transportation Improvement Plan. Given this, MnDOT and the
Council set a target that is similar to the most current year’s performance.
The percent of regional travel by non-single occupancy vehicles has been gradually increasing over the
past several years, with more residents choosing to carpool, walk, bike, or take transit to and from
work. A 2020 and 2022 target of greater than 25 percent will be difficult for the region to attain, but
reflects the TPP’s vision of travel via multiple modes and decreased single-occupancy vehicle use.
Peak-hour excessive delay measures “excessive delay,” or delay in which vehicles are travelling at
either less than 20 miles per hour or less than 60% of the posted speed limit. Excessive delay is a
significant mobility concern within the metro area and affects the Access to Destinations goal of the
TPP, among others. The most recent metro area performance showed that there was an average of
8.65 annual hours of excessive delay for each resident of the metro area. The adopted target was set
to improve upon this number, with no more than 8.5 hours of peak hour excessive delay per capita in
both 2020 and 2022.
Transit Asset Management Performance Measures
Transit asset management (TAM), a best practice and a requirement under federal law, is a business
model that prioritizes funding decisions based on the condition of transit assets. Transit providers are
required to assess, track, and report on their assets to FTA, and develop annual targets for asset
management to ensure a state of good repair. Transit providers also develop transit asset management
plans that document implementation actions for asset management within their transit systems. Initial
TAM targets must be coordinated with the Council, which is the region’s MPO. The four FTA-required
performance measures for transit asset management are:
• Rolling stock (buses and train used for serving customers): The percentage of revenue
vehicles (by type) that exceed the useful life benchmark.

2040 TRANSPORTATION POLICY PLAN | METROPOLITAN COUNCIL | 2020 UPDATE | Chapter 13: OUTCOMES | Page 13.9
• Equipment (vehicles used in a support role): The percentage of non-revenue service vehicles
(by type) that exceed the useful life benchmark.
• Facilities: The percentage of facilities (by group) that are rated less than 3.0 on the Transit
Economic Requirements Model (TERM) Scale.
• Infrastructure: The percentage of rail track segments (by mode) that have performance
restrictions. Track segments are measured to the nearest one-hundredth of a mile.
The region’s transit operators officially established 2018 performance targets on April 1 of 2018, which
are shown in Table 13-1. These targets were consequently adopted by the Council, serving as the
region’s MPO, in October of 2018. The Federal Transit Administration (FTA) does not require MPOs to
adopt regional TAM targets on an annual basis.
The TPP outlines the goals, objectives, and strategies that are used to set transit investment priorities
for the region. These factors, in turn, directly guide the investment plan and transit projects
programmed and ultimately built. The TPP guides transit investments through the following objectives
and strategies:
• Efficiently preserve and maintain the regional transit system in a state of good repair;
• Manage the regional transit network and respond to demand as deemed appropriate based
on the Transit Market Area;
• Provide transit police services and coordinate with other public safety agencies to ensure the
safety and security of the transit system;
• Promote alternatives to single occupant vehicles and ensure transit services reach major job
and commercial activity centers;
• Expand and modernize transit service, facilities, systems, and technology to meet demand,
improve customer experience, and increase transit access to destinations.
Regional Performance Measures As previously noted, in addition to the federally required measures, the performance measures within this chapter also include several measures to evaluate the desired outcomes of this Transportation Policy Plan. These performance measures reflect the long-term vision for the region and serve as indicators to track the region’s progress towards achieving the goals and objectives of this Plan. Some of the performance measures can be evaluated using horizon year 2040 model outputs for the revenue scenarios outlined in this Transportation Policy Plan, while others are intended to reflect and track current conditions and assess whether the region is making progress towards meeting the 2040 system vision. . Due to the onset of COVID-19 in early 2020, overall travel demand, as well as travel patterns and modes for work, school and other activities may have shifted. It is unclear whether or to what extent any short-term shifts in travel frequency and mode choice will become permanent and how changes may impact future outcomes. As such, the regional performance measures do not reflect any potential long-term effects of the 2020 COVID-19 pandemic.
The regional performance measures were chosen after meetings and input from Metropolitan Council
stakeholders and the public. The Pprevious versions of the 2040 Transportation Policy Plan, adopted in
2015, included include a work item with the task of refining the planning and programming

2040 TRANSPORTATION POLICY PLAN | METROPOLITAN COUNCIL | 2020 UPDATE | Chapter 13: OUTCOMES | Page 13.10
performance measures. Comments received from the public outreach process for that plan indicated
that the plan goals, objectives and strategies, their inter-relationship, and the related performance
measures needed further review.
This work item was implemented through the formation of five modal work groups: highway, transit,
freight, aviation, and bicycle/pedestrian. Membership in these work groups included representatives
from cities, counties, MnDOT, transit providers, the University of Minnesota, the Minnesota Department
of Health, the Metropolitan Airports Commission, and Metropolitan Council staff. The work groups also
included representatives of advocacy groups such as Saint Paul Smart Trips, Minneapolis Bicycle
Coalition, Transportation Accessibility Advisory Committee (TAAC), the American Trucking Association,
and Transit for Livable Communities.
These modal work groups met throughout 2015 to develop recommendations for the performance
measures to be used in the 2040 Transportation Policy Plan. Their task was to develop additional or
replacement plan performance measures. In recommending performance measures, the work groups
considered the availability of data and other factors. The groups developed a list of measures, which
were prioritized based on their relationship to the plan’s goals and objectives. Those performance
measures with strong relationships are used in this plan and outlined in this chapter.
Modeling Process
Where possible, and for those performance measures where a long-term result was desired, the
process utilized the regional travel demand model to provide estimates for the expected 2040 results
under two different investment scenarios, as well as a “no build” scenario. The scenarios are described
below.
• Current Revenue Scenario. This scenario accounts for the assumption that all revenues that
the region can reasonably expect to be available will continue to be available at the same
level (accounting for inflation) until the horizon year of 2040. It is a fiscally constrained
scenario that is based on historical funding levels, current laws, and current allocation
formulas. The estimated revenues available under this scenario total approximately $92.1
billion dollars.
• Increased Revenue Scenario. This scenario is premised on the region adopting policy
changes, laws, or decisions that increase local, state, or federal funding levels. It is a scenario
based on plausible reason and illustrates what may be achieved with additional revenues.
While the projects are not considered part of the approved plan, this scenario provides
context for the level of transportation revenues and investments needed to move the region
closer to achieving the transportation goals and objectives of this plan.
• “No Build” Scenario. This scenario presents the modeled conditions of the region under the
assumption that no projects are built after the 2015 base-year condition. This represents the
expected conditions should no transportation improvement be made from 2015 to 2040.
All future scenarios assume the same assumptions for demographic growth in the region, with
population in the region increasing from 2,973,000 in 2015 to 3,640,0003,653,000 in 2040 and total

2040 TRANSPORTATION POLICY PLAN | METROPOLITAN COUNCIL | 2020 UPDATE | Chapter 13: OUTCOMES | Page 13.11
employment increasing from 1,620,000 to 2,070,0002,016,000. This represents a total increase of
232% and 248% increase in population and employment, respectively. Note that the demographic
forecasts used for the travel demand modeling process differ slightly from the Metropolitan Council’s
regional forecast for 2040. The demographic projections used for the travel demand model are based
upon the local forecasts and summed for all traffic analysis zones (TAZs) in the metro area.
Performance Measure Outcomes The following tables, which are categorized by the overall goals of this Transportation Policy Plan, list
each performance measure chosen for this plan and, if applicable, their modeled outcomes based upon
the three scenarios. The tables include the following information:
• The performance measure
• A description of the performance measure
• The applicable geography or transportation network that is being measured
• The existing performance
• The 2040 outcomes for each model scenario, if applicable
Note that not all performance measures have associated model outputs. In these cases, the table
includes an outcomes column that provides additional information pertaining to the desired long-term
outcomes.
Transportation System Stewardship
Transportation System Stewardship – Sustainable investments in the transportation system are
protected by strategically preserving, maintaining, and operating system assets.
The transportation system that exists at any given time needs to be maintained and operated. The
priority is to keep the system in working order and maximize its potential in terms of effectively and
efficiently moving people and freight. Keeping up a well-maintained, functional transportation system is
at the core of transportation investment.

2040 TRANSPORTATION POLICY PLAN | METROPOLITAN COUNCIL | 2020 UPDATE | Chapter 13: OUTCOMES | Page 13.12
Table 13-2: Transportation System Stewardship Performance Measures
Performance
Measure
Description Existing
Performance
Outcomes
Roadway
Pavement
Condition
Percentage of pavement with
a ride quality in good and
poor condition
• Interstate System – Good
• Interstate System – Poor
• Non-Interstate NHS – Good
• Non-Interstate NHS – Poor
63%
1.4%
51%
3.2%
Federally required short term
targets. Council has work
program item to develop long-
term outcomes with MnDOT.
Bridge
Condition
Percentage of bridges
(expressed in deck area) in
good and poor condition
• Interstate and NHS – Good
• Interstate and NHS - Poor
46%
1.3%
Federally required short term
targets. Council has work
program item to develop long-
term outcomes with MnDOT.
MnPASS
Reliability
Percent of time MnPASS
lanes are operating at 45
mph or greater 93.3%
Will be managed to be as
close to 100% as possible
Transit State of
Good Repair
Percent of assets in good
repair
• Rolling Stock: Revenue
Vehicles
• Equipment: Service
Vehicles
• Facilities: Customer and
Maintenance/Administrative
• Infrastructure: Rail Track
Annual
targets set in
accordance
with adopted
asset
replacement
policies
Federally required annual
targets.
Long-term outcomes will not
be developed for this measure
Transportation System Stewardship Outcomes Summary
Three of the four performance measures included under this goal are federally mandated, with the
Council required to set performance targets (or concur with the MnDOT or transit provider targets) and
report upon the trends toward that target on a regular basis. These performance measures and their
2040 TRANSPORTATION POLICY PLAN | METROPOLITAN COUNCIL | 2020 UPDATE | Chapter 13: OUTCOMES | Page 13.13
applicable targets will be included in the next update to the Transportation Policy Plan, per the schedule
for federal requirements.
The Federal Highway Administration has set minimum performance requirements for both pavement
and bridge condition at the state level. For roadway pavement condition, this minimum standard is that
no greater than 5% of the total state-wide interstate system should be in poor condition. There is no
performance threshold for the non-Interstate portion of the National Highway System (NHS). The
minimum standard for bridge condition (including both Interstate and non-Interstate NHS) is no greater
than 10% should be in poor condition.
Overall, the State of Minnesota’s Interstate pavement condition is currently about 60% good and 1%
poor. The state’s non-Interstate NHS condition, meanwhile, is approximately 53% good and 2.5% poor.
When compared to the state as a whole, the metro area has less non-Interstate pavement in good
condition, and more non-interstate pavement in poor condition. In contrast, the state-wide interstate
pavement condition is slightly worse than the metro area’s.
The metro area’s bridge condition performance, which is defined as the total deck area of bridges along
Interstate and NHS systems in good and poor condition, closely mirrors the overall state performance.
This is in large part due to the fact that since approximately 75% of the total bridge deck area in
Minnesota is located within the metro area. The metro area’s overall bridge condition is 46% in good
condition and 1.3% in poor condition. The state, by contrast, is approximately 47% in good condition
and 1.5% in poor condition.
The MnPASS system continues to operate efficiently, with the system speed historically averaging
greater than 45 miles per hour over 935% of the time. This is a key metric to continue to track in the
future, given the reality of limited resources for roadway expansion and the importance of the MnPASS
system to providing a reliable alternative to congestion. MnPASS lanes are anticipated to continue to
operate reliably, as the region can set prices in order to control volume and ensure the lanes operate at
a consistent speed.
Transit asset management targets are set on an annual basis by regional transit providers and must be
officially adopted by the MPO 180 days after the initialse targets are set. These targets reflect the
expected conditions of transit assets by the conclusion of the year when they are set. For example, the
2018 targets are based on a reasonable expectation of the state of the system at the end of 2018.
Safety and Security
Safety and Security – The regional transportation system is safe and secure for all users.
In order for the transportation system to function well, it needs to be safe and secure. Safety and
security are not only essential to protect life, but also to instill confidence in users of the system. Every
investment in the transportation system should strive to make it safer and more secure for the user.

2040 TRANSPORTATION POLICY PLAN | METROPOLITAN COUNCIL | 2020 UPDATE | Chapter 13: OUTCOMES | Page 13.14
Table 13-3: Safety and Security Performance Measures
Performance Measure Description Existing
Conditions
Outcomes
Crashes with Fatal or
Serious Injuries
Number of Fatal or Serious
Injury Crashes
• Fatal Crashes
• Serious Injury Crashes
141
825
Fatal and Serious Injury
Crash Rate
Rate of Crashes per 100
million vehicle miles traveled
• Fatal Crashes
• Serious Injury Crashes
0.49
2.88
Federally required
2018 2020 targets
shown in Table 13-1.
Long-term outcomes
cannot be reasonably
developed for these
measures.
Bicycle/Pedestrian Fatal
or Serious Injury
Crashes
Number of Fatal or Serious
Injury Crashes
184
Safety and Security Outcomes Summary
The measures in Table 13-3 outline the federally required measures and the current performance for
the metro area.
The metro area’s rate of fatal and serious injury crashes is significantly lower than that of the state as a
whole. In 20152018, the metro area’s rate of fatal crashes was 0.49 crashes per 100 million vehicle
miles travelled. The State of Minnesota’s rate (including the metro area) was 0.63 per 100 million
vehicle miles travelled., nearly double that of the region. Serious injury crash rates were similarly
disproportional, with the metro area rate significantly lower than the state as a whole.
Recent serious injury and fatal accident rates have been notably lower than in past decades. This can
likely be attributed to safety improvements to automobiles as well as continued safety engineering
improvements to the roadway system.
Unlike overall fatal and serious crashes, nNon-motorized crash trends have been fairly stable over the
past few decades,have been increasing within the metro area within recent years, with a significant
spike since 2015. with some fluctuations from year-to-year. This is due in large part, however, to the
change in the definition of “serious injury” crashes, which changed between 2015 and 2016.
Previously, only confirmed serious injuries were reported. Starting in 2016, the definition changed to
encompass both confirmed and suspected serious injury crashes. Nonetheless, the Council will

2040 TRANSPORTATION POLICY PLAN | METROPOLITAN COUNCIL | 2020 UPDATE | Chapter 13: OUTCOMES | Page 13.15
continue to proactively monitor, develop solutions, and program projects that help to increase the safety
of pedestrians and bicyclists.
Crashes involving pedestrians represent the majority of non-motorized crashes, both within the metro
area and nationally. Although recent trends indicate increased travel by pedestrians and bicyclists, the
lack of a significant reduction in fatal or serious injury crashes involving these travelers is a cause for
concern, given the reductions seen for overall fatal and serious injury crashes. The region will need to
continue to improve bicycle and pedestrian safety as these modes continue to grow in use.
Given the many uncertainties surrounding future technologies (e.g. the potential introduction of
automated vehicles), it’s not plausible to accurately forecast 2040 conditions for these measures.
Research strongly suggests that that safety conditions will continue to improve by 2040 due to
technological improvements, roadway geometry improvements, and other factors.
Access to Destinations
Access to Destinations – A reliable, affordable, and efficient multimodal transportation system
supports the prosperity of people and businesses by connecting them to destinations throughout the
region and beyond.
Transportation is fundamentally about providing access to destinations, the places where people and
goods need to go. People choose destinations based on the ease of access, whether that relates to
cost, their trust that the system will work reliably, or the transportation mode that might be able to get
them there. When access is possible, other factors will also affect how people choose to get to
destinations, such as the travel time, reliability, comfort, and safety of the trip. Travel preferences can
vary widely across people and transportation modes.
Table 13-4: Access to Destinations Performance Measures
Performance
Measure
Description Existing
Performance
2040 No
Build
2040 Current
Revenue Scenario
2040 Increased
Revenue
Scenario
Access to Jobs Number of jobs
accessible within
30 minutes and
percent increase
compared to
“2040 No Build”
• Driving
• Percent
Increase
• Transit
1,038,957
N/A
24,574
N/A
1,229,954
N/A
29,121
N/A
1,261,0751,257,141
2.25%
321,008950
9.79%
1,278,422283,115
3.94.2%
32,182733
112.4%

2040 TRANSPORTATION POLICY PLAN | METROPOLITAN COUNCIL | 2020 UPDATE | Chapter 13: OUTCOMES | Page 13.16
Performance
Measure
Description Existing
Performance
2040 No
Build
2040 Current
Revenue Scenario
2040 Increased
Revenue
Scenario
• Percent
Increase
MnPASS Usage Average daily
number of
people in
MnPASS lanes
93,000 99,000 288,000300,496 619,858614,000
Percent Non-
Single-
Occupant
Vehicle Travel
Percent of all
trips using
modes other
than non-single
occupancy
vehicles
23% TBD*
Transit
Ridership
Increase in daily
transit ridership
315,000 +74,000 +145,000 +19085,000
Modal
Participation
Rate1
Percent of
people who use
these modes at
least once on a
typical day
• Transit
• Bicycle
• Walk
6.27.4%
3.62.9%
11.223.4%
TBD*
TBD*
Ongoing tracking by
the Travel Behavior
Inventory
1 The mode participation rates presented here differ from those presented in 2016 in part due to updates to
survey methodology in the Travel Behavior Inventory Household Travel Survey. The 2019 survey, upon which
these figures are based, allows participants to record travel over multiple days. These figures reflect mode
participation rates across all weekdays in the survey. Council staff will continue to explore differences
between the figures presented in the 2016 Transportation Policy Plan and the 2019 data prior to adoption of
the amended Plan.

2040 TRANSPORTATION POLICY PLAN | METROPOLITAN COUNCIL | 2020 UPDATE | Chapter 13: OUTCOMES | Page 13.17
Performance
Measure
Description Existing
Performance
2040 No
Build
2040 Current
Revenue Scenario
2040 Increased
Revenue
Scenario
Travel time
Reliability
Ratio of longer to
normal travel
timesPercentage
of person-miles
traveled in reliable
conditions, in
percent of total
person-miles
travelled
• Interstate
• Non-Interstate
NHS
68.869.5%
79.66.5%
Ongoing tracking
and reporting
Peak Hour
Excessive
Delay
Number of hours
of excessive
delay (travel at
less than 20 MPH
or 60% of posted
speed limit) per
capita
8.65
Federally required
short- term target
Ongoing tracking
and reporting
Aviation
Performance
Average aircraft
delay per
operation at MSP
International
Airport (minutes)
4.3 Ongoing tracking
and reporting
Regional
Bicycle
Transportation
Network (RBTN)
Implementation
Percent of RBTN
with existing
bicycle facilities 4756% Ongoing tracking
and reporting
* A methodology for calculating this measure will continue to be developed and these outcomes will be included in future plans.
Access to Destinations Outcomes Summary
The Access to Destinations goal features a number of performance measures, all of which are
important indicators for the overall effectiveness of the transportation network in helping to provide
reliable, affordable, and efficient travel options for a diverse range of metro area residents. This goal
also contains many performance measures in which 2040 outcomes for the three investment scenarios
have been developed. This allows the region to better understand the tangible impacts investment
decisions may have on the regional transportation network.

2040 TRANSPORTATION POLICY PLAN | METROPOLITAN COUNCIL | 2020 UPDATE | Chapter 13: OUTCOMES | Page 13.18
The ability for residents to access jobs in a timely manner is a key for a healthy and competitive
economic environment. Currently, just over 1 million jobs are located within a 30-minute drive for the
typical resident. Without any additional investments, this number will increase to approximately 1.2
million by 2040 based on the addition and location of forecasted job growth. Job access within a 30-
minute drive in 2040 would increase by 2.25% for the current revenue scenario and 3.94.2% for the
increased revenue scenario compared to the no build scenario. The number of jobs accessible within
30 minutes by transit is anticipated to increase by a higher percentage, 9.97% for the current revenue
scenario and 12.411% for the increased revenue scenario, though the overall number of jobs
accessible within a 30-minute transit trip is still far less than driving. The increase in access to jobs can
be attributed not only to a more robust transportation network, but also due to changes in the
distribution of people and jobs over the next few decades.
The results of modeled MnPASS use vary considerably depending on the investment scenario. The
current revenue scenario forecasts a significant increase in MnPASS usage as compared to the no-
build scenario, with daily person through-put nearly doubling. Under the increased revenue scenario,
MnPASS usage increases greatly over 900% from the no-build scenario. This suggests that the
construction of additional MnPASS lanes dramatically affects usage within the region.
Transit ridership is anticipated to rise under both the current and increased revenue scenarios. Under
the current revenue scenario, transit ridership would increase by 74,000 over the no build scenario. The
increased revenue scenario would show an even more dramatic rise, with approximately
185,000190,000 additional daily trips representing 250% growth from current conditions.
The remaining performance measures shown in Table 13-4 do not have calculated model outputs
because most of these measures are dependent on economic or other variables that cannot be
predicted at this time by the travel demand model. As indicated, these performance measures will be
tracked on a regular basis to ensure the region’s investment and transportation priorities are having
their intended effect.
Competitive Economy
Competitive Economy – The regional transportation system supports the economic competitiveness,
vitality, and prosperity of the region and state.
A well-developed and functioning transportation system is a significant attractant to worldwide business
and talent. It also helps the region retain existing businesses and residents, allowing them to thrive in
current and future work environments by supporting efficient movement.
2040 TRANSPORTATION POLICY PLAN | METROPOLITAN COUNCIL | 2020 UPDATE | Chapter 13: OUTCOMES | Page 13.19
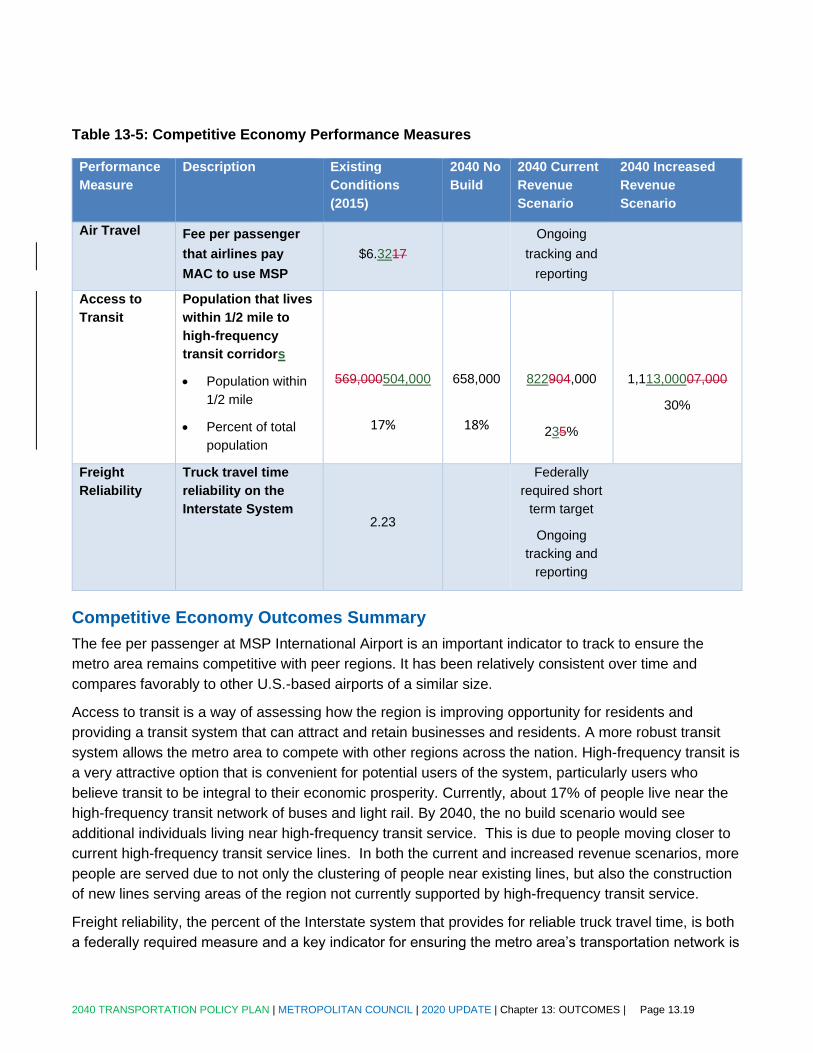
Table 13-5: Competitive Economy Performance Measures
Performance
Measure
Description Existing
Conditions
(2015)
2040 No
Build
2040 Current
Revenue
Scenario
2040 Increased
Revenue
Scenario
Air Travel Fee per passenger
that airlines pay
MAC to use MSP
$6.3217
Ongoing
tracking and
reporting
Access to
Transit
Population that lives
within 1/2 mile to
high-frequency
transit corridors
• Population within
1/2 mile
• Percent of total
population
569,000504,000
17%
658,000
18%
822904,000
235%
1,113,00007,000
30%
Freight
Reliability
Truck travel time
reliability on the
Interstate System 2.23
Federally
required short
term target
Ongoing
tracking and
reporting
Competitive Economy Outcomes Summary
The fee per passenger at MSP International Airport is an important indicator to track to ensure the
metro area remains competitive with peer regions. It has been relatively consistent over time and
compares favorably to other U.S.-based airports of a similar size.
Access to transit is a way of assessing how the region is improving opportunity for residents and
providing a transit system that can attract and retain businesses and residents. A more robust transit
system allows the metro area to compete with other regions across the nation. High-frequency transit is
a very attractive option that is convenient for potential users of the system, particularly users who
believe transit to be integral to their economic prosperity. Currently, about 17% of people live near the
high-frequency transit network of buses and light rail. By 2040, the no build scenario would see
additional individuals living near high-frequency transit service. This is due to people moving closer to
current high-frequency transit service lines. In both the current and increased revenue scenarios, more
people are served due to not only the clustering of people near existing lines, but also the construction
of new lines serving areas of the region not currently supported by high-frequency transit service.
Freight reliability, the percent of the Interstate system that provides for reliable truck travel time, is both
a federally required measure and a key indicator for ensuring the metro area’s transportation network is

2040 TRANSPORTATION POLICY PLAN | METROPOLITAN COUNCIL | 2020 UPDATE | Chapter 13: OUTCOMES | Page 13.20
sufficiently accommodating the movement of freight. This measure is calculated by comparing the ratio
of longer travel times to “normal” travel times for 5 different time periods over 24 hours. The existing
conditions have been relatively stable over time, though freight reliability is worse in the metro area
than in greater Minnesota.
Healthy and Equitable Communities
Healthy and Equitable Communities – The regional transportation system advances equity and
contributes to communities’ livability and sustainability while protecting the natural, cultural, and
developed environments.
The transportation system can be the catalyst for improving communities, but it can also contribute
negatively to communities. The transportation system needs to contribute to the health and vitality of all
communities, including protecting and enhancing existing communities and their cultures as well as
future communities and cultures.
Performanc
e Measure
Description Existing
Conditions
(2015)
2040 No
Build
2040 Current
Revenue Scenario
2040 Increased
Revenue Scenario
Bike and
Pedestrian
Miles
Travelled
Total miles
travelled
• Bicycle
• Pedestri
an
384,250260,00
0
239,236550,00
0
Not currently
forecastable
Vehicle
Miles
Travelled
Per Capita
Daily average
vehicle miles
travelled for a
metro area
resident
23.9 23.3 23.43 23.65
On-Road
Mobile
Source
Emissions
Amount of CO2,
nitrogen, sulfur
dioxide, VOCs,
and CO emissions
CO (pounds)
Nitrogen Oxides
(pounds)
Sulfur Dioxide
(pounds)
VOCs (pounds)
CO2 Equivalent
(pounds)
718,000
85,000
474
19,410
68,930,000
293,000
16,700
354
6,100
51,100,00
0
306,800288,000
16,50016,900
35040
5,900800
50,500,00049,000,0
00
303,4004,000
16,9007,400
349355
5,8006,100
50,400,0001,200,0
00

2040 TRANSPORTATION POLICY PLAN | METROPOLITAN COUNCIL | 2020 UPDATE | Chapter 13: OUTCOMES | Page 13.21
Healthy and Equitable Communities Outcomes Summary
The total bicycle and pedestrian miles travelled are an important indicator for the overall livability and
sustainability of the region as well as contributing to the health of the region’s residents. The data also
sheds light on the accessibility of the region’s bicycle and pedestrian network to individuals within the
region. The data in Table 13-5 is from 2010 and trend data for the region is not yet available, but it will
be updated with more current data once available. This measure is important to track on a regular basis
but cannot be forecasted for 2040.
Analysis on vehicle miles travelled (VMT) per capita is a way of understanding how the region’s
investments and development patterns are impacting overall livability. When people are driving further,
there are implications for the environment (beyond just air quality), the economic viability of travel and
related equity of access, the potential for fatal and serious crashes, and wear and tear on the region’s
transportation infrastructure. For these reasons, VMT per capita can be a proxy for measures in other
goals that cannot be forecasted through the regional travel demand model.
VMT per capita decreases slightly from current conditions under all three modeled scenarios, with the
increased revenue scenario showing the region with the highest VMT levels. However, due to the
increase in population and assuming similar single-occupancy vehicle rates, this would likely lead to
more vehicles on the roadways. This would have an effect on congestion and reliability in the no build
scenario, as the possible lack of capacity expansion to handle the increased number of vehicles could
potentially overwhelm the existing roadway system.
The increased revenue scenario has a higher overall VMT per capita due in part to the investment in
MnPASS lanes. The efficiency provided by the MnPASS system leads to greater usage of the system,
consequently increasing the region’s VMT per capita. However, the substantial investment in MnPASS
lanes increases system capacity and efficiency, likely leading to reduced congestion and greater
mobility than in the no build and current revenue scenarios.
Federal law requires regions in non-attainment or maintenance for air quality report upon on-road
mobile source emissions. The monitoring and reporting of air quality is essential in ensuring the air
quality within the region is not adversely affecting residents. Total emissions have declined in recent
decades, in part due to improved vehicle and bus efficiency and technological improvements to newer
vehicles that result in greatly reduced emissions. By 2040, the air quality within the region is anticipated
to improve. This is in large part due to a rollover of older vehicles to these newer vehicles with reduced
emissions.
Leveraging Transportation Investments to Guide Land Use
Leveraging Transportation Investments to Guide Land Use – The region leverages transportation
investments to guide land use and development patterns that advance the regional vision of
stewardship, prosperity, livability, equity, and sustainability.
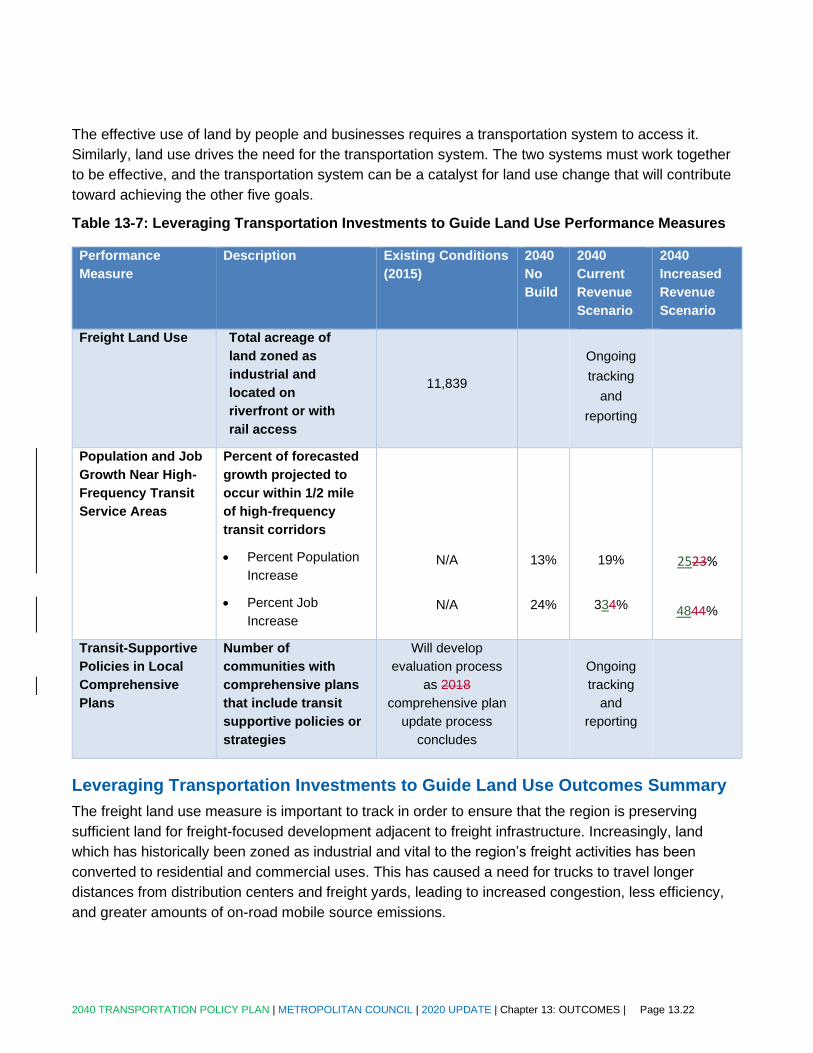
2040 TRANSPORTATION POLICY PLAN | METROPOLITAN COUNCIL | 2020 UPDATE | Chapter 13: OUTCOMES | Page 13.22
The effective use of land by people and businesses requires a transportation system to access it.
Similarly, land use drives the need for the transportation system. The two systems must work together
to be effective, and the transportation system can be a catalyst for land use change that will contribute
toward achieving the other five goals.
Table 13-7: Leveraging Transportation Investments to Guide Land Use Performance Measures
Performance
Measure
Description Existing Conditions
(2015)
2040
No
Build
2040
Current
Revenue
Scenario
2040
Increased
Revenue
Scenario
Freight Land Use Total acreage of
land zoned as
industrial and
located on
riverfront or with
rail access
11,839
Ongoing
tracking
and
reporting
Population and Job
Growth Near High-
Frequency Transit
Service Areas
Percent of forecasted
growth projected to
occur within 1/2 mile
of high-frequency
transit corridors
• Percent Population
Increase
• Percent Job
Increase
N/A
N/A
13%
24%
19%
334%
2523%
4844%
Transit-Supportive
Policies in Local
Comprehensive
Plans
Number of
communities with
comprehensive plans
that include transit
supportive policies or
strategies
Will develop
evaluation process
as 2018
comprehensive plan
update process
concludes
Ongoing
tracking
and
reporting
Leveraging Transportation Investments to Guide Land Use Outcomes Summary
The freight land use measure is important to track in order to ensure that the region is preserving
sufficient land for freight-focused development adjacent to freight infrastructure. Increasingly, land
which has historically been zoned as industrial and vital to the region’s freight activities has been
converted to residential and commercial uses. This has caused a need for trucks to travel longer
distances from distribution centers and freight yards, leading to increased congestion, less efficiency,
and greater amounts of on-road mobile source emissions.

2040 TRANSPORTATION POLICY PLAN | METROPOLITAN COUNCIL | 2020 UPDATE | Chapter 13: OUTCOMES | Page 13.23
As discussed under the competitive economy outcomes summary, high-frequency transit provides a
unique option for residents and businesses to access opportunity and talent. In this context, the region
is investing in an expanded transit system to provide for more options for residents and businesses,
both existing and future. Measuring the growth of jobs and population near high-frequency transit is a
way of assessing how much the future will be supported by multimodal options. Current forecasts
indicate that 13% of new people and 24% of new jobs would be located near the existing high-
frequency transit system by 2040. Building the current revenue scenario would increase this to 19% of
new people and 334% of new jobs by 2040, and the increased revenue scenario would increase this to
253% and 484%, respectively.
There are several factors that can affect where growth by 2040 is distributed in the region. The region’s
local forecasts were developed based on historical data and previous comprehensive plans. The
forecasts are also a product of discussions with local communities. It is a challenge for any forecast to
capture shifting market trends. For example, from 2010-2015 the region observed 53% of added
housing units and 57% of the permit value for commercial and industrial development on previously
developed land. When communities were assessing their initial 2040 forecasts, this market trend for
redevelopment was unforeseen in some communities. The region will be assessing and updating
forecasts as more recent data becomes available. Local governments are also in the process of
updating their 2040 comprehensive plans to reflect Thrive MSP 2040 and its policy plans, which often
results to changes in the location and intensity of growth in a community. These factors affect the
existing and future conditions and thus, it is important to track how this measure changes over time for
both existing conditions and forecasted plan outcomes.
The Council has made a commitment to monitor the incorporation of transit-supportive development
policies and strategies in comprehensive plans throughout the metro area. To accomplish this, the
Council will evaluate comprehensive plans submitted during the 2018 planning cycle for transit-
supportive elements and track how this evolves over time through amendments and future planning
cycles.
Summary of Major Outcomes of Three Scenarios
No build
The no-build scenario presents the outcomes of the region’s transportation conditions should no
improvements be made to the system between 2015 conditions to 2040. In this scenario, while the
region continues to experience population and job growth, the lack of investment in system mobility has
clear effects on the level of congestion, access to jobs, transit usage, and system reliability in general.
The system is unable to keep pace with the increased level of demand and threatens to affect freight
reliability and residents’ access to destinations; commute times; and overall quality of life.
Under the no build scenario, transit ridership and the ability to access jobs within 30 minutes do
increase, but this is due to increased population density and a predicted development pattern where
more individuals settle closer to the urban core of the metro than in existing conditions. The modeled
results of MnPASS usage under the no build scenario indicates that the capacity of the existing system
2040 TRANSPORTATION POLICY PLAN | METROPOLITAN COUNCIL | 2020 UPDATE | Chapter 13: OUTCOMES | Page 13.24
is limited in its ability to handle the increased volume of traffic expected by 2040. This would likely
cause a policy discussion to increase the maximum MnPASS fee for single-occupancy vehicles. The
lack of MnPASS expansion, coupled with per capita VMT figures consistent with current levels, points
to a roadway system with rising levels of congestion, lower travel time reliability, and overall reduced
mobility for residents of the region.
Current Revenue
Under the current revenue scenario, the region experiences investments in the transit system and the
development of MnPASS lanes, leading to an increase in the number of people utilizing these facilities.
As a result, system congestion and reliability are predicted to be better than in the no-build scenario,
and overall access to the transit system leads to a greater percentage of the population living near
high-frequency transit corridors and increased accessibility to jobs. The results of the current revenue
scenario indicate that investments to the transportation system make a difference and improve the
quality of life for residents living within the metro area.
Compared to the no-build scenario, the current revenue scenario experiences nearly double the transit
ridership increase, approximately 10 percent more jobs are accessible within 30 minutes, and over
250,000 more people are located close to a high-frequency transit corridor. Forecasted population and
job growth within high-frequency transit corridors consequently increases by six and 10 percent over
the no build scenario, respectively.
The investment in the MnPASS system under the current revenue scenario, from 71 to 121 miles, leads
to an increase of nearly over 200,000 users over the present conditions. The effect of this investment
is likely to lead to greater reliability and reduced travel times for these users. Overall the investments
made in the current revenue scenario improve upon the conditions presented in the no build scenario
and depict a transportation network that better addresses the increased demand.
Increased Revenue
The increased revenue scenario shows greater positive trends than those illustrated in the current
revenue scenario, with increased transit accessibility and a substantial increase in the number of
MnPASS lane users. All the trends summarized in the current revenue scenario are further increased,
showing that more investment on the transportation network equates to a greater overall impact.
MnPASS lanes receive substantial investment in the increased revenue scenario, with a total of 295
miles of MnPASS lanes in the region. This leads to usage patterns over six times greater than present
conditions and double those of the current revenue scenario. This results in slightly higher VMT in the
metro area, but also an increase in accessibility to jobs. Daily transit ridership is anticipated to increase
by 450,000 over the current revenue scenario and the number of individuals within a half mile of a high-
frequency transit route increases over by nearly 3200,000.
The overall results of the increased revenue scenario reveal a region with reduced congestion, greater
accessibility and reliability, and a more efficient transportation network than in the no build and current
revenue scenarios. Again, the outcomes show that investments impact many facets of the

2040 TRANSPORTATION POLICY PLAN | METROPOLITAN COUNCIL | 2020 UPDATE | Chapter 13: OUTCOMES | Page 13.25
transportation network, and the more investment the region puts into the network, the greater the
impact will be.