chapter 12: factors that may influence cardiovascular ... · chapter 12: factors that may influence...
TRANSCRIPT

169
Chapter 12: Factors that May Influence Cardiovascular Disease – Blood Pressure and Serum Cholesterol Summary
• In England & Wales, the recommended blood pressure Standard was achieved in 42% (inter-unit range 15–68%) of young haemodialysis patients and 64% (range 23–84%) of older patients. Of young peritoneal dialysis patients, 52% (range 40–75%) achieved the Standard, the percentage being 69% (range 45–88%) for older patients. Variations between renal units in attainment of the Standard were significant.
• In the past 3 years, very few centres have shown any significant improvement in blood
pressure control. A reduction in mean systolic blood pressure of 5 mmHg or more for haemodialysis patients has been achieved in only four centres.
• In HD patients, the median falls from pre- to post-dialysis systolic and diastolic blood
pressure were 13 mmHg and 5 mmHg respectively.
• For haemodialysis, 73% (inter-unit range 47–86%) of patients achieved a cholesterol level of 5 mmol/L or less. For peritoneal dialysis patients, the figures were 56% (range 30–72%). These variations are significant between centres. The data show significantly higher cholesterol levels in peritoneal dialysis patients.
• There is a U-shaped association between cholesterol level and 1 year mortality. Short-
term survival is optimal for patients with a serum cholesterol of 5–8 mmol/L, presumably because this reflects good nutrition.
Introduction The cardiovascular burden of the prevalent dialysis population is vast, 45% of patients dying from cardiovascular complications.1,2 The excess risk of death from cardiovascular disease compared with the general population has previously been shown to range from 500-fold in patients aged 25–35 years to fivefold in patients over 85.3 Recent data show that the corresponding risk for dialysis patients in England & Wales is 157-fold for 25–29-year-olds and fivefold for 80–84-year-olds (see Chapter19). For individuals aged more than 64 years starting dialysis, the 5 year prognosis is worse than that for carcinoma of colon, prostate or breast. In the general population, hypertension and hyperlipidaemia are major risk factors for atherosclerosis; as such, they are major targets for treatment intervention. Other uraemia-related factors also contribute to the extensive vascular calcification and myocardial fibrosis characteristic of the changes seen in dialysis patients. These include anaemia, salt and water overload, excessive fistula flow rates, abnormalities of calcium and phosphate metabolism, hyperparathyroidism, hyperhomocysteinaemia, inflammation, increased oxidant stress and prothrombotic tendency. Longitudinal studies are needed to establish the extent of the risk associated with each of these factors.

170
Blood pressure and dialysis mortality The relationship between blood pressure and mortality is bimodal in the dialysis population, a very high or low blood pressure having an adverse effect.4 Patients with a low blood pressure (pre-dialysis systolic blood pressure [systolic BP] <110 mmHg) will include high-risk patients with established heart disease, poor myocardial function and poor outcome. The majority of patients have poorly controlled blood pressure despite an extensive use of anti-hypertensive drugs. Long-standing hypertension in chronic renal failure induces a cardiomyopathy characterised by small vessel disease. The sequence of events can be monitored by echocardiography.5 Left ventricular (LV) hypertrophy initially develops, followed by LV dilatation and ultimately systolic dysfunction. Low blood pressure subsequently causes cardiac ischaemia and myocardial fibrosis, which ultimately leads to diastolic dysfunction and LV conduction abnormalities. Death is usually the result of cardiac failure or arrhythmia induced by sudden ischaemia or electrolyte changes. The development of LV hypertrophy per se predicts a premature cardiac death with a median survival of 5 years, the presence of systolic dysfunction or congestive cardiac failure reducing the median survival to 3 years. Atherosclerosis affecting the main coronary arteries is a distinct process and affects roughly 14% of dialysis patients. Myocardial infarction is a catastrophic event; 1 year survival is 40% and 5 year survival just 10%. Although there have been no controlled trials to date, there is mounting evidence that hypertension reduces survival on dialysis:
• High systolic BP is associated with the development of LV hypertrophy.6 • High diastolic blood pressure (DBP) is associated with the development of de novo
heart failure.7 • A high pulse pressure is associated with arterial stiffness and increased mortality.8 • Treating isolated systolic hypertension in the elderly improves survival.9 • Lowering blood pressure in diabetics improves survival.10,11 • The dry weight control of blood pressure improves survival.12 This approach is not
effective in diabetics or high-risk patients (those with a failure of two other organs or with malignancy).
The Standards for control of hypertension current in 2001, published in 1997, were:
Age <60: BP < 140/90 mmHg (pre-dialysis for haemodialysis patients) Age >60: BP < 160/90 mmHg (pre-dialysis for haemodialysis patients)
(Korotkoff V sound if auscultation is used)

171
Distribution of blood pressure on dialysis
Figure 12.1: Frequency distribution of diastolic BP, on dialysis
Figure 12.2: Frequency distribution of systolic BP, on dialysis systolic BP clearly shows a normal distribution for the dialysis population (Figures 12.1 and 12.2). diastolic BP does not follow this pattern, although it might also be expected to be normally distributed. Instead, the observed distribution suggests a ‘rounding down’ so that diastolic pressures in the range 85–89 mmHg are rounded down to 80–84 mmHg. Centres should ensure that manual blood pressure readings taken by nursing staff are accurately recorded. The introduction of electronic devices should curtail this practice and provide more accurate data.
Frequency distribution of diastolic blood pressure, on dialysis
0
24
6
810
12
1416
18
< 30
30-3
435
-39
40-4
445
-49
50-5
455
-59
60-6
465
-69
70-7
475
-79
80-8
485
-89
90-9
495
-99
100-
104
105-
109
110-
114
115-
119
120-
124
125-
129
130-
134
135-
139
>140
diastolic BP mm/Hg
% o
f pat
ient
sn = 5.095
Frequency distribution of systolic blood pressure, on dialysis
0
2
4
6
8
10
12
14
16
< 60
60-6
970
-79
80-8
990
-99
100-
109
110-
119
120-
129
130-
139
140-
149
150-
159
160-
169
170-
179
180-
189
190-
199
200-
209
210-
229
220-
229
230-
239
> 24
0
systolic BP mm/Hg
% o
f pat
ient
s
n = 5.095

172
Achievement of combined systolic and diastolic Standard
Haemodialysis
Figure 12.3: Percentage of patients aged <60 with a blood pressure <140/90 mmHg, HD
Figure 12.4: Percentage of patients aged >60 with a blood pressure <160/90 mmHg, HD
Percentage of patients age < 60 with BP <140/90 : haemodialysis
0102030405060708090
100
0 S
heff
0 Y
ork
6 O
xfrd
6 L
GI
0 S
und
6 L
eic
6 N
otts
10 E
xtr
14 H
eart
0 B
ristl
3 R
edng
7 S
tJm
s
0 G
louc
7 C
arls
23 T
ruro
0 S
then
d
2 S
tevn
30 G
uys
20 D
erby
2 S
Cle
ve
2 W
olve
2 C
ovnt
5 W
ords
40 E
&W
Centre
% o
f pat
ient
s
Upper 95% CI% diastolic & systolic in rangeLower 95% CI
Percentage of patients age > 60 with BP <160/90 : haemodialysis
0102030405060708090
100
4 L
GI
1 S
heff
14 R
edng
0 B
ristl
23 T
ruro
3 O
xfrd
0 S
und
13 Y
ork
4 L
eic
3 N
otts
6 C
arls
14 E
xtr
8 S
tJm
s
9 H
eart
3 S
tevn
24 G
uys
10 S
Clev
e
0 S
then
d
1 W
olve
0 G
louc
1 C
ovnt
21 D
erby
0 W
ords
40 E
&W
Centre
% o
f pat
ient
s
Upper 95% CI% diastolic & systolic in rangeLower 95% CI

173
Peritoneal dialysis
Figure 12.5: Percentage of patients aged <60 with a blood pressure <140/90 mmHg, PD
Figure 12.6: Percentage of patients aged >60 with a blood pressure <160/90 mmHg, PD
Percentage of patients age < 60 with BP <140/90 :peritoneal dialysis
0102030405060708090
100
0 E
xtr
11 C
amb
22 W
ords
7 N
otts
0 B
ristl
8 R
edng
10 B
radf
0 S
tJm
s
0 T
ruro
0 S
Clev
e
6 L
eic
1 S
heff
17 O
xfrd
24 C
ovnt
53 E
&W
Centre
% o
f pat
ient
s
Upper 95% CI
% diastolic & systolic in range
Lower 95% CI
Percentage of patients age > 60 with BP <160/90 :peritoneal dialysis
0102030405060708090
100
2 B
ristl
2 E
xtr
2 N
otts
14 C
amb
6 R
edng
0 S
tJm
s
0 S
Clev
e
1 S
heff
11 L
eic
18 T
ruro
14 O
xfrd
9 B
radf
29 C
ovnt
67 S
und
69 S
tevn
24 W
ords
54 E
&W
Centre
% o
f pat
ient
s
Upper 95% CI
% diastolic & systolic in range
Lower 95% CI

174
Figures 12.3–12.6 show a wide variation between units achieving the combined blood pressure Standard. For England & Wales, the percentage of young HD patients achieving the Standard averaged 42% (range 15–68%) and older patients averaged 64% (range 23–84%). Young PD patients averaged 52% (range 40–75%) and older patients 69% (range 45–88%). Chi squared testing indicates that these variations are significant within the different age groups for both dialysis modalities. The results are similar to those of previous years, with more elderly patients achieving the Standard because the target was more liberal. PD patients achieve the Standard more frequently, but this is only because their blood pressure readings are equivalent to those seen post-dialysis (see below). Systolic pressure alone
Haemodialysis
Figure 12.7: Median systolic BP, age <60, HD
Figure 12.8: Median systolic BP, age >60, HD
Median systolic BP age < 60: haemodialysis
100110
120130140150
160170180
190200
0 S
heff
0 Y
ork
6 N
otts
6 O
xfrd
6 L
eic
14 H
eart
0 S
und
6 L
GI
10 E
xtr
0 B
ristl
7 S
tJm
s
23 T
ruro
2 S
tevn
3 R
edng
2 W
olve
0 S
then
d
2 S
Clev
e
30 G
uys
7 C
arls
5 W
ords
18 D
erby
0 G
louc
2 C
ovnt
36 E
&WCentre
BP
mm
Hg
Upper quartile
Median systolic bp
Lower quartile
Median systolic BP age > 60: haemodialysis
90
110
130
150
170
190
210
4 L
GI
1 S
heff
3 O
xfrd
14 R
edng
0 S
und
0 B
ristl
4 L
eic
3 N
otts
8 S
tJm
s
6 C
arls
23 T
ruro
9 H
eart
14 E
xtr
13 Y
ork
3 S
tevn
1 W
olve
24 G
uys
10 S
Clev
e
0 S
then
d
0 G
louc
1 C
ovnt
21 D
erby
0 W
ords
36 E
&W
Centre
BP
mm
Hg
Upper quartileMedian systolic bpLower quartile

175
Figure 12.9: Percentage of patients aged <60 years with systolic BP <140 mmHg, HD
Figure 12.10: Percentage of patients aged ≥60 with systolic BP <160 mmHg, HD Figures 12.7–12.10 show that, for HD, the percentage of elderly patients achieving the systolic Standard is higher than is encountered with younger patients. The median systolic BP was 144 mmHg for younger patients and 152 mmHg for older ones. The variations in patients achieving the Standard differed significantly between centres.
Systolic BP < 160 mm Hg aged > 60 : haemodialysis
10
20
30
40
50
60
70
80
90
100
4 L
GI
1 S
heff
14 R
edng
23 T
ruro
0 B
ristl
4 L
eic
3 O
xfrd
13 Y
ork
0 S
und
3 N
otts
14 E
xtr
8 S
tJm
s
6 C
arls
9 H
eart
3 S
tevn
1 W
olve
24 G
uys
0 S
then
d
10 S
Cle
ve
0 G
louc
1 C
ovnt
21 D
erby
0 W
ords
36 E
&W
Centre
% o
f pat
ient
s
Upper 95% CI% with systolic bp <=160Lower 95% CI
Systolic BP < 140 mm Hg aged <60 : haemodialysis
0102030405060708090
100
0 S
heff
0 Y
ork
6 N
otts
6 L
eic
6 L
GI
6 O
xfrd
0 S
und
10 E
xtr
14 H
eart
0 B
ristl
7 S
tJm
s
3 R
edng
0 G
louc
23 T
ruro
0 S
then
d
2 S
tevn
2 W
olve
30 G
uys
7 C
arls
2 S
Cle
ve
18 D
erby
2 C
ovnt
5 W
ords
36 E
&W
Centre
% o
f pat
ient
s
Upper 95% CI% with systolic bp <=140Lower 95% CI
176
Peritoneal dialysis
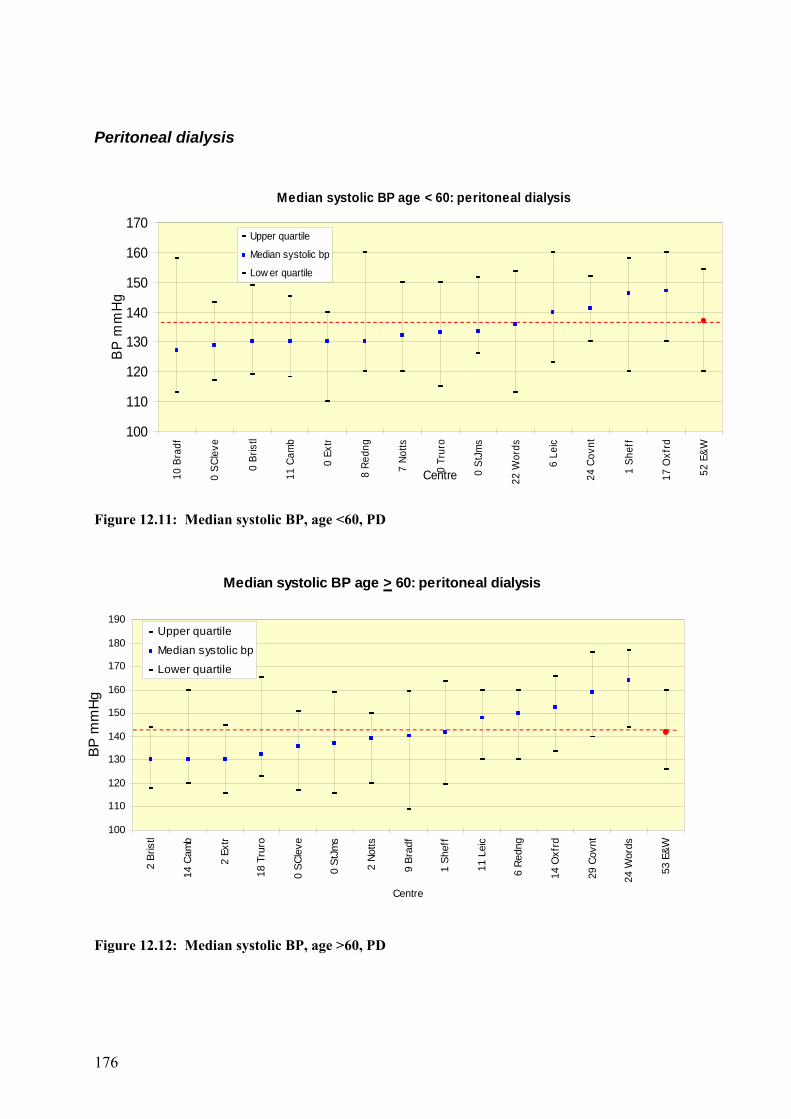
Figure 12.11: Median systolic BP, age <60, PD
Figure 12.12: Median systolic BP, age >60, PD
Median systolic BP age < 60: peritoneal dialysis
100
110
120
130
140
150
160
170
10 B
radf
0 S
Clev
e
0 B
ristl
11 C
amb
0 E
xtr
8 R
edng
7 N
otts
0 T
ruro
0 S
tJm
s
22 W
ords
6 L
eic
24 C
ovnt
1 S
heff
17 O
xfrd
52 E
&W
Centre
BP
mm
Hg
Upper quartile
Median systolic bp
Low er quartile
Median systolic BP age > 60: peritoneal dialysis
100
110
120
130
140
150
160
170
180
190
2 B
ristl
14 C
amb
2 E
xtr
18 T
ruro
0 S
Clev
e
0 S
tJm
s
2 N
otts
9 B
radf
1 S
heff
11 L
eic
6 R
edng
14 O
xfrd
29 C
ovnt
24 W
ords
53 E
&W
Centre
BP m
mH
g
Upper quartile
Median systolic bp
Lower quartile

177
Figure 12.13: Percentage of patients aged <60 with systolic BP <140 mmHg, PD
Figure 12.14: Percentage of patients aged ≥ 60 with systolic BP <160 mmHg, PD Figures 12.11–12.14 show that, for PD, the percentage of elderly patients achieving the systolic Standard is higher than is seen younger patients, and again the variation between centres is significantly different. Lower systolic pressures were achieved in PD patients than HD patients, the difference being 7 mmHg for younger patients and 10 mmHg for older ones. These differences confirm that blood pressure readings in PD are equivalent to post-dialysis blood pressure.
Systolic BP < 140 mm Hg aged < 60 :peritoneal dialysis
0
10
2030
40
50
60
7080
90
100 0
Ext
r
11 C
amb
0 S
Cle
ve
8 R
edng
0 B
ristl
10 B
radf
7 N
otts
22 W
ords
0 S
tJm
s
0 T
ruro
6 L
eic
24 C
ovnt
1 S
heff
17 O
xfrd
52 E
&W
Centre
% o
f pat
ient
s
Upper 95% CI% with systolic bp <=140Lower 95% CI
Systolic BP < 160 mm Hg aged >60 :peritoneal dialysis
20
30
40
50
60
70
80
90
100
2 B
ristl
2 E
xtr
2 N
otts
0 S
Clev
e
6 R
edng
0 S
tJm
s
14 C
amb
11 L
eic
9 B
radf
1 S
heff
18 T
ruro
14 O
xfrd
29 C
ovnt
24 W
ords
53 E
&W
Centre
% o
f pat
ient
s
Upper 95% CI
% w ith systolic bp <=160
Low er 95% CI
178
Diastolic pressure alone
Haemodialysis
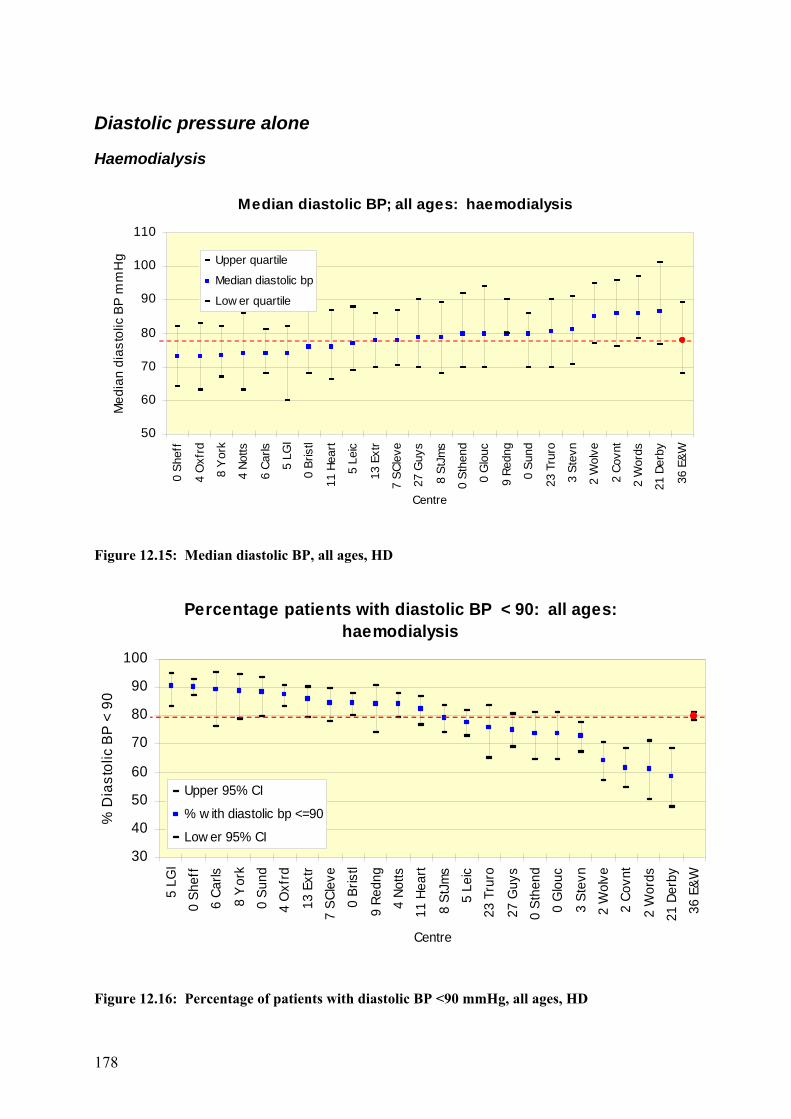
Figure 12.15: Median diastolic BP, all ages, HD
Figure 12.16: Percentage of patients with diastolic BP <90 mmHg, all ages, HD
Median diastolic BP; all ages: haemodialysis
50
60
70
80
90
100
110
0 S
heff
4 O
xfrd
8 Y
ork
4 N
otts
6 C
arls
5 L
GI
0 B
ristl
11 H
eart
5 L
eic
13 E
xtr
7 S
Clev
e
27 G
uys
8 S
tJm
s
0 S
then
d
0 G
louc
9 R
edng
0 S
und
23 T
ruro
3 S
tevn
2 W
olve
2 C
ovnt
2 W
ords
21 D
erby
36 E
&W
Centre
Med
ian
dias
tolic
BP
mm
Hg Upper quartile
Median diastolic bp
Low er quartile
Percentage patients with diastolic BP < 90: all ages: haemodialysis
30
40
50
60
70
80
90
100
5 L
GI
0 S
heff
6 C
arls
8 Y
ork
0 S
und
4 O
xfrd
13 E
xtr
7 S
Clev
e
0 B
ristl
9 R
edng
4 N
otts
11 H
eart
8 S
tJm
s
5 L
eic
23 T
ruro
27 G
uys
0 S
then
d
0 G
louc
3 S
tevn
2 W
olve
2 C
ovnt
2 W
ords
21 D
erby
36 E
&W
Centre
% D
iast
olic
BP
< 9
0
Upper 95% CI
% w ith diastolic bp <=90
Low er 95% CI

179
Peritoneal dialysis
Figure 12.17: Median diastolic BP, all ages, PD
Figure 12.18: Percentage of patients with diastolic BP <90 mmHg, all ages, PD From Figures 12.15–12.18, it can be seen that the median diastolic BP was 78 mmHg for HD patients and 79 mmHg for PD patients. The percentage of patients achieving the Standard varies significantly between centres but not across dialysis modality. The median diastolic BP of younger patients on HD was 81 mmHg, compared with 75 mmHg in patients aged over 65 years. Thus, fewer younger patients achieve the Renal Association Standard. The median diastolic BP of patients on PD was also 81 mmHg in the younger patients, whereas those aged over 65 years on PD had a diastolic BP of 80 mmHg. This indicates that the older patients HD had more co-morbidity than those on PD. The greater use of PD in the UK (selecting patients with less comorbidity) compared with all other countries may account for the apparently lower UK survival rates on HD.
Percentage patients with diastolic BP < 90: all ages: peritoneal dialysis
0102030405060708090
100
10 T
ruro
1 E
xtr
5 N
otts
1 S
heff
1 B
ristl
12 C
amb
7 R
edng
23 W
ords
0 S
tJm
s
8 L
eic
26 C
ovnt
15 O
xfrd
9 B
radf
0 S
Clev
e
52 E
&W
Centre
% d
iast
olic
BP
< 9
0
Upper 95% CI
% w ith diastolic bp <=90
Low er 95% CI
Median diastolic BP; all ages: peritoneal dialysis
50
60
70
80
90
100 1
Ext
r
10 T
ruro
1 S
heff
23 W
ords
5 N
otts
12 C
amb
1 B
ristl
7 R
edng
26 C
ovnt
9 B
radf
15 O
xfrd
0 S
tJm
s
8 L
eic
0 S
Clev
e
52 E
&W
Centre
Med
ian
dias
tolic
BP
mm
Hg
Upper quartileMedian diastolic bpLow er quartile

180
Figure 12.19: Median systolic BP, by centre, HD
Median systolic blood pressure - haemodialyis by centre
120
130
140
150
160
170
180
Bris
tl
Car
ls
Cov
nt
Crd
ff
Der
by
Ext
r
Glo
uc
Guy
s
Hea
rt
Leic
LGI
Not
ts
Oxf
rd
Red
ng
SC
leve
She
ff
Sth
end
StJ
ms
Sun
d
Wol
ve
Wor
ds
York
Centre
Med
ian
syst
olic
BP
mm
Hg
1st point - 1999 2nd point - 2000 3rd point - 2001

181
Figure 12.20: Median diastolic BP, by centre, HD
Mean diastolic blood pressure by centre 1999 -2001 - haemodialysis
70
75
80
85
90
95
Bris
tl
Car
ls
Cov
nt
Crd
ff
Der
by
Ext
r
Glo
uc
Guy
s
Hea
rt
Leic
LGI
Not
ts
Oxf
rd
Red
ng
SC
leve
She
ff
Sth
end
StJ
ms
Sun
d
Wol
ve
Wor
ds
York
Centre
Mea
n di
asto
lic B
P m
mH
g
1st point - 19992nd point - 20003rd point - 2001

182
Figure 12.21: Median systolic BP, by centre, PD
Median systolic blood pressure - peritoneal dialysis by centre
120
130
140
150
160
170
180
190
200B
ristl
Car
ls
Cov
nt
Crd
ff
Der
by
Ext
r
Glo
uc
Guy
s
Hea
rt
Leic
Not
ts
Oxf
rd
Red
ng
SC
leve
She
ff
Sth
end
StJ
ms
Sun
d
Sw
nse
Wol
ve
Wor
ds
Centre
Med
ian
syst
olic
blo
od p
ress
ure
mm
/Hg 1st point - 1999
2nd point - 2000 3rd point - 2001

183
Figure 12.22: Median diastolic BP, by centre, PD
Median diastolic blood pressure - peritoneal dialysis by centre
50
60
70
80
90
100
110
120
Bris
tl
Car
ls
Cov
nt
Crd
ff
Der
by
Ext
r
Glo
uc
Guy
s
Hea
rt
Leic
Not
ts
Oxf
rd
Red
ng
SC
leve
She
ff
Sth
end
StJ
ms
Sun
d
Sw
nse
Wol
ve
Wor
ds
Centre
Med
ian
dias
tolic
blo
od p
ress
ure
mm
HG
1st point - 1999 2nd point - 2000 3rd point - 2001

184
Figures 12.19–12.21 show that, in the past 3 years, only a few centres in England & Wales have shown a significant improvement in blood pressure control. A reduction in mean systolic BP by 5 mmHg or more for HD patients has been achieved in only four centres. Mean systolic BP and diastolic BP have remained constant for PD patients over this period. A few centres show a huge variation for mean systolic BP and diastolic BP. Although part of this variance is artefactual, relating to a small number of patients, some may result from changes in practice and requires further investigation.
Individual patient variability of blood pressure in 2001
Figure 12.23: systolic BP, comparing the start and end of 2001
Figure 12.24: diastolic BP, comparison by quarter
Diastolic blood pressure (mm/Hg) Comparing start and end 2001
0
20
40
60
80
100
120
140
160
0 20 40 60 80 100 120 140 160
first quarter 2001 diastolic BP mm/Hg
End
qua
rter 2
001
dias
tolic
BP
m
m/H
g
n = 3,569
Systolic blood pressure (mm/Hg)Comparing start and end 2001
40
60
80
100
120
140
160
180
200
220
240
260
40 60 80 100 120 140 160 180 200 220 240 260
first quarter 2001 systolic BP mm/Hg
End
qua
rter 2
001
Sys
tolic
BP
mm
/Hg
n = 3,569

185
Figure 12.25: Mean arterial blood pressure (MAP)
Figure 12.26: Arterial pulse pressure, start and end of 2001 Figures 12.22–12.26 show a large degree of individual patient variability in blood pressure. Readings taken from the start of 2001 were compared with readings from the end of 2001 for each individual patient. The mean difference in blood pressure was zero for both systolic BP and diastolic BP, demonstrating no change in blood pressure control over the year.
Mean arterial blood pressure (mm/Hg)Comparing start and end 2001
0
20
40
60
80
100
120
140
160
180
0 20 40 60 80 100 120 140 160 180
first quarter 2001 MAP mm/Hg
End
qua
rter 2
001
MA
P m
m/H
g n = 3,569
Arterial pulse pressure (mm/Hg) Comparing start and end 2001
0
20
40
60
80
100
120
140
160
180
0 20 40 60 80 100 120 140 160 180
first quarter 2001 Pulse P mm/Hg
End
qua
rter 2
001
Pul
se P
mm
/Hg n = 3,569
186
Analysis of difference between pre- and post-dialysis blood pressure
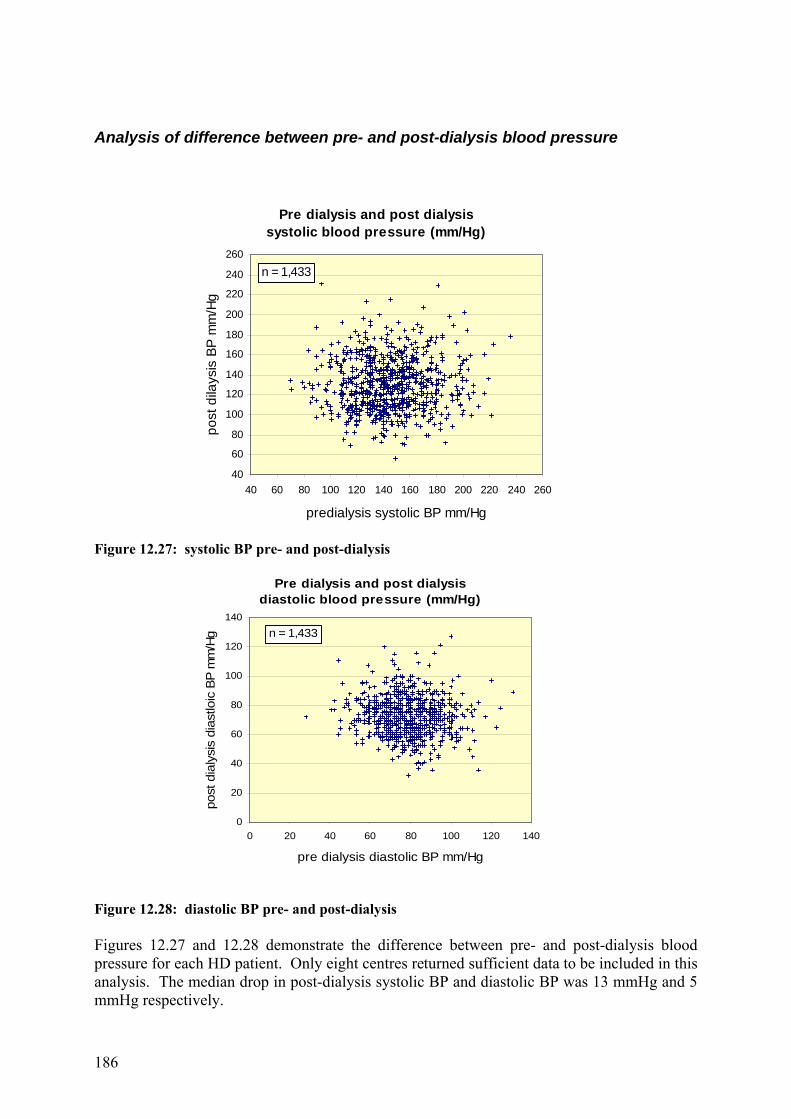
Figure 12.27: systolic BP pre- and post-dialysis
Figure 12.28: diastolic BP pre- and post-dialysis Figures 12.27 and 12.28 demonstrate the difference between pre- and post-dialysis blood pressure for each HD patient. Only eight centres returned sufficient data to be included in this analysis. The median drop in post-dialysis systolic BP and diastolic BP was 13 mmHg and 5 mmHg respectively.
Pre dialysis and post dialysis systolic blood pressure (mm/Hg)
40
60
80
100
120
140
160
180
200
220
240
260
40 60 80 100 120 140 160 180 200 220 240 260
predialysis systolic BP mm/Hg
post
dila
ysis
BP
mm
/Hg
n = 1,433
Pre dialysis and post dialysis diastolic blood pressure (mm/Hg)
0
20
40
60
80
100
120
140
0 20 40 60 80 100 120 140
pre dialysis diastolic BP mm/Hg
post
dia
lysi
s di
astlo
ic B
P m
m/H
g n = 1,433
187
Blood pressure on dialysis and patient age
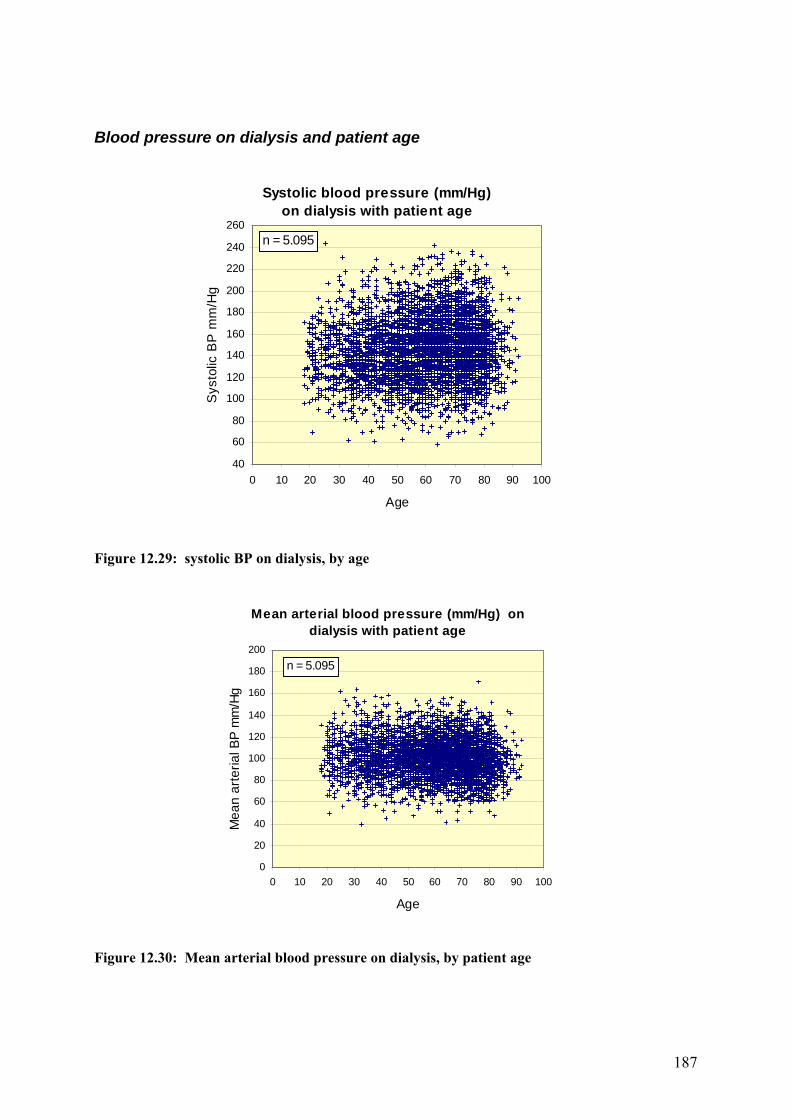
Figure 12.29: systolic BP on dialysis, by age
Figure 12.30: Mean arterial blood pressure on dialysis, by patient age
Systolic blood pressure (mm/Hg)on dialysis with patient age
40
60
80
100
120
140
160
180
200
220
240
260
0 10 20 30 40 50 60 70 80 90 100
Age
Sys
tolic
BP
mm
/Hg
n = 5.095
Mean arterial blood pressure (mm/Hg) on dialysis with patient age
0
20
40
60
80
100
120
140
160
180
200
0 10 20 30 40 50 60 70 80 90 100
Age
Mea
n ar
teria
l BP
mm
/Hg
n = 5.095

188
Figure 12.31: Arterial pressure on dialysis, by age Figures 12.29–12.31 demonstrate how blood pressure varies with age on dialysis. Median systolic BP remains at 140 mmHg throughout the 18–54-year age group but rises in those patients aged over 55 to a mean of 147 mmHg. diastolic BP shows a linear decline with age from 83 mmHg in the under-35s to 74 mmHg in patients aged over 75 years, but mean arterial pressure does not change significantly. There is a progressive, significant rise in arterial pulse pressure and its variability within the population with age. Current Standards set the arterial pulse pressure at 50 mmHg for young patients and 70 mmHg for patients 60 years or more old. The proportion of patients exceeding the Standard, and therefore the non-compliance of blood vessels, increases with age. New Renal Association blood pressure guidelines The third edition of The Renal Association Standards document has included new recommendations for blood pressure targets, which are the same in all adult age groups:
Pre-dialysis: blood pressure <140/90 mmHg Post-dialysis: blood pressure <130/80 mmHg
Post-dialysis BP should be taken after completion of dialysis, including wash back.
Peritoneal dialysis: BP <130/80 mmHg The British Hypertension Society advises how blood pressure readings should be taken. Patients should sit for 5 minutes, with the non-fistula arm supported at heart level, 30 minutes after abstention from caffeine or nicotine. Two measurements are recommended and a third if these vary significantly from each other. These conditions are probably unrealistic for most renal units. Mercury sphygmomanometers have raised environmental concerns that have led to the imposition of bans in some European countries. Although no ban has yet been imposed on the use of medical devices containing mercury in the UK, it is possible that this may change in the future. The introduction of the Control of Substances Hazardous to Health Regulations has resulted in a decline in the use of these medical devices. It is therefore recommended that consideration be given to the selection of mercury-free products when the opportunity arises.
Arterial pulse pressure (mm/Hg)on dialysis with patient age
0
20
40
60
80
100
120
140
160
180
0 10 20 30 40 50 60 70 80 90 100
Age
Puls
e pr
essu
re m
m/H
g
n = 5.095
189
For the first time, post-dialysis blood pressure has been included in the Standards. Several ambulatory blood pressure studies have shown that this correlates more closely with mean inter-dialytic ambulatory blood pressure as the blood pressure rises rapidly a few hours before dialysis.13–14 The best reading is one taken 20 minutes post-dialysis, when adaptations to the reduction in extracellular volume are complete.14 It has, however, to be acceptable to record blood pressure immediately following dialysis as it is recognised that few patients will wait 20 minutes to have their blood pressure checked. The Standards document does not qualify why blood pressure for PD patients should be equivalent to post-dialysis BP. The data from this year’s report show that these readings are comparable. For HD patients, the median drop in systolic BP and diastolic BP following dialysis was 13 mmHg and 5 mmHg respectively. This suggests that the new Standards for diastolic pressure may be difficult to achieve. The uniformity of blood pressure targets across age groups is an acknowledgement that blood pressure control benefits patients up to 80 years of age. Interestingly, a lower blood pressure target has not been set for diabetics, and international guidelines differ in their recommended targets for blood pressure in diabetics with nephropathy.15,16 Existing evidence shows a reduced incidence of cardiovascular complications when systolic BP lies in the range 120–140 mmHg and diastolic BP in the range 75–85 mmHg. Diabetics with proteinuria exceeding 1 g/day are at greatest risk, and guidelines recommend a target blood pressure of less than 125/75 mmHg for this group. Should survival rates for the diabetic dialysis patients not improve significantly with the new blood pressure Standards, a lower target blood pressure should be considered. Future directions The new blood pressure Standards will not be achieved unless there is as major change in practice among renal units in England & Wales. Antihypertensive medications alone do not adequately control blood pressure in dialysis patients. Indeed, there is a strong argument that antihypertensive medication must be discontinued so that dry weight may be achieved using ultrafiltration.17 Poor salt and water balance is undoubtedly a major contributor to poor blood pressure control in the dialysis population, yet most nephrologists are reluctant to acknowledge this. Techniques that normalise blood pressure include long slow dialysis, short daily dialysis, nocturnal HD and dietary salt and fluid restriction in combination with a low dialysate sodium concentration. Dry weight control of blood pressure not only yields short-term benefits such as increased LV ejection fraction,18 but also significantly improves long-term survival.12 In the past, data from Tassin showing improved survival associated with long, slow HD was dismissed on grounds of patient selection. More recent analysis has, however, clearly shown a survival advantage over comparable patients in the UK. Significantly, the dry weight control of blood pressure does not improve survival for diabetics or patients with severe cardiovascular disease. Adequate fluid and sodium removal to normalise blood pressure have also been shown to improve the survival of PD patients.19 There is no conclusive evidence that blood pressure control cannot be achieved with ‘conventional’ HD. Indeed, some of the centres that have improved results for blood pressure control in this year’s analysis have done so by adopting a more aggressive fluid balance policy to achieve dry weight. This has inevitably involved closer medical supervision, and it is likely this is the main reason why nephrologists have been reluctant or unable to tackle the fluid overload issue in their patients, and thus centres continue to fail to achieve blood pressure Standards. Appropriate dietary advice regarding modest sodium restriction will also be needed if patients are to comply with fluid intake restrictions.20

190
Serum cholesterol Hyperlipidaemia is common in the dialysis population, the typical pattern being raised triglycerides, low high-density lipoprotein (HDL) cholesterol and variable changes in low-density lipoprotein (LDL) and total cholesterol dependent on nutritional state and dialysis modality. An inverse or U-shaped association has been reported between cholesterol and mortality for the dialysis population in the USA21,22 and is confirmed in this report (see below). Whereas low cholesterol is a marker of chronic disease, chronic inflammation and malnutrition, hypercholesterolaemia has a similar role in the genesis of atherosclerosis as in the general population. It is therefore a major target for treatment intervention. The current Renal Standards document does not contain any recommendations on the control of serum cholesterol.
Haemodialysis
Figure 12.32: Median cholesterol against quartile ranges, HD
Figure 12.33: Cholesterol ≤ 5 mmol/L in HD patients
Median cholesterol: on haemodialysis
3
3.5
4
4.5
5
5.5
6
Derb
y
Sund
Notts
Glo
uc
Redn
g
Wre
x
Hear
t
Prst
n
Oxf
rd
LGI
Sthe
nd
Bris
tl
Trur
o
Cam
b
Guy
s
Shef
f
Plym
Wol
ve
Wor
ds
StJm
s
Crdf
f
SCle
ve
Leic
Extr
Carls
Yor
k
Ports
Stev
n
Hull
Livr
pl
Brad
f
Eng
Wls
E&W
Centre
Med
ian
chol
este
rol m
mol
/L
Upper quartileMedian Cholesterol
Low er quartile
Cholesterol < 5 mmol/L in haemodialysis patients
25
35
45
55
65
75
85
95
Glo
uc
Redn
g
Derb
y
Trur
o
LGI
Notts
Sund
Prst
n
Shef
f
Bris
tl
Oxf
rd
Sthe
nd
Carls
Wre
x
Cam
b
Swns
e
Wor
ds
Extr
Hear
t
SCle
ve
Wol
ve
Crdf
f
Leic
Ports
Plym
Yor
k
StJm
s
Guy
s
Stev
n
Livr
pl
Hull
Brad
f
Eng
Wls
E&W
Centre
Cho
l <=
5 m
mol
/L
Upper 95% Cl
%chol<=5.0
Low er 95% Cl

191
Figure 12.34: Median serum cholesterol on HD, by centre
Median serum cholesterol HD by centre
3.5
4.0
4.5
5.0
5.5
6.0B
ristl
Car
ls
Crd
ff
Der
by
Ext
r
Glo
uc
Guy
s
Hea
rt
Hul
l
Leic
LGI
Not
ts
Oxf
rd
Prs
tn
Red
ng
SC
leve
She
ff
Sth
end
StJ
ms
Sun
d
Sw
nse
Wol
ve
Wor
ds
Wre
x
York
Centre
Mea
n ch
oles
tero
l mm
ol/L
1st point - 19992nd point - 2000 3rd point - 2001

192
Peritoneal dialysis Figures 12.31–12.33 show cholesterol data for HD patients. The median cholesterol level is 4.4 mmol/L, and the percentage of patients achieving a cholesterol level of 5 mmol/L or less averages 73% (range 47–86%). Chi squared testing indicates that these variations are significant between centres (p<.001). Figure 12.37, showing the 3 year serial mean cholesterol level by centre, indicates that centres with the highest cholesterol levels have achieved the most marked improvements initially.
Figure 12.35: Median cholesterol in PD
Figure 12.36: Percentage cholesterol ≤ 5 mmol/L in PD patients
Median cholesterol on peritoneal dialysis
3
3.5
4
4.5
5
5.5
6
6.5
7
Wre
x St
hend
Y
ork
Redn
g Ca
mb
Prst
n W
ords
O
xfrd
Derb
y Tr
uro
Leic
Glo
uc
Guy
s Sh
eff
Plym
He
art
Carls
Br
istl
Extr
Wol
ve
LGI
Crdf
f
Notts
St
evn
Ports
StJm
s Br
adf
Hull
SCle
ve
Sund
Eng
Wls
E&
W
Centre
Med
ian
chol
este
rol m
mol
/L
Upper quartileMedian CholesterolLower quartile
Percentage cholesterol <= 5 mmol/L in peritoneal dialysis patients
0
20
40
60
80
100
Wre
x St
hend
Re
dng
Yor
k Sw
nse
Oxf
rd
Cam
b He
art
Shef
f W
ords
G
uys
Carls
Pl
ym
Trur
o De
rby
Prst
n LG
I W
olve
Le
ic
Extr
Crdf
f Br
istl
Glo
uc
Notts
St
evn
Ports
St
Jms
Brad
f Su
nd
Hull
SCle
ve
Eng
Wls
E&W
Centre
% C
hol <
= 5
mm
ol/L
Upper 95% Cl% with cholesterol <= 5.0Lower 95% Cl

193
Figure 12.37: Median serum cholesterol, 1999–2001, PD
Median serum cholesterol PD by centre
3.5
4.0
4.5
5.0
5.5
6.0
6.5
Bris
tl
Car
ls
Car
sh
Crd
ff
Der
by
Ext
r
Glo
uc
Guy
s
Hea
rt
Hul
l
Leic
LGI
Not
ts
Oxf
rd
Prs
tn
Red
ng
SC
leve
She
ff
Sth
end
StJ
ms
Sun
d
Sw
nse
Wol
ve
Wor
ds
Wre
x
York
Centre
Med
ian
chol
este
rol m
mol
/L
1st point - 19992nd point - 20003rd point - 2001

194
Figures 12.34–12.36 show cholesterol data for PD patients, the median cholesterol level being 4.9 mmol/L. The percentage of patients achieving a cholesterol level of 5 mmol/L or less averages 56% (range 30–72%). Chi squared testing indicates that these variations are significant between centres. The data show significantly higher cholesterol levels in PD patients and significantly fewer achieving a cholesterol level below 5 mmol/L, compared with HD patients. Serial mean cholesterol levels by PD centre again indicate that centres with the highest cholesterol levels have achieved the most marked improvements initially. Serum cholesterol and survival on dialysis
Figure 12.38: Serum cholesterol on dialysis Figure 12.38 shows a U-shaped association between cholesterol level and mortality for the dialysis population in England & Wales over the 1 year period 1999–2000. Short-term survival is optimal for patients with a serum cholesterol level of 5–8 mmol/L, presumably because this reflects good nutrition. Long-term survival data are not currently available. The new Standards will require centres to collect information in such a way that it will be possible in future to audit serum cholesterol against risk for cardiovascular death. New Renal Association cholesterol guidelines The third edition of The Renal Association Standards document has included new recommendations for cholesterol targets.
Primary prevention Start an HMG-CoA reductase inhibitor if the 10 year risk of coronary disease is over 30% (this is calculated according to the Joint British Societies Chart of the Coronary Risk Calculator).
Serum cholesterol on dialysis 1999 and relative hazard of death in 2000
-0.50
0.51
1.52
2.53
3.5
0 1 2 3 4 5 6 7 8 9 10 11 12 13 14 15
Serum cholesterol mmol/L
Rel
ative
haz
ard

195
Aim to achieve a total cholesterol of less than 5 mmol/L or a fasting LDL cholesterol of below 3 mmol/L. To calculate cardiovascular risk, renal units will need to record on their databases smoking, family history of premature vascular disease (males <55 years and women <65 years), blood pressure, total and HDL cholesterol levels, diabetes, age and sex.
Secondary prevention Start an HMG-CoA reductase inhibitor if there is a history of myocardial infarction, stroke, peripheral vascular disease, acute coronary syndrome or a revascularisation procedure (surgical or angiographic). Aim to achieve a total cholesterol concentration of less than 5 mmol/L, or reduction in its value by 30%, or a fasting LDL cholesterol of below 3 mmol/L. To audit this effectively, renal units will need to record on their databases symptoms of vascular disease and vascular events so that such patients can be identified. European guidelines suggest that lipids should be measured at the initiation of dialysis, 3 months later and 6 monthly thereafter.23 Blood should be drawn immediately before a regularly scheduled HD treatment or at least 12 hours after, preferably with the patient in a fasting state. It is acknowledged that the coronary risk calculator underestimates the risk for patients with renal dysfunction and diabetics. Few renal units will currently be performing the appropriate level of screening for hyperlipidaemia and treatment monitoring, as laid down by European guidelines. Taking a progressive, staged approach to coronary prevention with the new Standards ensures that those at highest risk are targeted first. Continuing audit is needed to determine whether the current level of medical care is able to identify, treat and monitor patients appropriately and establish whether all dialysis patients indeed carry a high risk. Clinical trial of cholesterol-lowering in chronic renal failure The UK Heart and Renal Protection pilot study was designed to assess the safety and efficacy of simvastatin in patients with chronic renal failure. Total cholesterol was reduced by 20%, LDL cholesterol by 26% and triglycerides by 13%, but there was no significant effect on HDL cholesterol.24 A large-scale international randomised trial (Study of Heart and Renal Protection) is planned; this will assess the impact of lowering cholesterol on major vascular outcomes and on the progression of renal disease among patients with chronic kidney disease. A combination of simvastatin and ezetimibe, a novel cholesterol absorption inhibitor, will be used. Interested centres should contact the Clinical Trials Support Unit in Oxford on (01865) 404846.
196
References 1. Causes of death. USRDS. United States Renal Data System. Am J Kidney Dis
1997;30:S107–S117 (C). 2. The USRDS Dialysis Morbidity and Mortality Study: wave 2. United States Renal
Data System. Am J Kidney Dis 1997;30:S67–S85 (C). 3. Foley RN, Parfrey PS, Sarnak MJ. Clinical epidemiology of cardiovascular disease in
chronic renal disease. Am J Kidney Dis 1998;32:S112–S119 (B). 4. Zager PG, Nikolic J, Brown RH, et al. ‘U’ curve association of blood pressure and
mortality in haemodialysis patients. Kidney Int 1998;54:561–9. 5. Foley RN, Parfrey PS, Harnett JD, et al. Clinical and echocardiographic disease in
patients starting end-stage renal disease therapy. Kidney Int 1995;47:186–92. 6. Parfrey PS, Foley RN, Harnett JD, et al. Outcome and risk factors for left ventricular
disorders in chronic uraemia. Nephrol Dial Transplant 1996;11:1277–85. 7. Harnett JD, Foley RN, Kent GM, et al. Congestive heart failure in dialysis patients:
prevalence, incidence, prognosis and risk factors. Kidney Int 1995;47:884–90. 8. Klassen PS, Lowrie EG, Reddan DN, et al. Association between pulse pressure and
mortality in patients undergoing maintenance hemodialysis. JAMA 2002;287:1548–55. 9. Staessen JA, Gasowski J, Wang JG, et al. Risks of untreated and treated isolated
systolic hypertension in the elderly: meta-analysis of outcome trials. Lancet 2000;355:865–72.
10. Charra B, Calemard E, Ruffet M, et al. Survival as an index of adequacy of dialysis. Kidney Int 1992;41:1286–91.
11. Adler A, Stratton IM, Neil HA, et al. Association of systolic blood pressure with macrovascular and microvascular complications of type 2 diabetes (UKPDS 36): prospective observational study. UK Prospective Diabetes Study Group. BMJ 2000;321:405–12.
12. Innes A, Charra B, Burden RP, et al. The effect of long, slow haemodialysis on patient survival. Nephrol Dial Transplant 1999;14:919–22.
13. Kooman JP, Gladziwa U, Böcker G, et al. Blood pressure during the interdialytic period in haemodialysis patients: estimation of representative blood pressure values. Nephrol Dial Transplant 1992;7:917–23.
14. Mitra S, Chandra SM, Farrington K. What is hypertension in chronic haemodialysis? The role of interdialytic blood pressure monitoring. Nephrol Dial Transplant 1999;14:2915–21.
15. British Hypertension Society. Guidelines for the management of hypertension: report of the third working party of the British Hypertension Society. J Hum Hypertens 1999;13:569–92.
16. Joint British recommendations on prevention of coronary heart disease in clinical practice. Heart 1998; 80(suppl 2):S1–S29.
17. Scribner BH. Can antihypertensive medications control BP in haemodialysis patients: yes or no? Nephrol Dial Transplant 1999;14:2599–601.
18. Chan C, Floras JS, Miller JA, et al. Improvement in ejection fraction by nocturnal haemodialysis in end-stage renal failure patients with coexisting heart failure. Nephrol Dial Transplant 2002;17:1518–21.
19. Ates K, Nergizoglu G, Keven K, et al. Effect of fluid and sodium removal on mortality in peritoneal dialysis patients. Kidney Int 2001;60:767–76.

197
20. Tomson CRV. Advising dialysis patients to restrict fluid intake without restricting sodium intake is not based on evidence and is a waste of time. Nephrol Dial Transplant 2001;16:1538–42.
21. Pollock CA, Ibels LS, Caterson RJ, et al. Continuous ambulatory peritoneal dialysis. Eight years of experience at a single centre. Medicine 1989;68:293–308.
22. Lowrie EG, Lew NL. Death risk in haemodialysis patients: the predictive value of commonly measured variables and an evaluation of death rate differences between facilities. Am J Kidney Dis 1990; 15:458-482.
23. Nephrol Dial Transplant 2002; 17(Supplement 7):88-109. 24. Baigent C, the UK-HARP Steering Committee. Efficacy and safety of simvastatin and
safety of low-dose aspirin among patients with chronic kidney disease: final results of the first UK-Heart and Renal Protection (UK-HARP-I) study. JASN 2002;13:437A (Abstract SA-P0841).