chapter 11 retinal thermal damage and ocular motion
TRANSCRIPT

219
Retinal Thermal Damage and Ocular Motion
Chapter 11
RETINAL THERMAL DAMAGE AND OCULAR MOTION
BRIAN J. LUND, PhD*
INTRODUCTION
NATURE OF EYE MOVEMENTS DURING STEADY GAZE
EYE MOVEMENT PATTERN DURING FIXATION ON A LASER SOURCE Measurements at the US Army Medical Research DetachmentEye Movement PlotsFixation Ellipse: Measure of the Extent of the Eye Movement PatternDiode Study: Growth of Fixation Ellipse, Effect of WavelengthLaser Study: Intensity Effect
DISTRIBUTION OF ENERGY AT THE RETINA: RETINAL RADIANT EXPOSURE PATTERN
RETINAL HEATING DURING FIXATION ON A LASER SOURCEModeling the Retinal Heating Pattern: The RHME (Retinal Heating, Moving Eye)
ProgramSimulation Results: A Look at Retinal Heating During a Long-Duration Exposure
ESTIMATING THERMAL DAMAGE THRESHOLDS FROM SIMULATION RESULTS
SUMMARY
*Research Physicist, Ocular Trauma, US Army Institute of Surgical Research, 3698 Chambers Pass, Joint Base San Antonio, Fort Sam Houston, Texas 78234-7767

220
Biomedical Implications of Military Laser Exposure
INTRODUCTION
a long-duration laser exposure. It will begin with a brief description of the nature of small-scale eye movements, followed by a discussion of experiments to record eye movements that occur during deliberate fixation on a laser source. The retinal radiant exposure pattern is examined. Taking eye movement data as input, a computer simulation is used to study the nature of the heating pattern in the retina during a long-duration laser exposure. An Arrhenius integral damage model is used in conjunction with the results of the computer simulation to estimate the thermal damage threshold for a moving eye. Although the dependence of the damage threshold on the beam spot size is an important topic of current research, this chapter will focus on small-beam spot sizes expected from a laser exposure.
The human eye is never completely stationary. There are always some small-scale movements present, even when an individual is fixing his or her gaze on a small, well-defined target.1,2 These movements are of interest to the laser bioeffects research community because they impact the distribution of energy depos-ited in the retina during a long-duration exposure (eg, >100 ms) to a laser beam.
The guidelines for safe ocular exposure to lasers, expressed as maximum permissible exposure (MPE) limits, are based on damage threshold (ED50) data obtained using anesthetized animals. The eyes of the test animals are artificially immobilized to control the location of the retina exposed to the laser beam. How-ever, in an alert subject, the image of the beam moves about an extended region of the retina in response to eye movements. This means that energy from the laser is deposited in a region of the retina that is larger than the diameter of the beam, and the peak of the deposited energy distribution (radiant exposure distribution) will be less than would be experienced in a stationary eye.
The motion of the eye can also lead to a complex heating pattern in the retina. A particular location in the retina that is being directly irradiated by light from the laser will absorb energy from the beam and be heated. If an eye movement causes the laser spot to move away from this retinal location, it will have an opportunity to cool.
For short, single-pulse exposures, the eye may be treated as a stationary platform. But, for longer-duration exposures to continuous-wave (CW) lasers, ignoring the effects of eye movements may lead to an overly pessimistic assessment of damage probability and unnecessarily restrictive safety limits. Indeed, eye movement measurements performed at the US Army Medical Research Detachment (USAMRD) of the Walter Reed Army Institute of Research3 played an important role in the decision to increase the MPE levels in 20004,5 (Figure 11-1).
This chapter describes a research program con-ducted to investigate eye movements as a mitigating factor in preventing the onset of thermal damage from
10-7
10-6
10-5
10-4
10-3
10-2
400 450 500 550 600 650 700
MPE in 1993
MPE since 2000
Wavelength (nm)
EC (
W c
m-2)
Figure 11-1. Change in the maximum permissible exposure (MPE) for long-duration (>104 s) viewing of a continuous-wave laser source (from the American National Standards Institute [ANSI] Z136.1). The MPE is expressed as irradiance at the cornea, EC. Data sources: American National Standards Institute (ANSI). Safe Use of Lasers, Standard Z136.1. Orlando, FL: Laser Insti-tute of America; 1993 & 2000.
NATURE OF EYE MOVEMENTS DURING STEADY GAZE
tem, particularly how a stable gaze was obtained and subsequently maintained. In this chapter, eye move-ments are of interest because they cause the beam spot (during a long-duration laser exposure) to move about an extended region of the retina. The resulting heating pattern will be different from the pattern expected in a stationary eye, leading to (perhaps) a lower risk for a thermal injury to occur.
The movement pattern of the eye during steady gaze has been of considerable interest to vision researchers since the 1950s, when the first accurate recordings with high enough resolution to characterize the spatial and temporal natures of the movements became available (see Ditchburn,1 Kowler,2 and references therein). Data from these measurements were used in developing and assessing models of the human visual processing sys-

221
Retinal Thermal Damage and Ocular Motion
The motion of the eye during steady gaze is com-plex and nondeterministic.1 Kinematically, the eye is described by its orientation in space, and by the direc-tion and speed of its motion. Knowledge of the current state of the eye cannot be used to predict its state at a future time in anything other than a statistical sense. However, measurements of eye motion reveal the oc-currence of several typical patterns. These patterns al-low us to describe eye movements as they occur during a fixation task using three general classes of motion1,2: (1) drifts, (2) saccades, and (3) tremors.
Drifts are periods of fairly slow movement, in which the center of the gaze slowly shifts on average by about 2.5 min of arc (0.73 mrad). Using an effective focal length of the human eye of fe = 17 mm, such a rotation will move an image a distance of 12.4 µm on the retina. The speed of these drifts is usually in the range of 2 to 8 min of arc per second (0.58 to 2.3 mrad per second).
Saccades, or flicks, are sharp movements, usually of several minutes of arc, occurring over a few tens of milliseconds. The displacement caused by an in-voluntary saccade during fixation is usually <10 min of arc (2.9 mrad or 49 µm on the retina) and rarely >30 min (8.7 mrad, 148 µm on the retina). Saccades
are observed to occur at intervals ranging from about 0.2 s to several seconds, with a mean frequency of 1.6 per second.
Superimposed on the other movements are high-frequency oscillations known as tremors. Tremors have characteristics reminiscent of random noise. The peak-to-peak amplitude of the oscillations is generally well under 1 min of arc (0.29 mrad), with frequencies typically in the range of 30 to 80 Hz.
For most individuals, movement of the eye during steady gaze can generally be described by this drift, flick, drift, flick pattern, with a tremor superimposed. However, the frequency and size of flicks, and the dura-tion of the drift periods between flicks, can vary signifi-cantly from person to person. Researchers studying eye movements and their contribution to visual function are often interested in the detailed description of the eye movements. This will often take the form of a Fourier analysis of one or more components of the motion (see, eg, Eizenman et al6). However, such a detailed descrip-tion is not necessary to gain an understanding of eye movement effects during long-duration laser exposure. Here, a simpler measure, the fixation ellipse, will be used to characterize the extent of the eye movement pattern.
EYE MOVEMENT PATTERN DURING FIXATION ON A LASER SOURCE
Measurements at the US Army Medical Research Detachment
Two experiments were performed at USAMRD to gather data needed to assess the effect of eye move-ments on retinal radiant exposure distributions and heating patterns during laser exposure.3,7 A dual Pur-kinje image (DPI) eye tracker8 was used to record high spatial and temporal resolution measurements of eye movements during fixation. In both experiments, the extent of the fixation target in the visual field was kept much smaller than the minimum angular subtense, αmin = 1.5 mrad, defined in the current safety guidelines.4,5 The fixation targets in both studies could therefore be treated as small (vs extended) sources.
The experiment of Ness et al3 used light-emitting diodes to produce the fixation targets. Diodes of various peak wavelengths (420, 527, and 662 nm) were used, ad-justed to have similar luminance values. These sources were very dim, producing corneal irradiance values <1 pW cm–2. The trials lasted 100 s, and measurements were made with the subjects’ heads held steady using a head and chin rest combination. Data were also collected without the use of the head and chin rest, allowing subjects some limited range of movement. The result from this experiment was a key factor in the decision to increase the MPE for long-duration exposures to CW laser sources by an order of magnitude (see Figure 11-1).
Lasers easily available to the public are capable of producing much more intense beams than the LEDs (light-emitting diodes) used by Ness et al.3 Lund et al7 extended the study to higher irradiance values by using a helium-neon (HeNe; λ = 632.8 nm) CW laser to produce the fixation target. Fixation sources cover-ing eight orders of magnitude were used, producing corneal irradiance values from 0.6 pW cm–2 (very dim) to 6 µm cm–2 (very bright). Trials lasted 50 s, and a head and chin rest combination was used in all cases.
It should be noted that a subject deliberately staring into a laser beam while his or her head is held steady represents the worst-case scenario from a laser safety perspective. Although head-held steady viewing is unlikely to occur during any individual’s normal daily routine, it is a scenario that occurs commonly in experi-mental and clinical environments, where control over the exposure site or a steady view of the eye is needed.
Eye Movement Plots
Eye movement data were analyzed and interpreted in terms of the location of the image of the fixation target on the retina and the pattern “painted” by the image as it moves about the retina due to eye movements. The relative position of the image on the retina was derived from the orientation of the eye (as recorded by the DPI eye tracker) using an effective focal length for the optics

222
Biomedical Implications of Military Laser Exposure
of the human eye of fe = 17 mm. (Using this value, 1 de-gree in the field of view corresponds to 297 µm on the retina.) Because it was not possible to view the interior of the eye during these experiments, the absolute location of the image of the fixation target on the retina could not be precisely determined. However, studies using a scanning laser ophthalmoscope have shown that the image will be located within the fovea during a fixation task.9 Therefore, it is assumed that the eye movement patterns recorded in the fixation studies are centered in the middle of the fovea at the onset of the trial.
Eye movement patterns are conveniently visualized using visitation time contour plots.1 These plots show the cumulative time the location of the image was cen-tered, for example, on a particular 10 µm × 10 µm area of the retina. The exact details of the eye movements are lost in this representation, but the overall extent and tightness of the fixation pattern are readily apparent.
A few samples of the eye movement patterns re-corded in the fixation studies are shown in Figure 11-2. These data are from the study by Lund et al,7 in which a HeNe laser was used to produce the fixation target. The corneal irradiance experienced by the subjects for each of these movement plots is listed in Table 11-1. For a stationary eye, the visitation time plot is a delta func-tion (ie, a dot in the center of the plots). The maximum value of the visitation time plot for each of the moving eyes is a small fraction of the total duration of the trial.
The overall extent of the movement patterns clearly varies across individual subjects. The narrowest pat-tern covered 150 to 200 µm on the retina (one-half to two-thirds of a degree in the visual field). The broader patterns extended across 500 to 600 µm (nearly two degrees in the visual field). All of the movement pat-terns were concentrated in a limited region about the center of the pattern, although subject 6 (see Figure 11-2) exhibited an unusually pronounced nasal/tem-poral extent to the central peak. As expected, the nar-rower pattern had a higher peak visitation time value
Figure 11-2. Eye movement visitation plots, illustrating the extent of eye movements during the fixation task. Color indicates visitation time at each point; scales are to the right of each plot. The fixation ellipses derived from the data are noted in white on each figure. Minimum contour in these plots = 0.001 s. Note that the time scales are different for each plot. 300 mm on the retina corresponds to ~1° in the field of view. (Top) Subject 1: fixate for 50 s on the helium-neon source producing a corneal irradiance of 0.6 pW cm–2. (Middle) Subject 4: 50 s, 60 pW cm–2. (Bottom) Subject 6: 45 s, 6 µW cm–2. Data source: Adapted from Lund BJ, Zwick H, Lund DJ, Stuck BE. Effect of source intensity on ability to fixate: im-plications for laser safety. Health Phys. 2003;85(5):567–577. -300
-200
-100
0
100
200
300
Su
per
ior/
Infe
rio
r (m
)
10-3
10-2
10-1
100
Tim
e (s
)
-300
-200
-100
0
100
200
300
Su
per
ior/
Infe
rio
r (m
)
10-3
10-2
10-1
100
Tim
e (s
)
Subject 1
tmax = 1.58 s
Subject 4
tmax = 2.75 s
-300 -200 -100 0 100 200 300Nasal/Temporal (µm)
-300 -200 -100 0 100 200 300Nasal/Temporal (µm)
-300 -200 -100 0 100 200 300Nasal/Temporal (µm)
Subject 6
tmax = 1.07 s-300
-200
-100
0
100
200
300
Su
per
ior/
Infe
rio
r (m
)
10-3
10-2
10-1
100
Tim
e (s
)
compared to the broader patterns (see Table 11-1). Theses peak values were far less than the duration of the fixation trials.

223
Retinal Thermal Damage and Ocular Motion
This brief examination of the eye movement patterns indicates that, during a long-duration laser exposure, the beam spot will move about an extended region of the retina. However, it is confined to a limited area most of the time. A primary goal of this research is to assess how much difference this makes in the retinal heating pattern and thus in the risk of thermal damage from a long-duration exposure.
Fixation Ellipse: Measure of the Extent of the Eye Movement Pattern
Although the detailed nature of eye movements can be quite complex, it is the physical extent of the movement pattern that is of primary interest to un-derstanding long-duration exposure damage mecha-nisms. The pattern of eye movements during fixation is characterized by an ellipse centered at the means and of the recorded nasal/temporal and superior/inferior retinal position measurements. The axes of the “fixation ellipse” are determined by the standard deviations and of the data. (This is a variation of the bivariate contour ellipse concept introduced by Nachmias.10) The ellipse, therefore, represents an area containing roughly 68% of the data (ie, the center of the image of the fixation target was located within this area of the retina for 68% of the trial duration). The area of the ellipse, A = πσH σV, is used as a measure of the “tightness of fixation” of the eye movements. Alternatively, it gives a measure of how large an area on the retina receives significant direct irradiation from a laser beam during a long-duration exposure.
The fixation ellipse is not a perfect representation of the eye movement pattern in all cases. However, it is easy to calculate from the data and has a readily understood geometrical interpretation that is directly pertinent to laser bioeffects issues of interest. (Certainly more so than, for example, a Fourier analysis of the
movement data, or a breakdown of saccade frequency.)Fixation ellipses are included on the eye move-
ment patterns plotted in Figure 11-2. The dimensions and areas of the ellipses are listed in Table 11-1. Note that the extent of the ellipses ( or ) are all larger than 25 µm, which is the diameter of a beam spot cor-responding to the minimal angular subtense αmin. This indicates that the eye movement will indeed be an important consideration for direct viewing of a laser beam, where retinal spot size is expected to be minimal.
Diode Study: Growth of Fixation Ellipse, Effect of Wavelength
Ness et al3 measured the growth in the area of the fixation ellipse during a fixation trial. The area of the
TABLE 11-1
PARAMETERS FOR THE EYE-MOVEMENT PATTERNS OF FIGURE 11-2
Fixation Ellipse
Movement Data Trial Duration (s) Corneal Irradiance Peak Visitation Time (s) σH (µm) σV (µm) Area (µm2)
Stationary 50 — 50 0 0 0Subject 1 50 0.6 pW cm–2 1.581 (0.03)* 43.5 47.9 6,546Subject 4 50 60 pW cm–2 2.871 (0.06)* 21.5 12.4 838Subject 6 45 6 µW cm–2 1.071 (0.02)*,† 59.0 21.7 4,022
*Value in parentheses is ratio to value for the stationary eye.†Stationary eye data scaled to a 45-s trial for comparison with subject 6.
Figure 11-3. Growth in the area of the fixation ellipse during a fixation trial. The fixation target is a light-emitting diode producing a corneal irradiance of <1 pW cm–2. Data set is the average of six subjects. Data source: Adapted from Lund BJ, Zwick H, Lund DJ, Stuck BE. Effect of source intensity on ability to fixate: im-plications for laser safety. Health Phys. 2003;85(5):567–577.
0
5,000
10,000
15,000
20,000
25,000
0 20 40 60 80 100
Unconstrained
Constrained
Are
a (µ
m2 )
Time (s)

224
Biomedical Implications of Military Laser Exposure
fixation ellipse as a function of time during the trial is illustrated in Figure 11-3. The fixation target for this experiment was a light-emitting diode (LED) producing a corneal irradiance <1 pW cm–2, a very dim target. Figure 11-3 is the average for six subjects performing the fixation task. This figure includes data from measurements in which the subjects’ heads were constrained using a head and chin rest combination. Measurements taken without the head and chin rest are also included. This unconstrained experimental condition allowed the subject some range of head and body movement; however, the individual had to remain fairly steady in order to allow the DPI eye tracker to maintain a lock on the subject’s eye. Not surprisingly, the ellipse area was larger when the head was allowed some freedom of movement. However, the ratio of the area of the ellipse in the constrained and unconstrained condi-tions stayed within a relatively narrow range.
Diodes of various peak wavelengths were used (420 nm, blue; 527 nm, green; and 662 nm, red). However, the area of the fixation ellipse showed no dependence on wavelength. The color of the stimu-lus had no apparent effect on the nature of the eye movement pattern.
Laser Study: Intensity Effect
The diode study indicated that the eye movement patterns were large enough to warrant a significant increase in the long-duration exposure MPE levels for CW lasers (see Figure 11-1). Additional data were needed to investigate whether the eye movement patterns would be different in response to a brighter stimulus more representative of visible laser light.
Lund et al7 extended the study to higher irradiance values by using a HeNe laser to produce the fixation target. Fixation sources with corneal irradiance values from 0.6 pW cm–2 to 6 µW cm–2 (covering eight orders of magnitude) were used. The results of this study are summarized in Figure 11-4, in which the area of the fixation ellipse after a 50-s trial is plotted against the source corneal irradiance. Data represent the average of two or three trials at each source strength. There is clearly a variation across individual subjects. However, over the eight orders of magnitude in stimulus inten-sity used in this study, none of the subjects exhibited a variation in the area of the fixation ellipse as large as one order of magnitude. In fact, data indicate no statistically significant trend in the area of the fixation ellipse as a function of the source intensity. Although the brightest source used herein was uncomfortable
to view, none of the subjects refused to perform the fixation task, nor was there any breakdown in their ability to fixate on the source.
The average fixation ellipse area for all of the data included in Figure 11-4 is 3,654 µm2 or a typical diam-eter of about 68 µm. The fovea of the human eye has a diameter of about 200 µm, corresponding to a circle with an area >30,000 µm2.
The maximum corneal irradiance value used was limited by the current safety guidelines in effect at the time this experiment was proposed.11 In the current standards,4,5 the MPE for a long-duration exposure to visible wavelengths is 1 mW cm–2 for a small-beam spot. This is more than two orders of magnitude greater than the most intense source used in the laser fixation study (corneal irradiance of 6 µW cm–2). It is possible that more intense sources would produce a high enough level of discomfort that an individual would be unable to maintain a steady fixation on the source. An increase in the extent of the movement pattern, as measured by the fixation ellipse, could occur as the individual fights against the desire to look away from the source of dis-comfort. Perhaps the more likely response would be a dramatic increase in the frequency of blinking or an outright refusal to perform the fixation task.
101
102
103
104
105
10-13 10-12 10-11 10-10 10-9 10-8 10-7 10-6 10-5
Corneal Irradiance (W cm-2)
Subject 1Subject 2Subject 3Subject 4
Subject 5Subject 6Subject 7Average
Are
a (µ
m2 )
Figure 11-4. Areas of the fixation ellipse after staring at the sources for 50 s as a function of the source corneal irradiance for each of the seven volunteers used in the study by Lund et al. Examples of the fixation ellipse are shown in Figure 11-2. Each data point is the average of two or three trial runs at the irradiance level, except for subject 6 at 6 nW cm2, for which only one measurement was available. The average of the data from all subjects is also plotted.Data source: Adapted from Lund BJ, Zwick H, Lund DJ, Stuck BE. Effect of source intensity on ability to fixate: im-plications for laser safety. Health Phys. 2003;85(5):567–577.

225
Retinal Thermal Damage and Ocular Motion
DISTRIBUTION OF ENERGY AT THE RETINA: RETINAL RADIANT EXPOSURE PATTERN
from the eye movement plots. If is the cumula-tive visitation time at the point on the retina, and
is the irradiance profile of the beam incident on the retina, then the radiant exposure experienced at the point is given by the two-dimensional convolution integral:
During exposures to shorter-wavelength light (λ < 540 nm), damage is induced predominantly through a photochemical process.12 In such a process, a constant energy dose (retinal radiant exposure) is required to elicit a damage response. The radiant ex-posure pattern received at the retina can be calculated
-400 -300 -200 -100 0 100 200 300 400-400
-300
-200
-100
0
100
200
300
400
10-3
10-2
10-1
100
101
102
103
J cm
-2
J cm
-2
J cm
-2
J cm
-2
Stationary eye
-400 -300 -200 -100 0 100 200 300 400-400
-300
-200
-100
0
100
200
300
400
10-3
10-2
10-1
100
101
102
103Subject 1
-400 -300 -200 -100 0 100 200 300 400
Nasal/Temporal (µm) Nasal/Temporal (µm)
Nasal/Temporal (µm) Nasal/Temporal (µm)
-400
-300
-200
-100
0
100
200
300
400
10-3
10-2
10-1
100
101
102
103Subject 4
-400 -300 -200 -100 0 100 200 300 400-400
-300
-200
-100
0
100
200
300
400
Su
per
ior/
Infe
rio
r (µ
m)
Su
per
ior/
Infe
rio
r (µ
m)
Su
per
ior/
Infe
rio
r (µ
m)
Su
per
ior/
Infe
rio
r (µ
m)
10-3
10-2
10-1
100
101
102
103Subject 6
Figure 11-5. Small-beam spot retinal radiant exposure distribution calculated from the eye movement data shown in Figure 11-2. Color indicates radiant exposure at each point; scales are to the right of each plot. Minimal contours represent 1% of the peak value. Calculations are for an exposure to a helium-neon laser (λ = 632.8 nm) producing a corneal irradiance of 1 mW cm–2. The power of the beam at the retina is P = 250 µW (see text). The beam is assumed to have a Gaussian irradiance profile with a 1/e diameter of 25 µm. This diameter is smaller than the size of the fixation ellipses (see Table 11-1). In this case, there is a significant reduction in the peak radiant exposure in the moving eyes compared to a stationary eye.Data source: Adapted from Lund BJ, Zwick H, Lund DJ, Stuck BE. Effect of source intensity on ability to fixate: implications for laser safety. Health Phys. 2003;85(5):567–577.
226
Biomedical Implications of Military Laser Exposure
(1)
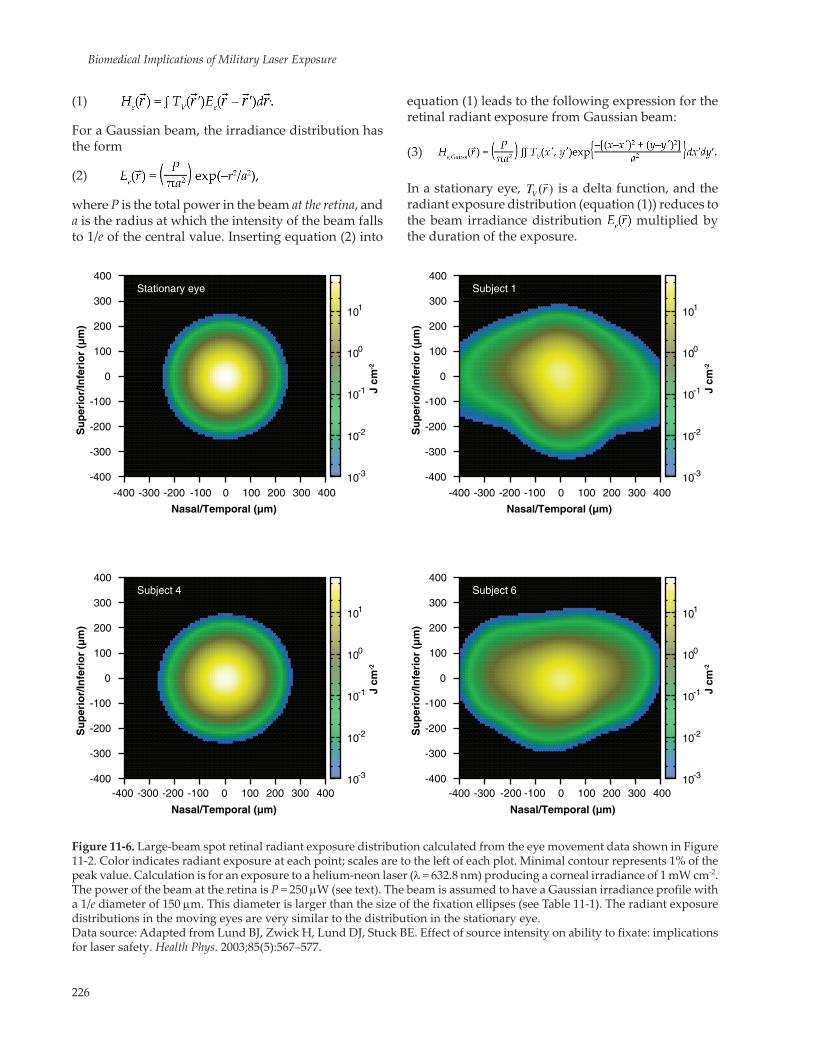
For a Gaussian beam, the irradiance distribution has the form
(2)
where P is the total power in the beam at the retina, and a is the radius at which the intensity of the beam falls to 1/e of the central value. Inserting equation (2) into
the beam irradiance distribution multiplied by the duration of the exposure.
Figure 11-6. Large-beam spot retinal radiant exposure distribution calculated from the eye movement data shown in Figure 11-2. Color indicates radiant exposure at each point; scales are to the left of each plot. Minimal contour represents 1% of the peak value. Calculation is for an exposure to a helium-neon laser (λ = 632.8 nm) producing a corneal irradiance of 1 mW cm-2. The power of the beam at the retina is P = 250 µW (see text). The beam is assumed to have a Gaussian irradiance profile with a 1/e diameter of 150 µm. This diameter is larger than the size of the fixation ellipses (see Table 11-1). The radiant exposure distributions in the moving eyes are very similar to the distribution in the stationary eye. Data source: Adapted from Lund BJ, Zwick H, Lund DJ, Stuck BE. Effect of source intensity on ability to fixate: implications for laser safety. Health Phys. 2003;85(5):567–577.
equation (1) leads to the following expression for the retinal radiant exposure from Gaussian beam:
(3)
In a stationary eye, is a delta function, and the radiant exposure distribution (equation (1)) reduces to
-400 -300 -200 -100 0 100 200 300 400
-400
-300
-200
-100
0
100
200
300
400
10-3
10-2
10-1
100
101
Stationary eye
-400 -300 -200 -100 0 100 200 300 400
-400
-300
-200
-100
0
100
200
300
400
10-3
10-2
10-1
100
101
Subject 1
-400 -300 -200 -100 0 100 200 300 400-400
-300
-200
-100
0
100
200
300
400
10-3
10-2
10-1
100
101
Subject 4
-400 -300 -200 -100 0 100 200 300 400-400
-300
-200
-100
0
100
200
300
400
10-3
10-2
10-1
100
101
Subject 6
Nasal/Temporal (µm) Nasal/Temporal (µm)
J cm
-2
Su
per
ior/
Infe
rio
r (µ
m)
J cm
-2
Su
per
ior/
Infe
rio
r (µ
m)
Nasal/Temporal (µm)
J cm
-2
Su
per
ior/
Infe
rio
r (µ
m)
Nasal/Temporal (µm)
J cm
-2
Su
per
ior/
Infe
rio
r (µ
m)

227
Retinal Thermal Damage and Ocular Motion
Examples of the retinal radiant exposure patterns calculated from eye movement plots are shown in Figures 11-5 and 11-6. These figures were calculated for an MPE-level exposure to light from a HeNe la-ser. The current MPE for a long-duration exposure to visible laser light is an irradiance of 1 mW cm–2 at the cornea for small spot sizes.4,5 In laser safety calculations, a 7-mm diameter pupil is used as the limiting aperture, which admits a total intraocular power of 385 µW from a beam producing 1 mW cm–2 at the cornea. At a wavelength of λ = 633 nm (eg, from a HeNe laser), direct transmittance through the ocular medium to the retina is approximately 65%13 (see Figure 11-7). When the beam reaches the retina, it will, therefore, have a total power that is approximately P = (385 µW)(0.65) = 250 µW. This value was used in equation (3) to produce the retinal radiant exposure patterns shown in Figures 11-5 and 11-6.
Figure 11-5 shows the retinal radiant exposure patterns resulting from a 25-µm diameter beam spot, ie, a = 12.5 µm in equation (2). This diameter is smaller than the size of the fixation ellipses (see Table 11-1). Therefore, it is expected that the eye movements will have a significant effect on the radi-ant exposure distribution because the source will be
moved a distance on the retina that is comparable to or larger than the beam diameter. The peak values of these distributions, listed in Table 11-2, are reduced to ¹⁄₅ or ¹⁄10 the value that would be experienced in a completely stationary eye for a long-duration ex-posure.This suggests that for small-beam spots, the threshold for photochemical damage in an awake, alert person will be five to ten times greater than the damage threshold measured or simulated in a stationary eye. Alternatively, for a given exposure level, the exposure duration may be five to ten times longer than the allowable duration determined for a stationary eye.
The retinal radiant exposure distribution result-ing for a 150-µm diameter beam spot is shown in Figure 11-6. In this case, the beam diameter is larger than the size of the fixation ellipses. Most eye move-ments will shift the source a distance that is small compared to the spot size; therefore, the shape of the radiant exposure distributions is expected to be similar to what would be experienced by a sta-tionary eye. Furthermore, the peak value of these distributions should be similar in the moving and stationary eyes. This is indeed observed—the peaks of the radiant exposure distributions in the moving eyes are within a factor of two of the peak value in the stationary eye (see Table 11-2).
Eye movements occurring during a fixation task are likely to have a significant impact on the onset of retinal damage occurring from exposure to a small spot-size source, as expected from a laser exposure. For sources producing beam spots of a few hundred micrometers or larger in diameter, eye movements are unlikely to play a significant role in determining retinal damage thresholds.
Figure 11-7. Retinal pigment epithelium (RPE) absorption coefficient, ARPE, and direct ocular transmission coefficient, Tocular, as a function of wavelength for visible light. The prod-uct of these two coefficients gives the percentage of the total intraocular power that is absorbed in the RPE. (ARPE is from Gabel et al. Tocular is from Boettner and Wolter.)Data sources: Boettner EA, Wolter JR. Transmission of the ocular media. Invest Ophthalmol. 1962;1:776–783. Gabel V-P, Birngruber R, Hillenkamp F. Visible and new infrared light absorption in pigment epithelium and choroids. In: Inter-national Congress Series, No. 450: XXIII Concilium Ophthal-mologicum, Kyoto, Japan, 14–20 May 1978. Amsterdam, The Netherlands: Excerpta Medica; 658–662.
0.0
0.2
0.4
0.6
0.8
1.0
400 450 500 550 600 650 700
ARPE Tocular
Tocular × ARPE
Wavelength (nm)
TABLE 11-2
COMPARISON OF RETINAL EXPOSURE FROM SMALL AND LARGE-BEAM SPOTS
Peak Retinal Radiant Exposure (J cm–2)
Movement Data 25-µm spot* 150-µm spot†
Stationary 2,546 70.7Subject 1 234 (0.09)‡ 41.4 (0.59)‡
Subject 4 489 (0.19)‡ 63.2 (0.89)‡
Subject: 6 195 (0.08)‡,§ 40.3 (0.63)‡,§
*See Figure 11-5.†See Figure 11-6.‡Value in parentheses is ratio to value for the stationary eye.§Stationary eye data scaled to a 45-s trial for comparison with subject 6.
228
Biomedical Implications of Military Laser Exposure
RETINAL HEATING DURING FIXATION ON A LASER SOURCE
As the temperature in the absorbing volume in-creases, so will the temperature difference between the absorbing volume and the surrounding tissue. The rate of heat flowing from the absorbing volume will become significant, causing a temperature in-crease in the tissue immediately surrounding the absorbing volume. Note that this process is three-dimensional—heat will flow not only along the plane of the retina, but will also diffuse into the interior of the eye (vitreous) and toward the exterior of the eye (sclera). This diffusive process can be a very efficient method of moving energy if the absorbing volume is very small, as would be expected for a laser beam focused onto the retina.
With further energy absorption, the temperature of the absorbing volume will increase, and the tem-perature difference with the surrounding media will increase further. The rate of heat flow into the sur-rounding media will increase until it nearly balances the rate at which energy is absorbed from the laser beam. At this point, the rate at which the temperature of the irradiated area increases becomes very slow.
When the heat source is removed (eg, an eye move-ment changes the location of the laser beam spot on the retina), the previously directly irradiated portion of the retina no longer directly receives energy from the beam. However, it will still have a relatively high temperature relative to the surrounding portion of the retina. The flow of heat from this hot region will be large, causing the previously irradiated spot to cool rapidly to a temperature near that of the surrounding retina.
Any particular location on the retina can be ex-pected to have a complicated thermal history during a long-duration exposure. There will be periods of increased temperature when the location is directly irradiated by the laser beam and cooler periods when the beam spot is moved elsewhere by eye movements. This is especially true for a small-beam spot diameter because a smaller eye movement is adequate to shift the particular location of the retina completely beyond exposure to the beam. At some exposure duration, the heating pattern in the retina will differ significantly from the pattern expected in a stationary eye.
Direct measurements have been taken of tempera-ture change in the retina during a laser exposure. Birn-gruber16 recorded the thermal response of rabbit retinas by inserting a probe into the globe of the eye. Such an invasive procedure obviously changes the nature of the subject’s eye movement patterns. Therefore, we turn to a computer simulation to model the retinal thermal response in a moving eye.
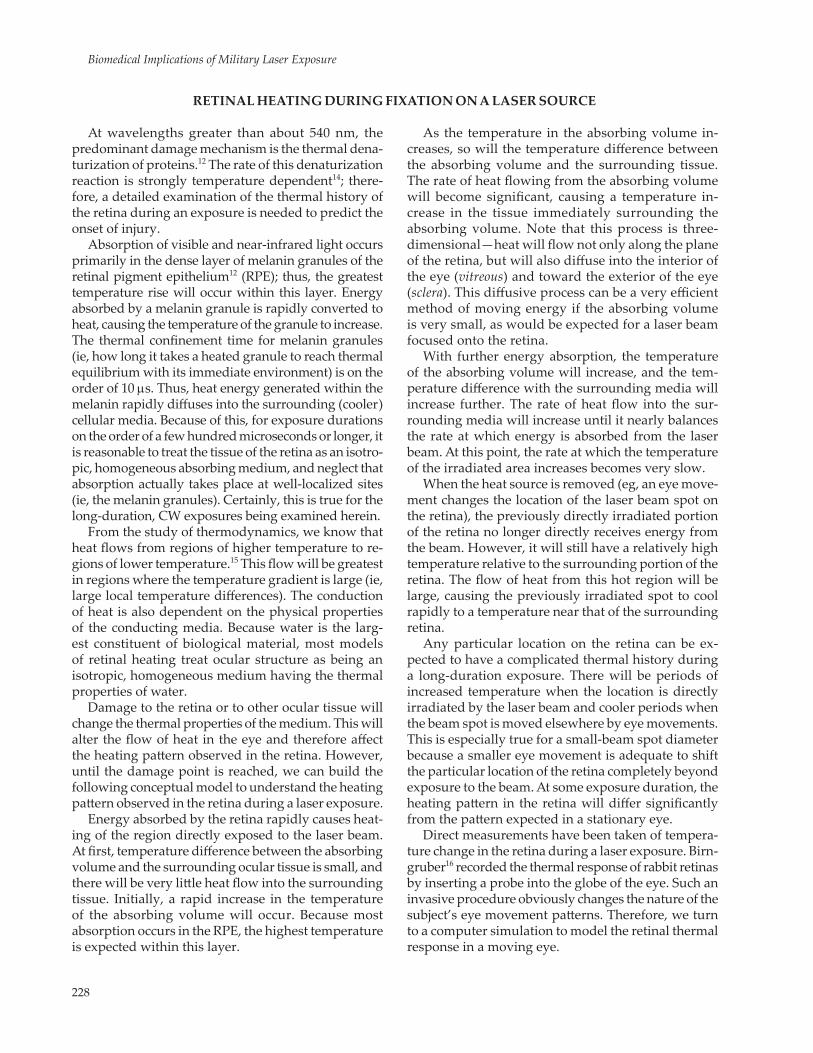
At wavelengths greater than about 540 nm, the predominant damage mechanism is the thermal dena-turization of proteins.12 The rate of this denaturization reaction is strongly temperature dependent14; there-fore, a detailed examination of the thermal history of the retina during an exposure is needed to predict the onset of injury.
Absorption of visible and near-infrared light occurs primarily in the dense layer of melanin granules of the retinal pigment epithelium12 (RPE); thus, the greatest temperature rise will occur within this layer. Energy absorbed by a melanin granule is rapidly converted to heat, causing the temperature of the granule to increase. The thermal confinement time for melanin granules (ie, how long it takes a heated granule to reach thermal equilibrium with its immediate environment) is on the order of 10 µs. Thus, heat energy generated within the melanin rapidly diffuses into the surrounding (cooler) cellular media. Because of this, for exposure durations on the order of a few hundred microseconds or longer, it is reasonable to treat the tissue of the retina as an isotro-pic, homogeneous absorbing medium, and neglect that absorption actually takes place at well-localized sites (ie, the melanin granules). Certainly, this is true for the long-duration, CW exposures being examined herein.
From the study of thermodynamics, we know that heat flows from regions of higher temperature to re-gions of lower temperature.15 This flow will be greatest in regions where the temperature gradient is large (ie, large local temperature differences). The conduction of heat is also dependent on the physical properties of the conducting media. Because water is the larg-est constituent of biological material, most models of retinal heating treat ocular structure as being an isotropic, homogeneous medium having the thermal properties of water.
Damage to the retina or to other ocular tissue will change the thermal properties of the medium. This will alter the flow of heat in the eye and therefore affect the heating pattern observed in the retina. However, until the damage point is reached, we can build the following conceptual model to understand the heating pattern observed in the retina during a laser exposure.
Energy absorbed by the retina rapidly causes heat-ing of the region directly exposed to the laser beam. At first, temperature difference between the absorbing volume and the surrounding ocular tissue is small, and there will be very little heat flow into the surrounding tissue. Initially, a rapid increase in the temperature of the absorbing volume will occur. Because most absorption occurs in the RPE, the highest temperature is expected within this layer.

229
Retinal Thermal Damage and Ocular Motion
Modeling the Retinal Heating Pattern: The RHME (Retinal Heating, Moving Eye) Program
Modeling the heat pattern in the retina involves solving the standard heat conduction equation for an isotropic, homogeneous medium15:
(4)
Here, DT = the temperature increase in Celsius above the
ambient body temperature (generally taken to be 37°C),
r = the density of the ocular media in g cm–3, C = the specific heat in J g–1 °C–1, and k = the thermal conductivity in J cm–1 s–1 °C–1.
The heat source term Q is given in J cm–3 s–1 and rep-resents heat deposited in the retina by the laser beam.
A number of analytical and computational models have been developed to study heating in the retina during laser exposure. (For some examples, see Birn-gruber,16 Birngruber et al,17 Mainster et al,18 and Takata et al.19) These models have treated the eye as stationary and generally assume a cylindrically symmetric beam. This reduces the problem to two spatial dimensions: (1) the distance along the beam direction, z (or equiva-lently, the depth into the retina), and (2) the radial distance from the beam axis, r. Eye movements break this cylindrical symmetry; thus, the laser-induced heating of the retina in a moving eye must be treated as a fully three-dimensional problem.
A computer program called RHME was developed at USAMRD to simulate the heating of the retina dur-ing long-duration laser exposure.20 This program is designed to provide insight into how the heating pat-tern in a moving eye differs from that in a completely stationary eye. Primary emphasis is placed on handling a moving source (Q(x,y,z,t) of equation (4)).
The RHME program uses a number of simplifying assumptions to reduce the computational effort needed to simulate an exposure. The geometry of the model is illustrated in Figure 11-8. The RPE is modeled as a flat slab 10 µm thick. The volume above the RPE slab represents the interior media of the eye, whereas the volume below the RPE slab represents post-RPE tis-sue, such as the choroid, sclera, etc. All absorption is assumed to take place only in the RPE layer—heating due to absorption in pre- and post-RPE tissue is con-sidered to be negligible. RPE absorption is taken from Gabel et al21 and is plotted as a function of wavelength in Figure 11-7. Light absorption is taken to be uniform throughout the depth of the RPE layer; there is no
Beer’s law attenuation calculation. This means that the highest temperature occurs in the plane at the center of the model RPE.
In the following sections, RHME simulation re-sults are shown for a MPE-level exposure to a HeNe laser (λ = 632.8 nm). The physical parameters used for these simulations are listed in Table 11-3. A beam spot diameter of 25 µm was used in these calculations, corresponding to the small spot size expected from exposure to a laser beam. The retina radiant exposure pattern resulting from such an exposure was discussed previously in reference to Figure 11-5.
Simulation Results: A Look at Retinal Heating During a Long-Duration Exposure
Figure 11-9 shows the results of a simulation for a stationary source (no eye movements) in which the beam is turned on for 1 s. This particular plot shows the temperature rise DT as a function of time at the point (x = 0, y = 0, and z = 0) (see Figure 11-8). This point is located on the beam axis and at the center of the model’s RPE layer—the largest temperature increase will occur at this location. The thermal response to the application of the laser is very rapid; within 10 ms, the temperature increase is >90% of the value it will attain
z
x Absorbing Layer (RPE)
Pre-RPE media
Post-RPE media
a)
y
x
(x(t), y(t))
b)
Figure 11-8. Geometry of the RHME (Retinal Heating, Mov-ing Eye) model. (a) Side view: the z = 0 plane bisects the retinal pigment epithelium (RPE) slab. (b) Top view: position of the cylinder, representing the volume of the RPE in which energy is absorbed, moves about in accordance with measured eye movement data. Energy is assumed to be deposited uni-formly throughout the cylindrical volume.

230
Biomedical Implications of Military Laser Exposure
at 1 s (DT (0.01 s) = 1.03°C, DT (1.0 s) = 1.12°C). Were the beam to be left on after this time, the temperature would continue to rise, but at a very slow rate: DT (50 s) = 1.14°C. Once the laser is removed, cooling occurs as rapidly as heating: (DT (1.01 s) = 0.10°C).
One consequence of this rapid thermal response is illustrated in Figure 11-10, which shows the results of running the RHME simulation using the eye move-ment data of subject 6 from the study performed by Lund et al7 (see Figure 11-2). The nine frames show the temperature rise in the z = 0 plane during a flick that moved the laser spot a distance of about 230 µm on the retina in <50 ms. Due to the rapid thermal response time illustrated in Figure 11-9, only the region of the retina directly irradiated by the beam undergoes a significant temperature rise. When the beam moves away from this region, that region cools rapidly. The location of the beam can be readily identified in each of the frames of Figure 11-10.
Any point of the retina that becomes directly ex-posed to the laser beam, even if only briefly due to eye movements, will be quickly heated to a temperature near the maximum temperature reached for a station-ary source. Therefore, we might expect that a plot of the maximum temperature rise distribution, defined as
for, say, the z = 0 plane (the central plane of the model RPE layer), will be a plateau having the same shape as the overall eye movement pattern. This is indeed the case, as illustrated in Figure 11-11. The region of higher temperature increase fills the area defined by the contours of the eye movement pattern.
The peak value of the DTmax distributions is listed in Table 11-4. This temperature is fairly insensitive to the nature of the eye movement pattern. Once again, this is a consequence of the rapid thermal response of the retina. Note that the peak temperature increases calculated by the RHME simulation for an MPE-level exposure at λ = 632.8 nm are small. From Table 11-4, we note that DTmax is about 1.2°C. A temperature increase of 10° to 20°C is generally needed to induce thermal injury.12,14,16–19 On this basis, the large increase in the small-source exposure limits (see Figure 11-1) was certainly reasonable.
Another consequence of the rapid thermal response is that the time-averaged temperature rise distribution, defined as
should reflect the eye movements. This is clearly demonstrated in Figure 11-12, where the average temperature rise distribution for the small-diameter
TABLE 11-3
PARAMETERS USED IN THE THERMAL SIMULATIONS
Properties of Ocular Media
Thermal conductivity k = 0.0063 J cm–1 s–1 °C–1
Specific heat C = 4.184 J g–1 °C–1
Density r = 1.0 g cm–3
Thermal diffusivity α = k/Cr = 0.0015 cm2 s–1
RPE thickness h = 10 µm
Beam Properties
Irradiance at cornea*,† 1.0 mW cm–2
Ocular transmittance at 0.65‡
λ = 632.8 nmAbsorption in RPE at 0.29§
λ = 632.8 nmPower absorbed in RPE 72.5 µWBeam radius at RPE¥ a = 12.5 µm (d = 25 µm)
*Averaged over a 7-mm diameter pupil.†This is the current maximum permissible exposure for a long-duration exposure to visible light.‡Boettner EA, Wolter JR. Transmission of the ocular media. Invest Ophthalmol. 1962;1:776–783.§Gabel V-P, Birngruber R, Hillenkamp F. Visible and new infrared light absorption in pigment epithelium and choroids. In: Interna-tional Congress Series, No. 450: XXIII Concilium Ophthalmologicum, Kyoto, Japan, 14–20 May 1978. Amsterdam, The Netherlands: Excerpta Medica; 658–662.¥Corresponds to the minimal angular subtense, αmin. (American National Standards Institute [ANSI]). Safe Use of Lasers, Standard Z136.1. Orlando, FL: Laser Institute of America; 2000.)RPE: retinal pigment epithelium
Figure 11-9. RHME (Retinal Heating, Moving Eye) simula-tion for a stationary source that is turned on at t = 0 s and turned off at t = 1.0 s. Plot shows temperature increase versus time at the retinal location (x = 0, y = 0, z = 0). Note the rapid thermal response time for the small beam spot.
0.0
0.2
0.4
0.6
0.8
1.0
1.2
0.0 0.5 1.0 1.5 2.0
T
emp
erat
ure
(K
)
Time (s)

231
Retinal Thermal Damage and Ocular Motion
source reflects the peaks in the visitation time plots. Table 11-4 lists the peak values of the DTavg distribu-tions. As expected, the peak DTavg value is seen to have an inverse relation with the fixation ellipse area. However, even for the tightest eye movement pattern (subject 4), the DTavg peak value is significantly less than the peak value expected to occur in a station-ary eye.
The time-averaged temperature rise distribution of Figure 11-12 is more relevant to understanding the probability of injury than the peak temperature rise distribution of Figure 11-11. A location with a higher value for DTavg has spent more time during exposure at an elevated temperature. However, the smoothness of the DTavg distribution (an artifact of the averaging process) hides the complex thermal history of a given
-300 -200 -100 0 100 200 300-300
-200
-100
0
100
200
300
0
0.2
0.4
0.6
0.8
1
1.20.33 s
-300 -200 -100 0 100 200 300-300
-200
-100
0
100
200
300
0
0.2
0.4
0.6
0.8
1
1.20.34 s
-300 -200 -100 0 100 200 300-300
-200
-100
0
100
200
300
0
0.2
0.4
0.6
0.8
1
1.20.35 s
-300 -200 -100 0 100 200 300-300
-200
-100
0
100
200
300
0
0.2
0.4
0.6
0.8
1
1.20.36 s
-300 -200 -100 0 100 200 300-300
-200
-100
0
100
200
300
0
0.2
0.4
0.6
0.8
1
1.20.37 s
-300 -200 -100 0 100 200 300-300
-200
-100
0
100
200
300
0
0.2
0.4
0.6
0.8
1
1.20.38 s
-300 -200 -100 0 100 200 300-300
-200
-100
0
100
200
300
0
0.2
0.4
0.6
0.8
1
1.20.39 s
-300 -200 -100 0 100 200 300-300
-200
-100
0
100
200
300
0
0.2
0.4
0.6
0.8
1
1.20.40 s
-300 -200 -100 0 100 200 300-300
-200
-100
0
100
200
300
0
0.2
0.4
0.6
0.8
1
1.20.41 s
Figure 11-10. Response of the temperature in the retina (z = 0 plane) to source movement. Eye movement data are from sub-ject 6 of Lund et al (see, also, Figure 11-2, bottom) during a microsaccade (flick). Scales along each plot indicate an increase in temperature, DT (°C).Data source: Lund BJ, Zwick H, Lund DJ, Stuck BE. Effect of source intensity on ability to fixate: implications for laser safety. Health Phys. 2003;85(5):567–577.

232
Biomedical Implications of Military Laser Exposure
point of the retina. Figure 11-13 demonstrates the heating and cooling that a particular retinal location may undergo during a long-duration exposure. These graphs show the temperature rise as a function of time at the location of the peak of the DTavg distributions (see Figure 11-12) for a stationary eye and for the sample
eye movement patterns of Figure 11-2. The periods of higher temperature occur when the particular retinal location is nearly or directly exposed to the laser. The cooler temperatures indicate periods when eye move-ments have shifted the laser beam spot to a point on the retina some distance away.
Figure 11-11. Maximum temperature increase in the z = 0 plane. Color indicates peak temperature increase at each point; scales are to the right of each plot. Calculations are for a maximum permissible exposure level.
-400 -300 -200 -100 0 100 200 300 400-400
-300
-200
-100
0
100
200
300
400
0
0.2
0.4
0.6
0.8
1
1.2Stationary eye
-400 -300 -200 -100 0 100 200 300 400-400
-300
-200
-100
0
100
200
300
400
0
0.2
0.4
0.6
0.8
1
1.2Subject 1
-400 -300 -200 -100 0 100 200 300 400
Nasal/Temporal (µm) Nasal/Temporal (µm)
Nasal/Temporal (µm) Nasal/Temporal (µm)
-400
-300
-200
-100
0
100
200
300
400
0
0.2
0.4
0.6
0.8
1
1.2Subject 4
-400 -300 -200 -100 0 100 200 300 400-400
-300
-200
-100
0
100
200
300
400S
up
erio
r/In
feri
or
(µm
)
Su
per
ior/
Infe
rio
r (µ
m)
Su
per
ior/
Infe
rio
r (µ
m)
Su
per
ior/
Infe
rio
r (µ
m)
0
0.2
0.4
0.6
0.8
1
1.2Subject 6
∆T
max
(K)
∆T
max
(K)
∆T
max
(K)
∆T
max
(K)
ESTIMATING THERMAL DAMAGE THRESHOLDS FROM SIMULATION RESULTS
movements also have an impact on the likelihood of retinal damage from a laser exposure. This assess-ment will be made quantitative by comparing the thermal damage thresholds predicted for moving and stationary eyes.
Results from the RHME simulation show that the intrinsic eye movements can have a large impact on the temperature history of the retina during a long-duration laser exposure. The goal of the research outlined in this chapter is to determine if the eye

233
Retinal Thermal Damage and Ocular Motion
Figure 11-12. Time-averaged temperature increase in the z = 0 plane. Color indicates average temperature increase at each point; scales are to the right of each plot. Calculations are for a maximum permissible exposure level.
TABLE 11-4
COMPARISON OF RESULTS FOR SMALL-SOURCE EXPOSURE
Fixation Ellipse Peak Peak Area (µm2) ∆Tmax (°C)* ∆Tavg (°C)†
Stationary 0.0 1.14 1.14Subject 1 6,552 1.23 0.24 (0.21)‡
Subject 4 951 1.21 0.42 (0.37)‡
Subject 6 4,033 1.15 0.25 (0.22)‡
*See Figure 11-11.†See Figure 11-12.‡Value in parentheses is ratio to value for the stationary eye.
-400 -300 -200 -100 0 100 200 300 400
-400
-300
-200
-100
0
100
200
300
400
0
0.2
0.4
0.6
0.8
1
1.2Stationary eye
-400 -300 -200 -100 0 100 200 300 400
-400
-300
-200
-100
0
100
200
300
400
0
0.2
0.4
0.6
0.8
1
1.2Subject 1
-400 -300 -200 -100 0 100 200 300 400
-400
-300
-200
-100
0
100
200
300
400
0
0.2
0.4
0.6
0.8
1
1.2Subject 4
-400 -300 -200 -100 0 100 200 300 400
-400
-300
-200
-100
0
100
200
300
400
0
0.2
0.4
0.6
0.8
1
1.2Subject 6
Nasal/Temporal (µm) Nasal/Temporal (µm)
Nasal/Temporal (µm) Nasal/Temporal (µm)
Su
per
ior/
Infe
rio
r (µ
m)
Su
per
ior/
Infe
rio
r (µ
m)
Su
per
ior/
Infe
rio
r (µ
m)
Su
per
ior/
Infe
rio
r (µ
m)
∆T
max
(K)
∆T
max
(K)
∆T
max
(K)
∆T
max
(K)
Thermal damage thresholds are estimated using an activated rate process model.14 The onset of damage is assessed by evaluating an Arrhenius integral:
(7)
where
t = the total exposure time,T(t) = the absolute temperature (in Kelvin) as a func-
tion of time, andR = the universal gas constant (8.314 J K–1 mole–1).

234
Biomedical Implications of Military Laser Exposure
The frequency factor A (s–1) and the activation bar-rier Ea (J mole–1) are, in principle, related to the under-lying chemical or physical processes leading to tissue damage. However, for practical use, the parameters A and Ea are obtained from fits to experimental damage threshold data. They are adjusted so that Ω = 1 is an indicator of the onset of permanent, irreversible dam-age. Here, the values A = 1.3 × 1099 s–1 and Ea = 6.28 × 10⁵ J mole–1 from Welch and Polhamus22 are used.
To do a systematic search for thermal damage thresholds, it is possible to use equation (7) in conjunc-tion with the full, three-dimensional, time-dependent temperature distributions calculated by RHME. Such a procedure quickly becomes extremely labor-intensive if multiple sets of eye movement data are considered (to avoid statistical anomalies). Furthermore, we would like to systematically investigate exposure dura-
tions from 50 or 100 ms to 50 s. The rest of this section will outline a procedure to estimate damage thresholds from temperature increase versus time traces of Figure 11-13. Recall that these plots represent temperature history at the location of the time-averaged tempera-ture rise distributions of Figure 11-12. This simplified analysis still provides useful physical insight into the retinal thermal damage process.23
To estimate the thermal damage threshold using the RHME simulation results, first note that the diffusion equation (5) is linear in the temperature increase, DT(x, y, z, t), and the source term, Q(x, y, z, t). If the source term is multiplied by some numerical factor β, then the resulting temperature increase is multiplied by the same factor: if Q → Q′ = β . Q, then DT → DT′ = β . DT. Temporal and spatial dependence are unchanged, but the magnitude of the thermal response scales with
0.0
0.2
0.4
0.6
0.8
1.0
1.2
Stationary eye
0.0
0.2
0.4
0.6
0.8
1.0
1.2
Subject 1
0.0
0.2
0.4
0.6
0.8
1.0
1.2
Subject 4
0 10 20 30 40 50
0.0
0.2
0.4
0.6
0.8
1.0
1.2
Subject 6
Time (s)
∆T
(K)
∆T
(K)
∆T
(K)
∆T
(K)
Figure 11-13. Temperature increase versus time at the location of the peak of the time-averaged temperature rise distribution (see Figure 11-12). Stationary eye: 50 s, DTmax = 1.14°C, DTavg = 1.14°C. Subject 1: 50 s, DTmax = 1.14°C, DTavg = 0.24°C. Subject 4: 50 s, DTmax = 1.13°C, DTavg = 0.42°C. Subject 6: 45 s, DTmax = 1.13°C, DTavg = 0.25°C.
235
Retinal Thermal Damage and Ocular Motion
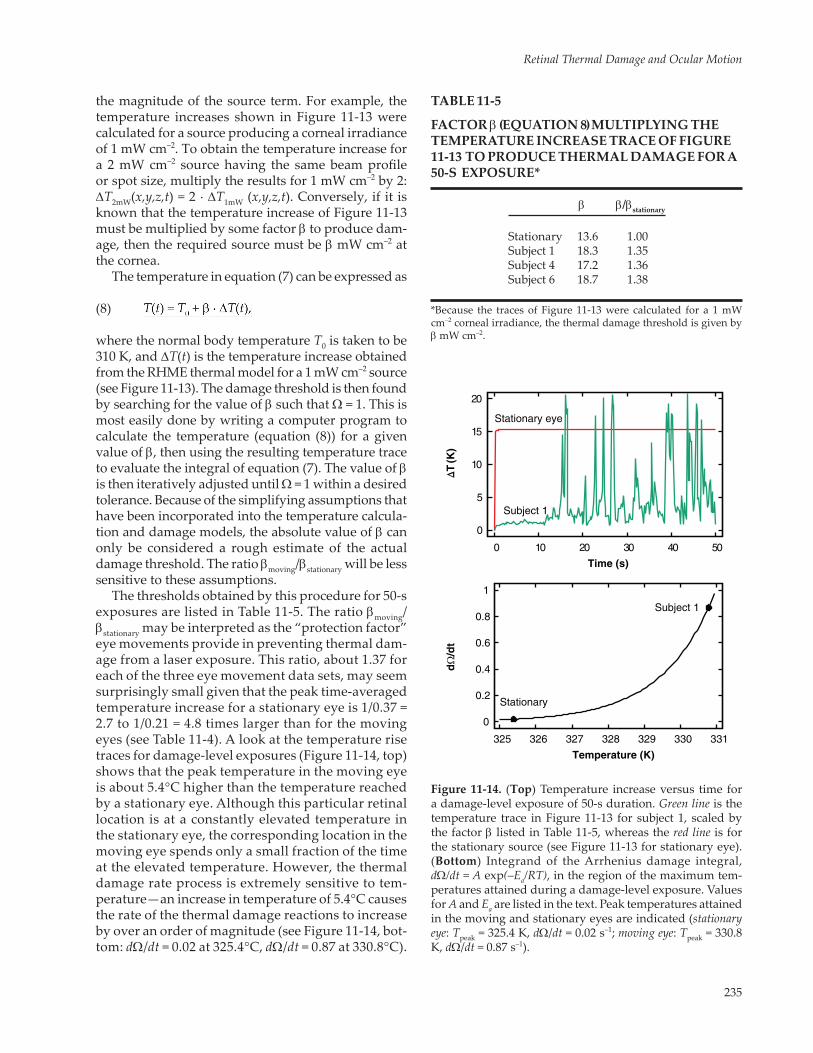
the magnitude of the source term. For example, the temperature increases shown in Figure 11-13 were calculated for a source producing a corneal irradiance of 1 mW cm–2. To obtain the temperature increase for a 2 mW cm–2 source having the same beam profile or spot size, multiply the results for 1 mW cm–2 by 2: DT2mW(x,y,z,t) = 2 . DT1mW (x,y,z,t). Conversely, if it is known that the temperature increase of Figure 11-13 must be multiplied by some factor β to produce dam-age, then the required source must be β mW cm–2 at the cornea.
The temperature in equation (7) can be expressed as
(8)
where the normal body temperature T0 is taken to be 310 K, and DT(t) is the temperature increase obtained from the RHME thermal model for a 1 mW cm–2 source (see Figure 11-13). The damage threshold is then found by searching for the value of β such that Ω = 1. This is most easily done by writing a computer program to calculate the temperature (equation (8)) for a given value of β, then using the resulting temperature trace to evaluate the integral of equation (7). The value of β is then iteratively adjusted until Ω = 1 within a desired tolerance. Because of the simplifying assumptions that have been incorporated into the temperature calcula-tion and damage models, the absolute value of β can only be considered a rough estimate of the actual damage threshold. The ratio βmoving/βstationary will be less sensitive to these assumptions.
The thresholds obtained by this procedure for 50-s exposures are listed in Table 11-5. The ratio βmoving/βstationary may be interpreted as the “protection factor” eye movements provide in preventing thermal dam-age from a laser exposure. This ratio, about 1.37 for each of the three eye movement data sets, may seem surprisingly small given that the peak time-averaged temperature increase for a stationary eye is 1/0.37 = 2.7 to 1/0.21 = 4.8 times larger than for the moving eyes (see Table 11-4). A look at the temperature rise traces for damage-level exposures (Figure 11-14, top) shows that the peak temperature in the moving eye is about 5.4°C higher than the temperature reached by a stationary eye. Although this particular retinal location is at a constantly elevated temperature in the stationary eye, the corresponding location in the moving eye spends only a small fraction of the time at the elevated temperature. However, the thermal damage rate process is extremely sensitive to tem-perature—an increase in temperature of 5.4°C causes the rate of the thermal damage reactions to increase by over an order of magnitude (see Figure 11-14, bot-tom: dΩ/dt = 0.02 at 325.4°C, dΩ/dt = 0.87 at 330.8°C).
TABLE 11-5
FACTOR β (EQUATION 8) MULTIPLYING THE TEMPERATURE INCREASE TRACE OF FIGURE 11-13 TO PRODUCE THERMAL DAMAGE FOR A 50-S EXPOSURE*
β β/βstationary
Stationary 13.6 1.00Subject 1 18.3 1.35Subject 4 17.2 1.36Subject 6 18.7 1.38
*Because the traces of Figure 11-13 were calculated for a 1 mW cm–2 corneal irradiance, the thermal damage threshold is given by β mW cm–2.
0
5
10
15
20
0 10 20 30 40 50
Stationary eye
Subject 1
Time (s)
0
0.2
0.4
0.6
0.8
1
325 326 327 328 329 330 331
Stationary
Subject 1
Temperature (K)
∆T
(K)
d
/dt
Figure 11-14. (Top) Temperature increase versus time for a damage-level exposure of 50-s duration. Green line is the temperature trace in Figure 11-13 for subject 1, scaled by the factor β listed in Table 11-5, whereas the red line is for the stationary source (see Figure 11-13 for stationary eye). (Bottom) Integrand of the Arrhenius damage integral, dΩ/dt = A exp(–Ea/RT), in the region of the maximum tem-peratures attained during a damage-level exposure. Values for A and Ea are listed in the text. Peak temperatures attained in the moving and stationary eyes are indicated (stationary eye: Tpeak = 325.4 K, dΩ/dt = 0.02 s–1; moving eye: Tpeak = 330.8 K, dΩ/dt = 0.87 s–1).

236
Biomedical Implications of Military Laser Exposure
SUMMARY
This chapter looks at the impact of the intrinsic motion of the eye on the likelihood of retinal damage occurring during a long-duration laser exposure. This is done by using simple models to estimate the retinal thermal damage thresholds, including and excluding eye movements. Eye movements affect the pattern of energy deposition in the retina very significantly (see Figure 11-5 and Table 11-2). However, because of the rapidity of the thermal response and the high sensitivity of the rate of the thermal damage process to temperature, eye movements have a less dramatic (but still significant) effect on the damage threshold. Thresholds calculated from the eye movement samples for a 50-s exposure are a factor of 1.35 to 1.40 larger than the threshold obtained if eye motion is ignored.
The moving/stationary eye threshold ratio quoted previously is for a 25-µm diameter beam spot and a 50-s exposure. Figure 11-15 shows a plot of the protec-tion factor βmoving/βstationary for exposure durations from 0.1 to 50 s obtained from simulations using eye move-ment data sets from seven subjects.23 If the exposure duration is reduced to a few milliseconds or shorter (ie, shorter than the time scale of the eye movements), then the threshold ratio falls to a value very close to 1.0. This ratio initially increases rapidly as the exposure duration extends beyond 10 to 20 ms, a time scale on which eye motion becomes significant compared to the size of the beam spot. The threshold ratio reaches a value of 1.1 for an exposure duration of around 600 ms. After a few seconds, the full extent of the eye movement pattern will be sampled. At this point, the threshold ratio increases slowly as the exposure dura-tion is increased. The threshold ratio reaches the value of 1.2 at an exposure duration of about 8 s and only increases to 1.3 for exposure durations nearing 50 s.
The moving/stationary eye threshold ratio is also ex-pected to reach its maximum value for the small-beam spot size. Beam spots of a few hundred micrometers in diameter are large compared to the extent of the eye
movement pattern. The eye movement will cause only a small perturbation in the retinal heating pattern. The threshold ratio will therefore fall to 1.0 as the beam spot diameter is increased. A detailed investigation of the threshold ratio as a function of the beam spot size is another area for further investigation.
The eye movement data used in this study represent the worst-case scenario from a laser safety perspective: a subject whose head motion is arrested deliberately fixates on the beam from a laser. In “real-world” sce-narios, head motions will add to the movement of the beam spot on the retina. The moving/stationary dam-age threshold ratio in such cases will be larger than the value reported here for a fixed-head position. The ratio presented here, therefore, represents a lower limit for the impact of eye movements on the likelihood of incurring damage from a laser exposure.
1.00
1.05
1.10
1.15
1.20
1.25
1.30
1.35
1.40
0 10 20 30 40 50
Pro
tect
ion
Fac
tor
Exposure Duration (s)
Figure 11-15. Thermal retinal injury protection factor βmoving/βstationary due to small-scale eye movements for exposure durations from 0.1 to 50 s obtained from RHME (Retinal Heating, Moving Eye) simulations. Line indicates the aver-age of all data sets.
REFERENCES
1. Ditchburn RW. Eye-Movements and Visual Perception. Oxford, UK: Clarendon Press; 1973.
2. Kowler E. The stability of gaze and its implications. In: Carpenter RHS, ed. Visual and Visual Dysfunction. Vol 8. Eye Movements. Boca Raton, LA: CRC Press, Inc; 1991: 71–92.
3. Ness JW, Zwick H, Stuck BE, et al. Retinal image motion during deliberate fixation: implications to laser safety for long duration viewing. Health Phys. 2000;78(2):131–142.
4. American National Standards Institute (ANSI). Safe Use of Lasers, Standard Z136.1. Orlando, FL: Laser Institute of America; 2000.

237
Retinal Thermal Damage and Ocular Motion
5. International Commission on Non-Ionizing Radiation Protections (ICNIRP). Revision of guidelines on limits of expo-sure to laser radiation of wavelengths between 400 nm and 1.4 mm. Health Phys. 2000;79(4):431–440.
6. Eizenman M, Hallett PE, Frecker RC. Power spectra for ocular drift and tremor. Vision Res. 1985;25(11):1625–1640.
7. Lund BJ, Zwick H, Lund DJ, Stuck BE. Effect of source intensity on ability to fixate: implications for laser safety. Health Phys. 2003;85(5):567–577.
8. Crane HD. The Purkinje image eyetracker, image stabilization, and related forms of stimulus manipulation. In: Kelly DH, ed. Visual Science and Engineering: Models and Applications. New York, NY: Marcel Dekker, Inc; 1994.
9. Zwick H, Lund DJ, Gagliano DA, Stuck BE. Function and ophthalmoscopic observations in human laser accident cases using scanning laser ophthalmoscopy. SPIE. 1994;2126:144–153.
10. Nachmias J. Two-dimensional motion of the retinal image during monocular fixation. J Opt Soc Am. 1959;49(9):901–908.
11. American National Standards Institute (ANSI). Safe Use of Lasers, Standard Z136.1. Orlando, FL: Laser Institute of America; 1993.
12. Sliney D, Wolbarsht M. Safety With Lasers and Other Optical Sources. New York, NY: Plenum Press; 1980.
13. Boettner EA, Wolter JR. Transmission of the ocular media. Invest Ophthalmol. 1962;1:776–783.
14. Pearce J, Thomsen S. Rate process analysis of thermal damage. In: Welch AJ, van Gemert MJC, eds. Optical-Thermal Response of Laser-Irradiated Tissue. New York, NY: Plenum Press; 1995: Chap 17.
15. Carslaw HS, Jaeger JC. Conduction of Heat in Solids. Oxford, UK: Clarendon Press; 1959.
16. Birngruber R. Choroidal circulation and heat convection at the fundus of the eye: implications for laser coagulation and the stabilization of retinal temperature. In: Wolbarsht ML, ed. Laser Applications in Medicine and Biology. Vol 5. New York, NY: Plenum Press; 1991: 271–361: Chap 6.
17. Birngruber R, Hillenkamp F, Gabel V-P. Theoretical investigations of laser thermal retinal injury. Health Phys. 1985;8(6):781–796.
18. Mainster MA, White TJ, Tips JH, Wilson PW. Retinal-temperature increases produced by intense light sources. J Opt Soc Am. 1970;60(2):264–270.
19. Takata AN, Goldfinch L, Hinds JK, Kuan LP, Thomopouolis N, Weigandt A. Thermal Model of Laser-Induced Eye Damage. Chicago, IL: IIT Research Institute, Engineering Mechanics Division; 1974. Final Technical Report IITRI J-TR 74-6324.
20. Lund BJ. Computer model to investigate the effect of eye movements on retinal heating during long-duration fixation on a laser source. J Biomed Opt. 2004;9(5):1092–1102.
21. Gabel V-P, Birngruber R, Hillenkamp F. Visible and new infrared light absorption in pigment epithelium and choroids. In: International Congress Series, No. 450: XXIII Concilium Ophthalmologicum, Kyoto, Japan, 14–20 May 1978. Amsterdam, The Netherlands: Excerpta Medica; 658–662.
22. Welch AJ, Polhamus GD. Measurement and prediction of thermal injury in the retina of the Rhesus monkey. IEEE Trans Biomed Eng. 1984;BME-31(10):633–644.
23. Lund BJ. Laser retinal thermal damage threshold: impact of small-scale ocular motion. J Biomed Opt. 2006;11(6):064033.