chapter 11 monopolistic competition and...
TRANSCRIPT

211
CHAPTER 11
Monopolistic Competition and Oligopoly
Answers to Short-Answer, Essays, and Problems
1. What are the major features of monopolistic competition compared to pure competition and pure
monopoly?
In monopolistic competition, there are a relatively large number of firms, not the thousands of firms as in
pure competition. The monopolistically competitive firms produce differentiated products, not the
standardized products of pure competition. Product differentiation means that monopolistic competitors
engage in some price competition because they have some limited “price making” ability based on the less
elastic demand for their particular product. This demand, however, is more elastic than the demand for
monopolists’ products. Monopolistic competitors, unlike most monopolists and all purely competitive
firms, will engage in nonprice competition that gets reflected in product quality, services, location,
advertising, and packaging. Compared with monopoly, the barriers to entry for monopolistically
competitive firms are minor. The firms typically are small in size, operate independently, and do not
practice collusion. [text: E pp. 217-218; MI pp. 217-218]
2. “Pure competition or pure monopoly industries will tend to be one-price industries. Monopolistic
competition, however, is a multiprice industry.” Explain.
Monopolistic competition has the fundamental feature of product differentiation. This gives each firm a
slight degree of monopolistic control over price. Consumers have preferences for the products or services
of specific sellers and within limits will pay a higher price to satisfy those preferences.
In pure competition the demand curve facing each individual seller is perfectly elastic because all products
are standardized. The seller and buyer must accept the market price in buying and selling. At the opposite
extreme, a pure monopoly is the only seller and so is able to set the price. [text: E pp. 217-218; MI pp.
217-218]
3. How does economic rivalry take place in monopolistic competition? Describe the different aspects of
product differentiation and price competition.
Nonprice competition is the typical type of economic rivalry that occurs in monopolistic competition.
There are several forms of nonprice competition. First, firms may compete by offering consumers different
product features or by providing products of varying quality. Second, firms differ in the amount of service
or support they provide the consumer. Third, in some monopolistic industries such as restaurants or
banking, location becomes a critical factor on which firms compete. Fourth, advertising and packaging
build loyalty to a particular brand or make one product more appealing to the consumer. Although
monopolistic competitors have some degree of control over price, the nonprice competition can be of even
greater importance in influencing or meeting consumer tastes and preferences. [text: E pp. 217-218; MI pp.
217-218]
4. What are “four-firm” concentration ratios? How do economists use them to define monopolistically
competitive industries and oligopolistic industries?
The most typical type of concentration ratio is the “four-firm” ratio that indicates the percentage of output
(or sales) produced by the four largest firms in an industry. If the four top firms produce less than 40% of
the output in an industry, the industry is considered to be monopolistically competitive. If the four top
firms produce over 40% of the output in an industry, the industry is considered to be oligopolistic. [text: E
pp. 218-219; MI pp. 218-219]
5. What are types of firms that exemplify monopolistic competition?

Chapter 11
212
Most types of retailing in metropolitan areas are handled by monopolistically competitive firms. The retail
stores would include gasoline stations, restaurants, clothing stores, shoe stores, and so forth. On the
manufacturing side, there would be companies that publish books, make plastic pipes, make cardboard
boxes, produce leather goods, or construct wood furniture or cabinets. [text: E p. 218; MI p. 218]
6. What is the Herfindahl index and how is it calculated?
The Herfindahl index is a way to measure market concentration that takes into account the size of market
shares held by firms. It measures the sum of the squared market shares of each firm in the industry. It
gives a greater weight to firms with large market shares. A high Herfindahl index number indicates a high
degree of concentration in one or two firms. A lower index might mean that the top four firms have rather
equal shares of the market. For example, if there were only one firm in the industry, the Herfindahl index
would be 10,000 (100 squared). If four firms in an industry each had a 25% share, the index would be
2500 (252 4 = 2500). A high index might be where one firm has 85% of the industry and the others have
5% each for a total of 7225 + (52 3) = 7300. [text: E p. 219; MI p. 219]
7. How are monopolistically competitive industries identified with concentration ratios?
The percentage of output produced by firms in a manufacturing industry would be an empirical measure
that could be used to judge whether an industry is monopolistically competitive. If the top four or eight
firms account for less than a quarter of industry output, then it would be a low-concentrated industry. Even
the top twenty firms might only account for about half of the total output in the industry. These data would
indicate that there are many producers in the industry, each only producing a small percentage of the total
output typical of monopolistic competition. [text: E pp. 218-219; MI pp. 218-219]
8. Why is the monopolistic competitor’s demand curve more elastic than a pure monopolist’s, but less elastic
than a pure competitor’s? What factors determine the price elasticity of demand for a monopolistic
competitor?
A monopolistic competitor’s demand curve is more elastic than a pure monopolist’s because the
monopolistic competitor has a number of competitors and close substitutes, while the monopolist has no
competitors. A monopolistic competitor’s demand curve is less elastic than a pure competitor’s because
there are fewer rivals and its products are differentiated, so there aren’t perfect substitutes. The main
factors that affect the price elasticity of demand for a monopolistic competitor are the number of rivals and
the amount of product differentiation. If the number of rivals is large, the elasticity for the product
increases. If the amount of differentiation is large, then the elasticity decreases. [text: E pp. 219-220; MI
pp. 219-220]
9. Assume that the short-run cost and demand data given in the table below confront a monopolistic
competitor selling a given product and engaged in a given amount of product promotion. Compute the
marginal cost and marginal revenue of each unit of output and enter these figures in the table.
Output
Total cost
Marginal cost
Quantity demanded
Price
Marginal revenue
0 $ 25 0 $60
1 40 $_____ 1 55 $_____
2 45 _____ 2 50 _____
3 55 _____ 3 45 _____
4 70 _____ 4 40 _____
5 90 _____ 5 35 _____
6 115 _____ 6 30 _____
7 145 _____ 7 25 _____
8 180 _____ 8 20 _____
9 220 _____ 9 15 _____
10 265 _____ 10 10 _____
Monopolistic Competition and Oligopoly
213
(a) At what output level and at what price will the firm produce in the short run? What will be the total
profit?
(b) What will happen to demand, price, and profit in the long run?

Chapter 11
214
Output
Total cost
Marginal cost
Quantity demanded
Price
Marginal revenue
0 $ 25 0 $60
1 40 $15 1 55 $55
2 45 5 2 50 45
3 55 10 3 45 35
4 70 15 4 40 25
5 90 20 5 35 15
6 115 25 6 30 5
7 145 30 7 25 −5
8 180 35 8 20 −15
9 220 40 9 15 −25
10 265 45 10 10 −35
(a) The firm will produce 4 units of output. At that level, marginal revenue ($25) is greater than marginal
cost ($15), but as close to equality as possible. Total profit will be $90 ($160 − $70).
(b) The demand for the firm’s product will decrease until price equals average cost and total profits are
zero.
[text: E pp. 219-221; MI pp. 219-221]
10. Explain why the following graph is likely to represent the long-run equilibrium for a representative firm in
monopolistic competition. What will be the product price, output, and amount of economic profit?
In long-run equilibrium the monopolisitically competitive firm will set price where MR=MC, so in this
case the product price will be set at A and the output level will be D. The firm, however, will not earn an
economic profit, but earn only a normal profit because the price is equal to where ATC is tangent to the
demand curve. At the price, there will be no incentive for firms to enter or exit the industry. [text: E 220-
221; MI pp. 220-221]
11. In theory, the representative firm in monopolistic competition earns only a normal profit. Why might that
outcome not always occur in the real world of small firms?
Some small firms may be able to differentiate their products in a such a way that other firms may not be
able to duplicate them, and thus earn economic profits. Also, entry into some industries can be difficult and
expensive, which may deter the entry of new firms even over time. [text: E p. 221; MI p. 221]

Monopolistic Competition and Oligopoly
215
12. Assume that the short-run cost and demand data given in the table below confront a monopolistic
competitor selling a given product and engaged in a given amount of product promotion. Compute the
marginal cost and marginal revenue of each unit of output and enter these figures in the table.
Output
Total cost
Marginal cost
Quantity demanded
Price
Marginal revenue
0 $ 75 0 $180
1 120 $_____ 1 165 $_____
2 135 _____ 2 150 _____
3 165 _____ 3 135 _____
4 210 _____ 4 120 _____
5 270 _____ 5 105 _____
6 345 _____ 6 90 _____
7 435 _____ 7 75 _____
8 540 _____ 8 60 _____
9 660 _____ 9 45 _____
10 795 _____ 10 30 _____
(a) At what output level and at what price will the firm produce in the short run? What will be the total
profit?
(b) What will happen to demand, price, and profit in the long run?
Output
Total cost
Marginal cost
Quantity demanded
Price
Marginal revenue
0 $ 75 0 $180
1 120 $ 45 1 165 $ 165
2 135 15 2 150 135
3 165 30 3 135 105
4 210 45 4 120 75
5 270 60 5 105 45
6 345 75 6 90 15
7 435 90 7 75 −15
8 540 105 8 60 −45
9 660 120 9 45 −75
10 795 135 10 30 −105
(a) The firm will produce 4 units of output. At that level, marginal revenue ($75) is greater than marginal
cost ($45), but as close to equality as possible. Total profit will be $270 ($480 − $210).
(b) The demand for the firm’s product will decrease until price equals average cost and total profits are
zero.
[text: E pp. 219-221; MI pp. 219-221]
Chapter 11
216
13. Assume that the short-run cost and demand data given in the table below confronts a monopolistic
competitor selling a given product and engaged in a given amount of product promotion. Compare the
marginal cost and marginal revenue of each unit of output and enter these figures in the table.
Output
Total cost
Marginal cost
Quantity demanded
Price
Marginal revenue
Profit
0 $ 50 0 $60 $_____
1 80 $_____ 1 55 $_____ _____
2 120 _____ 2 50 _____ _____
3 150 _____ 3 45 _____ _____
4 170 _____ 4 40 _____ _____
5 185 _____ 5 35 _____ _____
6 205 _____ 6 30 _____ _____
7 235 _____ 7 25 _____ _____
8 275 _____ 8 20 _____ _____
9 325 _____ 9 15 _____ _____
10 385 _____ 10 10 _____ _____
(a) At what output level and at what price will the firm produce in the short run? What will be the total
profit?
(b) What will happen to demand, price, and profit in the long run? How will the market adjust to achieve
this?
Output
Total cost
Marginal cost
Quantity demanded
Price
Marginal revenue
Profit
0 $ 50 0 $60 $ 50
1 80 $30 1 55 $ 55 25
2 120 40 2 50 45 20
3 150 30 3 45 35 15
4 170 20 4 40 25 10
5 185 15 5 35 15 10
6 205 20 6 30 5 25
7 235 30 7 25 −5 60
8 275 40 8 20 −15 115
9 325 50 9 15 −25 190
10 385 60 10 10 −35 285
(a) The firm will produce 5 units at a price of $35. At this price and output level, MC=MR. The firm will
have a loss, or negative profit, of $10.
(b) Demand for the product and the price of the product will increase as firms exit the market due to the
incurred losses. This situation will ultimately increase the demand for the product until price equals
average cost and firms receive normal profits.
[text: E pp. 219-221; MI pp. 219-221]
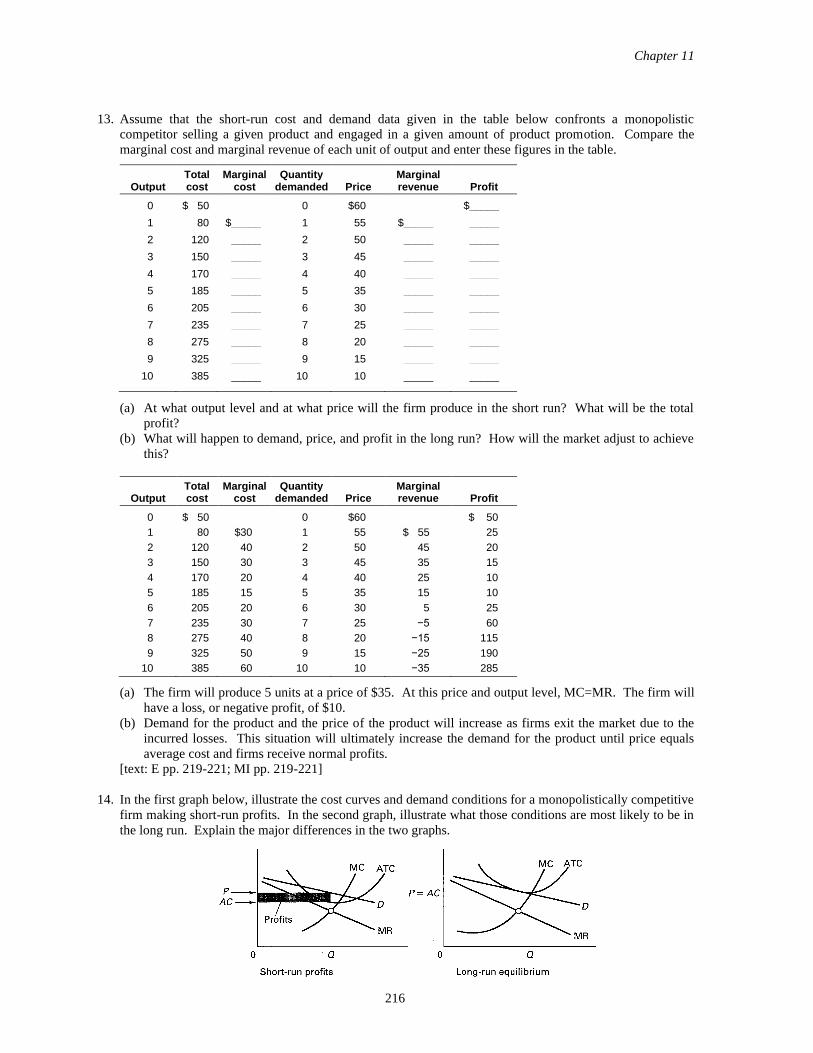
14. In the first graph below, illustrate the cost curves and demand conditions for a monopolistically competitive
firm making short-run profits. In the second graph, illustrate what those conditions are most likely to be in
the long run. Explain the major differences in the two graphs.

Monopolistic Competition and Oligopoly
217
In the short run, the firm can earn economic profits. In the long run, the potential for economic profits will
be reduced as other firms enter the industry or compete more intensively with product differentiation and
development. Only a normal profit is likely to be earned in the long run. Price will also be greater than the
minimum of average cost. [text: E pp. 219-221; MI pp. 219-221]
15. A monopolistically competitive firm is producing 50 units of output in the short run where marginal cost is
$3.00, average total costs are $5.00, price is $4.50, average variable cost is $4.00, and marginal revenue is
$3.00. How much profit is the firm making? What output recommendation would you make for the firm?
The firm should not change the level of output because it is maximizing profits at the output level of 50
where the marginal cost of $3.00 is equal to the marginal revenue of $3.00. At that output, however, the
firm is incurring $0.50 economic losses per unit ($4.50 price minus $5.00 average total cost) for a total
economic loss of $25 ($0.50 times 50 units). The firm cannot operate under these conditions in the long
run and will go bankrupt. [text: E pp. 219-221; MI pp. 219-221]
16. In the short run, a monopolistically competitive firm calculates that marginal cost is $6.00, average total
costs are $4.00, and marginal revenue is $3.00. The firm is charging a price of $6.00 and producing 200
units of output. How much profit is the firm making? What output recommendation would you make as
the company economist?
The firm is not maximizing profits because the marginal cost of $6.00 is greater than marginal revenues of
$3.00. The firm should cut back its production to an output level where marginal cost equals marginal
revenue. At the current output level of 200 units, the firm is making economic profits per unit of $2.00
($6.00 price minus $4.00 ATC) for a total profit of $400. But setting output at where MR = MC, the firm
will reduce output, increase price, and increase economic profits. [text: E pp. 219-221; MI pp. 219-221]
17. If monopolistically competitive firms have some control over their prices, why don’t they set price above
average total cost so they will realize an economic profit in the long run?
Entry is relatively easy in monopolistic competition. If a representative firm is earning economic profits in
the short run, this condition will not persist as new firms enter the industry with the expectation of earning
economic profits. As new firms enter, the demand curve faced by the typical firm will fall and become
more elastic which tends to cause the disappearance of economic profits.
Economic profits might persist in a few cases where product differentiation is very strong, or because some
firm has some sort of permanent advantage such as location or especially effective advertising. [text: E p.
221; MI p. 221]
18. What are two real-world complications with the long-run conclusion about the representative firm in the
model of monopolistic competition?
In the long run, the representative firm in monopolistic competition should break even and earn only a
normal profit. This conclusion, however, may not be true for all firms in the real world. First, economic
profit may accrue in the long run because there may be some degree of monopoly power that is long term.
Some firms may earn some economic profits even in the long run if the firm has a product or service that is
not easy to duplicate or it has an extremely good location. Second, product differentiation creates a
financial barrier to entry that may not be easy to overcome. [text: E p. 221; MI p. 221]
19. “In monopolistically competitive markets neither allocative nor productive efficiency is realized.” Explain.
Price will exceed marginal cost because each firm does not face a perfectly elastic demand curve. This
indicates that society values additional units of these goods more than alternative products, so allocative
efficiency is not realized.
Furthermore, production takes place short of the least-cost output level resulting in higher unit costs than
the minimum attainable. Monopolistically competitive firms tend to be underutilized because there are so
many competitors in the same industry that it is overcrowded with firms. Also, some argue that advertising
Chapter 11
218
is an unnecessary cost of production that contributes to high costs and prices. In other words, productive
efficiency is not realized either. [text: E pp. 221-222; MI pp. 221-222]
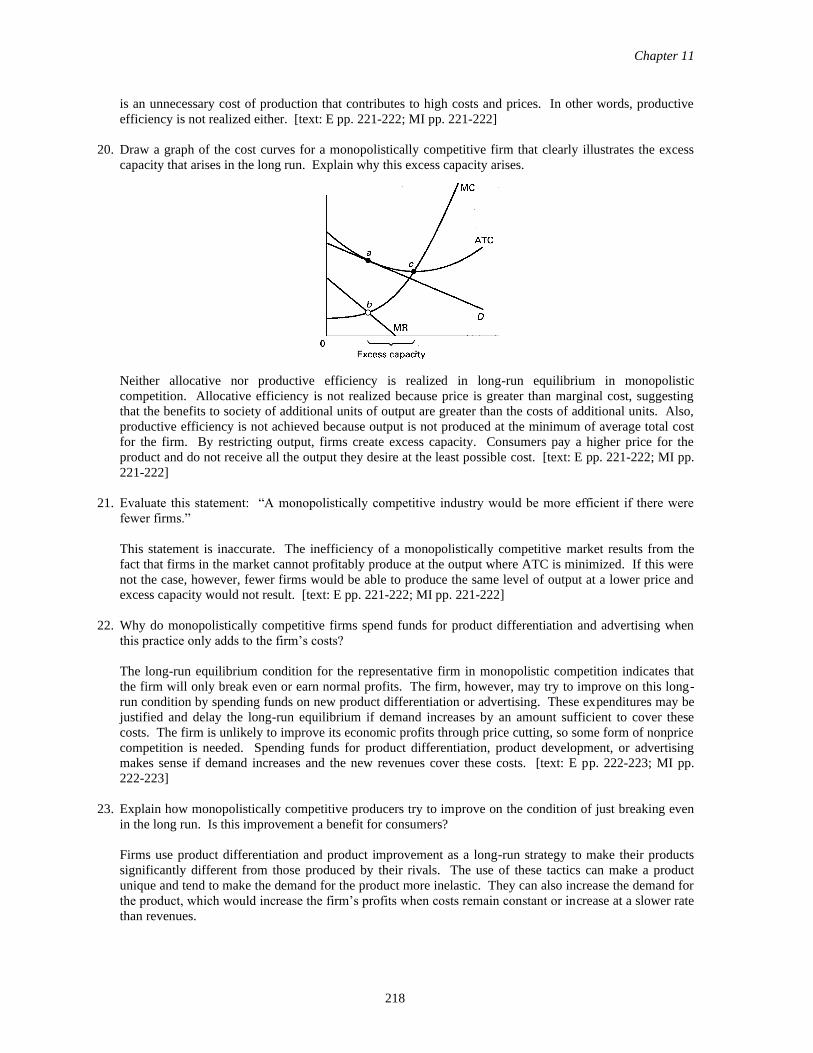
20. Draw a graph of the cost curves for a monopolistically competitive firm that clearly illustrates the excess
capacity that arises in the long run. Explain why this excess capacity arises.
Neither allocative nor productive efficiency is realized in long-run equilibrium in monopolistic
competition. Allocative efficiency is not realized because price is greater than marginal cost, suggesting
that the benefits to society of additional units of output are greater than the costs of additional units. Also,
productive efficiency is not achieved because output is not produced at the minimum of average total cost
for the firm. By restricting output, firms create excess capacity. Consumers pay a higher price for the
product and do not receive all the output they desire at the least possible cost. [text: E pp. 221-222; MI pp.
221-222]
21. Evaluate this statement: “A monopolistically competitive industry would be more efficient if there were
fewer firms.”
This statement is inaccurate. The inefficiency of a monopolistically competitive market results from the
fact that firms in the market cannot profitably produce at the output where ATC is minimized. If this were
not the case, however, fewer firms would be able to produce the same level of output at a lower price and
excess capacity would not result. [text: E pp. 221-222; MI pp. 221-222]
22. Why do monopolistically competitive firms spend funds for product differentiation and advertising when
this practice only adds to the firm’s costs?
The long-run equilibrium condition for the representative firm in monopolistic competition indicates that
the firm will only break even or earn normal profits. The firm, however, may try to improve on this long-
run condition by spending funds on new product differentiation or advertising. These expenditures may be
justified and delay the long-run equilibrium if demand increases by an amount sufficient to cover these
costs. The firm is unlikely to improve its economic profits through price cutting, so some form of nonprice
competition is needed. Spending funds for product differentiation, product development, or advertising
makes sense if demand increases and the new revenues cover these costs. [text: E pp. 222-223; MI pp.
222-223]
23. Explain how monopolistically competitive producers try to improve on the condition of just breaking even
in the long run. Is this improvement a benefit for consumers?
Firms use product differentiation and product improvement as a long-run strategy to make their products
significantly different from those produced by their rivals. The use of these tactics can make a product
unique and tend to make the demand for the product more inelastic. They can also increase the demand for
the product, which would increase the firm’s profits when costs remain constant or increase at a slower rate
than revenues.
Monopolistic Competition and Oligopoly
219
Product differentiation is achieved through differences in product quality and the introduction of new
brands, types, styles, and other forms of nonprice competition. Product improvement encourages
technological innovation and change that makes a product better over time.
Whether product differentiation and product improvement contribute substantially to more consumer
welfare is a debatable question, and there are trade-offs. Consumers will enjoy more choice and variety in
the selection of products under monopolistic competition, but it also creates more excess capacity and
economic inefficiency. [text: E pp. 222-223; MI pp. 222-223]
24. Explain why the economic analysis of monopolistic competition is so complex.
The model of the monopolistically competitive firm as presented in this chapter is a simplification of a
great deal of complexity that is found in this market structure. The monopolistically competitive firm has
some control over the three factors (price, product, and promotion) but there are many combinations of
these factors for a particular firm. The model of the representative firm in monopolistic competition does
not take into account all the combinations or all the degrees to which these factors can be changed. In
addition, the basic model also does not take into account how rivals will react to changes in any one of the
factors. [text: E p. 223; MI p. 223]
25. What are the basic characteristics of oligopoly? How does oligopoly compare with the other market
structures?
Oligopoly exists when just a few large firms dominate a market in contrast to a pure monopoly where one
firm dominates the market. The few firms often have some control over price, but that control is more
limited than in pure monopoly because of the interdependence and some degree of competition in the
industry. Each firm must consider the reactions of rivals when considering changes in output and price.
The barriers to entry that explain why monopoly exists also explain why oligopolies exist. These entry
barriers are the result of economies of scale in an industry where economic efficiency is increased when a
few firms supply output for a market. They can also arise from ownership of patents, exclusive licenses,
substantial control over essential resources, and merger.
As with monopolistic competitors, oligopolies can compete on the basis of price or use nonprice
competition. The role of nonprice competition is most important for differentiated oligopolies that are
found in consumer goods industries producing such products as breakfast cereals, automobiles, camera
film, and cigarettes. Homogeneous oligopolies that produce standardized products would engage in less
nonprice competition although they might compete on the basis of service. Examples of homogeneous
oligopolies would be firms that produce metals (steel, aluminum, or copper) or chemicals. Oligopolies are
common throughout American industry.
The purely competitive firm produces a standardized product at the market price. Unlike oligopoly, the
firm is small in size, there are no interdependencies among firms, the firm has no control over price, and
uses no advertising or nonprice competition. [text: E pp. 223-224; MI pp. 223-224]
26. Evaluate the statement: “A market that produces an identical product cannot be become an oligopoly.”
This statement is incorrect. A number of factors can lead to the creation of an oligopoly, even though the
products produced by the firms are identical. For example, if there are large fixed costs that are involved in
the production of the product or large economies of scale necessary to achieve profits (like in the steel and
aircraft industries), then only a small number of firms may be able to produce and achieve sufficient sales.
Also, mergers of firms in the industry by companies seeking to increase their market share and thus
increase their profits may result in the existence of only a small number of firms in the market. [text: E p.
224; MI p. 224]
Chapter 11
220
27. (Consider This) How is strategic behavior illustrated by the competition among three sellers of native arts and
crafts near a national park?
Each seller must consider the reaction of the rivals to any changes in prices or non-price competition. If one
seller changes prices, the other sellers are likely to change their prices to match. There will be a great deal of
copycat behavior. [text: E p. 224; MI p. 224]
28. What are the shortcomings or limitations of the “four-firm” concentration ratios?
A “four-firm” concentration ratio shows the percentage of output produced by the four largest firms in an
industry. If the four top firms produce over 40% of the output in an industry, the industry is considered to
be oligopolistic. Such concentration ratios have four shortcomings. First, they do not take into account
local conditions. Concentration ratios are estimated for the nation as a whole, but there can be a high
degree of concentration in local markets even when the national concentration ratio is low. Second, there
can be interindustry competition that limits the degree of market power, but this competition will not be
captured by concentration ratios that are based on industry definitions. Third, concentration ratios are
based on domestic output and do not take into account import competition, which can lessen the degree of
market power in domestic industries. Fourth, concentration ratios do not measure the distribution of market
power among the top four firms. A concentration ratio will not distinguish the difference in cases where
two firms or four firms dominate an industry. [text: E pp. 225-226; MI pp. 225-226]
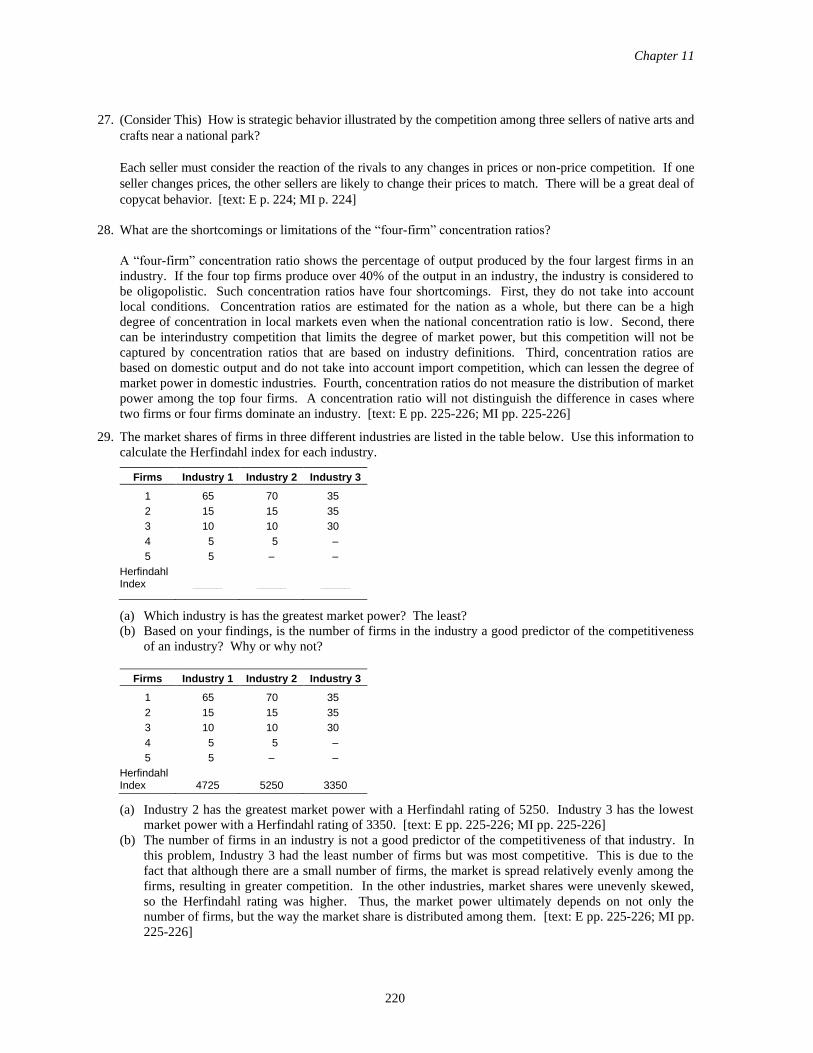
29. The market shares of firms in three different industries are listed in the table below. Use this information to
calculate the Herfindahl index for each industry.
Firms Industry 1 Industry 2 Industry 3
1 65 70 35
2 15 15 35
3 10 10 30
4 5 5 –
5 5 – –
Herfindahl Index _____ _____ _____
(a) Which industry is has the greatest market power? The least?
(b) Based on your findings, is the number of firms in the industry a good predictor of the competitiveness
of an industry? Why or why not?
Firms Industry 1 Industry 2 Industry 3
1 65 70 35
2 15 15 35
3 10 10 30
4 5 5 –
5 5 – –
Herfindahl Index 4725 5250 3350
(a) Industry 2 has the greatest market power with a Herfindahl rating of 5250. Industry 3 has the lowest
market power with a Herfindahl rating of 3350. [text: E pp. 225-226; MI pp. 225-226]
(b) The number of firms in an industry is not a good predictor of the competitiveness of that industry. In
this problem, Industry 3 had the least number of firms but was most competitive. This is due to the
fact that although there are a small number of firms, the market is spread relatively evenly among the
firms, resulting in greater competition. In the other industries, market shares were unevenly skewed,
so the Herfindahl rating was higher. Thus, the market power ultimately depends on not only the
number of firms, but the way the market share is distributed among them. [text: E pp. 225-226; MI pp.
225-226]

Monopolistic Competition and Oligopoly
221
30. What conclusions can be drawn from the game theory view of oligopoly?
There are three basic conclusions that can be drawn. First, firms in an oligopolistic industry are “mutually
interdependent” and must consider the actions of rivals when they make pricing decisions. Second,
oligopoly often leads to overt or covert collusion among the firms to fix prices or to coordinate pricing
because competition often results in lower prices and profits. Collusion can help maintain higher prices
and profits. Third, collusion creates incentives for firms to cheat on collusive agreements because higher
profits can be made if a firm can successfully cheat on an agreement while the other firms maintain their
prices. [text: E pp. 226-227; MI pp. 226-227]
31. Consider the following payoff matrix in which the numbers indicate the profit in millions of dollars for a
duopoly based either on a high-price or a low-price strategy.
Firm A
High-price Low-price
High-price A = $500 B = $500
A = $650 B = $300
Firm B
Low-price A = $300 B = $650
A = $400 B = $400
(a) What will be the result when each firm chooses a high-price strategy?
(b) What will be the result when Firm A chooses a low-price strategy while Firm B maintains a high-price
strategy?
(c) What will be the result when Firm B chooses a low-price strategy while Firm A maintains a high-price
strategy?
(d) What will be the result when each firm chooses a low-price strategy?
(e) What two conclusions can you draw about collusion?
(a) Each firm will earn $500 million in profit for a total of $1000 million for the two firms.
(b) Firm A will earn $650 million and Firm B will earn $300 million. Compared to the high-price
strategy, Firm A has an incentive to cut prices because it will earn $150 million more in profit and
Firm B will earn $200 million less in profit. Together, the firms will earn $950 million in profit, which
is $50 million less than with a high-price strategy.
(c) Firm B has an incentive to cut prices because it will earn $650 million and Firm A will earn $300
million. Compared to a high-price strategy, Firm B will earn $150 million more in profit and Firm A
will earn $200 million less in profit. Together, the firms will earn $950 million in profit, which is $50
million less than with a high-price strategy.
(d) Each firm will earn $400 million in profit for a total of $800 million for the two firms. This total is
$200 million less than with a high-price strategy.
(e) (1) The two firms have a strong incentive to collude and adopt the high-price strategy because there is
the potential for $200 million more in profit for the two firms than with a low-price strategy, or the
potential for $50 million more for the two firms than with a mixed-price strategy.
(2) There is also a strong incentive for each firm to cheat on the agreement and adopt a low-price
strategy when the other firm maintains a high-price strategy because this situation will produce $150
million more in profit for the cheating firm compared to honoring a collusive agreement for a high-
price strategy.
[text: E pp. 226-227; MI pp. 226-227]

Chapter 11
222
32. Consider the following payoff matrix in which the numbers indicate the profit in millions of dollars for a
duopoly based either on a high-price or a low-price strategy.
Firm A
High-price Low-price
High-price A = $150 B = $150
A = $200 B = $ 90
Firm B
Low-price A = $ 90 B = $200
A = $100 B = $100
(a) What will be the result when each firm chooses a high-price strategy?
(b) What will be the result when Firm A chooses a low-price strategy while Firm B maintains a high-price
strategy?
(c) What will be the result when Firm B chooses a low-price strategy while Firm A maintains a high-price
strategy?
(d) What will be the result when each firm chooses a low-price strategy?
(e) What two conclusions can you draw about collusion?
(a) Each firm will earn $150 million in profit for a total of $300 million for the two firms.
(b) Firm A will earn $200 million and Firm B will earn $90 million. Compared to the high-price strategy,
Firm A has an incentive to cut prices because it will earn $50 million more in profit and Firm B will
earn $60 million less in profit. Together, the firms will earn $290 million in profit, which is $10
million less than with a high-price strategy.
(c) Firm B has an incentive to cut prices because it will earn $200 million and Firm A will earn $90
million. Compared to a high-price strategy, Firm B will earn $50 million more in profit and Firm A
will earn $60 million less in profit. Together, the firms will earn $290 million in profit, which is $10
million less than with a high-price strategy.
(d) Each firm will earn $100 million in profit for a total of $200 million for the two firms. This total is
$100 million less than with a high-price strategy.
(e) (1) The two firms have a strong incentive to collude and adopt the high-price strategy because there is
the potential for $100 million more in profit for the two firms than with a low-price strategy, or the
potential for $10 million more for the two firms than with a mixed-price strategy.
(2) There is also a strong incentive for each firm to cheat on the agreement and adopt a low-price
strategy when the other firm maintains a high-price strategy because this situation will produce $50
million more in profit for the cheating firm compared to honoring a collusive agreement for a high-
price strategy.
[text: E pp. 226-227; MI pp. 226-227]
33. (Consider This) What is the Prisoner’s Dilemma? How is this dilemma similar to the one for two firms
competing for market share as described in the text?
Assume there are two people who have committed a crime together and get arrested. The police put each
criminal in a separate cell and interrogate each one. A confession from a criminal will result a lighter
sentence for that criminal. If, however, each criminal does not confess then each criminal will be set free.
The dilemma for each criminal is whether to confess or not. If one criminal confesses, but the other
criminal does not, then the criminal that confesses will get a lighter sentence than the criminal that does not
confess. So each criminal has to make a decision about whether to confess based on what each one thinks
the other one will do. If a criminal is fearful that the other criminal will confess, then the best strategy
would be for that criminal to also confess. As a result, both criminals confess.
The Prisoner’s Dilemma is similar to two firms who must compete for market share using a high-price
strategy or low-price strategy. If both firms choose a high-price strategy, each firm can make more profit
than if both firms adopt a low-price strategy. But there is uncertainty about what the other firm will do that
creates a dilemma. If one firm chooses a low-price strategy and the other firm chooses a high-price

Monopolistic Competition and Oligopoly
223
strategy, then the firm choosing the high-price strategy will be less profitable. So both firms are fearful of
adopting the high-price strategy and having the other firm adopt a low-price strategy. As a consequence,
each firm decides to adopt the low-price strategy. This “low-price and low-price” outcome for the two
firms is similar to the “confess and confess” outcome for the two criminals. [text: E p. 227; MI p. 227]
34. Why is the economic analysis of oligopoly so difficult? What two generalizations can be made about the
pricing behavior of oligopolists?
Oligopoly is hard to analyze because it covers many different market situations. There are both
homogeneous and differentiated oligopolies. The number of firms that dominate oligopolies can vary
substantially, for example from two or three firms to ten firms. Mutual interdependence among rivals also
makes it difficult to estimate a demand curve for a firm. Each firm must consider the reaction of rivals in
establishing its price policy.
Despite the difficulties of analyzing oligopolies, two important generalizations can be made about this
market structure. First, oligopolies tend to have inflexible prices. Second, oligopolies tend to change price
simultaneously. [text: E p. 228; MI p. 228]
35. Describe the essential features of the kinked-demand model of oligopoly pricing.
In the kinked-demand model, there is no collusion. The demand curve for the oligopolist is “kinked”
because when the firm lowers its price, its rivals will lower their prices, and its demand often will be
inelastic. When the firm increases its price, its rivals will not follow with price increases and its demand
will be elastic. The firm, therefore, hesitates to change its price for fear of decreasing its profits. Two
shortcomings of the kinked-demand model are that it does not explain how the going price gets set and
prices are not as inflexible as implied by the model. [text: E pp. 228-230; MI pp. 228-230]
36. The kinked-demand schedule that an oligopolist believes confronts the firm is given in the table below.
Compute the oligopolist’s total revenue at each of the nine prices, and enter these figures in the table. Also
compute marginal revenue for each unit between the nine prices and enter these figures in the table.
Price
Quantity demanded
Total revenue
Marginal revenue per unit
$5.80 50 $_____
5.60 100 _____ $_____
5.40 150 _____ _____
5.20 200 _____ _____
5.00 250 _____ _____
4.80 264 _____ _____
4.60 279 _____ _____
4.40 288 _____ _____
4.20 300 _____ _____
(a) Where is the “kink” in the demand curve? What is the current selling price at that kink and how much
output will be demanded?
(b) What is the range of marginal cost that will keep the price set at the kink?

Chapter 11
224
Price
Quantity demanded
Total revenue
Marginal revenue per unit
$5.80 50 $ 290
5.60 100 560 $ 5.40
5.40 150 810 5.00
5.20 200 1040 4.60
5.00 250 1250 4.20
4.80 264 1267 1.21
4.60 279 1283 1.07
4.40 288 1267 −1.77
4.20 300 1260 −0.58
(a) The “kink” occurs at a price of $5.00 and output of 250 units.
(b) The marginal cost can change from $4.20 to $1.22 and the price will remain at $5.00 and output at 250
units.
[text: E pp. 228-230; MI pp. 228-230]
37. The kinked-demand schedule that an oligopolist believes confronts the firm is given in the table below.
Compute the oligopolist’s total revenue at each of the nine prices, and enter these figures in the table. Also
compute marginal revenue for each unit between the nine prices and enter these figures in the table.
Price
Quantity demanded
Total revenue
Marginal revenue per unit
$17.40 150 $_____
16.80 300 _____ $_____
16.20 450 _____ _____
15.60 600 _____ _____
15.00 750 _____ _____
14.40 792 _____ _____
13.80 837 _____ _____
13.20 864 _____ _____
12.60 900 _____ _____
(a) Where is the “kink” in the demand curve? What is the current selling price at that kink and how much
output will be demanded?
(b) What is the range of marginal cost that will keep the price set at the kink?
Price
Quantity demanded
Total revenue
Marginal revenue per unit
$17.40 150 $ 2,610
16.80 300 5,040 $16.20
16.20 450 7,290 15.00
15.60 600 9,360 13.80
15.00 750 11,250 12.60
14.40 792 11,405 3.70
13.80 837 11,551 3.20
13.20 864 11,405 −5.40
12.60 900 11,340 −1.80
(a) The “kink” occurs at a price of $15.00 and output of 750 units.
(b) The marginal cost can change from $12.60 to $3.71 and the price will remain at $15.00 and output at
750 units.
[text: E pp. 228-230; MI pp. 228-230]
Monopolistic Competition and Oligopoly
225
38. Explain in nontechnical terms why oligopolistic prices may tend to be inflexible.
An oligopolist will hesitate to raise its prices in the absence of collusion because if its rivals do not follow
with price rises of their own the firm will lose market share to these rivals. The oligopolist will also
hesitate to lower its price because it assumes that its few rivals will immediately feel the impact in terms of
lost market share, and they will also have to lower their prices to maintain their market position. Since
each oligopolist will be reluctant to raise or lower prices in the absence of collusion, this leads to inflexible
prices. [text: E p. 230; MI p. 230]
39. Explain the collusive pricing model of oligopoly behavior.
The collusive pricing model is similar to the pure monopolist model of pricing. In this case, firms collude
and act as one firm to set price and output that maximize joint profits of all firms. The methods of
collusion may be overt, as in the OPEC oil cartel, or they may be covert as in “a tacit understanding.”
There are also a number of obstacles to collusion that make it difficult to sustain over time: differences in
demand and costs for firms; the number of firms in an agreement; incentives to cheat; changing economic
conditions; entry by other firms; and legal restrictions and penalties. [text: E pp. 230-231; MI pp. 230-231]
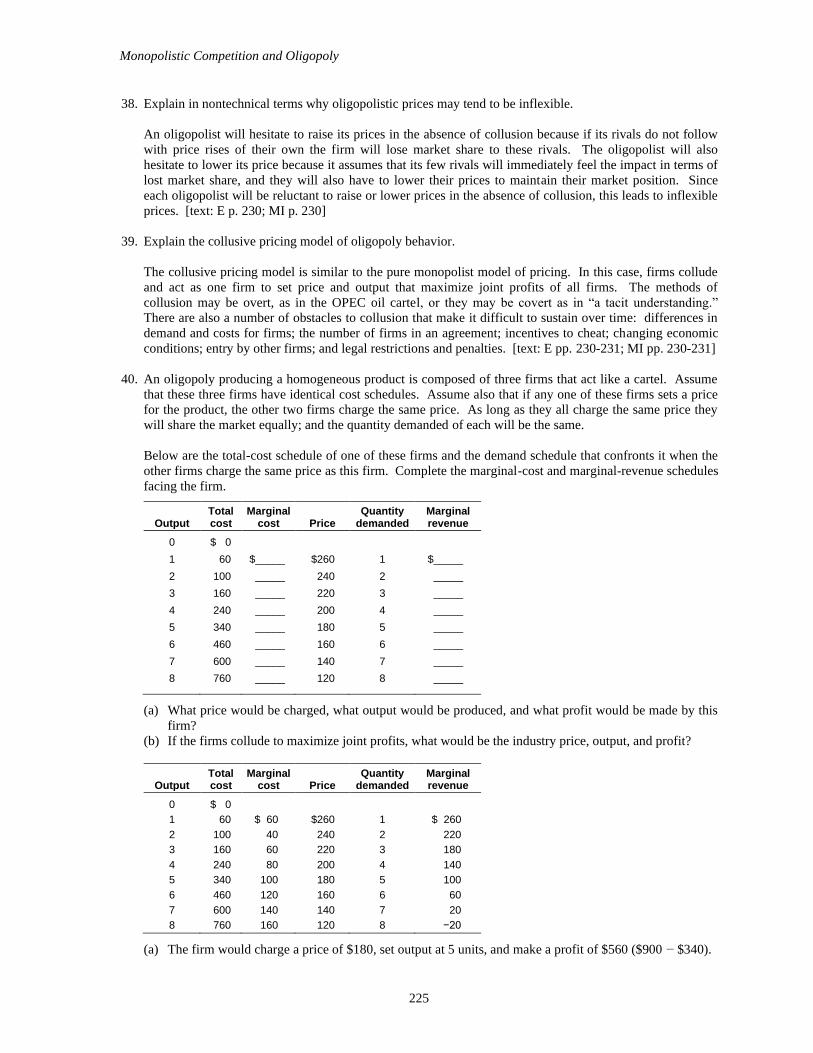
40. An oligopoly producing a homogeneous product is composed of three firms that act like a cartel. Assume
that these three firms have identical cost schedules. Assume also that if any one of these firms sets a price
for the product, the other two firms charge the same price. As long as they all charge the same price they
will share the market equally; and the quantity demanded of each will be the same.
Below are the total-cost schedule of one of these firms and the demand schedule that confronts it when the
other firms charge the same price as this firm. Complete the marginal-cost and marginal-revenue schedules
facing the firm.
Output
Total cost
Marginal cost
Price
Quantity demanded
Marginal revenue
0 $ 0
1 60 $_____ $260 1 $_____
2 100 _____ 240 2 _____
3 160 _____ 220 3 _____
4 240 _____ 200 4 _____
5 340 _____ 180 5 _____
6 460 _____ 160 6 _____
7 600 _____ 140 7 _____
8 760 _____ 120 8 _____
(a) What price would be charged, what output would be produced, and what profit would be made by this
firm?
(b) If the firms collude to maximize joint profits, what would be the industry price, output, and profit?
Output
Total cost
Marginal cost
Price
Quantity demanded
Marginal revenue
0 $ 0
1 60 $ 60 $260 1 $ 260
2 100 40 240 2 220
3 160 60 220 3 180
4 240 80 200 4 140
5 340 100 180 5 100
6 460 120 160 6 60
7 600 140 140 7 20
8 760 160 120 8 −20
(a) The firm would charge a price of $180, set output at 5 units, and make a profit of $560 ($900 − $340).

Chapter 11
226
(b) The three firms have identical costs and demand schedules. They would set price at $180 and produce
15 units (3 firms 5 units). Industry profits would be $1680 (3 $560).
[text: E pp. 230-231; MI pp. 230-231]
41. An oligopoly producing a homogeneous product is comprised of three firms that act like a cartel. Assume
that these three firms have identical cost schedules. Assume also that if any one of these firms sets a price
for the product, the other two firms charge the same price. As long as they all charge the same price they
will share the market equally; and the quantity demanded of each will be the same.
Below are the total-cost schedule of one of these firms and the demand schedule that confronts it when the
other firms charge the same price as this firm. Complete the marginal-cost and marginal-revenue schedules
facing the firm.
Output
Total cost
Marginal cost
Price
Quantity demanded
Marginal revenue
0 $ 0
1 180 $_____ $780 1 $_____
2 300 _____ 720 2 _____
3 180 _____ 660 3 _____
4 720 _____ 600 4 _____
5 1020 _____ 540 5 _____
6 1380 _____ 480 6 _____
7 1800 _____ 420 7 _____
8 2280 _____ 360 8 _____
(a) What price would be charged, what output would be produced, and what profit would be made by this
firm?
(b) If the firms collude to maximize joint profits, what would be the industry price, output, and profit?
Output
Total cost
Marginal cost
Price
Quantity demanded
Marginal revenue
0 $ 0
1 180 $ 180 $780 1 $ 780
2 300 300 720 2 660
3 180 480 660 3 540
4 720 720 600 4 420
5 1020 1020 540 5 300
6 1380 1380 480 6 180
7 1800 1800 420 7 60
8 2280 2280 360 8 −60
(a) The firm would charge a price of $540, set output at 5 units and make a profit of $1680 ($2700 −
$1020).
(b) The three firms have identical costs and demand schedules. They would set price at $540 and produce
15 units (3 firms 5 units). Industry profits would be $5040 (3 $1680).
[text: E pp. 230-231; MI pp. 230-231]
42. What obstacles might a group of oligopolists encounter in forming a cartel or an informal understanding?
First, within the United States both overt and covert forms of collusion are violations of existing antitrust
laws. An informal understanding would be more difficult to detect, and may not face as tough a barrier as
the cartel.
Where cartels are legal, obstacles still exist. Demand and cost differences may make it difficult for
producers to agree on price and market share. The number of producers may make any agreement difficult
to enforce, and in any case, there will be an economic incentive to cheat, which is another obstacle to

Monopolistic Competition and Oligopoly
227
successful collusion. The potential for new entrants into the industry is the last obstacle that tends to inhibit
collusion of both kinds. In this latter regard, a cartel would have more ability to prevent potential entrants
than a simple informal understanding and so has more chance for success in overcoming this obstacle.
[text: E pp. 232-233; MI pp. 232-233]
43. Explain why there is an incentive to cheat in collusive oligopoly. How does such behavior threaten
collusive oligopoly over time?
If a collusive oligopolist wants to increase sales and profit, then one way to do so would be to make secret
deal with buyers. If, however, other buyers became aware of such arrangements they may demand the
same terms from their suppliers, who are also collusive oligopolists. As buyers try to obtain concessions
from their suppliers, the price for all collusive obligopolists gets undercut. Cheating only works well in a
collusive oligopoly when the cheating is difficult to detect and punish. [text: E p. 232; MI p. 232]
44. What is the price leadership model of oligopoly pricing and what are its tactics?
Price leadership is a covert and generally legal form of collusion in which one firm traditionally initiates
price changes and the other firms in the industry follow the lead. Three price leadership tactics have been
observed. First, price adjustments tend to be made infrequently and only as cost and demand conditions
change to a significant degree. Second, the price leader will announce price changes through speeches,
announcements, or other such activities to solicit a consensus. Third, the going price may not maximize
profit in the short run for the firms in the industry, especially if the firms want to prevent entry by other
firms. [text: E p. 233; MI p. 233]
45. Why is there emphasis on nonprice competition in oligopoly?
The reasons stem from two basic facts. First, nonprice competition is less likely to get out of hand than is
price competition. Price competition among oligopolists can lead to costly price wars because any price
change can be easily matched by a rival firm. Nonprice competition is less easy to duplicate and may give
an oligopolist a temporary or permanent advantage over a rival. The areas for nonprice competition might
entail product changes, improved production or services, or advertising campaigns. Second, oligopolies
have greater financial resources to invest in nonprice competition in such areas as product development or
advertising. Oligopolists have more resources than monopolistic competitors to engage in this type of
competition for long periods of time. [text: E p. 234; MI p. 234]
46. Describe the positive and negative views of the economics of advertising.
The arguments over advertising focus on three major questions: (a) Is advertising persuasion or
information? (b) Does advertising promote monopoly power or competition? (c) Does advertising
contribute to economic waste or economic efficiency?
In the positive view, advertising gives consumers information about product characteristics and prices that
help them make more rational purchases, and promotes consumer welfare by reducing “search” costs.
Advertising also gives firms the ability to compete with other firms for market share, thereby promoting
rather than restricting competition. This increased competition increases awareness of substitute products,
reduces each firm’s product demand, and makes the demand curve more elastic. Overall, advertising
contributes to economic efficiency by reducing consumer search costs and creating awareness of other
products, by promoting more competition among firms, and by permitting the introduction of new
technology. More competition contributes to the realization of allocative and productive efficiency.
In the negative view, advertising manipulates consumer demand through persuasion. It also creates “brand
loyalty” that makes the demand curve more inelastic, and fosters monopoly power among the successful
firms in an industry. Advertising is also criticized for being wasteful, and for preventing the realization of
both allocative and productive efficiency. Advertising can also be self-canceling or offsetting, and thus a
waste of resources. [text: E pp. 234-235; MI pp. 234-235]

Chapter 11
228
47. “Purely competitive firms sell their product at the same price. This is also true in some oligopolistic
markets with standardized products. Therefore, these oligopolies are actually highly competitive.”
Evaluate critically.
These oligopolies are rivals, but they are not competitive in the economic sense that leads them to produce
at the most efficient price and output level. Production takes place at an output level where MR = MC, but
price will be above MR so the firm will earn economic profits, and allocative efficiency will not be
achieved. Furthermore, the lack of competition may mean that the firm is not forced to produce at the point
of minimum average cost, so productive efficiency is not achieved.
Purely competitive industries, on the other hand, achieve both productive and allocative efficiency, because
competition brings price and output to the level where production is at minimum average cost and
economic profits disappear.
It might be pointed out that monopolies also sell their product at a single price, but that does not make a
monopoly highly competitive. [text: E pp. 234-235; MI pp. 234-235]
48. What are three qualifications to the view that allocative and productive efficiency are not realized in
oligopoly?
Oligopoly is thought to be allocatively and productively inefficient because price will exceed marginal cost
and output will be less than the minimum average-cost level of output. One qualification to this view is
that foreign competition has made many oligopolistic industries much more competitive when viewed on a
global scale. A second qualification is that oligopolistic firms may keep prices lower in the short run to
deter entry of new firms. A third qualification is that oligopolistic industries tend to foster more rapid
product development and improvement in production than if the industry were purely competitive. The
oligopolists have more funds for research and development and the barriers to entry can protect the firm’s
investment. Thus oligopoly may have some redeeming virtues that offset its apparent inefficiencies. [text:
E p. 235; MI p. 235]
49. Compare pure competition, pure monopoly, monopolistic competition, and oligopoly on each of the
following points:
(a) Ability to manipulate price.
(b) Flexibility of prices.
(c) Expenditures on advertising and sales promotion.
(d) Efficiency in allocation of resources.
(a) Firms have least ability to manipulate price in pure competition, some ability in oligopoly depending
on conditions, a slight ability under monopolistic competition, and total ability in a monopoly. [text:
pp. 218-219, 221, 224, 230, 233-235; MI: pp. 218-219, 221, 224, 230, 233-235]
(b) Prices would be most flexible under monopolistic competition and pure competition. Under pure
competition, prices would change only if market demand or supply conditions changed, but the firm
would not have control over this flexibility. Prices under oligopoly would not be flexible; rather
output adjustments would tend to be made to changing demand conditions. Monopoly prices could be
flexible in response to changing demand or cost conditions. [text: pp. 218-219, 221, 224, 230, 233-
235; MI: pp. 218-219, 221, 224, 230, 233-235]
(c) Purely competitive firms would spend virtually nothing on advertising. Monopolistic competitors and
oligopolies with differentiated products would spend the most. Monopolies would probably spend a
slight amount on informational or goodwill advertising. [text: E text: pp. 218-219, 221, 224, 230, 233-
235; MI: pp. 218-219, 221, 224, 230, 233-235]
(d) Productive and allocative efficiency are achieved only under conditions of pure competition, with the
qualification that in some industries, economies of scale dictate some other market model to achieve
efficiency. Among the other three models, it would depend on the circumstances. In a regulated,
natural monopoly, efficiency may nearly be achieved. In monopolistic competition without excessive
advertising, and in oligopolies realizing economies of scale, efficiency may be attained. [text: E text:
pp. 218-219, 221, 224, 230, 233-235; MI: pp. 218-219, 221, 224, 230, 233-235]

Monopolistic Competition and Oligopoly
229
50. (Last Word) Describe the major demand and supply factors that have turned the beer industry into an
oligopoly over the years.
In 1947 there were 400 independent brewers in the U.S., but today the two major brewers account for over
70% of the market. One reason for this change is that demand changed. Preferences shifted from stronger-
flavored beers to lighter, dryer products. Consumption also shifted from taverns to homes, which resulted
in a different kind of packaging. On the supply side, technology changed and produced significant
economies of scale that now constitute a barrier to entry. Although mergers have occurred, they are not the
fundamental cause of increased concentration. Advertising and product differentiation have been important
in the growth of some firms and as a way to create market dominance. [text: E pp. 236-237; MI pp. 236-
237]
Chapter 11
230
C. Appendix Questions
51. Define a simultaneous one-time game.
52. What are the differences among positive-sum, negative-sum, and zero-sum games?
53. Describe and give an example of a dominant strategy.
54. Is a Nash equilibrium stable? Explain.
55. How does the use of credible threats or empty threats by firms affect outcomes and the Nash equilibrium in
one-period games?
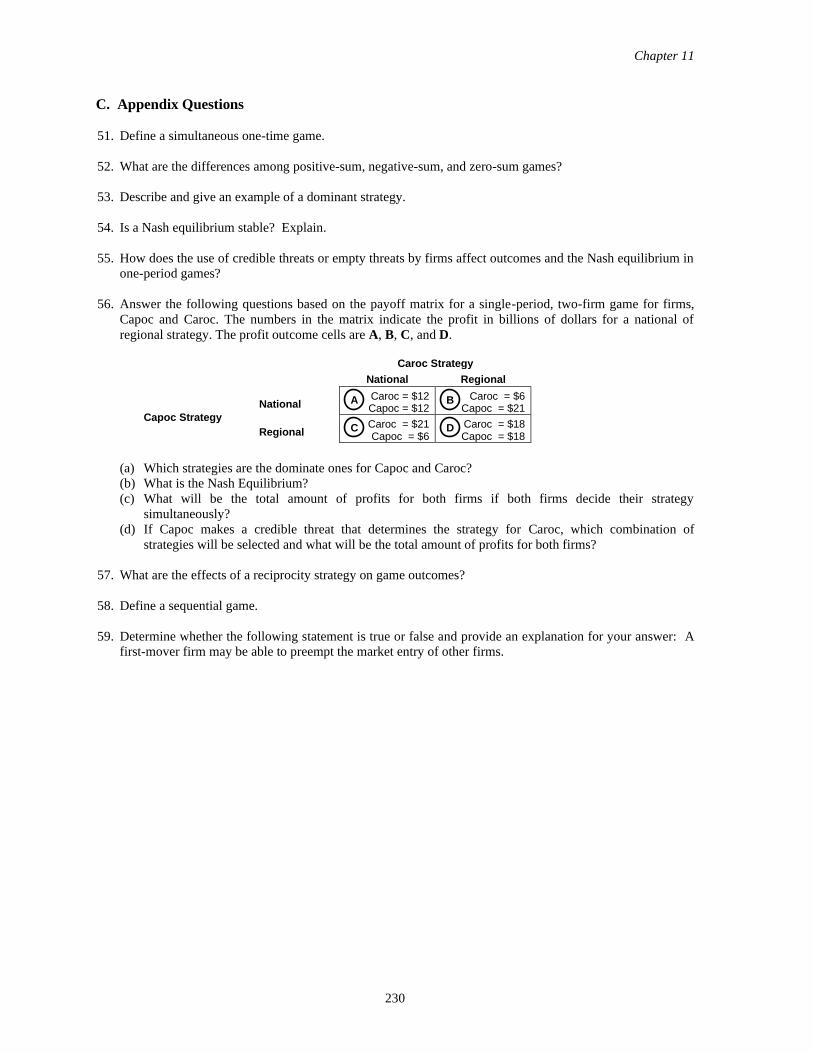
56. Answer the following questions based on the payoff matrix for a single-period, two-firm game for firms,
Capoc and Caroc. The numbers in the matrix indicate the profit in billions of dollars for a national of
regional strategy. The profit outcome cells are A, B, C, and D.
Capoc Strategy
(a) Which strategies are the dominate ones for Capoc and Caroc?
(b) What is the Nash Equilibrium?
(c) What will be the total amount of profits for both firms if both firms decide their strategy
simultaneously?
(d) If Capoc makes a credible threat that determines the strategy for Caroc, which combination of
strategies will be selected and what will be the total amount of profits for both firms?
57. What are the effects of a reciprocity strategy on game outcomes?
58. Define a sequential game.
59. Determine whether the following statement is true or false and provide an explanation for your answer: A
first-mover firm may be able to preempt the market entry of other firms.
Caroc Strategy
National Regional
National Caroc = $12 Capoc = $12
Caroc = $6 Capoc = $21
Regional Caroc = $21 Capoc = $6
Caroc = $18 Capoc = $18
A B
C D
Monopolistic Competition and Oligopoly
231
D. Answers to Appendix Questions
51. Define a simultaneous one-time game.
A simultaneous one-time game is one where firms select their optimal strategies at the same time and in a
single time period without regards to future interactions. [text: E p. 241; MI p. 241]
52. What are the differences among positive-sum, negative-sum, and zero-sum games?
A positive-sum game is a game in which the sum of the outcomes derived from the strategic decisions of
two firms is positive. For example, a positive-sum game will result in positive combined profits for two
companies deciding and executing their best price strategies. Notice that a positive-sum game is concerned
with the combined outcomes, making it possible for one of the firms to actually incur losses. In contrast, a
zero-sum game is one where the net gain is zero because the loss of one firm equals the gains of the other
firm. Finally, a negative-sum game is a strategic game where the sum of the firms’ outcomes is negative.
Notice again that a negative-sum game is concerned with the combined outcomes, making it possible for
one of the firms to actually incur gains. [text: E p. 241; MI p. 241]
53. Describe and give an example of a dominant strategy.
A dominant strategy is a game theory option that is better than any alternative option regardless of what the
other firm does. Figure 1 (p. 241) is a perfect example of a situation where a company will follow a
dominant strategy. For example, Dramco will always choose the international option regardless of Chico’s
strategy. [text: E p. 241; MI p. 241]
54. Is a Nash equilibrium stable? Explain.
A Nash equilibrium is stable because it is the only outcome from which none of the participants in a
strategic game wants to deviate. At the Nash equilibrium, the participants of a strategic game see their
current option as optimal given the other firm’s strategic choice, thus making it stable and persistent once
achieved. [text: E p. 241; MI p. 241]
55. How does the use of credible threats or empty threats by firms affect outcomes and the Nash equilibrium in
one-period games?
A credible threat is a statement of coercion that is believable by the other firm. An empty threat is a threat
that is not believable by the threatened firm. If there is a credible threat in a single-period and simultaneous
game, then it can cause the firms to abandon the Nash equilibrium to enjoy larger profits. It is, however,
difficult to enforce such a threat and if it is not credible, it is an empty threat. Empty threats result in Nash
equilibriums that do not change. [text: E pp. 241-242; MI pp. 241-242]
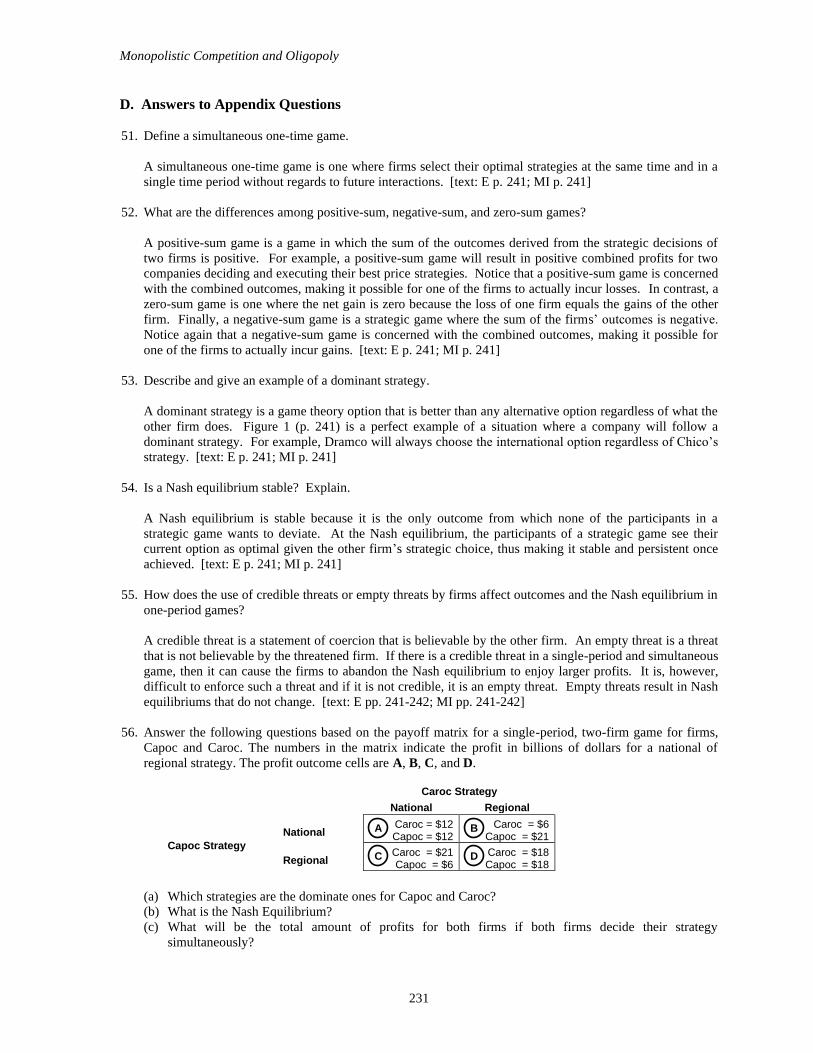
56. Answer the following questions based on the payoff matrix for a single-period, two-firm game for firms,
Capoc and Caroc. The numbers in the matrix indicate the profit in billions of dollars for a national of
regional strategy. The profit outcome cells are A, B, C, and D.
Capoc Strategy
(a) Which strategies are the dominate ones for Capoc and Caroc?
(b) What is the Nash Equilibrium?
(c) What will be the total amount of profits for both firms if both firms decide their strategy
simultaneously?
Caroc Strategy
National Regional
National Caroc = $12 Capoc = $12
Caroc = $6 Capoc = $21
Regional Caroc = $21 Capoc = $6
Caroc = $18 Capoc = $18
A B
C D

Chapter 11
232
(d) If Capoc makes a credible threat that determines the strategy for Caroc, which combination of
strategies will be selected and what will be the total amount of profits for both firms?
(a) The dominant strategy for Capoc and Caroc is to always choose the national strategy.
(b) The Nash equilibrium takes place at the profit outcome cell A, where both companies chose a national
strategy.
(c) The total amount of profits for both firms will take place at the Nash equilibrium and will be equal to
$24 billion.
(d) The strategy selected by both firms will be to go regional and the total amount of profits will be $36
billion. [text: E pp. 241-242; MI pp. 241-242]
57. What are the effects of a reciprocity strategy on game outcomes?
Reciprocity can improve game outcomes for the participants of repeated games. In such games, the
optimal strategic option for a firm may be to limit competition with another firm, if the other firm
reciprocates by limiting its competition. This reciprocity has the effect of increasing the firms’ profits.
[text: E pp. 242-243; MI pp. 242-243]
58. Define a sequential game.
A sequential game is a type of strategic game in which one player moves first and commits to a strategy
that is then taken into consideration by the other player before making a decision. Sequential games tend to
favor the first mover because this player has the opportunity to determine a Nash equilibrium that works to
his/her advantage. [text: E pp. 243-244; MI pp. 243-244]
59. Determine whether the following statement is true or false and provide an explanation for your answer: A
first-mover firm may be able to preempt the market entry of other firms.
It is true that a first-mover firm may be able to preempt the market entry of other firms. A first-mover
advantage takes place in sequential games where one player moves first and commits to a strategy that is
then taken into consideration by the other player before making a decision. The firm that moves first can
take advantage of this option and choose a strategy that is only profitable for that firm, thus forcing the
other firm out of the market. Firms such as Wal-Mart and Krispy Crème Donuts are well known for using
this strategy and forcing competitors out of business. [text: E pp. 243-244; MI pp. 243-244]