chapter 10 statistical inference for two samples twice as much fun as one sample
TRANSCRIPT

Chapter 10 Statistical Inference for Two
Samples
Twice as much fun as one sample

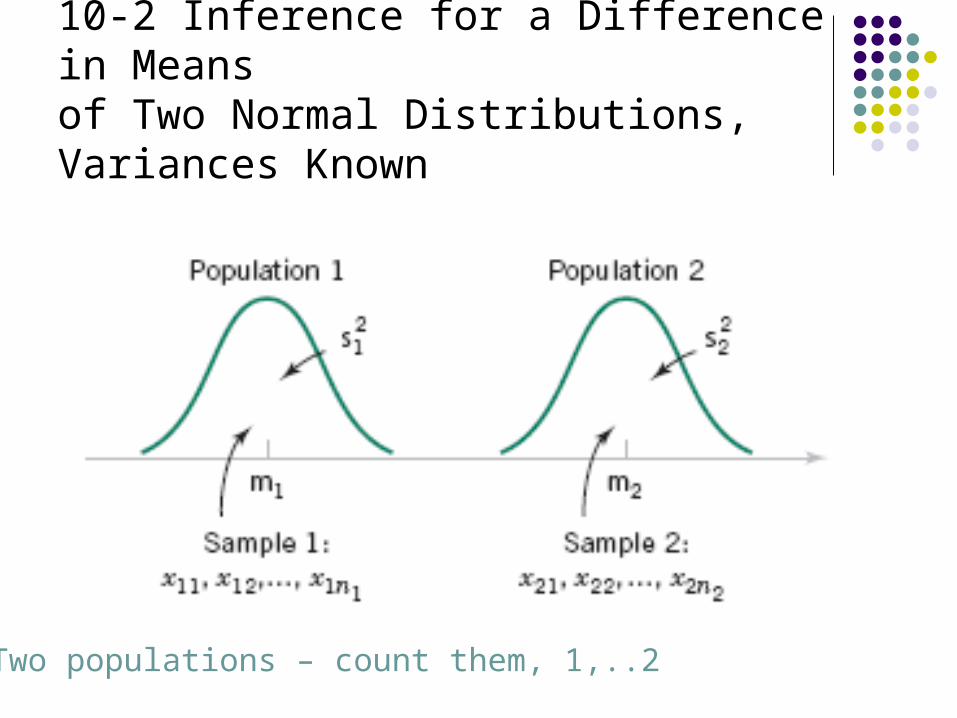
10-2 Inference for a Difference in Means of Two Normal Distributions, Variances Known
Two populations – count them, 1,..2

More on Two Normals
Assumptions

Oh yes, the test statistic

Example 10-1

Example 10-1

Example 10-1

10-2.2 Type II Error and Choice of Sample Size
Two-sided alternative:
One-sided alternative:
Now go to the Operating Characteristic Curves (VIIa-d)

Sample Size Formulas

Example 10-3

10-2.3 Confidence Interval on a Difference in Means, Variances Known

CI Example 10-4

Other Useful Formulae
Upper Confidence Bound
Lower Confidence Bound
Choice of Sample Size

10-3.1 Hypotheses Tests for a Difference in Means, Variances Unknown
Case 1: 22
221

The Two-Sample or Pooled t-Test

Example 10-5
We must do a difference of
means test on this data.

Example 10-5

Example 10-5

Minitab Output for Example 10-5

10-3.2 Type II Error and Choice of Sample Size

Chart VII(e)d = .74 = .15
d = .74
= .15

10-3.1 Hypotheses Tests for a Difference in Means, Variances Unknown
22
21 Case 2:
is distributed approximately as t with degrees of freedom given by
22 21 2
1 22 22 2
1 2
1 2
1 2
d.f.
1 1
S Sn n
S Sn n
n n

Example 10-6

The Data in a Normal Prob Plot

Example 10-6 (steps 1-5)

Example 10-6 (steps 6- 8)

Mean of Two Normal Distributions – Variance Unknown – Confidence Intervals
Case 1:
222
21

Mean of Two Normal Distributions – Variance Unknown – Confidence Intervals
Case 2:
22
21

The Next Example Louie Lush has collected the following data concerning the number
of ounces of beer consumed per week by the typical UD student and the typical Wright-State student.
Assuming the population variances are equal construct a 90% confidence interval for the difference in mean beer consumption between the two schools.
Data: Ounces per student per week
Wright State Univ of DaytonSample mean 60.4 65.3Sample Variance 31.4 44.82Sample size 10 12
.05,22 2 1.725
9 31.4 11 44.821 160.4 65.3 1.725 9.5, .30
10 12 22 2
t
PooledVariance:

More Next Example Wright State Univ of Dayton
Sample mean 60.4 65.3Sample Variance 31.4 44.82Sample size 10 12
UnequalVariances:
2 2
2 2
.05,19
31.4 44.8210 12
19.996 1931.4 /10 44.82 /12
9 111.7291
31.4 44.8260.4 65.3 1.7291 9.4338, .36617
10 12
v
t
If you are interested in establishing a tavern near one of the two campus which one would you choose?

On to Excel…then Minitab
These 2-sample tests are great but what
can Excel do for me?
To the Ever Excellent Excel Examples

Happiness is working a stat problem.
Next Class
I always work all the
problems in the book.