chapter 1 what is science? process skillswaeagles220.weebly.com/uploads/8/4/3/7/8437155/2017... ·...
TRANSCRIPT

1
Chapter 1
What is Science?
+
Process Skills

2
Chapter 1: What is Science? Specific Performance Objectives The students will be able to:
A. Lab Safety 1. List lab safety rules 2. Understand what is safe and unsafe behavior in a laboratory setting 3. Describe the rationale behind each safety rule
B. Using Numbers in Science
1. Understand the importance of using units with measurements 2. Describe the difference between accuracy and precision 3. Explain the importance to practice both accuracy and precision during data collection 4. Be able to round numbers, especially to the nearest tenth, hundredth, and thousandth places 5. Perform calculations using mean, median, and mode
C. Metric Measurement
1. Justify the need for standard measurement in science. 2. Describe the process of calibration. 3. Explain what is being measured, the metric units used for measurement, metric abbreviations,
and tools needed for measurement in terms of length, volume, mass, weight, force and temperature.
4. Convert common forms of metric units. 5. Read a measuring instrument accurately by estimating the last digit. 6. Appreciate the fact that no measurement is exact. 7. Select the appropriate tool for measuring length, volume, mass, force, weight and temperature.
D. Observations and Inference
1. Learn about the skills that scientists use to learn about the world 2. Define observation and inference. 3. Compare and contrast observations and inferences. 4. Demonstrate the skill of observing a given event and/or object. 5. Distinguish between a qualitative observation and a quantitative observation. 6. Make appropriate inferences based on the observation(s). 7. Communicate the extent of risk involved in making inferences.
D. Variables 1. Develop a list of potential variables for any given event. 2. Differentiate between the three types of variables. 3. Identify the three types of variables in an investigation. 4. Identify levels of the independent variable and how they should be measured. 5. Identify methods of measuring the dependent variable.

3
E. Scientific Method
1. List the steps of the scientific method 2. Give examples to illustrate how each step of the scientific method is conducted 3. Design and conduct an experiment using the scientific method
F. Prediction
1. Distinguish between observation, inference and prediction. 2. Construct predictions based on observed patterns of evidence.
G. Hypotheses
1. Define a hypothesis. 2. Explain why variables are important in the process of hypothesizing. 3. Write a hypothesis using two variables.
H. Operational Definitions
1. Describe an operational definition. 2. Given an independent variable, select a suitable operational definition for it.
3. Given a description of an investigation, identify possible variables and identify how the variables
are operationally defined.
I. Data Tables and Graphs 1. Identify, name and demonstrate proper placement of the basic components of a data table and
graph. 2. Construct both simple and complex data tables. 3. Discuss the reasons for performing repeated trials in an experiment. 4. Compare and contrast quantitative (continuous) and qualitative (discrete) variables. 5. Select the appropriate graph (bar vs. line) to construct based on the independent variable. 6. Use an appropriate scale for graphical representation of data by finding the counting numbers
based on data table information. 7. Graph both descriptive and continuous data. 8. Demonstrate ability to draw a “best-fit” line or curve. 9. Given a graph, identify the relationship between the variables. 10. Identify data that support or conflict with a hypothesis. 11. Interpolate and extrapolate data presented graphically and compare their results.
J. Conclusions 1. Formulate a conclusion based on recorded data and graph information. 2. Write conclusions using two variables.

4
LAB SAFETY SYMBOLS AND THEIR MEANINGS

5
LAB EXPECTATIONS: Directions: Find the Lab safety Rules in the classroom and copy them down on your sheet.
1. ______________________________________________________________________________
2. ______________________________________________________________________________
3. ______________________________________________________________________________
4. ______________________________________________________________________________
5. ______________________________________________________________________________
6. ______________________________________________________________________________
7. ______________________________________________________________________________
8. ______________________________________________________________________________
9. ______________________________________________________________________________
WHAT’S WRONG WITH THIS PICTURE? Directions: Write at least two things that should not be occuring in the following pictures.
__________________________________________ ___________________________________________
__________________________________________ ___________________________________________
__________________________________________ ___________________________________________
__________________________________________ ___________________________________________
__________________________________________ ___________________________________________

6
Recognizing Laboratory Safety Directions: In each of the following situations, write “yes” if the proper safety procedures are being followed and “no” if they are not. Then, give a reason for your answer.
1. Gina is thirsty. She rinses a beaker with water, refills if with water, and takes a drink.
_____________________________________________________________________________________
_____________________________________________________________________________________
2. Bram notices that the electrical cord on his microscope is frayed near the plug. He takes the microscope to his teacher and asks for permission to use another one. _____________________________________________________________________________________
_____________________________________________________________________________________
3. The printed directions in the lab book tell a student to pour a small amount of hydrochloric acid into a beaker. Jamal puts on safety goggles before pouring the acid into the beaker. _____________________________________________________________________________________
_____________________________________________________________________________________
4. It is rather warm in the laboratory during a late spring day. Anna slips off her shoes and walks barefoot to the sink to clean her glassware. _____________________________________________________________________________________
_____________________________________________________________________________________
5. While washing glassware, Mike splashes some water on Evan. To get even, Evan splashes him back.
_____________________________________________________________________________________
_____________________________________________________________________________________
6. During an experiment, Lindsey decides to mix two chemicals that the lab procedure does not say to mix, because she is curious about what will happen. _____________________________________________________________________________________
_____________________________________________________________________________________

7
Rounding figures
To properly round, look at the number to the right of the decimal place you want to round to. If that number is more than 4, simply add “1” to the preceding number. If the number is 4 or smaller, leave the preceding number alone. Round the following numbers to the decimal places indicated in the table.
NUMBER
Round to 3 decimal places
(thousandths)
NUMBER
Round to 2 decimal places
(hundredths)
NUMBER
Round to 1 decimal place
(tenths)
8.3144 1.389 0.949
0.0137 1.24 1.24
412.0659 0.0019 1.290001
2.238507 0.01149 1.25
0.61582 9.9949999 0.00999999
0.0010999 0.0144 0.04
12.49992 0.00145 0.09999999
9.9994999 0.145 0.555
0.0228 0.113 2.09
9.9995999 0.784 1.04999999
12.04999 1.0009 2.95
0.000007 0.785 1.059898989
0.00049999 12.98465 2.94
0.0019 29.1945 0.123
15.000765 0.004999 0.15

8
Mean, Median, Mode To find the mean of several numbers, add the numbers then divide by how many numbers you added. It must always be somewhere between your lowest and your highest number. Find the mean and round off your answers to the nearest hundredth then place To find the median, rearrange numbers from smallest to largest. The median is in the middle of the ordered list. To find the mode, look for the number that appears the most in the given set of numbers.
NUMBERS
MEAN
NUMBERS
MEAN
7, 9, 13 12, 14, 14
26, 17, 22 6.7, 8.1, 7.3
8, 4, 12 7, 9, 14, 5
3.1, 3.8, 2.9, 4.2 4.01, 6.98, 7.2, 2.0006
3.2, 1.3, 2.0 21.07, 20.22, 22.21
2.5, 3.4, 4.2, 5.1, 6.0 94.23, 97.53, 89.42, 90.91
0.002, 0.003, 0.002, 0.005 46.9, 62.11, 57.8, 53.99
NUMBERS MEDIAN NUMBERS MEDIAN 45, 81, 73, 90, 81, 79, 84 44.1, 44.78, 44.902, 44.65
0.05, 0.05, 0.06, 0.03, 0.08 56, 77.7, 62.8, 69.4, 60, 44
4, 4, 3, 2, 2, 1, 5, 8 110.55, 100.4, 109, 114.59
NUMBERS MODE
NUMBERS MODE 5.5, 6.1, 5.7, 6.3, 5.5, 5.8 4, 3, 4, 5, 1, 4, 3, 2, 4, 5
0.07, 0.7, 0.007, 0.07
9, 8, 9.9, 9.4, 8.9, 9.1, 9.4
42, 43, 45, 44.99, 43, 41
10, 10.5, 10.55, 10.555, 10.5

9
Metric Matrix
Measurement Definition
Standard Unit &
Abbreviation
Instrument(s) used
to Measure
Photo of a sample
object measured with
this unit
Force
Weight
Mass
Length
Volume
Temperature

10
PRACTICE: Measuring Directions: Answer the following questions about LENGTH
1. What is the definition of length? ____________________________________________________________
2. What is the standard metric unit for length? ___________________________________________________
3. Name 2 tools used to measure length. _______________________________________________________
4. How many millimeters long is Line A? _______________________________________________________
5. How many centimeters long is Line A? _______________________________________________________
6. How many millimeters long is Line B? _______________________________________________________
7. How many centimeters long is Line B? _______________________________________________________
8. How many millimeters long is Line C? _______________________________________________________
9. How many centimeters long is Line C? ______________________________________________________
Directions: Answer the following questions about VOLUME
1. What is the definition of volume? ___________________________________________________________
2. What is the standard metric unit for volume? __________________________________________________
3. Name 2 tools used to measure volume. ______________________________________________________
4. When measuring liquid volume, always measure at the bottom of the _______________________________

11
5. What is the volume of liquid shown in the first four graduated cylinders below? What is the total volume in the fifth
graduated cylinder?
_____________ _____________ ______________ ______________ ______________
6. If the diagrams for Graduated Cylinder 4 and 5 show the same graduated cylinder before and after the rock was
added, what is the volume of the rock? __________________________________________________
7. Why is it important to examine the unnumbered marks on a graduated cylinder before making a reading between the
unnumbered lines?
Directions: Answer the following questions about MASS
1. What is the definition of mass? ___________________________________________________________
2. What is the standard metric unit for mass? ______________________
3. Name the tool used to measure mass. ___________________________________________
4. The mass of the container holding this soil sample is 3 g. What is the mass of the soil sample? __________
5. What is the mass of the soil sample if the combines mass of
the soil sample and the container is 97 g and the mass of
the container is 15 g? ________________________
6. If you were measuring the mass of a 256 g object on a
triple-beam balance, what would the middle beam read?
______________________________

12
Metric Conversions Would you tell someone you traveled 4,500 meters to visit a friend in the next town? Of course
not! An easier way to express that distance would be about 4.5 kilometers. It is still the same
distance but it makes much more sense. Would you say the length of your science folder is
about 0.24 meters or 24 centimeters? Metric conversions can be used to express
measurements in more appropriate terms. The measurements stay the same, but the units
make more sense.
To help make converting even easier, you can use the Metric Stepping Scale to know how
many decimal places to move to the left or right.
Convert the following to more appropriate terms.
1.) 0.0003 km = ______________ m
2.) 45,830 g = _______________ kg
3.) 0.000078 km = _____________ cm
4.) 9,845 mg = ______________ g
5.) 0.68 L = ________________ mL
6.) 0.6875 dm = ___________________ mm
7.) 6,582 cL = ____________________ L
8.) 5,783 m = ____________________ km
9.) 0.00057 kg = __________________ cg
10.) 0.052 m = ___________________ mm

13
SKILL DEVELOPMENT: THINKING METRIC
Fill in the blanks with the correct unit. You may use the proper abbreviations.
A. milliliter (mL) B. liter (L) C. gram (g) D. kilogram (kg) E. millimeter (mm) F. centimeter (cm) G. meter (m) H. kilometer (km) I. degrees Celsius (oC)
It was a beautiful day. The temperature was a mild 27 _____. Little Millie Metric was packing a lunch basket to take
to Grandma's house. She carefully poured 500 _____ of homemade lemonade into a bottle, which she put in the
basket. Then she placed 0.5 _____ of cheese, 200 _____ of roast beef, and several large cookies in the basket.
She strapped the basket on the back of her moped and took a quick check of the gas tank. There were several
_____ of gasoline left.
After traveling a little more than 5 _____, Millie discovered she had lost her way. At the next corner she spotted a
very hairy character leaning against a lamppost. He looked to be only 1.5 _____ tall. He had a wolfish grin and
dark, piercing eyes. He introduced himself as Mr. W and offered to help Millie.
Mr. W's directions turned out to be the long way to Grandma's house. So Millie arrived an hour late. She let herself
in and found Grandma in bed. Grandma did not look well. Had she always been so hairy? And those ears! "My
goodness, " Millie gasped, "what big ears you have, Grandma - at least 15 _____." To which Grandma replied, "The
better to hear you, my dear." Then Millie spotted the teeth. "My, Grandma, what big teeth you have - longer than 25
_____." This last observation made Grandma very angry. She jumped out of bed and snarled, "The better to eat
you!" Now Millie realized that this was not Grandma, but the hairy Mr. W! Unfortunately for Mr. W, Millie held a black
belt in karate. In just a few seconds, she took care of him!
Millie found Grandma in the closet. When they finally sat down to eat lunch, Millie couldn't help thinking that maybe
next time she'd just have lunch delivered.

14
Body Measure
PART A:
Use your metric tape or ruler to find the following measurements. Measure in centimeters to the nearest tenth.
1. Height: ________________
(no shoes!)
2. Span: _________________
3. Distance between wrist and inside of elbow: ________________
4. Fathom: ________________
5. Tip of index finger to inside of second joint: ________________
6. Foot Length: ________________(no shoes!)
7. Distance from chin to top of head: ________________
8. Tip of nose to bridge of nose: ________________
PART B:
Are your measurements for #2, 3, 6, and 7 close to the same?
Are your measurements for #5 and 8 close to the same?
Multiply your span x 8. = __________. Is this measurement close to # 1 and 4?
Skill Reinforcement: Metrics

15
In the spaces provided, write the correct term.
1. The basic unit of length in the metric system is the _______________________.
2. The mass per unit of volume of a substance is its ____________________.
3. In the metric system, temperature is measured on the __________________ scale.
4. One thousand _________________ equal one gram.
5. One hundredth of a meter is called a ___________________________.
6. An ordinary drinking glass holds about 200 ____________________ of liquid.
7. One thousandth of a gram is called a __________________________.
8. A kilometer is equal to _______________________ meters.
9. The basic unit of volume in the metric system is the ______________________.
10. The basic unit of mass in the metric system is the _____________________.
11. One gram equals ______________________ milligrams.
12. A textbook is about 25 ________________________ thick.
Before each of the measurements described below, write the letter of the tool that you would use to
obtain that measurement.
A. metric ruler C. graduated cylinder E. spring scale
B. triple beam balance D. Celsius thermometer
_____ 1. the mass of a small stone
_____ 2. the length of your finger
_____ 3. the temperature of a glass of lemonade
_____ 4. the mass of a cube of sugar
_____ 5. the volume of small jar of juice
_____ 6. the air temperature
_____ 7. the weight of a diamond ring
_____ 8. the volume of a diamond ring
_____ 9. your height
_____ 10. the mass of a coin
_____ 11. the volume of a coin
_____ 12. the mass of a handful of powder

16
WHAT IS SCIENCE? Directions: Match the following vocabulary words to their definitions
1. ______ Science a. process of grouping things based on their similarities
2. ______ Observing b. making an interpretation based on observations
3. ______ Qualitative Observation c. study of living things
4. ______ Quantitative Observation d. creating representations of complex processes
5. ______ Inferring e. process of using your senses to gather information
6. ______ Predicting f. forecasting what will happen based on past experiences
7. ______ Classifying g. information that is gathered through the 5 senses
8. ______ Making Models h. information that is gathered as a count or measurement
9. ______ Life Science i. learning about the natural world through a process
Directions: Based on the cartoon below, decide if the statement is a qualitative observation (QLT), a quantitative observation (QNT) or an inference (I).
_____ There are 3 people in the picture.
_____ One person is sitting down.
_____ The head chef is sitting down.
_____ The man sitting is soaking his feet.
_____ The man sitting down is soaking his feet
in the chicken soup.
_____ The restaurant will not pass inspection.
_____ There are 7 pots hanging from the rack.
_____ A flour sack is lying against the counter.
_____ The inspector is wearing a suit.

Inferences from Commercials
17
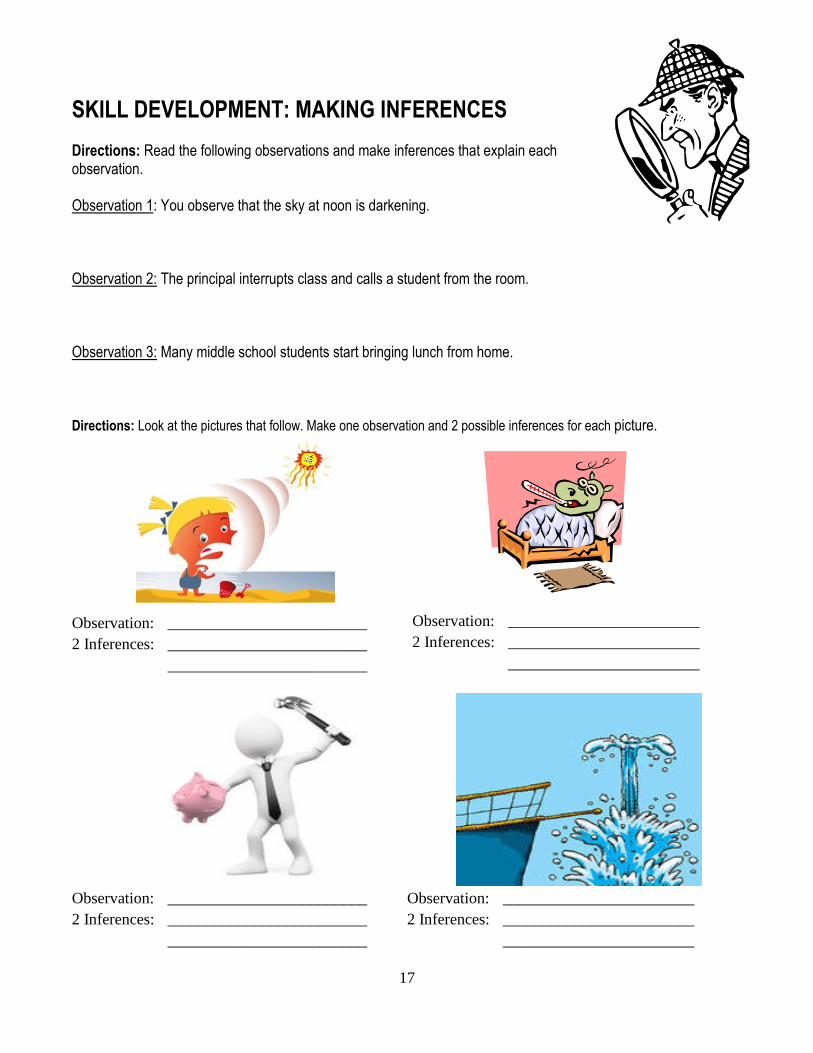
SKILL DEVELOPMENT: MAKING INFERENCES
Directions: Read the following observations and make inferences that explain each observation.
Observation 1: You observe that the sky at noon is darkening.
Observation 2: The principal interrupts class and calls a student from the room.
Observation 3: Many middle school students start bringing lunch from home.
Directions: Look at the pictures that follow. Make one observation and 2 possible inferences for each picture.
Observation: _________________________ Observation: ________________________
2 Inferences: _________________________ 2 Inferences: ________________________
_________________________ ________________________
Observation: _________________________ Observation: ________________________
2 Inferences: _________________________ 2 Inferences: ________________________
_________________________ ________________________

19
PRACTICE: INFERRING
Directions: The diagrams show layers of sedimentary rock from several different locations in an area. Use the diagrams to answer the questions below.
1. Layers of sedimentary rock are laid one on top of the other. What can you observe about Rock Layer A in Diagram 1? What can you infer about the age of Rock Layer A compared to the other rock layers in Diagram 1?
2. Diagram 2 shows a fault that cuts across layers Q and R. What can you infer about the relative age of Layer R compared to the fault?
3. Diagram 3 shows sedimentary rock layers at two locations, Site 1 and Site 2. Notice that layers A and C at Site 1 are the same as layers F and G at Site 2. What can you infer happened to Layer B to produce the unconformity between Layers F and G at Site 2?
4. What can you infer about the relative age of the intrusion in Diagram 4 in relation to the ages of the other rock layers?
5. Scientists sometimes observe similar fossils, called index fossils, at different locations. The same index fossils are found in Layer C in Diagram 1 as in Layer S in Diagram 2. What can you infer about the relative age of each layer?

20
Practice: Predicting
Directions: Answer the following questions about the data in the graphs.
1. Describe two trends, or patters, in the data shown in Graph A.
2. For each of the trends you identified, make a prediction about the size of the rabbit population in 2003.
3. Describe a trend, or pattern, in the moose population shown in Graph B.
4. Describe a trend, or pattern, in the wolf population shown in Graph B.
5. If the moose population increased in the years following the ones shown, make a prediction about the size of the wolf population.
6. Describe an event that would make one of your predictions incorrect.

21
Gummy Worm Activity
Directions: You will use the gummy worms to complete the following questions below. DO NOT eat any worms until you have finished the entire lab.
Materials:
1. gummy worms 2. paper towels 3. ruler 4. triple beam balance
Observations: 1. Length of Specimen______________________________________________________________
2. # of colors______________________________________________________________________
3. Width of Specimen_______________________________________________________________
4. Height of Specimen_______________________________________________________________
5. Length of each color______________________________________________________________
6. Width if pressed flat______________________________________________________________
7. Maximum length it can stretch______________________________________________________
8. # of ridges per color______________________________________________________________
9. # of total ridges_________________________________________________________________
10. Mass of specimen___________________________________________________(one at a time)
11. Another measurement observation that you can think of (required) _________________________
Questions:
1. Describe what it looks like.____________________________________________________________
2. Does it make any sound?_____________________________________________________________
3. Describe what it feels like._____________________________________________________________
4. Describe what it smells like.____________________________________________________________
5. Describe what it tastes like.____________________________________________________________

22
PRACTICE WITH SCIENTIFIC INQUIRY
The Scientific Method has the following steps: 1. Posing a Question 2. Developing a Hypothesis 3. Design an experiment 4. Collect data and interpret data 5. Draw a conclusion 6. Communicate Findings
Directions: Read the passage and decide which steps match each step in scientific inquiry. Some numbers will be used twice. In 1872, a railroad tycoon named Leland Stanford (Stanford University is named after him) made a bet with a friend about a galloping horse. Put the step number next to each step of the Scientific Method in this problem. ______ Mr. Stanford proposed the hooves of a galloping horse do not touch the ground at some point during the gallop ______ Before digital cameras, the film in the cameras needed to be developed into pictures ______ Mr. Stanford put his findings in a report for everyone to read ______ Some of the pictures showed the horse’s hooves were all in the air at the same time ______ Leland Stanford made a bet that the hooves of a galloping horse don’t touch the ground at some point in time _____ Mr. Stanford decided to ask a photographer to take pictures of a horse galloping at a race track _____ The jockey rode the galloping horse around the racetrack _____ Mr. Stanford looked at the pictures the photographer brought him

23
Analyzing Elements of Scientific Inquiry
Directions: Read the following statements and then answer the questions.
1. You and your friend are walking along a beach in Maine on January 15, and 8:00am.
2. You notice a thermometer on a nearby building that reads -1°C.
3. You also notice that there is snow on the roof of the building and icicles hanging from the roof.
4. You further notice a pool of sea water in the sand near the ocean.
5. Your friend looks at the icicles and the pool and says, “How come the water on the roof is frozen
and the sea water is not?”
6. You answer, “I think that the salt in the sea water keeps it from freezing a -1°C.”
7. You go on and say, “And I think under the same conditions, the same thing will happen tomorrow.”
8. Your friend asks, “How can you be sure?” You answer, “I’m going to get some fresh water and
some salt water and expose them to a temperature of -1°C and see what happens.”
Questions: A. In which statement is a prediction made? _____________________________________________
B. Which statement states a problem? __________________________________________________
C. In which statement is an experiment described? ________________________________________
D. Which statement contains a hypothesis? ______________________________________________
E. Which statements contain data? ____________________________________________________
F. Which statements describe observations? _____________________________________________

24
IDENTIFYING VARIABLES Variables are factors, conditions, and/or relationships that can change or be changed in an event or system. Identify at least 3 variables in each of the following situations.
1. What variables can affect the sprouting of a bean seed?
2. What variables can affect the number of books sold by a door-to-door salesperson?
3. What variables can affect the number of fish in a lake?
4. What variables can affect attendance at a football game?
5. What variables can affect the number of eggs laid by a chicken?
6. What variables can affect the taste of a soft drink?
7. What variables can affect the amount of fruit produced by an apple tree?
8. What variables can affect the speed of a runner in a 100-yard dash?
SKILL DEVELOPMENT: Identification of Types of Variables

25
Directions: For each experiment below underline the independent variable and circle the dependent variable. List 2 possible constants beneath each example.
1. A student wanted to test how the mass of a paper airplane affected the distance it would fly. Paper clips were added before each test flight. As each paper clip was added, the plane was tested to determine how far it could fly.
2. Two groups of students were tested to compare their speed working math problems. Each group was given the same problems. One group used calculators and the other group worked without calculators.
3. Students of different ages were given the same puzzle to assemble. The puzzle assembly time was measured.
4. A study was done to find if different tire treads affect the braking distance of a car.
5. An experiment was performed to determine how the amount of coffee grounds could affect the taste of coffee.
6. A study was done with an electromagnet system made from a battery and wire wrapped around a nail. Different sizes of nails were used and the number of paper clips that the electromagnet could pick up was measured.
7. A study was attempted to find if the length of the string in a string telephone affected its sound clarity.

26
SCIENTIFIC INQUIRY AND PREDICTING: Predicting is the process of using observations or data along with other kinds of scientific knowledge to forecast future events or relationships.
ACTIVITY: Penny Predictions
RESEARCH QUESTION: Does the size of a coin affect the number of drops of water the coin will hold on its surface? Write the Manipulated (Independent) Variable from the above research question in the space below. Write the Dependent (Responding) Variable from the above research question in the space below. Write 2 Constants from the above research question in the space below. METHOD: 1. Predict the number of drops of water the penny will hold. Record your prediction below.
The penny will hold __________ drops of water.
2. Place the penny flat on the table. Using the dropper, drop one drop of water at a time onto the penny. Continue dropping until the water runs off of the penny. In the data table below, record how many drops the penny held.
3. Dry the penny and repeat step 2 two more times. Record your findings in the table below. 4. Average your three trials for a more accurate idea of how many drops of water a penny will hold.
Number of drops the penny holds
# Drops Trial 1
# Drops Trial 2
# Drops Trial 3
AVERAGE # Drops
5. Evaluate your results comparing your original estimate of the number of drops the penny would hold to
the actual data. Then look at the nickel and evaluate the size of the nickel in relation to the penny. Try to make an accurate prediction about how many drops of water the nickel will hold.
The nickel will hold __________ drops of water.

27
6. Use the same procedure as above to experimentally determine the number of drops the nickel will hold. Record your data in the table below.
Number of drops the nickel holds
# Drops Trial 1
# Drops Trial 2
# Drops Trial 3
AVERAGE # Drops
7. Evaluate your results comparing your original estimates of the number of drops the penny and nickel
would hold to the actual data. Then look at the dime and evaluate the size of the dime in relation to the penny and the nickel. Try to make an accurate prediction about how many drops of water the dime will hold.
The dime will hold __________ drops of water.
8. Use the same procedure as above to experimentally determine the number of drops the dime will hold.
Record your data in the table below.
Number of drops the dime holds
# Drops Trial 1
# Drops Trial 2
# Drops Trial 3
AVERAGE # Drops
9. Evaluate your results comparing your original estimates of the number of drops the penny, nickel, and
dime would hold to the actual data. Then look at the quarter and evaluate the size of the quarter in relation to the penny, nickel, and dime. Try to make an accurate prediction about how many drops of water the quarter will hold.
The quarter will hold __________ drops of water.
10. Use the same procedure as above to experimentally determine the number of drops the quarter will
hold. Record your data in the table below.
Number of drops the quarter holds
# Drops Trial 1
# Drops Trial 2
# Drops Trial 3
AVERAGE # Drops
11. Did your ability to predict become more accurate as you performed the investigation? 12. Name at least 2 variables other than the size of the coin that may have affected the number of drops of water the coins could hold.

28
HYPOTHESIZING
A hypothesis is a special kind of prediction that forecasts how one the independent (or manipulated)
variable will affect the dependent (or responding) variable.
** Write the hypothesis using the following format if the IV data is CONTINUOUS:
If the IV increases, then the DV will increase, decrease or remain the same.
** Write the hypothesis using the following format if the IV data is DISCRETE: When comparing IV, the (Level of IV) will ________________________
EXAMPLE: IV = temperature of room DV = height bread rises Hypothesis:
If the temperature of the room is increases, then the height the bread raises will increase.
DIRECTIONS: Write hypotheses for the following experiments.
1. In an experiment with fresh cut flowers, Connor is putting each flower in its own vase and testing to
see whether different amounts of sugar mixed in with the water will keep flowers alive longer.
2. Rachel wants to see if the amount of water will affect the height of the plants he is growing in
ceramic pots.
3. Henry is testing the effect of different color light bulbs on the number of flower buds that will
develop on bean tree. He is using white, red, blue, yellow, and green light bulbs.
4. Hollis wants to know if the brand of fertilizer will affect the number of apples that grow on her apple
trees. She is using the following brands: Home Depot, Lowe’s, Ace’s, and Evergreen.

29
SKILL DEVELOPMENT: Identification of Variables and Hypothesizing
1. Russell raises bees. He noticed that varying numbers of young batched from the same number of hives at different
times. He wondered if the temperature of the hive affected the hatching rate.
IV =
DV =
2 Constants =
Hypothesis =
2. Does the volume of an object affect the rate at which the object falls through air?
IV =
DV =
2 Constants =
Hypothesis =
3. A study was done of the concentration of bleach needed to change the color of cloth. Squares of cloth were
soaked in a bleach solution for five minutes each. Concentrations of 100, 95, 90, 85, and 80% bleach were used.
IV =
DV =
2 Constants =
Hypothesis =
4. Michael put 100 red seeds, 100 brown seeds, 100 yellow seeds in his bird feeder. He counted the number of
seeds of each color that remained after 2 days.
IV =
DV =
2 Constants =
Hypothesis =

30
5. Leticia timed how fast apple slices turned brown after being dipped in different preservatives, such a lemon juice,
fruit freshener, and lime soda.
IV =
DV =
2 Constants =
Hypothesis =
6. Elizabeth tested how high 5 different brands of new tennis balls would bounce when dropped from a height of 2
meters. She dropped the balls so that they hit the same floor each time.
IV =
DV =
2 Constants =
Hypothesis =
7. John was interested in determining the effect of the number of plants in an area on growth rate. He used identical
milk cartons with equal amounts of the same type of soil. He placed 5 seeds in the first carton, l0 seeds in the second
carton, l5 seeds in the third, and 20 seeds in the fourth carton. Each carton was watered with the same amount of
water daily. John measured the length of the leaves after 10 days.
IV =
DV =
2 Constants =
Hypothesis =
8. Cars can use gas containing different amounts of lead. Does it makes a difference in the amount of pollution they produce?
IV =
DV =
2 Constants =
Hypothesis =

31
9. Do lemon trees receiving the most water produce the largest lemons?
IV = Possible operational definition for IV=
DV = Possible operational definition for DV=
2 Constants =
Hypothesis =
10. Corn seeds sprout at different times. Does the temperature of the water in which they are placed affect
the time?
IV = Possible operational definition for IV=
DV = Possible operational definition for DV=
2 Constants =
Hypothesis =
11. What determines the number of pigs in a litter? Is the number of pigs in a litter determined by the weight of the mother pig?
IV = Possible operational definition for IV=
DV =
2 Constants =
Hypothesis =
12. If mother rats are exposed to differing amounts of X-rays. Does it affect the number of offspring born dead?

32
IV =
DV =
2 Constants =
Hypothesis =
13. When shining a flashlight on a screen, does the distance from the screenaffect the size of the illuminated area?
IV = Possible operational definition for IV =
DV = Possible operational definition for DV=
2 Constants =
Hypothesis =
14. Are the spelling scores of elementary students affected by the number of minutes of spelling practice they haveeach day?
IV =
DV =
2 Constants =
Hypothesis =
15. Can the number of nails picked up by an electromagnet be increased by putting more batteries on the circuit?
IV =
DV =
2 Constants =
Hypothesis =
16. Can the number of bushels of potatoes be increased by increasing the amount of fertilizer per acre?
IV =

34
VOCABULARY REVIEW
Directions: Define the following terms.
1. Scientific Inquiry:
______________________________________________________________________________
______________________________________________________________________________
______________________________________________________________________________
2. Hypothesis:
______________________________________________________________________________
______________________________________________________________________________
______________________________________________________________________________
3. Variables:
______________________________________________________________________________
______________________________________________________________________________
4. Controlled Experiment:
______________________________________________________________________________
______________________________________________________________________________
5. Manipulated Variable:
______________________________________________________________________________
______________________________________________________________________________
6. Responding Variable:
______________________________________________________________________________
______________________________________________________________________________
7. Operational Definition:
______________________________________________________________________________
______________________________________________________________________________
8. Data:
______________________________________________________________________________
______________________________________________________________________________
9. Communicating:
______________________________________________________________________________
______________________________________________________________________________
35
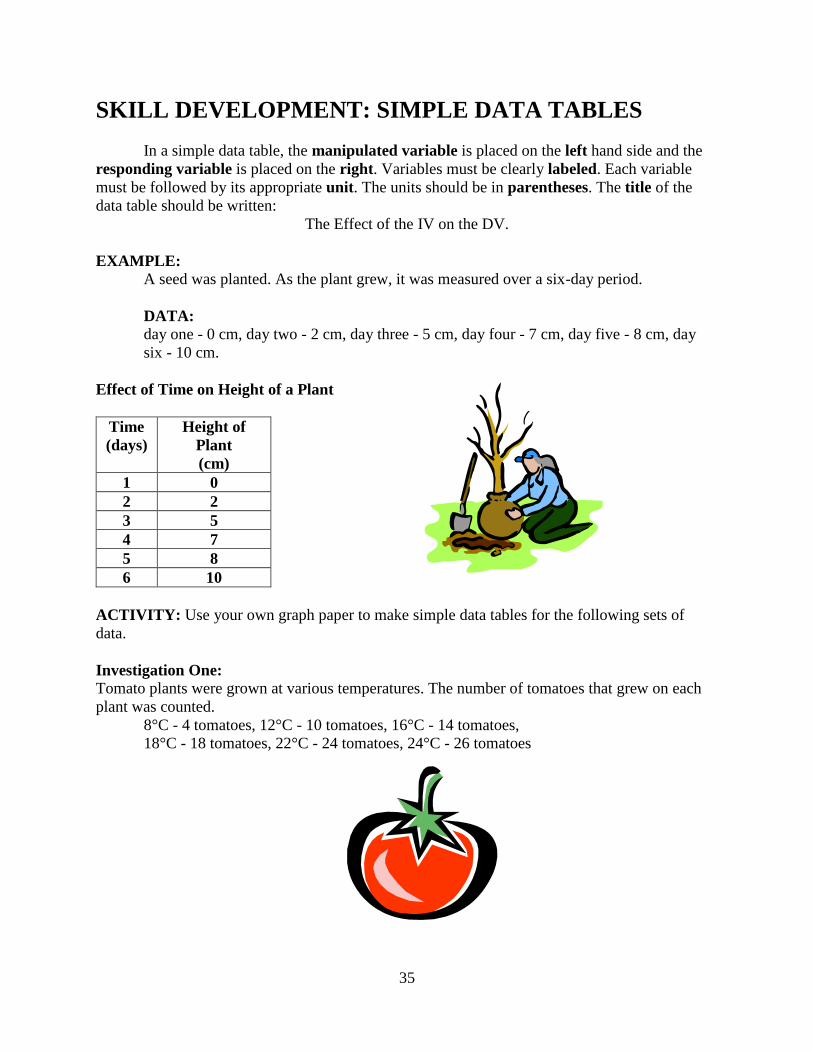
SKILL DEVELOPMENT: SIMPLE DATA TABLES
In a simple data table, the manipulated variable is placed on the left hand side and the
responding variable is placed on the right. Variables must be clearly labeled. Each variable
must be followed by its appropriate unit. The units should be in parentheses. The title of the
data table should be written:
The Effect of the IV on the DV.
EXAMPLE:
A seed was planted. As the plant grew, it was measured over a six-day period.
DATA:
day one - 0 cm, day two - 2 cm, day three - 5 cm, day four - 7 cm, day five - 8 cm, day
six - 10 cm.
Effect of Time on Height of a Plant
Time
(days)
Height of
Plant
(cm)
1 0
2 2
3 5
4 7
5 8
6 10
ACTIVITY: Use your own graph paper to make simple data tables for the following sets of
data.
Investigation One:
Tomato plants were grown at various temperatures. The number of tomatoes that grew on each
plant was counted.
8°C - 4 tomatoes, 12°C - 10 tomatoes, 16°C - 14 tomatoes,
18°C - 18 tomatoes, 22°C - 24 tomatoes, 24°C - 26 tomatoes

36
Investigation Two:
Different types of balls were bounced from a tabletop. The height of each bounce was measured.
golf ball - 54 cm, baseball - 9 cm, tennis ball - 48 cm,
ping pong ball - 21 cm, Styrofoam ball - 3 cm
Investigation Three:
John wanted to know if the volume of a rock determined how fast it would sink to the bottom of
the pool.
45 cc – 15 sec; 65 cc – 25 sec; 25 cc – 10 sec; 85 cc – 35 sec; 10 cc – 5 sec
Investigation Four:
Mary wondered if the mass of a beanie baby was determined by the number of beans inside.
5,234 beans – 25 g; 2054 beans 12 g; 7476 beans – 35 g; 4822 beans – 21 g;
10,865 beans – 50g
Investigation Five:
A student investigated and recorded how the amount of study time affected the scores on a
science test.
0 hours - 55 points, 1 hour - 61 points, 2 hours - 66 points, 3 hours - 72 points,
4 hours - 77 points, 5 hours - 82 points, 6 hours – 87.5 points

37
SKILL DEVELOPMENT: COMPLEX DATA TABLES
Follow this format to create your own complex data tables.
Effect of the IV on DV
IV DV
(unit) (unit)
T1 T2 T3 T4 T5 AVE.
IV Level 1
IV Level 2
IV Level 3
IV Level 4
IV Level 5
Derived
Column for IV Columns for DV Quantity
(Data from Repeated Trials) (Mean or mode)
EXAMPLE:
Effect of the Amount of Water on Flower Size
Amt. Of Water Flower Size
(mL) (cm)
T1 T2 T3 T4 T5 AVE.
10 4 5 6 5 4 4.8
20 6 8 7 9 5 7.0
30 11 14 12 13 15 13.0
40 13 15 18 17 19 16.4
50 21 24 23 26 25 23.8

38
39
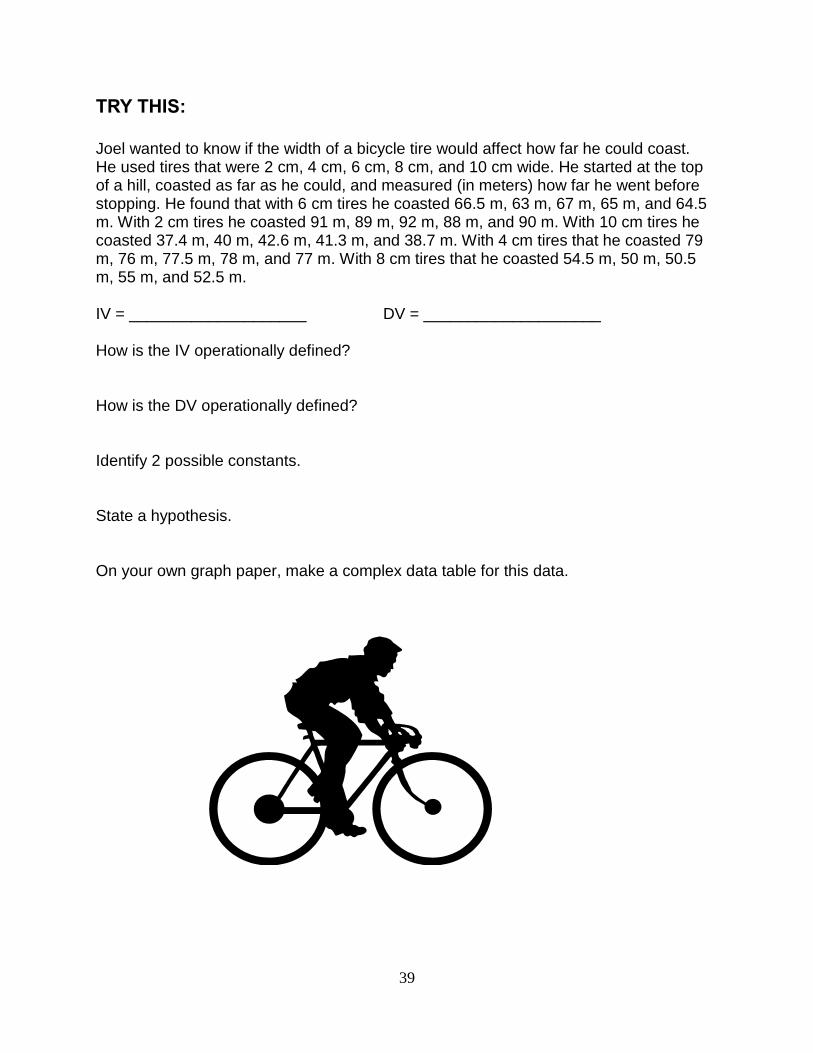
TRY THIS:
Joel wanted to know if the width of a bicycle tire would affect how far he could coast. He used tires that were 2 cm, 4 cm, 6 cm, 8 cm, and 10 cm wide. He started at the top of a hill, coasted as far as he could, and measured (in meters) how far he went before stopping. He found that with 6 cm tires he coasted 66.5 m, 63 m, 67 m, 65 m, and 64.5 m. With 2 cm tires he coasted 91 m, 89 m, 92 m, 88 m, and 90 m. With 10 cm tires hecoasted 37.4 m, 40 m, 42.6 m, 41.3 m, and 38.7 m. With 4 cm tires that he coasted 79 m, 76 m, 77.5 m, 78 m, and 77 m. With 8 cm tires that he coasted 54.5 m, 50 m, 50.5 m, 55 m, and 52.5 m.
IV = ____________________ DV = ____________________
How is the IV operationally defined?
How is the DV operationally defined?
Identify 2 possible constants.
State a hypothesis.
On your own graph paper, make a complex data table for this data.


40
Practice Worksheet: Line Graphs
Line graphs are used when the manipulated variable is continuous. Continuous means that the values of the manipulated variable are numerical and not separate categories. Preparing your line graph:
1. Write the standard form title on the center of your page. 2. Just under your title, come in about one inch from your left margin and draw a
vertical line extending almost halfway down your page. 3. From there, draw a horizontal line across your graph paper (using the graph lines
and ruler for help) to about one inch from your right margin. 4. Make hash marks extending slightly across the X and Y axes every 2 boxes
starting at the junction of the 2 lines. 5. Label the X-axis with the IV with your operational definition under it in ( ). 6. Label the Y-axis with the DV with your operational definition under it in ( ). 7. Label the hash marks on your X-axis using the Levels of IV. 8. Determine the number scale for your Y-axis.
a. Subtract your lowest averaged data from your highest averaged data. b. Divide that figure (the difference) by five. c. Round to the nearest counting number (1, 2, or 5) adding zeroes or
decimals if necessary. 9. Plot your data. 10. Draw a best-fit line.
Practice finding the counting number for the following samples of recorded data:
A.) 45, 56, 62, 70, 77 B.) 12, 15, 19, 21, 25
High Data
Low Data
Difference
Difference / 5
Counting #
Starting At
C.) 1.5, 1.6, 1.8, 2.1 D.) 365, 381, 399, 417, 432
High Data
Low Data
Difference
Difference / 5
Counting #
Starting At
High Data
Low Data
Difference
Difference / 5
Counting #
Starting At
High Data
Low Data
Difference
Difference / 5
Counting #
Starting At
41
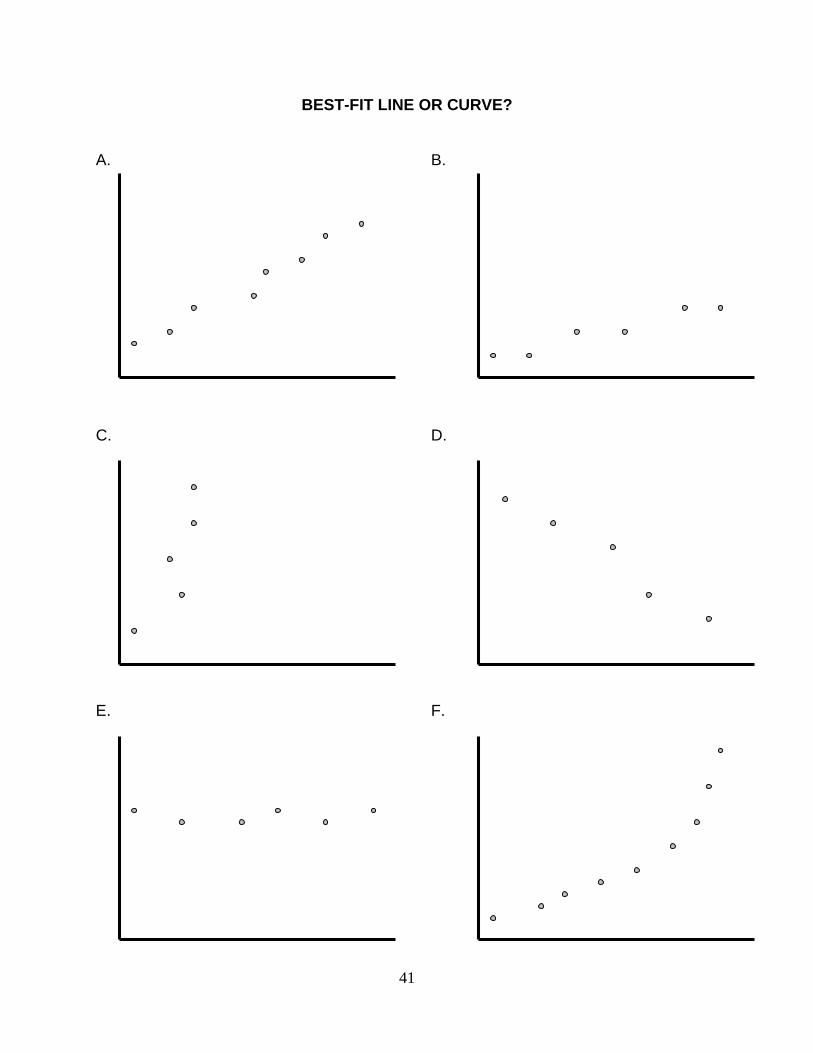
BEST-FIT LINE OR CURVE?
A. B. C. D. E. F.

42
Practice Worksheet: Bar Graphs
Bar graphs are used when the manipulated variable is in discrete categories. Discrete means that the categories are separate and do not overlap. The spaces of intervals between the categories have no meaning. Examples of discrete data are kinds of animals, brands of paper towels, or types of vehicles. Preparing your bar graph:
1. Set up your basic graph just as you would a line graph. 2. Keep your IV with its operational definition in () on the X-axis (bottom line) and
your DV with its operational definition in () on the Y-axis (left side). 3. Label your Levels of IV making sure to give yourself two squares for each bar.
Do not forget to leave a square of space in between. 4. Find your counting number using your averaged data for the DV. 5. Mark the top of your bars with your appropriate data then fill in your bars for
visual effect. One thing about your hypothesis: When setting up an experiment with discrete Levels of IV, your standard form for writing a hypothesis (If the IV increases, the DV will ____________________.) will change. A new format is used. Example: If testing brands of paper towels, Bounty will support the most weight. Practice writing hypotheses:
1. Sonya is testing brands of batteries to see which will burn the longest in her flashlight. The brands she is comparing is Duracell, Eveready, Ray-O-Vac, Kroger brand and Wal-Mart brand.
Hypothesis:
________________________________________________________________
________________________________________________________________
2. Ali wants to know which color will fade the fastest under direct sunlight. He
purchases five of the same kind of T-shirt in colors of red, green, yellow, blue, black and white.
Hypothesis:
________________________________________________________________
________________________________________________________________

43
SKILL DEVELOPMENT: GRAPHING PRACTICE
Construct a proper graph using the information in the following data tables.
Table One:
Kind of Oil Time for Oil Drop to Fall
(sec)
Mean Time
(sec)
Trial #1 Trial #2 Trial #3
A 10 15 12
B 45 38 48
C 15 19 22
D 65 78 64
Table Two:
Kind of
Fruit
Time to Turn Brown
(min)
Mean
(min)
Trial #1 Trial #2 Trial #3 Trial #4
Apple 40 38 45 42
Pear 25 30 34 28
Peach 18 20 22 19
Table Three:
Temperature
of Salad Oil
(*C)
Time to Fall
(sec)
Mean
(sec)
Trial #1 Trial #2 Trial #3
10 150 120 135
20 100 98 110
30 80 91 87
40 60 55 63
50 40 38 47
Table Four:
Amount of
Antifreeze
(%)
Time to Freeze
(min)
Mean Time
(sec)
Trial #1 Trial #2 Trial #3 Trial #4
0 60 72 58 65
30 75 80 72 84
60 100 99 105 104
90 150 148 162 157

44
Graphing Problems: Make appropriate data tables and graphs for each of the following situations.
1. Johnny wanted to know if the size of a rock affected how long it took the rock to fa1l to the bottom of the pool. He got rocks with masses of 100, 400, 700, 1000, 1300 grams. He dropped each rock in turn into a pool that was 10 meters deep. He measured the time it took the rocks to hit the bottom in seconds. In five trials, he found that the 100 gram rock took 12, 12.2, 13, 12.4, 12 seconds, the 400 gram rock took 10, 10.2, 10.1, 9.9, 10.4 seconds, the 700 gram rock took 9, 8.8, 8.9, 9.1, 9 seconds, the 1000 gram rock took 6, 6.2, 6.3, 6, 6.1 seconds, the 1300 gram rock took 4, 4.2, 3.9, 4, 4.5 seconds
2. Dan wanted to know if the amount of manure added to a field would increase the number of potatoes harvested. He adds no manure to the first field, 200 kg to the second field, 350 kilograms to the third field, 400 kg to the fourth field, 500 kg to the fifth field, 650 kilograms to the sixth field, and 800 kg to the seventh field. He got the most potatoes with the 7th patch - a whopping 110 potatoes. The first patch yielded no potatoes, while the second patch yielded 30 and the 3rd patch yielded 50. The fourth patch yielded 60 potatoes, the fifth patch yielded 70 potatoes, and the sixth patch yielded 80 potatoes.
3. Anthony wanted to know what color backpack was most popular among Woodward Middle School students, so she tallied up her observations near the buses one afternoon. These were her results: 106 black, 94 red, 62 blue, 78 green, and 216 other colors.
4. Lucy did an experiment in which she changed the pressure on a balloon and then measured its
volume. She found that at a pressure of 0.5 N the volume was 700 ml, at 1 N the volume was 300 ml, at 1.5 N the volume was 200 ml, and at 5 N the volume was 100 ml. At 3.5 the volume was 60 ml, at 4.5 N the volume was 55 ml, and at 5.5 N the volume was 50 ml.
5. Michael wanted to know of distance affected the amount of letters that a person could see. He placed his subjects at various distances from a chart and counted the number of letters each person could read. At 0.5 m from the chart, 5 people saw 700, 675, 680, 715, 710 letters, at 1.5 m they saw 650, 630, 625, 655, 660 letters, at 2.5 m they saw 500, 475, 480, 490, 495 letters, and at 4 m they saw 350, 345, 375, 365, 340 letters. At 4.5 m they saw 250, 230, 235, 250, 240 letters.
6. Hayes wanted to know if the brand of paper towel affected the amount of water a towel could absorb. In 5 trials, he found that Bounty absorbed 85, 80, 82, 90, 95 ml of water, Brawny absorbed 120, 110, 112, 126, 118 ml of water, Kleenex absorbed 98, 101, 95, 90, 88 ml of water, Scott absorbed 65, 60, 70, 58, 75 ml of water, and Kroger absorbed 22, 20, 40, 18, 25 ml of water.