channel-pattern adjustments and geomorphic … channel-pattern adjustments and geomorphic...
TRANSCRIPT
U.S. GEOLOGICAL SURVEY
Water-Resources Investigations Report
Channel-Pattern Adjustments and Geomorphic Characteristics of Elkhead Creek, Colorado, 1937–97
By John G. Elliott and Stevan Gyetvai
Denver, Colorado1999
99 – 4098
Prepared in cooperation with theCOLORADO RIVER WATER CONSERVATION DISTRICT
U.S. DEPARTMENT OF THE INTERIOR
BRUCE BABBITT, Secretary
U.S. GEOLOGICAL SURVEY
Charles G. Groat, Director
The use of firm, trade, and brand names in this report is for identification purposes only and doesnot constitute endorsement by the U.S. Geological Survey.
For additional information write to: Copies of this report can be purchased
U.S. Geological SurveyInformation ServicesBox 25286Federal CenterDenver, CO 80225
from:
District ChiefU.S. Geological SurveyBox 25046, Mail Stop 415Denver Federal CenterDenver, CO 80225-0046
CONTENTS III
CONTENTS
Abstract.................................................................................................................................................................................. 1Introduction............................................................................................................................................................................ 2
Purpose and Scope ....................................................................................................................................................... 2Acknowledgments ....................................................................................................................................................... 2
Study Area ............................................................................................................................................................................. 3Geographic Setting ...................................................................................................................................................... 3Hydrology .................................................................................................................................................................... 4
Channel-Pattern Adjustments and Geomorphic Characteristics............................................................................................ 4Streamflow................................................................................................................................................................... 4Aerial Photography...................................................................................................................................................... 7Planimetric Geomorphology........................................................................................................................................ 11Cross-Sectional Geomorphology................................................................................................................................. 15Sediment Size .............................................................................................................................................................. 26Shear Stress and Sediment Entrainment ...................................................................................................................... 26Sedimentation in Elkhead Reservoir............................................................................................................................ 31
Factors Affecting Channel-Pattern Adjustments ................................................................................................................... 33Summary and Conclusions .................................................................................................................................................... 37References Cited .................................................................................................................................................................... 38
FIGURES
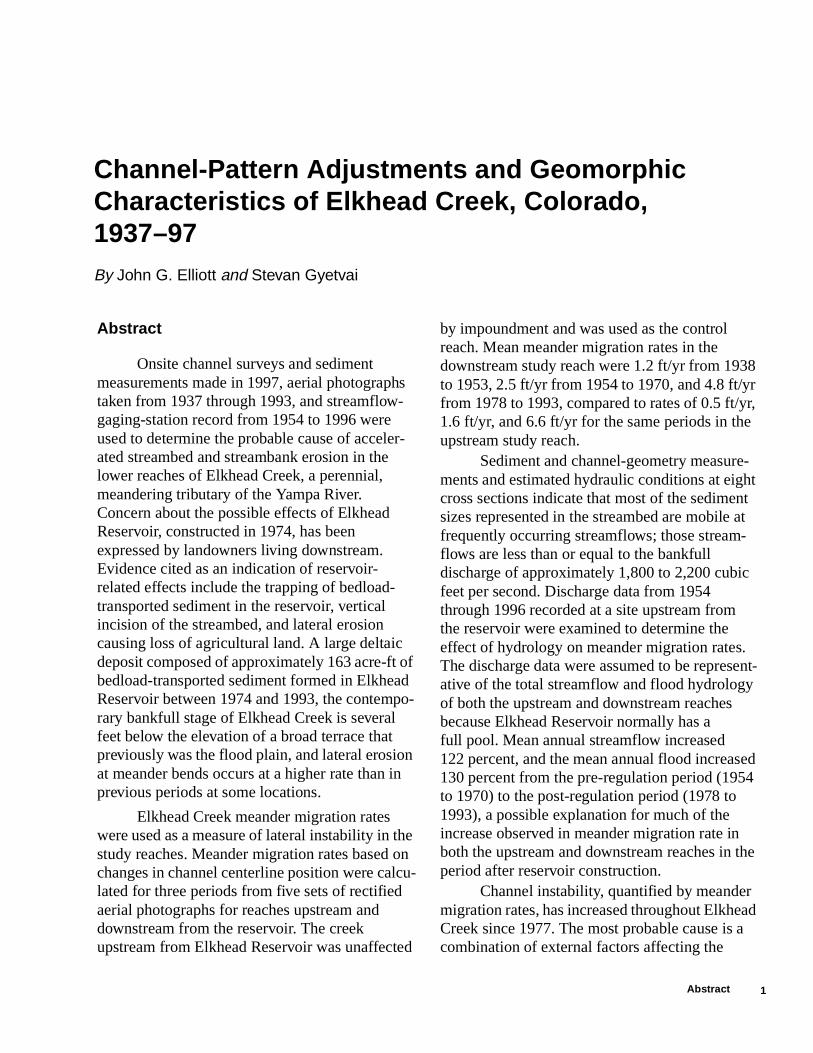
1. Map of Elkhead Creek showing study area, streamflow-gaging stations, and Elkhead Reservoir............................. 32. Plot showing annual peak discharges and estimated bankfull discharge from streamflow-gaging station 09245000
Elkhead Creek near Elkhead, 1953–96....................................................................................................................... 53. Digital orthophoto quadrangle of Elkhead Creek showing channel positions in 1937 and 1993, meander
study sites, and cross-section locations, (A) reach upstream from confluence with the Yampa River, (B) reach immediately downstream from Elkhead Reservoir, (C) reach upstream from Elkhead Reservoir ............. 8
4. Channel centerline of Elkhead Creek meander 20.30 in 1937, 1953, 1970, 1977, 1981, and 1993 showing amplitude increase during the period 1938 through 1970 and translational shift during the period 1971 through 1993 ...................................................................................................................................................... 14
5. Elkhead Creek cross sections showing geomorphic features, alluvial stratigraphy, and the bankfull stage, (A) cross section PT-2, (B) cross section PT-1, (C) cross section LG-2, (D) cross section LG-1, (E) cross section NR-Q, (F) cross section LW-1, (G) cross section VT-2, and (H) cross section VT-1 .................................... 18
6. Plot showing cumulative size distribution curves for streambed sediment at Elkhead Creek study sites .................. 277. Plot showing cross-channel distribution of boundary shear stress for three discharges and the critical shear
stress for entrainment of various sediment sizes at a typical Elkhead Creek site, cross section LG-1....................... 298. Aerial photograph showing deltaic sedimentation in Elkhead Reservoir and the location of the delta
distal margin in 1977, 1981, and 1993........................................................................................................................ 329. Graph showing Elkhead Creek meander migration rates for time intervals of equal duration: (A) reach
downstream from Elkhead Reservoir, and (B) reach upstream from Elkhead Reservoir ........................................... 34
TABLES
1. Streamflow characteristics at streamflow-gaging station 09245000 Elkhead Creek near Elkhead, Colorado,1954 through 1996................................................................................................................................................... 6
2. Statistics from the digital processing and rectification of aerial photographs to the 1997 digital orthophoto quadrangles ........................................................................................................................................... 11
3. Elkhead Creek meander migration rates for time intervals determined from aerial photographs........................... 164. Streambed sediment-size characteristics from Elkhead Creek study sites.............................................................. 285. Elkhead Creek delta progradation rates, estimated sediment volume, and extrapolated bedload-transport
rates, 1975 through 1993 ......................................................................................................................................... 33
IV CONTENTS
CONVERSION FACTORS, VERTICAL DATUM, AND ABBREVIATIONS
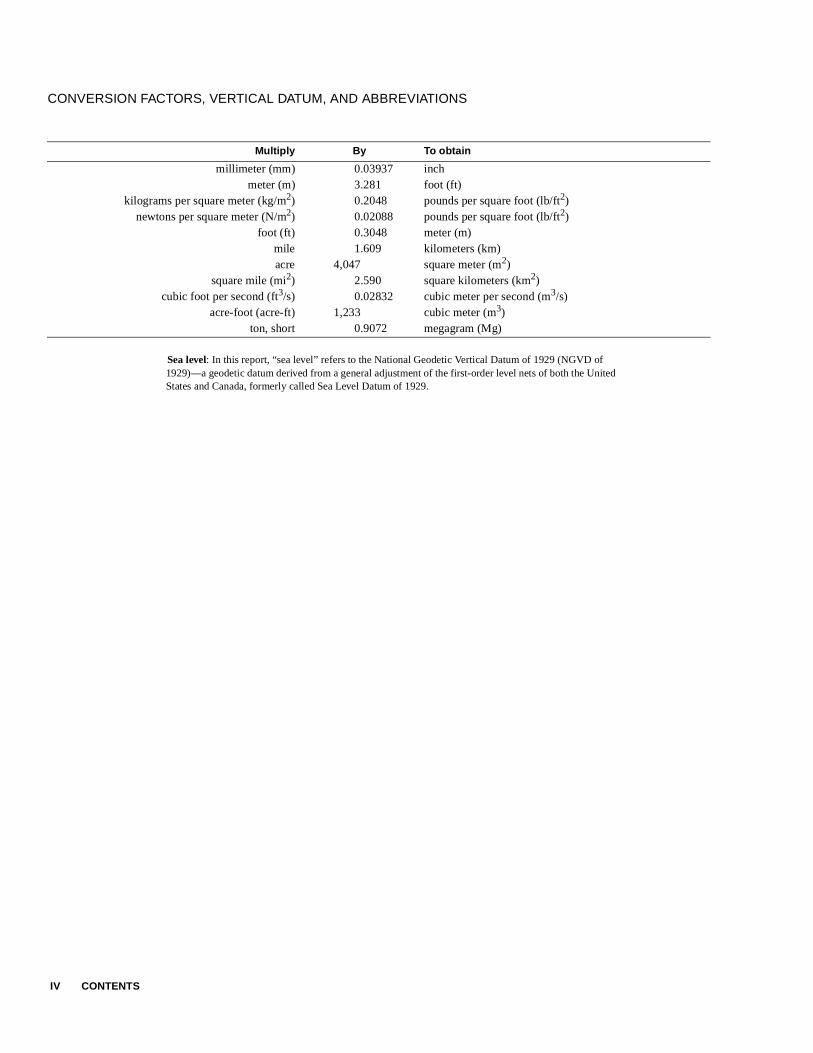
Sea level: In this report, “sea level” refers to the National Geodetic Vertical Datum of 1929 (NGVD of 1929)—a geodetic datum derived from a general adjustment of the first-order level nets of both the United States and Canada, formerly called Sea Level Datum of 1929.
Multiply By To obtain
millimeter (mm) 0.03937 inchmeter (m) 3.281 foot (ft)
kilograms per square meter (kg/m2) 0.2048 pounds per square foot (lb/ft2)newtons per square meter (N/m2) 0.02088 pounds per square foot (lb/ft2)
foot (ft) 0.3048 meter (m)mile 1.609 kilometers (km)acre 4,047 square meter (m2)
square mile (mi2) 2.590 square kilometers (km2)cubic foot per second (ft3/s) 0.02832 cubic meter per second (m3/s)
acre-foot (acre-ft) 1,233 cubic meter (m3)ton, short 0.9072 megagram (Mg)
Abstract 1
Channel-Pattern Adjustments and Geomorphic Characteristics of Elkhead Creek, Colorado, 1937–97By John G. Elliott and Stevan Gyetvai
Abstract
Onsite channel surveys and sediment measurements made in 1997, aerial photographs taken from 1937 through 1993, and streamflow-gaging-station record from 1954 to 1996 were used to determine the probable cause of acceler-ated streambed and streambank erosion in the lower reaches of Elkhead Creek, a perennial, meandering tributary of the Yampa River. Concern about the possible effects of Elkhead Reservoir, constructed in 1974, has been expressed by landowners living downstream. Evidence cited as an indication of reservoir-related effects include the trapping of bedload-transported sediment in the reservoir, vertical incision of the streambed, and lateral erosion causing loss of agricultural land. A large deltaic deposit composed of approximately 163 acre-ft of bedload-transported sediment formed in Elkhead Reservoir between 1974 and 1993, the contempo-rary bankfull stage of Elkhead Creek is several feet below the elevation of a broad terrace that previously was the flood plain, and lateral erosion at meander bends occurs at a higher rate than in previous periods at some locations.
Elkhead Creek meander migration rates were used as a measure of lateral instability in the study reaches. Meander migration rates based on changes in channel centerline position were calcu-lated for three periods from five sets of rectified aerial photographs for reaches upstream and downstream from the reservoir. The creek upstream from Elkhead Reservoir was unaffected
by impoundment and was used as the control reach. Mean meander migration rates in the downstream study reach were 1.2 ft/yr from 1938 to 1953, 2.5 ft/yr from 1954 to 1970, and 4.8 ft/yr from 1978 to 1993, compared to rates of 0.5 ft/yr, 1.6 ft/yr, and 6.6 ft/yr for the same periods in the upstream study reach.
Sediment and channel-geometry measure-ments and estimated hydraulic conditions at eight cross sections indicate that most of the sediment sizes represented in the streambed are mobile at frequently occurring streamflows; those stream-flows are less than or equal to the bankfull discharge of approximately 1,800 to 2,200 cubic feet per second. Discharge data from 1954 through 1996 recorded at a site upstream from the reservoir were examined to determine the effect of hydrology on meander migration rates. The discharge data were assumed to be represent-ative of the total streamflow and flood hydrology of both the upstream and downstream reaches because Elkhead Reservoir normally has a full pool. Mean annual streamflow increased 122 percent, and the mean annual flood increased 130 percent from the pre-regulation period (1954 to 1970) to the post-regulation period (1978 to 1993), a possible explanation for much of the increase observed in meander migration rate in both the upstream and downstream reaches in the period after reservoir construction.
Channel instability, quantified by meander migration rates, has increased throughout Elkhead Creek since 1977. The most probable cause is a combination of external factors affecting the
2 Channel-Pattern Adjustments and Geomorphic Characteristics of Elkhead Creek, Colorado, 1937–97
entire watershed, such as changes in annual runoff and flood magnitude and sedimentation in Elkhead Reservoir. Local land-use practices, such as intentional meander cutoff and riparian vegeta-tion removal, also can decrease channel stability, but these factors were not addressed in this study.
INTRODUCTION
The lower portion of Elkhead Creek is a mean-dering tributary of the Yampa River in northwestern Colorado and flows through a relatively broad, alluvial valley that has been utilized for ranching since the 19th century. Recently, several landowners along Elkhead Creek have expressed concern over the extent and rate of streambank erosion and the loss of produc-tive pasture acreage. Questions have arisen over the potential effects of Elkhead Reservoir, a 13,000-acre-ft impoundment located a short distance upstream from the eroding reaches, on sediment delivery and stream-flow fluctuations and, consequently, on channel stability and streambank erosion. A proposal to enlarge the storage capacity of Elkhead Reservoir has been challenged on the basis of concern that down-stream erosion rates could increase. Channel insta-bility recently rendered the Smith Ditch irrigation diversion from Elkhead Creek nonfunctional and has compounded efforts to repair it.
Many natural and human factors affect the behavior of a meandering alluvial stream. The hydrology of Elkhead Creek is dominated by snow-melt and is complicated by the effects of reservoir impoundment and numerous irrigation diversions and returns. U.S. Geological Survey (USGS) topographic maps and aerial photographs suggest that channel-pattern shifts and meander-bend avulsions were common in the sinuous, lower 12 miles of Elkhead Creek before Elkhead Reservoir was constructed in 1974. Cattle grazing in the watershed may have affected sediment yield, riparian vegetation growth, and streambank morphology to an unknown extent. Consequently, the degree to which channel instability and bank erosion rates are influenced by Elkhead Reservoir, land-use practices, geology, sediment char-acteristics, climate variability, and hydrology has not been established. The USGS, in cooperation with the Colorado River Water Conservation District (CRWCD), evaluated these issues, which are impor-
tant as they relate to the effectiveness of potentially costly erosion-mitigation activities and irrigation diversion repairs. Results of the evaluation also will further the understanding of channel-pattern adjust-ments and bank-erosion processes.
Purpose and Scope
This report will identify some likely causes of recent streambank erosion in lower Elkhead Creek and will provide information useful in guiding decisions about mitigation activities where appropriate. The following are specific objectives of the investigation:
1. determine the history of channel-pattern adjust-ments and the rate of meander-bend migration and cutoff before and since reservoir construc-tion;
2. determine the contemporary depth of incision below the flood plain;
3. quantify the sediment characteristics of the streambed and the adjacent flood plain;
4. examine the relation between peak runoff and channel-pattern adjustments resulting in stream-bank erosion;
5. determine whether these channel adjustments are unique to the reach downstream from Elkhead Reservoir or are common to all meandering reaches of lower Elkhead Creek; and
6. estimate the accumulation of bedload-transported sediment in the Elkhead Reservoir deltaic deposit.
Acknowledgments
The study was made possible with the permis-sion and cooperation of the many landowners and resi-dents along Elkhead Creek. The authors are especially grateful to Jonathan Evans (USGS) for invaluable logistical support and assistance in the field and to Jennifer Sieverling (USGS) for assistance in prepara-tion of aerial photographs for GIS analysis. R.E. Florida and Ed Neilson of the Natural Resources Conservation Service (NRCS) supplied some of the cross-section survey data. Additional field assistance was provided by Ray D. Tenney (CRWCD). Technical reviews of the report were provided by Janet S. Heiny and Paul J. Kinzel (USGS).
3STUDY AREA
Colorado Springs
Pueblo
Grand Junction
RIVER
R
R
SOU
TH
PLATTE
RIVER
AR ANSASK RIVER
YAMPA
DO
LO
RE
S
GRIO
ANDE
R
DENVER
Craig
COLO RADO
GUNNISONR
STUDY AREA
789
13
40
Craig0 1 2 3 MILES
0 1 2 3 KILOMETERS
107°30' 107°15'
40°37'30"
40°30'
Figure 3A
Figure 3B
Figure 3C
Figure 8
Fortifica
tion
Cre
ek
Yampa River
Elk
head
Creek
Nor
thFo
rk
Elk
head
Reservoir
Ralph WhiteLake
Maynard
Gulch
Long
Gulch
Dry Fork
EXPLANATION
Streamflow-gaging station and number
09246200
09245000
0924640009246400
STUDY AREA
Geomorphic data were collected from two prin-cipal areas in the lower part of the Elkhead Creek watershed. A reach approximately 5 river miles long upstream from Elkhead Reservoir was selected to represent relatively unregulated conditions in the watershed and to identify trends in fluvial geomor-phology unrelated to reservoir effects. A reach approx-imately 9 river miles long downstream from the reservoir was studied to identify any detectable reser-voir effects. (A river mile is the in-channel distance measured along a river or stream course.)
Geographic Setting
Elkhead Creek is a large, perennial tributary of the Yampa River in northwestern Colorado (fig. 1). The Elkhead Creek watershed is located southwest of the Elkhead Mountains and has a drainage area of about 250 mi2. Elevations range between 10,500 and 6,220 ft. The geology of the headwater areas includes the sedimentary Iles Formation, the Williams Fork Formation, and the Lewis Shale of Cretaceous age; the sedimentary Fort Union and Wasatch Formations of Tertiary age; and isolated Tertiary basaltic intrusives. The Elkhead Creek main stem and most of the prin-cipal tributaries flow over shales and sandstones of the
Figure 1. Map of Elkhead Creek showing study area, streamflow-gaging stations, and Elkhead Reservoir.
4 Channel-Pattern Adjustments and Geomorphic Characteristics of Elkhead Creek, Colorado, 1937–97
Upper Cretaceous Lance Formation (Tweto, 1976) and Holocene alluvium. The valley gradient in the lower 16 miles of the watershed ranges from 0.0045 to 0.0022 ft/ft.
Elkhead Creek is a meandering stream in the lower part of the watershed with sinuosity ranging from 1.1 to 2.2 and averaging 1.6. Oxbow ponds, meander scrolls, and arcuate groves of cottonwood trees in the valley of Elkhead Creek are evidence of previous meander development and channel-pattern adjustment typical of meandering stream systems. The streambed is composed predominantly of gravel and cobbles, and sand deposits cover some streambank and point-bar surfaces. Valley-fill material exposed in cutbanks is typical of fining-upward flood-plain sedi-ment; gravel and sand strata are overlain by a thick, loamy deposit.
The valley floor and adjacent hillslopes in the lower watershed have been used for grazing and hay production since the late 19th century (Wes Signs, Colorado River Water Conservation District, oral commun., 1998). The existing riparian vegetation is dominated by cottonwood trees, willows, and other woody shrubs. Elkhead Reservoir was constructed in 1974 and has a normal pool capacity of 13,000 acre-ft. The reservoir is located 9 river miles upstream from the mouth of Elkhead Creek.
Hydrology
Elkhead Creek is a snowmelt-dominated stream with annual discharge peaks usually occurring from late April to late May. The USGS has operated six streamflow-gaging stations at various times on the main stem and on the North Fork, a large tributary of Elkhead Creek. Station 09245000 Elkhead Creek near Elkhead, in the middle part of the watershed, has the longest period of record (1953–96) and is used for hydrologic reference in this study. This gage, which was discontinued after water year 1996, recorded runoff from approximately 27 percent of the water-shed.
Two new gaging stations were established in late 1995 to replace the discontinued station 09245000. Station 09246200 Elkhead Creek above Long Gulch is located approximately 10.6 river miles upstream from Elkhead Dam and records most of the inflow to the reservoir (fig. 1). Runoff from approximately 68 percent of the watershed passes the upstream gage at
station 09246200. The second new gage, station 09246400 Elkhead Creek below Maynard Gulch, is located approximately 3.3 river miles downstream from the dam and 5.9 river miles upstream from the confluence with the Yampa River. The downstream gage at station 09246400 records runoff from approxi-mately 85 percent of the watershed, which includes outflow from Elkhead Reservoir.
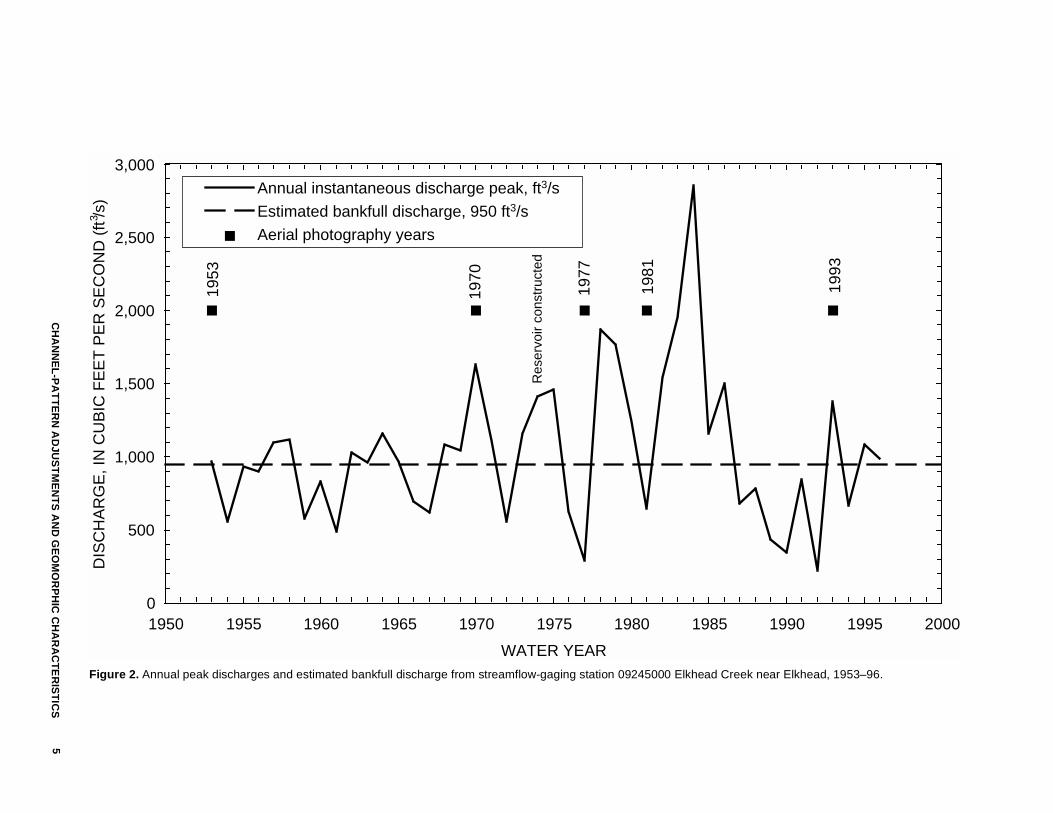
Annual peak discharges vary widely in magni-tude and reflect the water content of the preceding winter snowpack and the spring weather patterns. Annual peak discharges recorded at station 09245000 have ranged from 224 ft3/s in 1992 to 2,850 ft3/s in 1984 (fig. 2); both extremes occurred subsequent to construction of Elkhead Reservoir in 1974. The mean annual peak discharge at this station was 1,028 ft3/s. Annual streamflow, the total runoff from the water-shed in a year, ranged from 12,010 acre-ft in 1977 to 82,380 acre-ft in 1984. The mean annual streamflow for 1954–96 was 40,200 acre-ft (Crowfoot and others, 1997).
CHANNEL-PATTERN ADJUSTMENTS AND GEOMORPHIC CHARACTERISTICS
A combination of data from the streamflow-gaging stations, aerial-photographic interpretation, and onsite measurements was used to quantify channel-pattern adjustments and describe geomorphic charac-teristics in two reaches of Elkhead Creek.
Streamflow
Peak flow frequency and the duration of daily mean discharges were calculated by standard USGS procedures (U.S. Interagency Advisory Committee on Water Data, 1982) with the record from station 09245000 Elkhead Creek near Elkhead (fig. 1). The 100-year flood at this location of the watershed was 2,580 ft3/s and the 10-year flood was about 1,700 ft3/s (table 1). Based on discharge record analysis, observa-tions made during high streamflow in 1998, and commonly accepted statistical properties for the bank-full discharge, 950 ft3/s (the 2-year flood) was identi-fied as a reasonable approximation of the bankfull discharge in Elkhead Creek at station 09245000. This discharge, as an instantaneous annual flood peak, was equaled or exceeded in 25 of the 44 years of record
CH
AN
NE
L-P
AT
TE
RN
AD
JUS
TM
EN
TS
AN
D G
EO
MO
RP
HIC
CH
AR
AC
TE
RIS
TIC
S5
1993
1981
1977
Res
ervo
ir co
nstr
ucte
d
1970
1953
0
500
1,000
1,500
2,000
2,500
3,000
1950 1955 1960 1965 1970 1975 1980 1985 1990 1995 2000
WATER YEAR
Annual instantaneous discharge peak, ft3/s
Estimated bankfull discharge, 950 ft3/s
Aerial photography years
DIS
CH
AR
GE
, IN
CU
BIC
FE
ET
PE
R S
EC
ON
D (
ft /s
)3
Figure 2. Annual peak discharges and estimated bankfull discharge from streamflow-gaging station 09245000 Elkhead Creek near Elkhead, 1953–96.
6 Channel-Pattern Adjustments and Geomorphic Characteristics of Elkhead Creek, Colorado, 1937–97
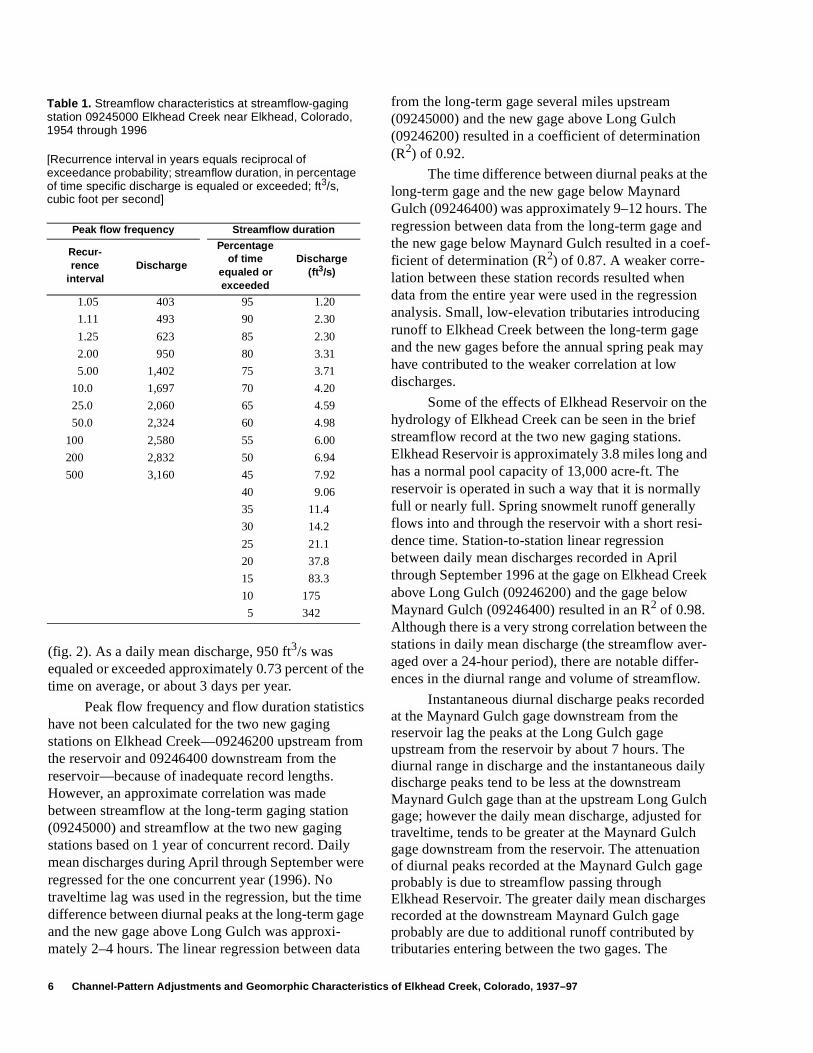
(fig. 2). As a daily mean discharge, 950 ft3/s was equaled or exceeded approximately 0.73 percent of the time on average, or about 3 days per year.
Peak flow frequency and flow duration statistics have not been calculated for the two new gaging stations on Elkhead Creek—09246200 upstream from the reservoir and 09246400 downstream from the reservoir—because of inadequate record lengths. However, an approximate correlation was made between streamflow at the long-term gaging station (09245000) and streamflow at the two new gaging stations based on 1 year of concurrent record. Daily mean discharges during April through September were regressed for the one concurrent year (1996). No traveltime lag was used in the regression, but the time difference between diurnal peaks at the long-term gage and the new gage above Long Gulch was approxi-mately 2–4 hours. The linear regression between data
from the long-term gage several miles upstream (09245000) and the new gage above Long Gulch (09246200) resulted in a coefficient of determination (R2) of 0.92.
The time difference between diurnal peaks at the long-term gage and the new gage below Maynard Gulch (09246400) was approximately 9–12 hours. The regression between data from the long-term gage and the new gage below Maynard Gulch resulted in a coef-ficient of determination (R2) of 0.87. A weaker corre-lation between these station records resulted when data from the entire year were used in the regression analysis. Small, low-elevation tributaries introducing runoff to Elkhead Creek between the long-term gage and the new gages before the annual spring peak may have contributed to the weaker correlation at low discharges.
Some of the effects of Elkhead Reservoir on the hydrology of Elkhead Creek can be seen in the brief streamflow record at the two new gaging stations. Elkhead Reservoir is approximately 3.8 miles long and has a normal pool capacity of 13,000 acre-ft. The reservoir is operated in such a way that it is normally full or nearly full. Spring snowmelt runoff generally flows into and through the reservoir with a short resi-dence time. Station-to-station linear regression between daily mean discharges recorded in April through September 1996 at the gage on Elkhead Creek above Long Gulch (09246200) and the gage below Maynard Gulch (09246400) resulted in an R2 of 0.98. Although there is a very strong correlation between the stations in daily mean discharge (the streamflow aver-aged over a 24-hour period), there are notable differ-ences in the diurnal range and volume of streamflow.
Instantaneous diurnal discharge peaks recorded at the Maynard Gulch gage downstream from the reservoir lag the peaks at the Long Gulch gage upstream from the reservoir by about 7 hours. The diurnal range in discharge and the instantaneous daily discharge peaks tend to be less at the downstream Maynard Gulch gage than at the upstream Long Gulch gage; however the daily mean discharge, adjusted for traveltime, tends to be greater at the Maynard Gulch gage downstream from the reservoir. The attenuation of diurnal peaks recorded at the Maynard Gulch gage probably is due to streamflow passing through Elkhead Reservoir. The greater daily mean discharges recorded at the downstream Maynard Gulch gage probably are due to additional runoff contributed by tributaries entering between the two gages. The
Table 1. Streamflow characteristics at streamflow-gaging station 09245000 Elkhead Creek near Elkhead, Colorado,1954 through 1996
[Recurrence interval in years equals reciprocal of exceedance probability; streamflow duration, in percentage of time specific discharge is equaled or exceeded; ft3/s,cubic foot per second]
Peak flow frequency Streamflow duration
Recur-rence
intervalDischarge
Percentage of time
equaled or exceeded
Discharge (ft3/s)
1.05 403 95 1.20
1.11 493 90 2.30
1.25 623 85 2.30
2.00 950 80 3.31
5.00 1,402 75 3.71
10.0 1,697 70 4.20
25.0 2,060 65 4.59
50.0 2,324 60 4.98
100 2,580 55 6.00
200 2,832 50 6.94
500 3,160 45 7.92
40 9.06
35 11.4
30 14.2
25 21.1
20 37.8
15 83.3
10 175
5 342
7CHANNEL-PATTERN ADJUSTMENTS AND GEOMORPHIC CHARACTERISTICS
drainage area of Elkhead Creek increases by 24 percent from the Long Gulch gage to the Maynard Gulch gage, an increase representing 17 percent of the total Elkhead Creek watershed measured at the mouth.
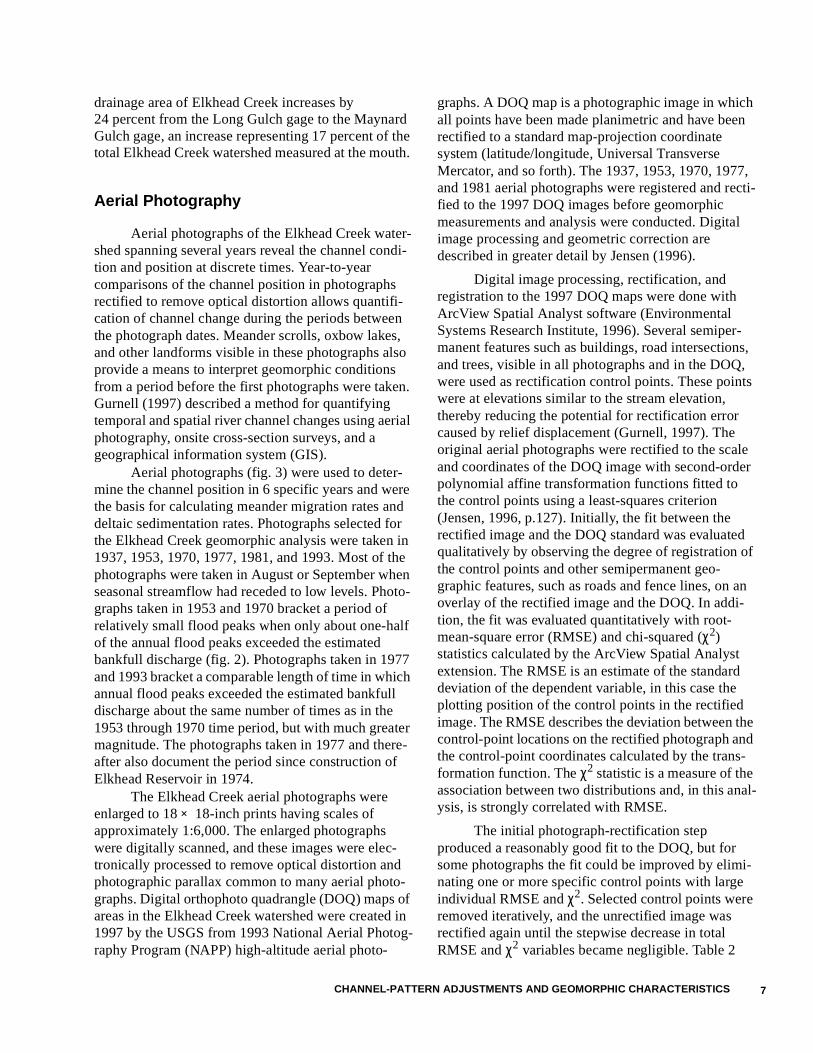
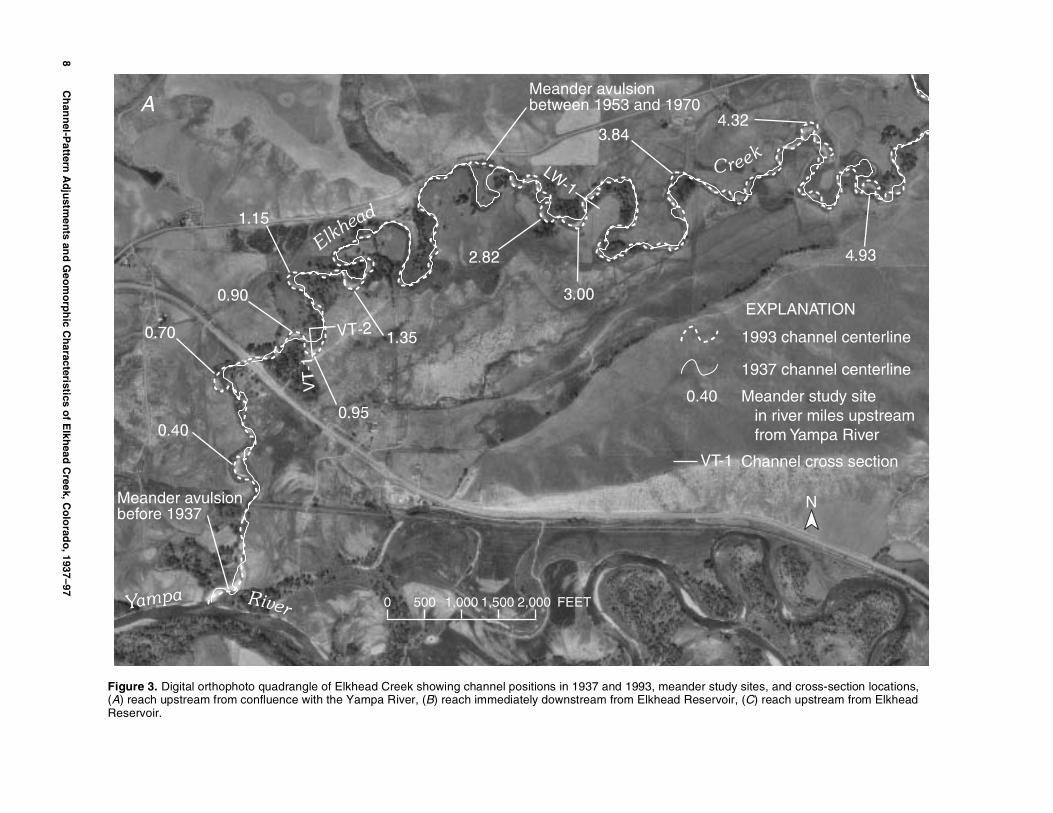
Aerial Photography
Aerial photographs of the Elkhead Creek water-shed spanning several years reveal the channel condi-tion and position at discrete times. Year-to-year comparisons of the channel position in photographs rectified to remove optical distortion allows quantifi-cation of channel change during the periods between the photograph dates. Meander scrolls, oxbow lakes, and other landforms visible in these photographs also provide a means to interpret geomorphic conditions from a period before the first photographs were taken. Gurnell (1997) described a method for quantifying temporal and spatial river channel changes using aerial photography, onsite cross-section surveys, and a geographical information system (GIS).
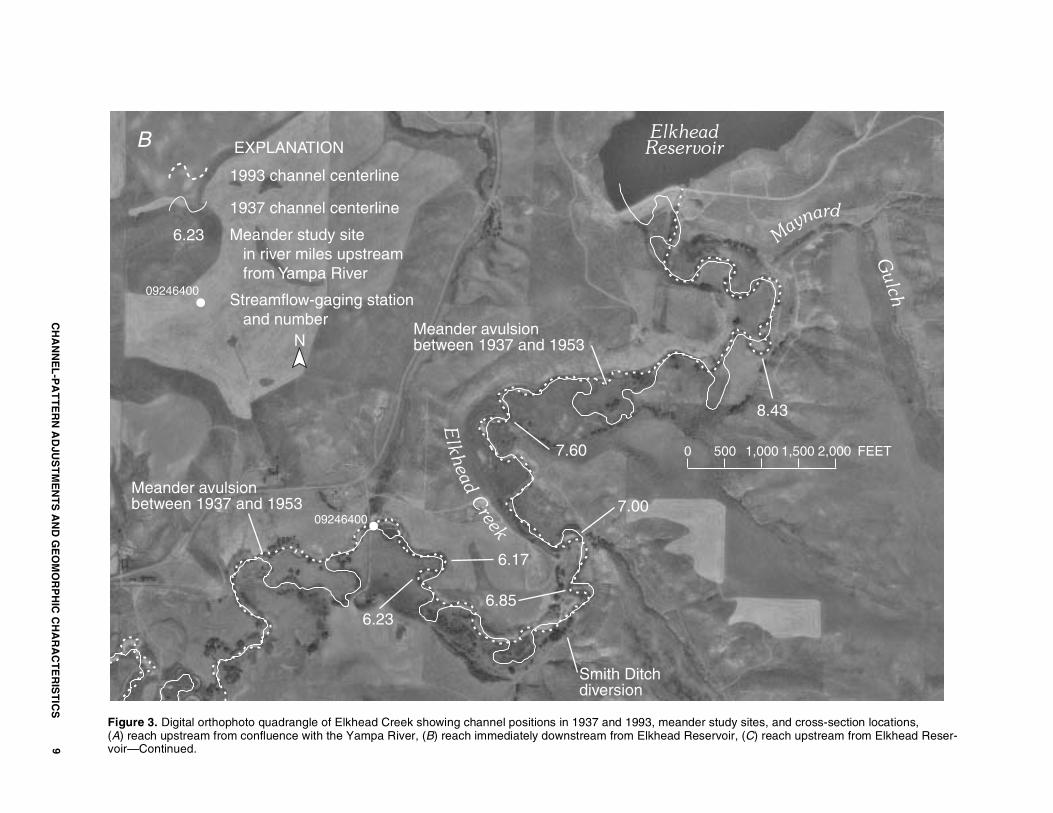
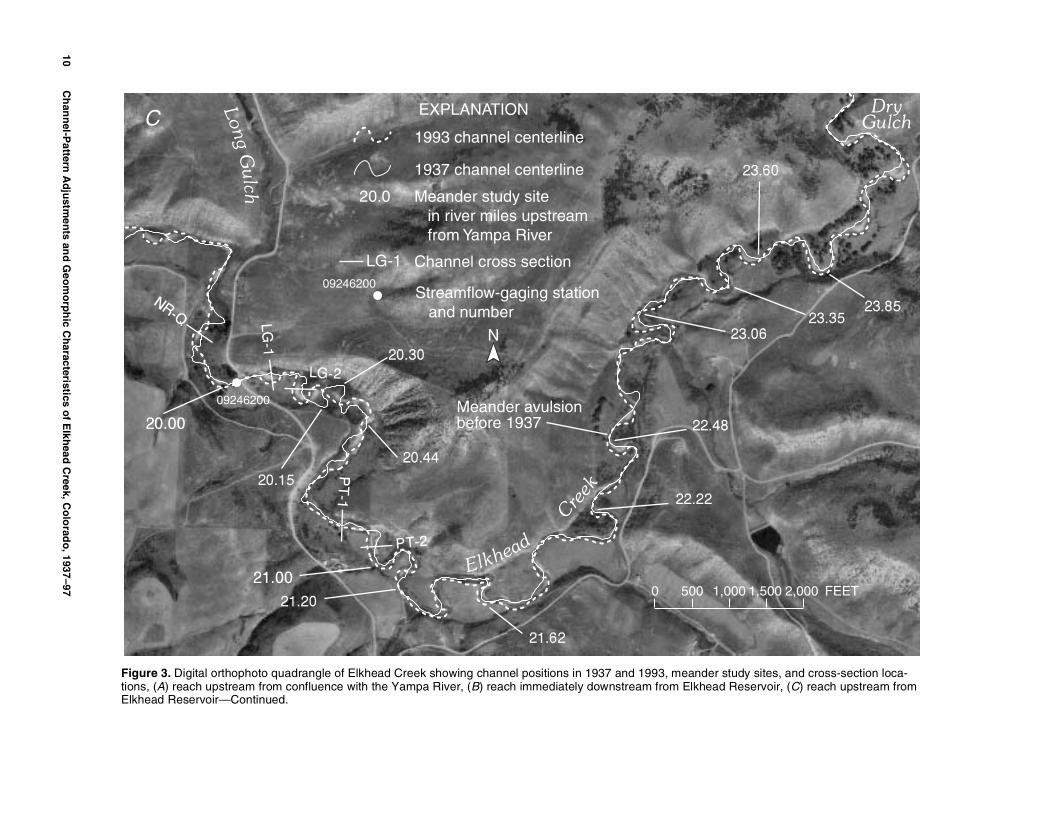
Aerial photographs (fig. 3) were used to deter-mine the channel position in 6 specific years and were the basis for calculating meander migration rates and deltaic sedimentation rates. Photographs selected for the Elkhead Creek geomorphic analysis were taken in 1937, 1953, 1970, 1977, 1981, and 1993. Most of the photographs were taken in August or September when seasonal streamflow had receded to low levels. Photo-graphs taken in 1953 and 1970 bracket a period of relatively small flood peaks when only about one-half of the annual flood peaks exceeded the estimated bankfull discharge (fig. 2). Photographs taken in 1977 and 1993 bracket a comparable length of time in which annual flood peaks exceeded the estimated bankfull discharge about the same number of times as in the 1953 through 1970 time period, but with much greater magnitude. The photographs taken in 1977 and there-after also document the period since construction of Elkhead Reservoir in 1974.
The Elkhead Creek aerial photographs were enlarged to 18 × 18-inch prints having scales of approximately 1:6,000. The enlarged photographs were digitally scanned, and these images were elec-tronically processed to remove optical distortion and photographic parallax common to many aerial photo-graphs. Digital orthophoto quadrangle (DOQ) maps of areas in the Elkhead Creek watershed were created in 1997 by the USGS from 1993 National Aerial Photog-raphy Program (NAPP) high-altitude aerial photo-
graphs. A DOQ map is a photographic image in which all points have been made planimetric and have been rectified to a standard map-projection coordinate system (latitude/longitude, Universal Transverse Mercator, and so forth). The 1937, 1953, 1970, 1977, and 1981 aerial photographs were registered and recti-fied to the 1997 DOQ images before geomorphic measurements and analysis were conducted. Digital image processing and geometric correction are described in greater detail by Jensen (1996).
Digital image processing, rectification, and registration to the 1997 DOQ maps were done with ArcView Spatial Analyst software (Environmental Systems Research Institute, 1996). Several semiper-manent features such as buildings, road intersections, and trees, visible in all photographs and in the DOQ, were used as rectification control points. These points were at elevations similar to the stream elevation, thereby reducing the potential for rectification error caused by relief displacement (Gurnell, 1997). The original aerial photographs were rectified to the scale and coordinates of the DOQ image with second-order polynomial affine transformation functions fitted to the control points using a least-squares criterion (Jensen, 1996, p.127). Initially, the fit between the rectified image and the DOQ standard was evaluated qualitatively by observing the degree of registration of the control points and other semipermanent geo-graphic features, such as roads and fence lines, on an overlay of the rectified image and the DOQ. In addi-tion, the fit was evaluated quantitatively with root-mean-square error (RMSE) and chi-squared (χ2) statistics calculated by the ArcView Spatial Analyst extension. The RMSE is an estimate of the standard deviation of the dependent variable, in this case the plotting position of the control points in the rectified image. The RMSE describes the deviation between the control-point locations on the rectified photograph and the control-point coordinates calculated by the trans-formation function. The χ2 statistic is a measure of the association between two distributions and, in this anal-ysis, is strongly correlated with RMSE.
The initial photograph-rectification step produced a reasonably good fit to the DOQ, but for some photographs the fit could be improved by elimi-nating one or more specific control points with large individual RMSE and χ2. Selected control points were removed iteratively, and the unrectified image was rectified again until the stepwise decrease in total RMSE and χ2 variables became negligible. Table 2
8C
han
nel-P
attern A
dju
stmen
ts and
Geo
mo
rph
ic Ch
aracteristics of E
lkhead
Creek, C
olo
rado
, 1937–97
EXPLANATION
Meander study site in river miles upstream from Yampa River
Channel cross section
LW-1
Meander avulsionbefore 1937
Meander avulsionbetween 1953 and 1970
Elkhead
Creek
1993 channel centerline
1937 channel centerline
N
0.40
VT-1
Yampa River
A
0 500 1,000 1,500 2,000 FEET
Figure 3. Digital orthophoto quadrangle of Elkhead Creek showing channel positions in 1937 and 1993, meander study sites, and cross-section locations, (A) reach upstream from confluence with the Yampa River, (B) reach immediately downstream from Elkhead Reservoir, (C) reach upstream from Elkhead Reservoir.
CH
AN
NE
L-P
AT
TE
RN
AD
JUS
TM
EN
TS
AN
D G
EO
MO
RP
HIC
CH
AR
AC
TE
RIS
TIC
S9
0 500 1,000 1,500 2,000 FEET
6.23
6.17
7.00
8.43
7.60
6.85
EXPLANATIONB
Meander study site in river miles upstream from Yampa River
Streamflow-gaging station and number
1993 channel centerline
1937 channel centerline
N
6.23
ElkheadReservoir
Maynard
Gulch
Elkhead
Creek
09246400
09246400
Meander avulsionbetween 1937 and 1953
Smith Ditchdiversion
Meander avulsionbetween 1937 and 1953
Figure 3. Digital orthophoto quadrangle of Elkhead Creek showing channel positions in 1937 and 1993, meander study sites, and cross-section locations, (A) reach upstream from confluence with the Yampa River, (B) reach immediately downstream from Elkhead Reservoir, (C) reach upstream from Elkhead Reser-voir—Continued.
10C
han
nel-P
attern A
dju
stmen
ts and
Geo
mo
rph
ic Ch
aracteristics of E
lkhead
Creek, C
olo
rado
, 1937–97
Meander avulsionbefore 1937
Elkhead
Creek
LongG
ulch
DryGulch
EXPLANATIONC
Meander study site in river miles upstream from Yampa River
Channel cross section
1993 channel centerline
1937 channel centerline
N
20.0
LG-1
Streamflow-gaging station and number
09246200
09246200
0 500 1,000 1,500 2,000 FEET
Figure 3. Digital orthophoto quadrangle of Elkhead Creek showing channel positions in 1937 and 1993, meander study sites, and cross-section loca-tions, (A) reach upstream from confluence with the Yampa River, (B) reach immediately downstream from Elkhead Reservoir, (C) reach upstream from Elkhead Reservoir—Continued.
11CHANNEL-PATTERN ADJUSTMENTS AND GEOMORPHIC CHARACTERISTICS
presents summary statistics from the photograph-rectification procedure.
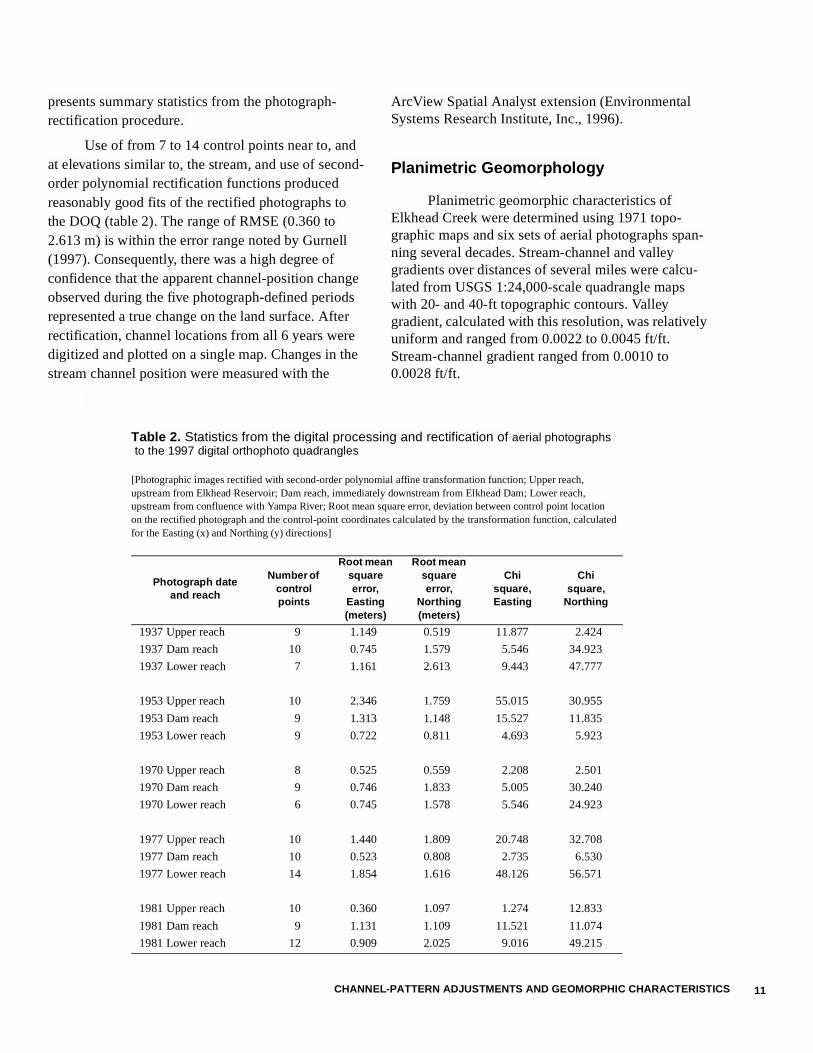
Use of from 7 to 14 control points near to, and at elevations similar to, the stream, and use of second-order polynomial rectification functions produced reasonably good fits of the rectified photographs to the DOQ (table 2). The range of RMSE (0.360 to 2.613 m) is within the error range noted by Gurnell (1997). Consequently, there was a high degree of confidence that the apparent channel-position change observed during the five photograph-defined periods represented a true change on the land surface. After rectification, channel locations from all 6 years were digitized and plotted on a single map. Changes in the stream channel position were measured with the
ArcView Spatial Analyst extension (Environmental Systems Research Institute, Inc., 1996).
Planimetric Geomorphology
Planimetric geomorphic characteristics of Elkhead Creek were determined using 1971 topo-graphic maps and six sets of aerial photographs span-ning several decades. Stream-channel and valley gradients over distances of several miles were calcu-lated from USGS 1:24,000-scale quadrangle maps with 20- and 40-ft topographic contours. Valley gradient, calculated with this resolution, was relatively uniform and ranged from 0.0022 to 0.0045 ft/ft. Stream-channel gradient ranged from 0.0010 to 0.0028 ft/ft.
Table 2. Statistics from the digital processing and rectification of aerial photographs to the 1997 digital orthophoto quadrangles
[Photographic images rectified with second-order polynomial affine transformation function; Upper reach, upstream from Elkhead Reservoir; Dam reach, immediately downstream from Elkhead Dam; Lower reach, upstream from confluence with Yampa River; Root mean square error, deviation between control point location on the rectified photograph and the control-point coordinates calculated by the transformation function, calculated for the Easting (x) and Northing (y) directions]
Photograph dateand reach
Number of control points
Root mean square error,
Easting (meters)
Root mean square error,
Northing (meters)
Chi square, Easting
Chi square,
Northing
1937 Upper reach 9 1.149 0.519 11.877 2.424
1937 Dam reach 10 0.745 1.579 5.546 34.923
1937 Lower reach 7 1.161 2.613 9.443 47.777
1953 Upper reach 10 2.346 1.759 55.015 30.955
1953 Dam reach 9 1.313 1.148 15.527 11.835
1953 Lower reach 9 0.722 0.811 4.693 5.923
1970 Upper reach 8 0.525 0.559 2.208 2.501
1970 Dam reach 9 0.746 1.833 5.005 30.240
1970 Lower reach 6 0.745 1.578 5.546 24.923
1977 Upper reach 10 1.440 1.809 20.748 32.708
1977 Dam reach 10 0.523 0.808 2.735 6.530
1977 Lower reach 14 1.854 1.616 48.126 56.571
1981 Upper reach 10 0.360 1.097 1.274 12.833
1981 Dam reach 9 1.131 1.109 11.521 11.074
1981 Lower reach 12 0.909 2.025 9.016 49.215
12 Channel-Pattern Adjustments and Geomorphic Characteristics of Elkhead Creek, Colorado, 1937–97
Sinuosity, a descriptor of channel pattern defined as the downstream in-channel distance divided by the down-valley linear distance, is spatially and temporally variable and is influenced by valley gradient, streamflow magnitude, sediment load, and the mechanics of meander development (Schumm, 1977; Schumm and Khan, 1972). Elkhead Creek sinu-osity, calculated from the 1971 topographic maps, ranged from 1.08 to 2.57 and averaged 1.57 between Dry Gulch and the confluence with the Yampa River. A stream reach may have a constant average sinuosity, yet within the reach the channel position may change substantially (for example, a meander cutoff in one bend may be offset by meander amplitude increase in another nearby bend).
Channel migration rates are strongly controlled by the unit stream power (essentially a function of discharge and channel gradient), bank erosion resis-tance (a function of sediment size, cohesiveness, strati-graphic relations, and vegetation characteristics), bank height, meander-bend radius of curvature, channel width, and sediment transport (Hickin and Nanson, 1984). Hickin and Nanson found that the maximum channel migration rates occur where the ratio of meander radius of curvature to channel width, r/w, is between about 2.0 and 3.0 in gravel-bed rivers in western Canada. In straighter reaches (r/w greater than about 3.0), channel migration usually is very slow. In reaches with tight bends (r/w less than about 2.0), channel migration rates decrease because flow breaks down into large eddies that markedly increase flow resistance (Hickin, 1974). Flow resistance in a meander bend can be minimized as the channel gradu-ally changes its cross-section form or bend radius of curvature through bank erosion, or by abruptly changing its position through a meander cutoff, or avulsion. Either process involves erosion and remobili-zation of sediment that may be a valuable resource, such as a pasture, hay meadow, road, or building site.
Channel adjustments from 1938 through 1993 were studied in individual meander bends to assess trends in erosion rates along Elkhead Creek. Meander migration was measured along the erosional axis of the meander, generally at the apex of the meander, or where the meander bend radius of curvature, r, was a minimum. This is the location where the channel migration rate usually is greatest (Hickin and Nanson, 1984) and, although greater than the overall channel migration rate through the entire valley, it is where increases or decreases in channel migration rates are
easiest to detect. Ranchers, landowners, and resource managers are sensitive to losses of productive land and observe the greatest change at these meander loca-tions.
Meander bends included in this study were selected to be representative of other meanders in the valley. Seventeen meanders were selected in the reach downstream from Elkhead Dam (figs. 3A and 3B), and 13 meanders were selected in the reach upstream from the backwater effects of Elkhead Reservoir (fig. 3C). The upstream reach was considered the control reach, unaffected by Elkhead Reservoir (completed in 1974). Meanders selected for study generally were free to migrate through the Elkhead Creek flood plain; however, some meander bends impinged against adja-cent valley side slopes from time to time. Valley side-slope impingement usually resulted in a directional change in meander migration, which is typical of meanders throughout the upper reach and in the lower reach immediately downstream from Elkhead Dam where the valley side slopes are closely spaced. The study excluded meanders that had been significantly affected by human activity, such as those fixed in posi-tion by bridge works or those meanders intentionally cut off by mechanical means.
Elkhead Creek meander migration rates were calculated using a variation of the method developed by Hickin (1974) and Hickin and Nanson (1984). Hickin (1974) calculated meander migration rates along erosion pathlines, or orthogonals, connecting the point of minimum radius of curvature of time-sequen-tial meander bend locations. The erosional axis of the meander was the orthogonal reflecting the greatest lateral migration rate of the meander on the flood plain. Hickin’s (1974) technique was developed using aerial photographs of western Canadian meander bends that had pronounced ridge-and-swale topog-raphy accentuated by riparian vegetation. The ridge-and-swale features were formed by the stream as the meander bend migrated laterally, forming a point-bar complex. Meander bend location and morphology from several periods before the photograph date were well preserved in the ridge-and-swale topography visible in Hickin’s photographs. As a result, the orthogonals Hickin plotted generally reflected a continuous progression of meander development through time.
The Elkhead Creek meanders occur in a region where riparian vegetation and land-use practices do not accentuate the meander ridge-and-swale topog-
13CHANNEL-PATTERN ADJUSTMENTS AND GEOMORPHIC CHARACTERISTICS
raphy preserved in point-bar complexes. Conse-quently, only the active channel position visible in the photograph was used in the Elkhead Creek analysis. Because some of the Elkhead Creek photographs are separated by as much as 16 or 17 years of time, the channel position changes quantified for this analysis reflect average rates for the time interval. The channel center line, rather than the eroding concave bank, was digitized from each rectified aerial photograph. The center line was more easily visible and more objec-tively determined from the Elkhead Creek photo-graphs than was the concave bank. Also, reversals in channel position (negative migration rates) were easier to detect in the channel center line than along the concave bank. The error in locating the channel center line partly is a function of the aerial photograph-recti-fication precision (table 2) and the resolution of fluvial features in the photograph. The latter error probably is less than one-half the width of the low-discharge water surface, which ranged from 31 to 50 ft when channel surveys were made in 1997.
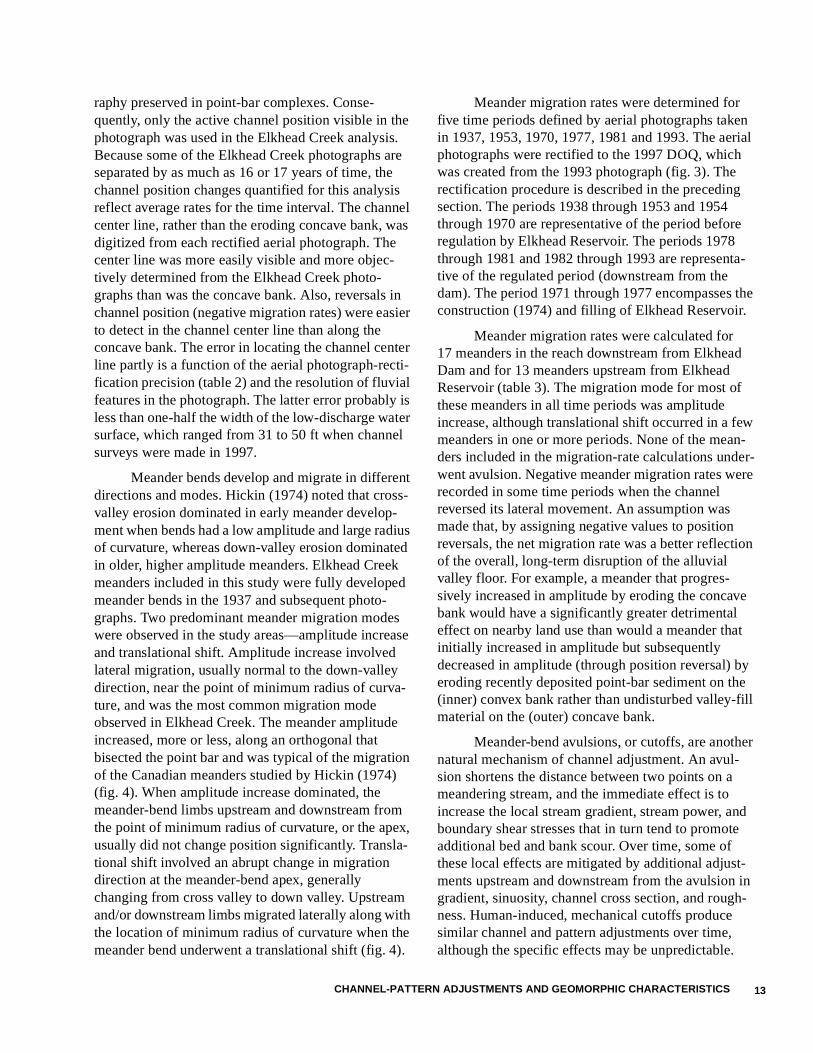
Meander bends develop and migrate in different directions and modes. Hickin (1974) noted that cross-valley erosion dominated in early meander develop-ment when bends had a low amplitude and large radius of curvature, whereas down-valley erosion dominated in older, higher amplitude meanders. Elkhead Creek meanders included in this study were fully developed meander bends in the 1937 and subsequent photo-graphs. Two predominant meander migration modes were observed in the study areas—amplitude increase and translational shift. Amplitude increase involved lateral migration, usually normal to the down-valley direction, near the point of minimum radius of curva-ture, and was the most common migration mode observed in Elkhead Creek. The meander amplitude increased, more or less, along an orthogonal that bisected the point bar and was typical of the migration of the Canadian meanders studied by Hickin (1974) (fig. 4). When amplitude increase dominated, the meander-bend limbs upstream and downstream from the point of minimum radius of curvature, or the apex, usually did not change position significantly. Transla-tional shift involved an abrupt change in migration direction at the meander-bend apex, generally changing from cross valley to down valley. Upstream and/or downstream limbs migrated laterally along with the location of minimum radius of curvature when the meander bend underwent a translational shift (fig. 4).
Meander migration rates were determined for five time periods defined by aerial photographs taken in 1937, 1953, 1970, 1977, 1981 and 1993. The aerial photographs were rectified to the 1997 DOQ, which was created from the 1993 photograph (fig. 3). The rectification procedure is described in the preceding section. The periods 1938 through 1953 and 1954 through 1970 are representative of the period before regulation by Elkhead Reservoir. The periods 1978 through 1981 and 1982 through 1993 are representa-tive of the regulated period (downstream from the dam). The period 1971 through 1977 encompasses the construction (1974) and filling of Elkhead Reservoir.
Meander migration rates were calculated for 17 meanders in the reach downstream from Elkhead Dam and for 13 meanders upstream from Elkhead Reservoir (table 3). The migration mode for most of these meanders in all time periods was amplitude increase, although translational shift occurred in a few meanders in one or more periods. None of the mean-ders included in the migration-rate calculations under-went avulsion. Negative meander migration rates were recorded in some time periods when the channel reversed its lateral movement. An assumption was made that, by assigning negative values to position reversals, the net migration rate was a better reflection of the overall, long-term disruption of the alluvial valley floor. For example, a meander that progres-sively increased in amplitude by eroding the concave bank would have a significantly greater detrimental effect on nearby land use than would a meander that initially increased in amplitude but subsequently decreased in amplitude (through position reversal) by eroding recently deposited point-bar sediment on the (inner) convex bank rather than undisturbed valley-fill material on the (outer) concave bank.
Meander-bend avulsions, or cutoffs, are another natural mechanism of channel adjustment. An avul-sion shortens the distance between two points on a meandering stream, and the immediate effect is to increase the local stream gradient, stream power, and boundary shear stresses that in turn tend to promote additional bed and bank scour. Over time, some of these local effects are mitigated by additional adjust-ments upstream and downstream from the avulsion in gradient, sinuosity, channel cross section, and rough-ness. Human-induced, mechanical cutoffs produce similar channel and pattern adjustments over time, although the specific effects may be unpredictable.
14C
han
nel-P
attern A
dju
stmen
ts and
Geo
mo
rph
ic Ch
aracteristics of E
lkhead
Creek, C
olo
rado
, 1937–97
Meander 20.30Orthogonal Years Migration Mode
1993
1981
19701977
1953
1937
Down valley
Cro
ss v
alle
y
1
2
34
5
Upstream limb ofMeander 20.15
in 1937
Downstream limb ofMeander 20.15
in 1937
Meander bendapex
in 19371 1938–53 Amplitude increase2 1954–70 Amplitude increase3 1971–77 Translational shift4 1978–81 Translational shift5 1982–93 Translational shift
0 50 100 150 200 FEET
Meander 20.30, 1937 to 1993
N
Figure 4. Channel centerline of Elkhead Creek meander 20.30 in 1937, 1953, 1970, 1977, 1981, and 1993 showing amplitude increase during the period 1938 through 1970 and translational shift during the period 1971 through 1993.
15CHANNEL-PATTERN ADJUSTMENTS AND GEOMORPHIC CHARACTERISTICS
Several meander avulsions occurred in Elkhead Creek during the periods defined by the aerial photo-graphs (figs. 3A and 3B), and two avulsions were observed that occurred since 1993. The remnants of several avulsions that occurred before 1937 also could be seen on terraces and the flood plain (figs. 3A and 3C). Some avulsions were human induced (Donald Van Tassel, local resident, oral commun., 1997); others probably were the result of progressive channel adjust-ments. The avulsion rate in the reach downstream from Elkhead Reservoir was 4.6 avulsions per valley mile per century for the 1938 through 1970 period and 2.1 avulsions per valley mile per century for the 1971 through 1997 period. By comparison, the avulsion rate in the reach upstream from Elkhead Reservoir was 2.0 avulsions per valley mile per century for the 1938 through 1970 period and 1.4 avulsions per valley mile per century for the 1971 through 1997 period. Meander avulsion rate is not an accurate indicator of channel-pattern instability for Elkhead Creek because of the intentional cutoff of some meanders. However, because adjustments to either natural or human-induced avulsions tend to propagate to nearby channel segments, a higher incidence of avulsion may correlate with a higher rate of channel migration, bank erosion, or sedimentation in nearby reaches.
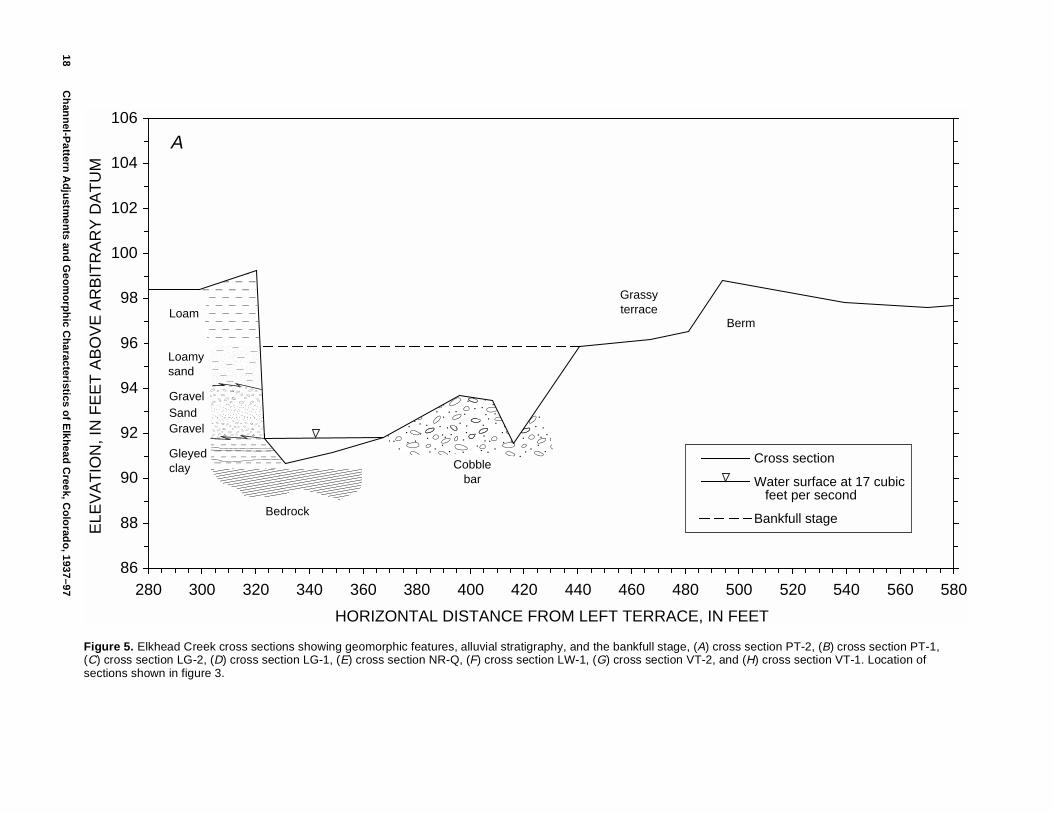
Cross-Sectional Geomorphology
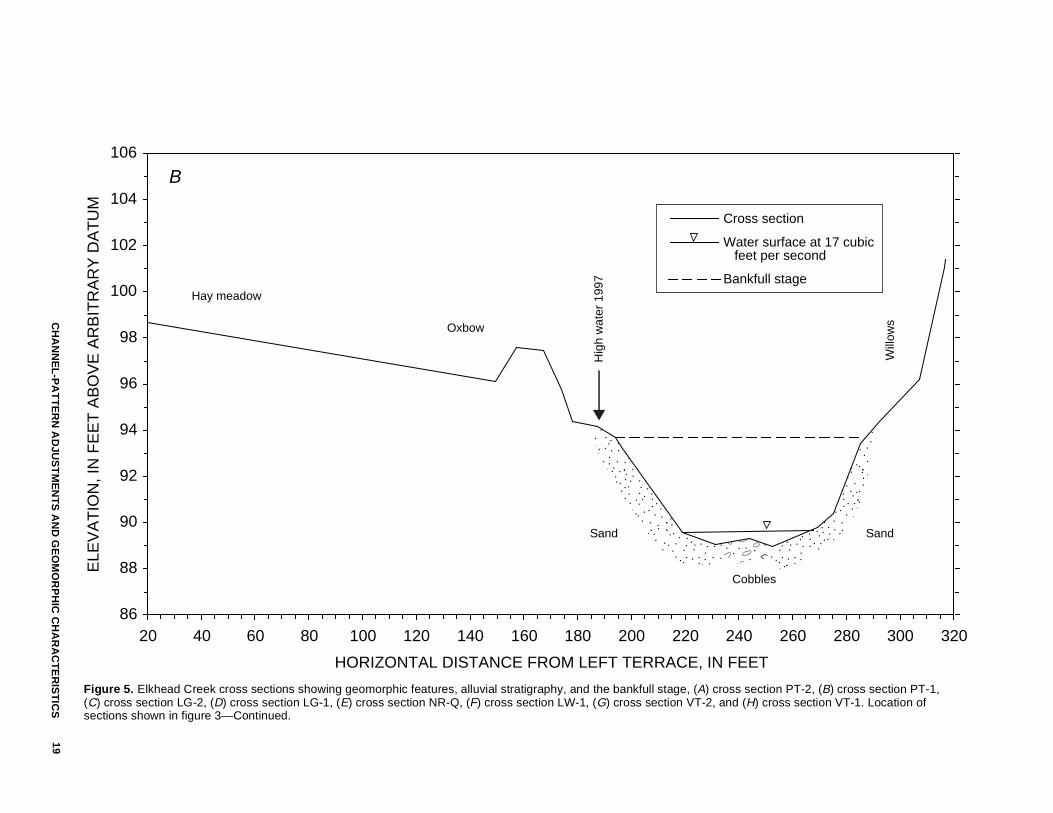
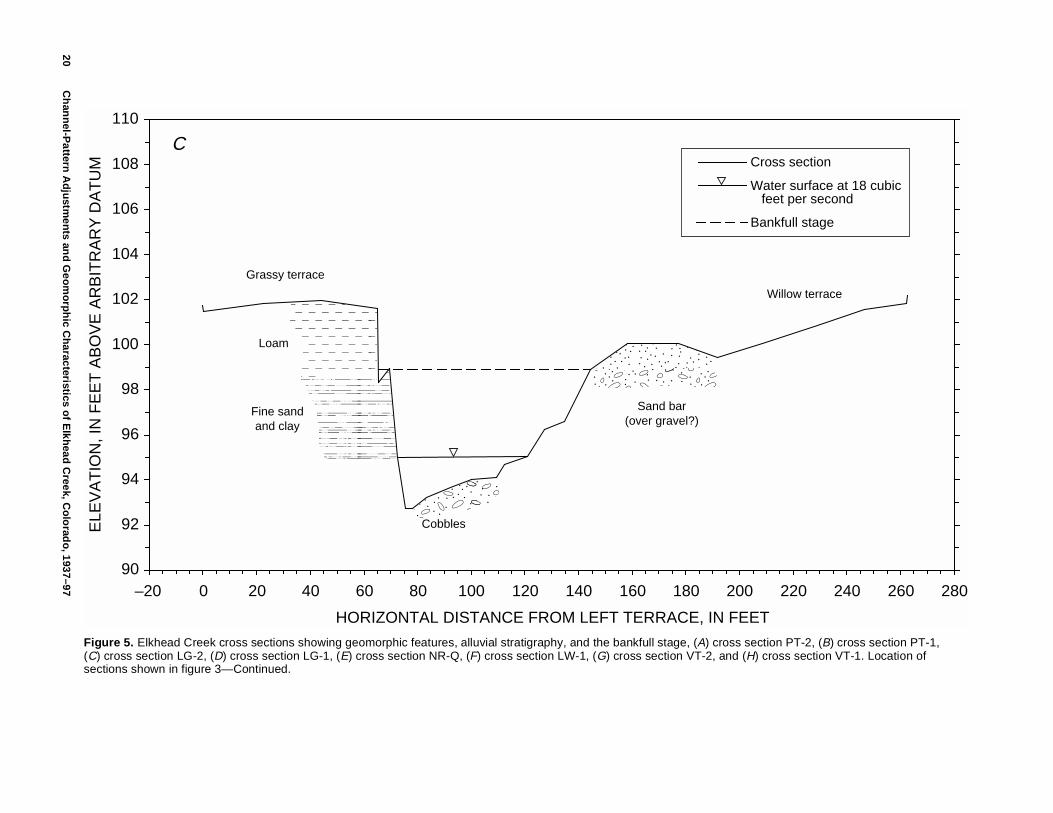
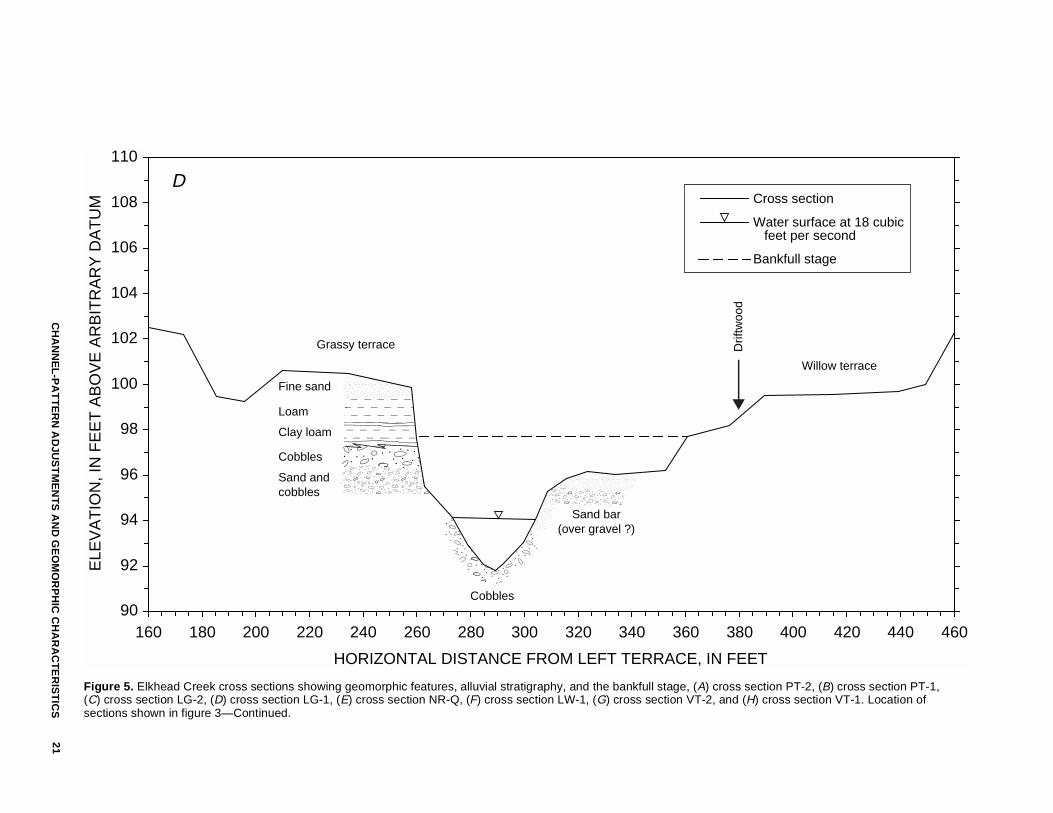
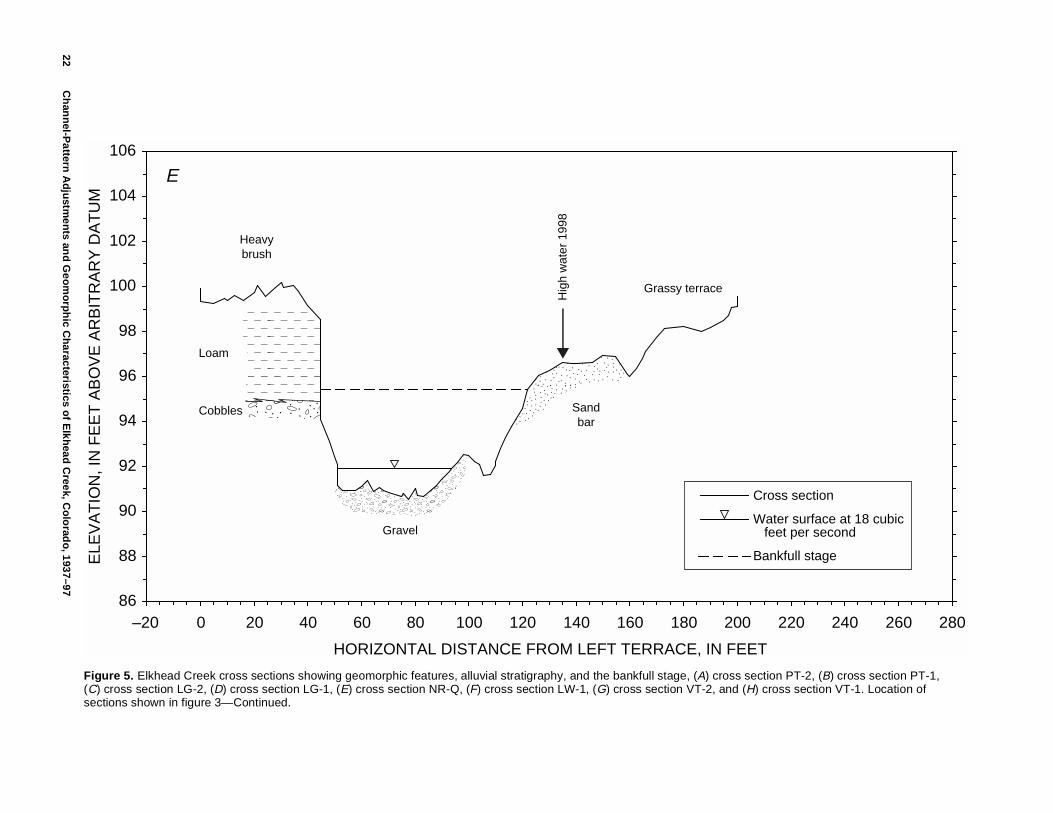
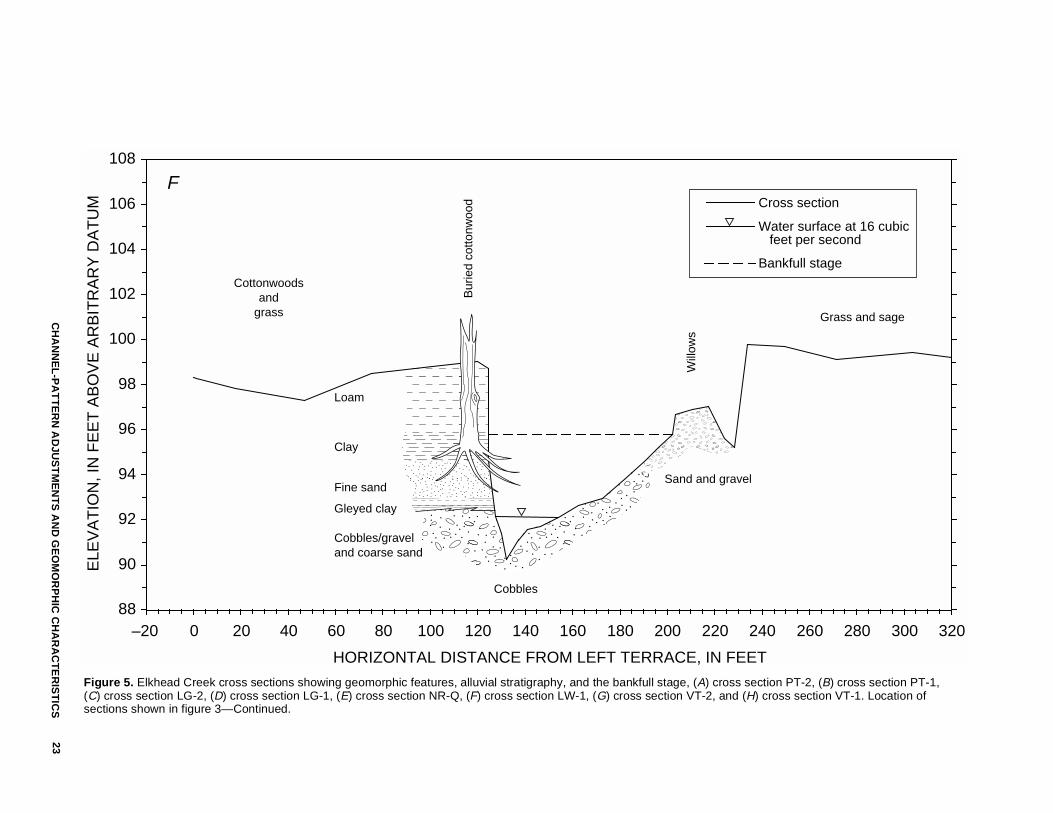
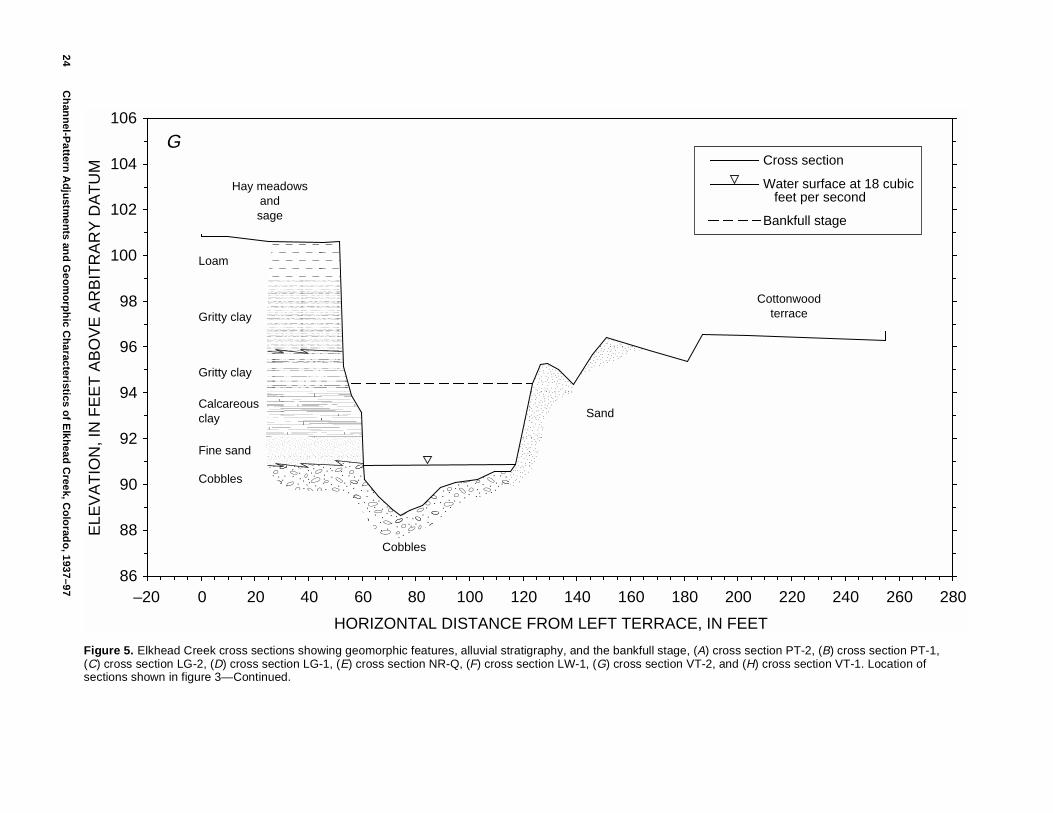
Channel-geometry characteristics and the water-surface slope of Elkhead Creek were surveyed at eight cross sections using a total-station laser theodolite in 1997 (fig. 5). Characteristics of sediment in the channel and the stratigraphy of the valley-fill material were determined from onsite inspection during the surveys. Cross sections selected were representative of the channel morphology upstream and downstream from Elkhead Reservoir. All sections except VT-1 were located in relatively straight reaches; cross section VT-1 was located in a meander bend. The surveys allowed determination of bankfull width and depth, the depth of incision below the valley floor or terrace surfaces, and the elevation of alternate bars and point bars. Water-surface slope and cross-sectional characteristics were used to estimate boundary shear stress for selected streamflows.
Bankfull discharge at the new gaging station above Long Gulch (09246200) was estimated to be approximately 1,800 ft3/s, based on surveyed channel
characteristics at cross sections PT-1 (fig. 5B) and LG-1 (fig. 5D), the 1997 high water marks (peak discharge 2,760 ft3/s), and water-surface observations in the spring of 1998. This bankfull discharge estimate is applicable to all of the surveyed cross sections in the study reach upstream from Elkhead Reservoir (figs. 5A–5E). Based on the limited streamflow record at the new gage below Maynard Gulch (09246400), the correlation between streamflow at the Long Gulch and Maynard Gulch gages (described in a previous section) and channel surveys, the estimated bankfull discharge is between 1,800 and 2,200 ft3/s in the downstream reach. Bankfull width of the eight surveyed cross sections ranged between 67 and 122 ft and averaged 88 ft. The surveys were conducted at low flow, approximately 17 ft3/s, and the average water-surface width was 41 ft. The bankfull width to depth (W/D) ratio ranged from 12 to 24 and averaged 16.5. Bankfull water-surface slope ranged from 0.0012 to 0.0039 and averaged 0.0023.
Anecdotal evidence from local landowners and residents suggests the channel of Elkhead Creek may have incised in recent decades both upstream and downstream from Elkhead Reservoir (Donald Van Tassel and Leroy Lawton, local residents, oral commun., 1997). A broad terrace surface forms the valley floor along Elkhead Creek in the study reaches. This terrace surface is used for grazing and hay production throughout the valley. If this terrace surface is used as a very crude vertical reference to a former flood-plain surface, an estimation of subsequent vertical incision can be made. The contemporary bankfull surface ranges from 2.5 to 3.8 ft below the terrace surface at cross sections upstream from Elkhead Reservoir (figs. 5A–5E) and 2.9 to 6.2 ft below the terrace at cross sections downstream from the reservoir (figs. 5F–5H). Buried, intact tree trunks and dense root masses were observed in the valley-fill material exposed by the cutbank at cross section LW-1 (fig. 5F), indicating vertical aggradation of a former flood-plain surface in this reach and subsequent inci-sion to a lower elevation, possibly within the last century. No ages were obtained for the contemporary valley-floor terrace surface or the buried surface on which these trees were rooted; however, one of the partially buried cottonwood trees (Populus deltoides) was still living in 1997.
Stratigraphy of the uppermost valley-fill mate-rial was recorded from cutbank exposures onsite and is summarized in the cross sections in figure 5. The
16 Channel-Pattern Adjustments and Geomorphic Characteristics of Elkhead Creek, Colorado, 1937–97
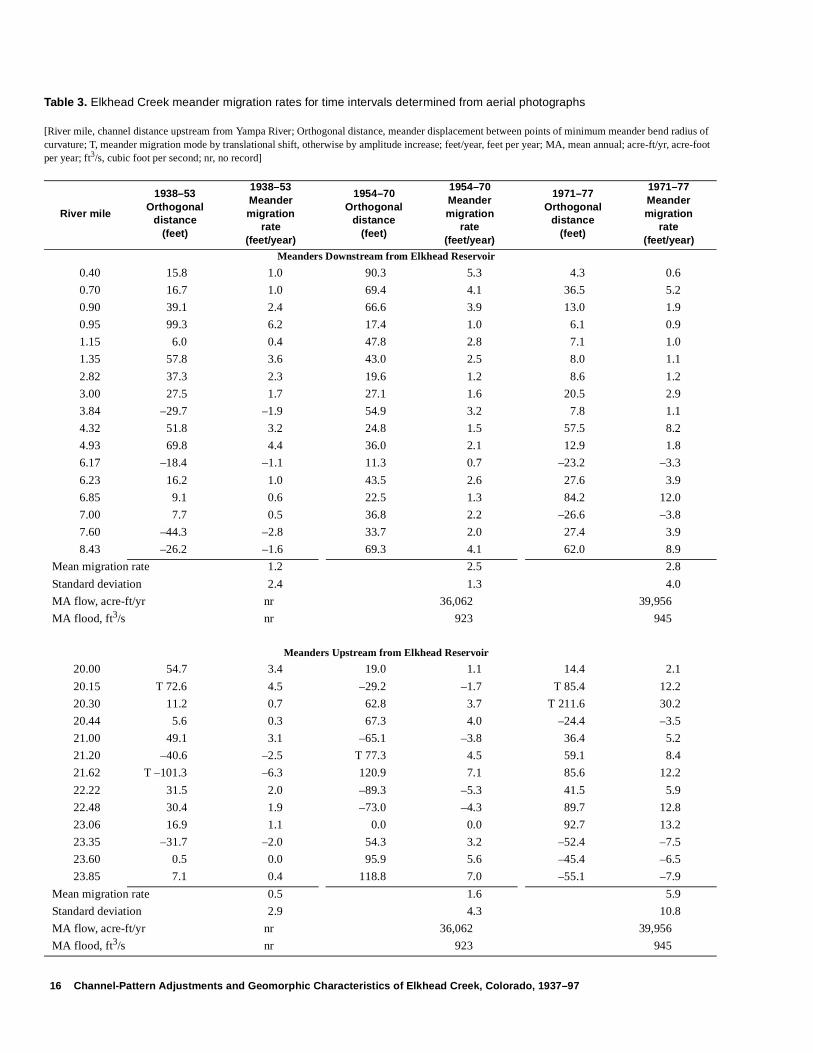
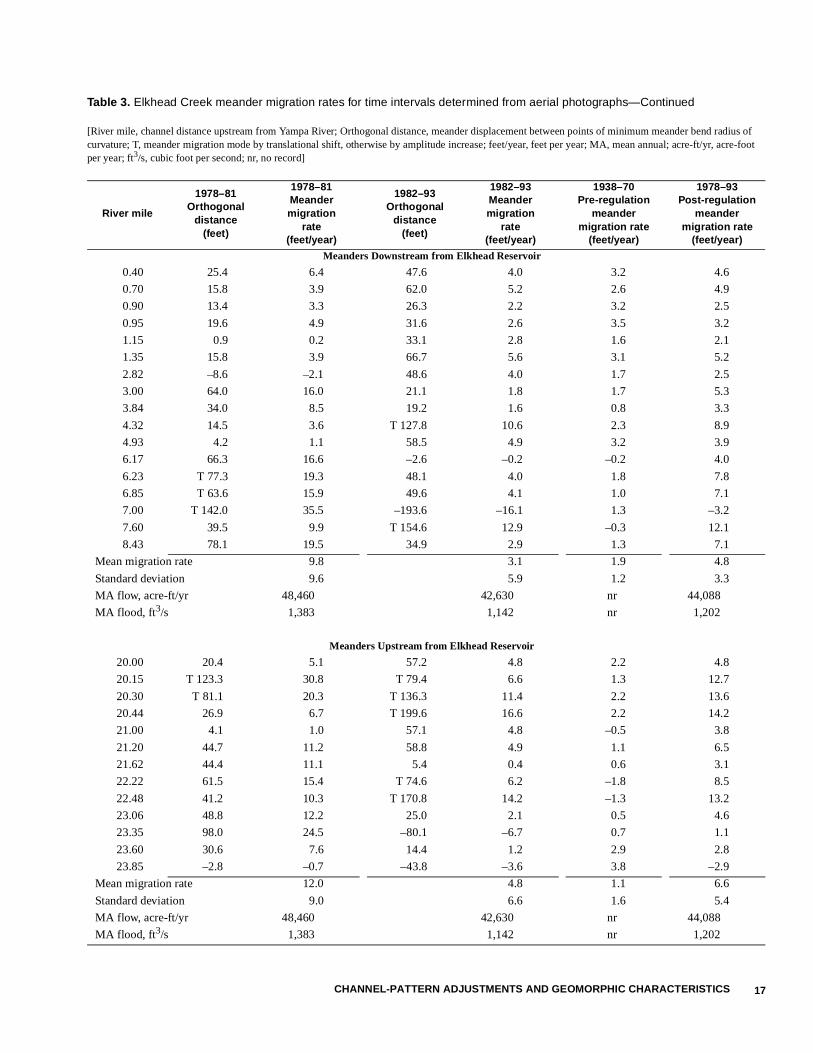
Table 3. Elkhead Creek meander migration rates for time intervals determined from aerial photographs
[River mile, channel distance upstream from Yampa River; Orthogonal distance, meander displacement between points of minimum meander bend radius of curvature; T, meander migration mode by translational shift, otherwise by amplitude increase; feet/year, feet per year; MA, mean annual; acre-ft/yr, acre-foot per year; ft3/s, cubic foot per second; nr, no record]
River mile
1938–53 Orthogonal
distance(feet)
1938–53 Meandermigration
rate(feet/year)
1954–70 Orthogonal
distance(feet)
1954–70 Meandermigration
rate(feet/year)
1971–77 Orthogonal
distance(feet)
1971–77 Meandermigration
rate(feet/year)
Meanders Downstream from Elkhead Reservoir
0.40 15.8 1.0 90.3 5.3 4.3 0.6
0.70 16.7 1.0 69.4 4.1 36.5 5.2
0.90 39.1 2.4 66.6 3.9 13.0 1.9
0.95 99.3 6.2 17.4 1.0 6.1 0.9
1.15 6.0 0.4 47.8 2.8 7.1 1.0
1.35 57.8 3.6 43.0 2.5 8.0 1.1
2.82 37.3 2.3 19.6 1.2 8.6 1.2
3.00 27.5 1.7 27.1 1.6 20.5 2.9
3.84 –29.7 –1.9 54.9 3.2 7.8 1.1
4.32 51.8 3.2 24.8 1.5 57.5 8.2
4.93 69.8 4.4 36.0 2.1 12.9 1.8
6.17 –18.4 –1.1 11.3 0.7 –23.2 –3.3
6.23 16.2 1.0 43.5 2.6 27.6 3.9
6.85 9.1 0.6 22.5 1.3 84.2 12.0
7.00 7.7 0.5 36.8 2.2 –26.6 –3.8
7.60 –44.3 –2.8 33.7 2.0 27.4 3.9
8.43 –26.2 –1.6 69.3 4.1 62.0 8.9
Mean migration rate 1.2 2.5 2.8
Standard deviation 2.4 1.3 4.0
MA flow, acre-ft/yr nr 36,062 39,956
MA flood, ft3/s nr 923 945
Meanders Upstream from Elkhead Reservoir
20.00 54.7 3.4 19.0 1.1 14.4 2.1
20.15 T 72.6 4.5 –29.2 –1.7 T 85.4 12.2
20.30 11.2 0.7 62.8 3.7 T 211.6 30.2
20.44 5.6 0.3 67.3 4.0 –24.4 –3.5
21.00 49.1 3.1 –65.1 –3.8 36.4 5.2
21.20 –40.6 –2.5 T 77.3 4.5 59.1 8.4
21.62 T –101.3 –6.3 120.9 7.1 85.6 12.2
22.22 31.5 2.0 –89.3 –5.3 41.5 5.9
22.48 30.4 1.9 –73.0 –4.3 89.7 12.8
23.06 16.9 1.1 0.0 0.0 92.7 13.2
23.35 –31.7 –2.0 54.3 3.2 –52.4 –7.5
23.60 0.5 0.0 95.9 5.6 –45.4 –6.5
23.85 7.1 0.4 118.8 7.0 –55.1 –7.9
Mean migration rate 0.5 1.6 5.9
Standard deviation 2.9 4.3 10.8
MA flow, acre-ft/yr nr 36,062 39,956
MA flood, ft3/s nr 923 945
CHANNEL-PATTERN ADJUSTMENTS AND GEOMORPHIC CHARACTERISTICS 17
Table 3. Elkhead Creek meander migration rates for time intervals determined from aerial photographs—Continued
[River mile, channel distance upstream from Yampa River; Orthogonal distance, meander displacement between points of minimum meander bend radius of curvature; T, meander migration mode by translational shift, otherwise by amplitude increase; feet/year, feet per year; MA, mean annual; acre-ft/yr, acre-foot per year; ft3/s, cubic foot per second; nr, no record]
River mile
1978–81 Orthogonal
distance(feet)
1978–81 Meandermigration
rate (feet/year)
1982–93 Orthogonal
distance(feet)
1982–93 Meandermigration
rate (feet/year)
1938–70Pre-regulation
meandermigration rate
(feet/year)
1978–93Post-regulation
meandermigration rate
(feet/year)
Meanders Downstream from Elkhead Reservoir
0.40 25.4 6.4 47.6 4.0 3.2 4.6
0.70 15.8 3.9 62.0 5.2 2.6 4.9
0.90 13.4 3.3 26.3 2.2 3.2 2.5
0.95 19.6 4.9 31.6 2.6 3.5 3.2
1.15 0.9 0.2 33.1 2.8 1.6 2.1
1.35 15.8 3.9 66.7 5.6 3.1 5.2
2.82 –8.6 –2.1 48.6 4.0 1.7 2.5
3.00 64.0 16.0 21.1 1.8 1.7 5.3
3.84 34.0 8.5 19.2 1.6 0.8 3.3
4.32 14.5 3.6 T 127.8 10.6 2.3 8.9
4.93 4.2 1.1 58.5 4.9 3.2 3.9
6.17 66.3 16.6 –2.6 –0.2 –0.2 4.0
6.23 T 77.3 19.3 48.1 4.0 1.8 7.8
6.85 T 63.6 15.9 49.6 4.1 1.0 7.1
7.00 T 142.0 35.5 –193.6 –16.1 1.3 –3.2
7.60 39.5 9.9 T 154.6 12.9 –0.3 12.1
8.43 78.1 19.5 34.9 2.9 1.3 7.1
Mean migration rate 9.8 3.1 1.9 4.8
Standard deviation 9.6 5.9 1.2 3.3
MA flow, acre-ft/yr 48,460 42,630 nr 44,088
MA flood, ft3/s 1,383 1,142 nr 1,202
Meanders Upstream from Elkhead Reservoir
20.00 20.4 5.1 57.2 4.8 2.2 4.8
20.15 T 123.3 30.8 T 79.4 6.6 1.3 12.7
20.30 T 81.1 20.3 T 136.3 11.4 2.2 13.6
20.44 26.9 6.7 T 199.6 16.6 2.2 14.2
21.00 4.1 1.0 57.1 4.8 –0.5 3.8
21.20 44.7 11.2 58.8 4.9 1.1 6.5
21.62 44.4 11.1 5.4 0.4 0.6 3.1
22.22 61.5 15.4 T 74.6 6.2 –1.8 8.5
22.48 41.2 10.3 T 170.8 14.2 –1.3 13.2
23.06 48.8 12.2 25.0 2.1 0.5 4.6
23.35 98.0 24.5 –80.1 –6.7 0.7 1.1
23.60 30.6 7.6 14.4 1.2 2.9 2.8
23.85 –2.8 –0.7 –43.8 –3.6 3.8 –2.9
Mean migration rate 12.0 4.8 1.1 6.6
Standard deviation 9.0 6.6 1.6 5.4
MA flow, acre-ft/yr 48,460 42,630 nr 44,088
MA flood, ft3/s 1,383 1,142 nr 1,202
18C
han
nel-P
attern A
dju
stmen
ts and
Geo
mo
rph
ic Ch
aracteristics of E
lkhead
Creek, C
olo
rado
, 1937–97
������
�������
������������
��
86
88
90
92
94
96
98
100
102
104
106
280 300 320 340 360 380 400 420 440 460 480 500 520 540 560 580
HORIZONTAL DISTANCE FROM LEFT TERRACE, IN FEET
ELE
VA
TIO
N, I
N F
EE
T A
BO
VE
AR
BIT
RA
RY
DA
TU
M
Cross section
Water surface at 17 cubic feet per second
Bankfull stage
A
Loam
Loamysand
GravelSandGravel
Gleyedclay
Grassyterrace
Berm
Cobblebar
Bedrock��
Figure 5. Elkhead Creek cross sections showing geomorphic features, alluvial stratigraphy, and the bankfull stage, (A) cross section PT-2, (B) cross section PT-1, (C) cross section LG-2, (D) cross section LG-1, (E) cross section NR-Q, (F) cross section LW-1, (G) cross section VT-2, and (H) cross section VT-1. Location of sections shown in figure 3.
CH
AN
NE
L-P
AT
TE
RN
AD
JUS
TM
EN
TS
AN
D G
EO
MO
RP
HIC
CH
AR
AC
TE
RIS
TIC
S19
������
������
��86
88
90
92
94
96
98
100
102
104
106
20 40 60 80 100 120 140 160 180 200 220 240 260 280 300 320
HORIZONTAL DISTANCE FROM LEFT TERRACE, IN FEET
ELE
VA
TIO
N, I
N F
EE
T A
BO
VE
AR
BIT
RA
RY
DA
TU
M
Cross section
Water surface at 17 cubic feet per second
Bankfull stageHay meadow
Oxbow
Hig
h w
ater
199
7
Will
ows
Sand Sand
Cobbles
B
Figure 5. Elkhead Creek cross sections showing geomorphic features, alluvial stratigraphy, and the bankfull stage, (A) cross section PT-2, (B) cross section PT-1, (C) cross section LG-2, (D) cross section LG-1, (E) cross section NR-Q, (F) cross section LW-1, (G) cross section VT-2, and (H) cross section VT-1. Location of sections shown in figure 3—Continued.
20C
han
nel-P
attern A
dju
stmen
ts and
Geo
mo
rph
ic Ch
aracteristics of E
lkhead
Creek, C
olo
rado
, 1937–97
���� ������
����
90
92
94
96
98
100
102
104
106
108
110
–20 0 20 40 60 80 100 120 140 160 180 200 220 240 260 280
HORIZONTAL DISTANCE FROM LEFT TERRACE, IN FEET
ELE
VA
TIO
N, I
N F
EE
T A
BO
VE
AR
BIT
RA
RY
DA
TU
M Cross section
Water surface at 18 cubic feet per second
Bankfull stage
Grassy terrace
Loam
Fine sandand clay
Cobbles
Sand bar(over gravel?)
Willow terrace
C
Figure 5. Elkhead Creek cross sections showing geomorphic features, alluvial stratigraphy, and the bankfull stage, (A) cross section PT-2, (B) cross section PT-1, (C) cross section LG-2, (D) cross section LG-1, (E) cross section NR-Q, (F) cross section LW-1, (G) cross section VT-2, and (H) cross section VT-1. Location of sections shown in figure 3—Continued.
CH
AN
NE
L-P
AT
TE
RN
AD
JUS
TM
EN
TS
AN
D G
EO
MO
RP
HIC
CH
AR
AC
TE
RIS
TIC
S21
��������
����
���������������
������������
90
92
94
96
98
100
102
104
106
108
110
160 180 200 220 240 260 280 300 320 340 360 380 400 420 440 460
HORIZONTAL DISTANCE FROM LEFT TERRACE, IN FEET
ELE
VA
TIO
N, I
N F
EE
T A
BO
VE
AR
BIT
RA
RY
DA
TU
M Cross section
Water surface at 18 cubic feet per second
Bankfull stage
Grassy terrace
Fine sand
Loam
Clay loam
Cobbles
Cobbles
Willow terrace
Sand bar(over gravel ?)
Sand andcobbles
Drif
twoo
d
D
Figure 5. Elkhead Creek cross sections showing geomorphic features, alluvial stratigraphy, and the bankfull stage, (A) cross section PT-2, (B) cross section PT-1, (C) cross section LG-2, (D) cross section LG-1, (E) cross section NR-Q, (F) cross section LW-1, (G) cross section VT-2, and (H) cross section VT-1. Location of sections shown in figure 3—Continued.
22C
han
nel-P
attern A
dju
stmen
ts and
Geo
mo
rph
ic Ch
aracteristics of E
lkhead
Creek, C
olo
rado
, 1937–97
��������
������
������
86
88
90
92
94
96
98
100
102
104
106
–20 0 20 40 60 80 100 120 140 160 180 200 220 240 260 280
HORIZONTAL DISTANCE FROM LEFT TERRACE, IN FEET
ELE
VA
TIO
N, I
N F
EE
T A
BO
VE
AR
BIT
RA
RY
DA
TU
M
Cross section
Water surface at 18 cubic feet per second
Bankfull stage
Grassy terrace
Heavybrush
Loam
Cobbles
Gravel
Sandbar
Hig
h w
ater
199
8
E
Figure 5. Elkhead Creek cross sections showing geomorphic features, alluvial stratigraphy, and the bankfull stage, (A) cross section PT-2, (B) cross section PT-1, (C) cross section LG-2, (D) cross section LG-1, (E) cross section NR-Q, (F) cross section LW-1, (G) cross section VT-2, and (H) cross section VT-1. Location of sections shown in figure 3—Continued.
CH
AN
NE
L-P
AT
TE
RN
AD
JUS
TM
EN
TS
AN
D G
EO
MO
RP
HIC
CH
AR
AC
TE
RIS
TIC
S23
��������������������
����
��������������
88
90
92
94
96
98
100
102
104
106
108
–20 0 20 40 60 80 100 120 140 160 180 200 220 240 260 280 300 320
HORIZONTAL DISTANCE FROM LEFT TERRACE, IN FEET
ELE
VA
TIO
N, I
N F
EE
T A
BO
VE
AR
BIT
RA
RY
DA
TU
M Cross section
Water surface at 16 cubic feet per second
Bankfull stage
Cottonwoodsand
grass
Cobbles/graveland coarse sand
Sand and gravel
Grass and sage
Cobbles
Fine sand
Gleyed clay
Clay
Loam
Will
ows
Bur
ied
cotto
nwoo
d
F
Figure 5. Elkhead Creek cross sections showing geomorphic features, alluvial stratigraphy, and the bankfull stage, (A) cross section PT-2, (B) cross section PT-1, (C) cross section LG-2, (D) cross section LG-1, (E) cross section NR-Q, (F) cross section LW-1, (G) cross section VT-2, and (H) cross section VT-1. Location of sections shown in figure 3—Continued.
24C
han
nel-P
attern A
dju
stmen
ts and
Geo
mo
rph
ic Ch
aracteristics of E
lkhead
Creek, C
olo
rado
, 1937–97 ����������
����
������������
���������������
���������
����
86
88
90
92
94
96
98
100
102
104
106
–20 0 20 40 60 80 100 120 140 160 180 200 220 240 260 280
HORIZONTAL DISTANCE FROM LEFT TERRACE, IN FEET
ELE
VA
TIO
N, I
N F
EE
T A
BO
VE
AR
BIT
RA
RY
DA
TU
M Cross section
Water surface at 18 cubic feet per second
Bankfull stage
Cottonwoodterrace
Sand
Cobbles
Cobbles
Fine sand
Calcareousclay
Gritty clay
Gritty clay
Loam
Hay meadowsandsage
G
Figure 5. Elkhead Creek cross sections showing geomorphic features, alluvial stratigraphy, and the bankfull stage, (A) cross section PT-2, (B) cross section PT-1, (C) cross section LG-2, (D) cross section LG-1, (E) cross section NR-Q, (F) cross section LW-1, (G) cross section VT-2, and (H) cross section VT-1. Location of sections shown in figure 3—Continued.
CH
AN
NE
L-P
AT
TE
RN
AD
JUS
TM
EN
TS
AN
D G
EO
MO
RP
HIC
CH
AR
AC
TE
RIS
TIC
S25
����
����������
��
86
88
90
92
94
96
98
100
102
104
106
60 80 100 120 140 160 180 200 220 240 260 280 300 320 340 360
HORIZONTAL DISTANCE FROM LEFT TERRACE, IN FEET
ELE
VA
TIO
N, I
N F
EE
T A
BO
VE
AR
BIT
RA
RY
DA
TU
M Cross section
Water surface at 18 cubic feet per second
Bankfull stage
Sage
Willow terrace
Drif
twoo
d
Cot
tonw
oods
Loam
Grittyclay
Cobbles
Sand
Cross-beddedcobbles(cemented)
H
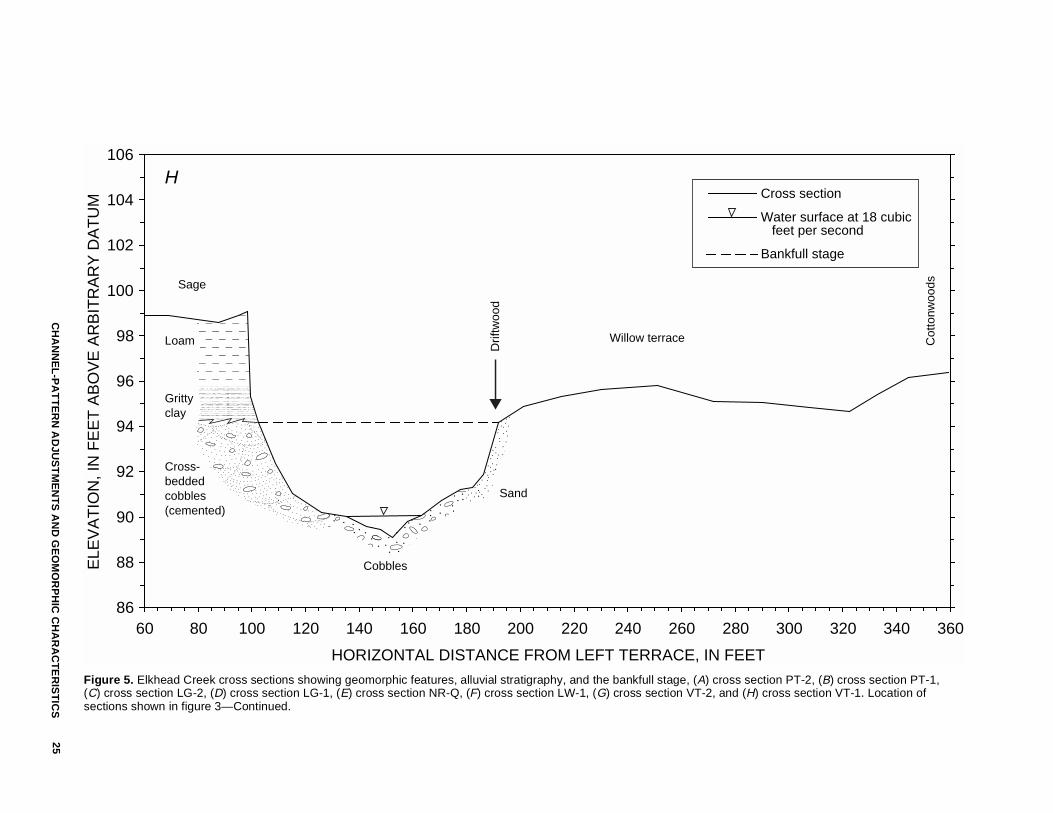
Figure 5. Elkhead Creek cross sections showing geomorphic features, alluvial stratigraphy, and the bankfull stage, (A) cross section PT-2, (B) cross section PT-1, (C) cross section LG-2, (D) cross section LG-1, (E) cross section NR-Q, (F) cross section LW-1, (G) cross section VT-2, and (H) cross section VT-1. Location of sections shown in figure 3—Continued.
26 Channel-Pattern Adjustments and Geomorphic Characteristics of Elkhead Creek, Colorado, 1937–97
valley-fill material exposed at most Elkhead Creek cross sections consisted of a layer of coarse-grained fluvial sediments overlain by a thick deposit of fine-grained overbank sediments. The uppermost fine-grained overbank sediments consisted of distinctive horizons of fine sand or gritty clay, clay loam, and loam. The upper surface of the lower coarse-grained layer, where present, consisted of sandy gravel and or cobbles and was exposed at depths of about 3.3 to 9.8 ft below the scarp formed by the valley floor. These sediments tended to be noncohesive and easily erodible. The coarse-grained alluvial layer was not observed in the stratigraphy at cross sections PT-1 (fig. 5B) and LG-2 (fig. 5C). Crossbedded and imbri-cated gravel and cobbles approximately 4.9 ft below the terrace scarp were well cemented with calcium carbonate at cross section VT-1 (fig. 5H). Bedrock was exposed in the streambed at cross section PT-2 (fig. 5A), approximately 8 ft below the valley-floor scarp. Both conditions may have had an effect on the vertical incision or channel geometry of these sections.
Riparian vegetation is an important variable in streambank stability that affects sediment resistance to erosion and bank-sediment mass cohesiveness and induces deposition of sediment carried in the stream-flow (Thorne, 1990). Scattered stands of trees and shrubs grew along the banks and terraces of Elkhead Creek when onsite cross-section surveys were made in 1997. However, riparian vegetation type and density were difficult to evaluate in the older aerial photo-graphs; consequently, changes in these variables were not examined in this study.
Sediment Size
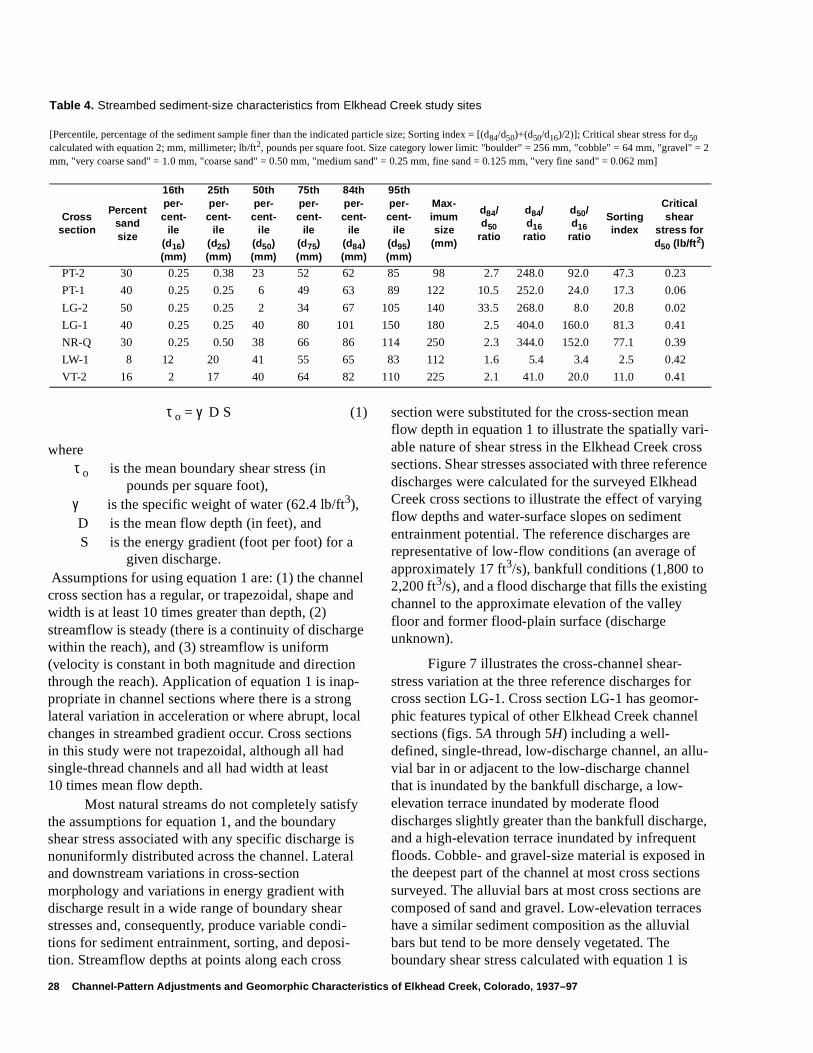
Sediment from the streambed surface was sampled in 1997 at the Elkhead Creek cross sections using the Wolman method for measuring the sediment-particle intermediate diameter (Wolman, 1954). Size distributions were computed for all cross sections except VT-1, where sediment measurements were not made. Much of the left bank at VT-1 consisted of cemented, crossbedded gravel- and cobble-size sedi-ment. In other respects, the sediment at VT-1 was similar to sediment a short distance upstream at VT-2. The Wolman measurements were made at regularly spaced intervals across the channel in a linear traverse at or very near the surveyed cross section. These measurements were made from bank to bank and included all fluvially deposited material on the
channel boundary below the approximate bankfull elevation. The measurements excluded flood-plain sediment exposed in cutbanks and sediment that had slumped into the stream.
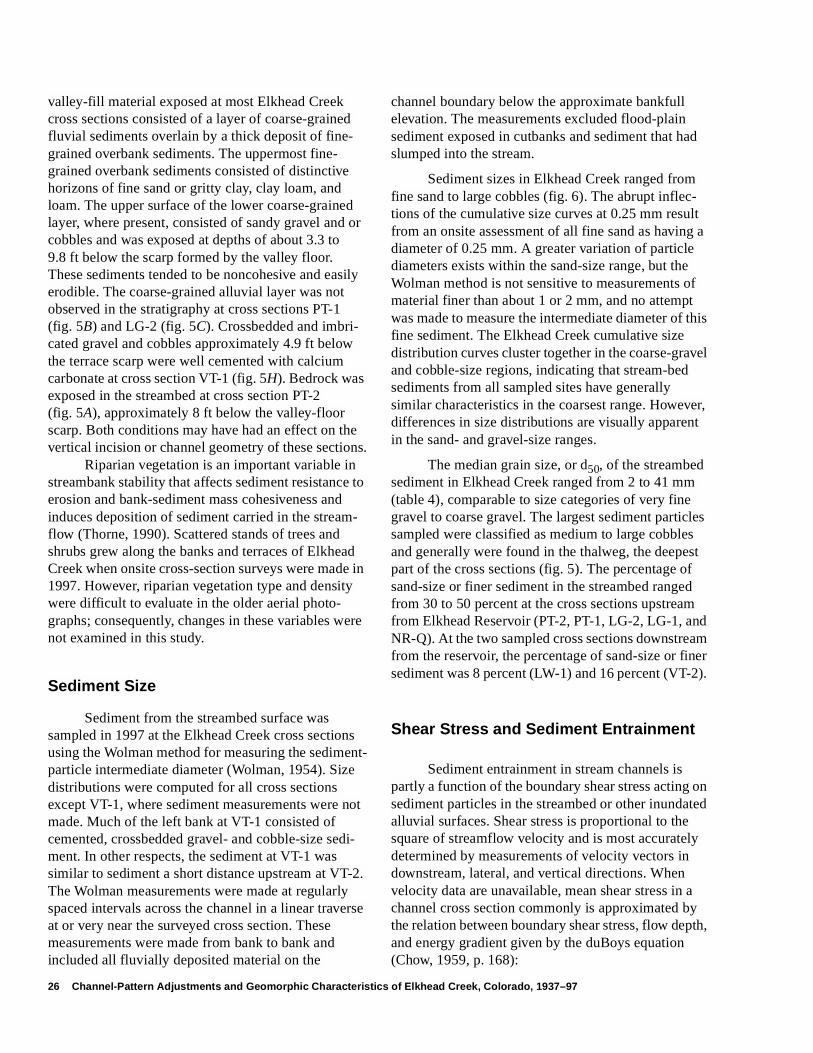
Sediment sizes in Elkhead Creek ranged from fine sand to large cobbles (fig. 6). The abrupt inflec-tions of the cumulative size curves at 0.25 mm result from an onsite assessment of all fine sand as having a diameter of 0.25 mm. A greater variation of particle diameters exists within the sand-size range, but the Wolman method is not sensitive to measurements of material finer than about 1 or 2 mm, and no attempt was made to measure the intermediate diameter of this fine sediment. The Elkhead Creek cumulative size distribution curves cluster together in the coarse-gravel and cobble-size regions, indicating that stream-bed sediments from all sampled sites have generally similar characteristics in the coarsest range. However, differences in size distributions are visually apparent in the sand- and gravel-size ranges.
The median grain size, or d50, of the streambed sediment in Elkhead Creek ranged from 2 to 41 mm (table 4), comparable to size categories of very fine gravel to coarse gravel. The largest sediment particles sampled were classified as medium to large cobbles and generally were found in the thalweg, the deepest part of the cross sections (fig. 5). The percentage of sand-size or finer sediment in the streambed ranged from 30 to 50 percent at the cross sections upstream from Elkhead Reservoir (PT-2, PT-1, LG-2, LG-1, and NR-Q). At the two sampled cross sections downstream from the reservoir, the percentage of sand-size or finer sediment was 8 percent (LW-1) and 16 percent (VT-2).
Shear Stress and Sediment Entrainment
Sediment entrainment in stream channels is partly a function of the boundary shear stress acting on sediment particles in the streambed or other inundated alluvial surfaces. Shear stress is proportional to the square of streamflow velocity and is most accurately determined by measurements of velocity vectors in downstream, lateral, and vertical directions. When velocity data are unavailable, mean shear stress in a channel cross section commonly is approximated by the relation between boundary shear stress, flow depth, and energy gradient given by the duBoys equation (Chow, 1959, p. 168):
CH
AN
NE
L-P
AT
TE
RN
AD
JUS
TM
EN
TS
AN
D G
EO
MO
RP
HIC
CH
AR
AC
TE
RIS
TIC
S27
Figure 6. Cumulative size distribution curves for streambed sediment at Elkhead Creek study sites.
0
10
20
30
40
50
60
70
80
90
100
0.1Sand
1 10 100 1,000
SEDIMENT PARTICLE SIZE, IN MILLIMETERS
CU
MU
LAT
IVE
PE
RC
EN
T F
INE
R T
HA
N P
AR
TIC
LE S
IZE
PT-2
PT-1
LG-2
LG-1
NR-Q
LW-1
VT-2
Cobbles BouldersGravel
28 Channel-Pattern Adjustments and Geomorphic Characteristics of Elkhead Creek, Colorado, 1937–97
τ o = γ D S (1)
whereτ o is the mean boundary shear stress (in
pounds per square foot), γ is the specific weight of water (62.4 lb/ft3), D is the mean flow depth (in feet), and S is the energy gradient (foot per foot) for a
given discharge. Assumptions for using equation 1 are: (1) the channel cross section has a regular, or trapezoidal, shape and width is at least 10 times greater than depth, (2) streamflow is steady (there is a continuity of discharge within the reach), and (3) streamflow is uniform (velocity is constant in both magnitude and direction through the reach). Application of equation 1 is inap-propriate in channel sections where there is a strong lateral variation in acceleration or where abrupt, local changes in streambed gradient occur. Cross sections in this study were not trapezoidal, although all had single-thread channels and all had width at least 10 times mean flow depth.
Most natural streams do not completely satisfy the assumptions for equation 1, and the boundary shear stress associated with any specific discharge is nonuniformly distributed across the channel. Lateral and downstream variations in cross-section morphology and variations in energy gradient with discharge result in a wide range of boundary shear stresses and, consequently, produce variable condi-tions for sediment entrainment, sorting, and deposi-tion. Streamflow depths at points along each cross
section were substituted for the cross-section mean flow depth in equation 1 to illustrate the spatially vari-able nature of shear stress in the Elkhead Creek cross sections. Shear stresses associated with three reference discharges were calculated for the surveyed Elkhead Creek cross sections to illustrate the effect of varying flow depths and water-surface slopes on sediment entrainment potential. The reference discharges are representative of low-flow conditions (an average of approximately 17 ft3/s), bankfull conditions (1,800 to 2,200 ft3/s), and a flood discharge that fills the existing channel to the approximate elevation of the valley floor and former flood-plain surface (discharge unknown).
Figure 7 illustrates the cross-channel shear-stress variation at the three reference discharges for cross section LG-1. Cross section LG-1 has geomor-phic features typical of other Elkhead Creek channel sections (figs. 5A through 5H) including a well-defined, single-thread, low-discharge channel, an allu-vial bar in or adjacent to the low-discharge channel that is inundated by the bankfull discharge, a low-elevation terrace inundated by moderate flood discharges slightly greater than the bankfull discharge, and a high-elevation terrace inundated by infrequent floods. Cobble- and gravel-size material is exposed in the deepest part of the channel at most cross sections surveyed. The alluvial bars at most cross sections are composed of sand and gravel. Low-elevation terraces have a similar sediment composition as the alluvial bars but tend to be more densely vegetated. The boundary shear stress calculated with equation 1 is
Table 4. Streambed sediment-size characteristics from Elkhead Creek study sites
[Percentile, percentage of the sediment sample finer than the indicated particle size; Sorting index = [(d84/d50)+(d50/d16)/2)]; Critical shear stress for d50 calculated with equation 2; mm, millimeter; lb/ft2, pounds per square foot. Size category lower limit: "boulder" = 256 mm, "cobble" = 64 mm, "gravel" = 2 mm, "very coarse sand" = 1.0 mm, "coarse sand" = 0.50 mm, "medium sand" = 0.25 mm, fine sand = 0.125 mm, "very fine sand" = 0.062 mm]
Cross section
Percent sand size
16th per-cent-
ile (d16) (mm)
25th per-cent-
ile (d25) (mm)
50th per-cent-
ile (d50) (mm)
75th per-cent-
ile (d75) (mm)
84th per-cent-
ile (d84) (mm)
95th per-cent-
ile (d95) (mm)
Max-imum size
(mm)
d84/d50
ratio
d84/d16
ratio
d50/d16
ratio
Sorting index
Critical shear
stress for d50 (lb/ft2)
PT-2 30 0.25 0.38 23 52 62 85 98 2.7 248.0 92.0 47.3 0.23
PT-1 40 0.25 0.25 6 49 63 89 122 10.5 252.0 24.0 17.3 0.06
LG-2 50 0.25 0.25 2 34 67 105 140 33.5 268.0 8.0 20.8 0.02
LG-1 40 0.25 0.25 40 80 101 150 180 2.5 404.0 160.0 81.3 0.41
NR-Q 30 0.25 0.50 38 66 86 114 250 2.3 344.0 152.0 77.1 0.39
LW-1 8 12 20 41 55 65 83 112 1.6 5.4 3.4 2.5 0.42
VT-2 16 2 17 40 64 82 110 225 2.1 41.0 20.0 11.0 0.41
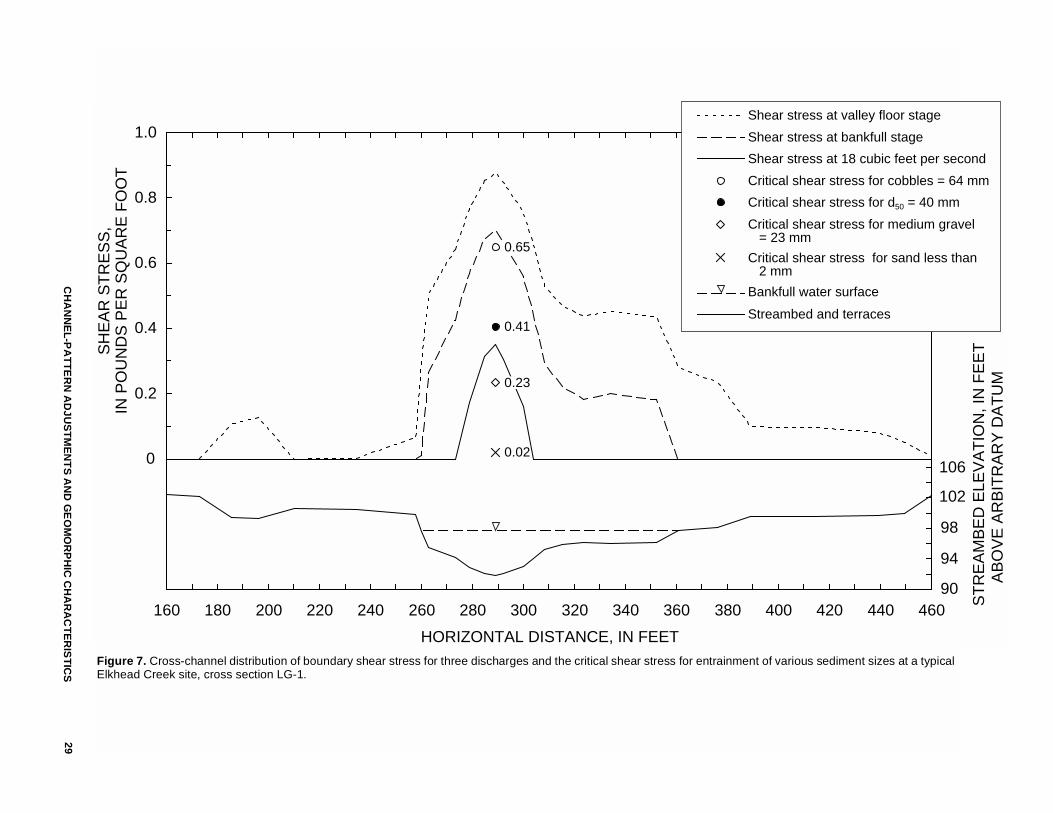
CH
AN
NE
L-P
AT
TE
RN
AD
JUS
TM
EN
TS
AN
D G
EO
MO
RP
HIC
CH
AR
AC
TE
RIS
TIC
S29
Figure 7. Cross-channel distribution of boundary shear stress for three discharges and the critical shear stress for entrainment of various sediment sizes at a typical Elkhead Creek site, cross section LG-1.
0.41
0.020
0.2
0.4
0.6
0.8
1.0
160 180 200 220 240 260 280 300 320 340 360 380 400 420 440 460
HORIZONTAL DISTANCE, IN FEET
SH
EA
R S
TR
ES
S,
IN P
OU
ND
S P
ER
SQ
UA
RE
FO
OT
94
90
98
102
106
ST
RE
AM
BE
D E
LEV
AT
ION
, IN
FE
ET
AB
OV
E A
RB
ITR
AR
Y D
AT
UM0.23
0.65
Shear stress at valley floor stage
Shear stress at bankfull stage
Shear stress at 18 cubic feet per second
Critical shear stress for cobbles = 64 mm
Critical shear stress for d50 = 40 mm
Critical shear stress for medium gravel = 23 mm
Critical shear stress for sand less than 2 mm
Bankfull water surface
Streambed and terraces
30 Channel-Pattern Adjustments and Geomorphic Characteristics of Elkhead Creek, Colorado, 1937–97
proportional to flow depth. Consequently, the shear stress generated over the higher surfaces is less than that generated over more deeply inundated surfaces, for a given discharge (fig. 7). Shear stress generally increased with discharge because flow depths also increased. However, water-surface slope decreased with increasing discharge at some cross sections. At those cross sections, the rate of shear-stress increase was less than at other cross sections where water-surface slope remained relatively constant or increased with discharge.
The critical shear stress (τ c), the shear stress at which general movement of sediment begins, has been related to sediment size characteristics (Shields, 1936; Lane, 1955; Komar, 1987; Wilcock, 1992). Critical shear stress for entrainment of the sediment median particle size can be estimated using the Shields (1936) equation:
τ c = τ *c (γ s – γ ) d50 (2)
whereτ c is the critical shear stress (in newtons per
square meter); τ *c is the dimensionless critical shear stress or
the Shields parameter; γ s is the specific weight of sediment (assumed
to be 25,990 N/m3); γ is the specific weight of water
(9,807 N/m3); andd50 is the median sediment size (in meters).
Critical shear stress in equation 2 (newtons per square meter) is converted to English units (pounds per square foot) by multiplying by 0.02088.
Neill (1968) recommended a Shields parameter, τ *c, of 0.030 for streambeds composed of coarse materials; however, other investigators have demon-strated a variable τ *c in channels with mixed-size sediments (Komar, 1987) and in channels where the bed-surface particle size is significantly larger than the subsurface particle size (Parker and others, 1982; Andrews, 1983). The Shields parameter could not be precisely determined in this study as in some flume and instrumented field studies; therefore, based on published research and the particle-size ranges measured at the Elkhead Creek study sites, critical shear stresses for each sediment measurement were calculated with Shields τ *c values of 0.030.
Once τ c was identified for a specific deposit, the critical discharge (the minimum streamflow required
to entrain sediment d50) was estimated by equating τ o with τ c and using the relation between shear stress and the reference discharges at a specific cross-section location. Wilcock (1992, p. 297) states that equation 2 and d50 can be used to provide a minimum estimate of the shear stress necessary to initiate general movement of a mixed-size sediment based on experiments using sediments with d50 up to about 20 mm. Lane’s (1955) data indicate that the Shields equation is applicable for sediments with a 75th percentile (d75) up to about 100 mm. Elliott and Parker (1997) and Elliott and Hammack (2000) used the Shields (1936) equation to estimate the critical shear stress for entrainment of sediment d50 in the Gunnison River of Colorado. The critical shear stress associated with sediment entrain-ment (equation 2) is, at best, a minimum estimate of the critical discharge because only a small area of the entire surface or a few particles of the d50 size may be entrained by the critical discharge (Lisle and others, 1993; Milhous, 1982). Wilcock and McArdell (1993) observed that complete mobilization of a size fraction, such as d50, occurred at about twice the shear stress necessary for incipient motion of individual particles in that size fraction.
It is possible to evaluate the sediment entrain-ment potential of each reference discharge with respect to a particular geomorphic surface or location on a cross section when the boundary shear stress, τ o, is compared with the critical shear stress, τ c, for the sediment at various locations on the cross sections (fig. 7 and table 4). At cross section LG-1 and at most Elkhead Creek cross sections, sand-size (up to 2-mm diameter) and medium gravel-size (up to 23-mm diam-eter) sediment theoretically is entrainable from the deepest part of the channel by discharges as low as 16–18 ft3/s. This is supported by observation of the streambed at low flow, which reveals a dominant streambed particle size (coarse gravel and cobbles) that is greater than the theoretically entrainable particle sizes (sand- and medium-size gravel). At the bankfull reference discharge, the alluvial bar adjacent to the low-discharge channel at LG-1 is inundated. The shear stress generated over this inundated surface theoretically is sufficient to entrain sand and fine gravel, and the shear stress generated over the deepest part of the streambed should be able to entrain all gravel sizes and some sediment as coarse as cobble size (64-mm diameter) or larger. Because this entrain-able size range includes the d50 at cross section LG-1
31CHANNEL-PATTERN ADJUSTMENTS AND GEOMORPHIC CHARACTERISTICS
(40 mm), it can be stated that the streambed at LG-1 is mobile at the bankfull discharge.
Sedimentation in Elkhead Reservoir
Elkhead Dam impounded a 3.8-mile-long reser-voir in 1974, inundating the former Elkhead Creek flood plain and trapping all of the bedload and a large amount of suspended sediment previously transported through this reach of the Elkhead Creek valley. Since impoundment, much of the bedload transported into the reservoir has been deposited in a delta at the north-eastern (upstream) end of the reservoir. The mass of sediment deposited in the delta provides some indica-tion of the natural bedload transport rate in this reach of Elkhead Creek and can be considered an approxi-mate surrogate for long-term bedload measurements.
Delta area was digitized for two time periods bracketed by the aerial photographs from 1977, 1981, and 1993. These photographs were taken in September of each year and, as such, reflect the condition of the delta at the end of the runoff season. The distal margins of the deltaic deposits in 1977, 1981, and 1993 are shown in figure 8. After 3 years of impound-ment, the deltaic deposits were barely visible and the vestigial channel of the inundated Elkhead Creek still was identifiable in 1977 (fig. 8). Sedimentation during this period probably was relatively low because two of the three annual flood peaks were relatively insignifi-cant. The 1975 flood peak was 1,460 ft3/s (recurrence interval of 5.5 years), but the 1976 and 1977 flood peaks were considerably smaller than the approximate bankfull discharge.
By 1981, the distal margin of the Elkhead Creek delta had prograded approximately 1,180 ft down-valley from the 1977 limit of flood-plain inundation, and the total surface area of the delta was 17.1 acres (fig. 8). Delta area, in these calculations, includes the distributary channel area as well as the subaerially exposed sediment, but not subaqueous sediment deposited in the reservoir beyond the distal margin, which could not be seen in some of the aerial photo-graphs. During 7 years of sediment deposition from 1975 (the first runoff season following completion of Elkhead Reservoir) through 1981, the delta advanced at a rate of approximately 168 ft per year and added approximately 2.4 acres per year of exposed sediment in the upper end of Elkhead Reservoir (table 5). The amount of subaqueous deposition in the reservoir is not known nor is the amount of suspended sediment
that passed through the reservoir. By 1993, the delta had prograded approximately another 1,560 ft beyond the 1981 margin, and the delta area increased by 27.1 acres, a rate of approximately 2.3 acres per year, in the 12-year period from 1982 through 1993.
The Elkhead Creek delta volume was estimated using a contour map created by Ayres Associates (1995) from a topographic survey made when Elkhead Reservoir was drawn down to a low level. The delta surface has relatively low relief and was assumed to be horizontal with an average surface elevation of 6,365 ft, approximately equal to the normal reservoir pool elevation. Surveyed points on the former flood plain immediately downstream from the delta distal margin and approximately 3,700 ft downstream from the proximal (upstream) margin had an average eleva-tion of 6,355 ft. It was assumed that the former valley floor sloped uniformly downstream beneath the new delta; therefore, the delta thickness increased uniformly from zero to 10 ft over a 3,700-ft length. Delta thickness at the distal margins in 1981 and 1993 was calculated as proportional to the distance between the proximal margin and a point 3,700 ft downstream where the depth to the former flood plain was approxi-mately 10 ft. Because of the assumed wedge-shaped longitudinal cross section (horizontal upper surface and sloping lower surface), the average delta thickness was one-half the thickness at the distal margin. Based on valley-side topography and subaqueous delta-front conditions observed in 1997, the lateral and distal boundaries of the deltaic deposit are known to slope steeply but, for the purpose of these volumetric calcu-lations, were assumed to be vertical. By 1981, the delta had an estimated volume of approximately 27.3 acre-ft, which had accumulated at a rate of approximately 3.9 acre-ft per year. By 1993, the delta had a volume of approximately 163.4 acre-ft and, since 1981, accumulated at a rate of approximately 11.3 acre-ft per year (table 5).
The delta mass was estimated from the previ-ously calculated delta volume and an assumed sedi-ment density for the deltaic deposits. The density of sediment deposits in a reservoir is dependent on several variables such as the sediment-size distribution (the percentage of sand-, silt-, and clay-size particles), sediment compaction, and the relative amount of time the sediment is submerged or exposed to the air (Lara and Pemberton, 1965). Prolonged submersion has little effect on the density or unit weight of sand-size sediment, whereas prolonged submersion tends to significantly decrease the unit weight of clay-size sedi-
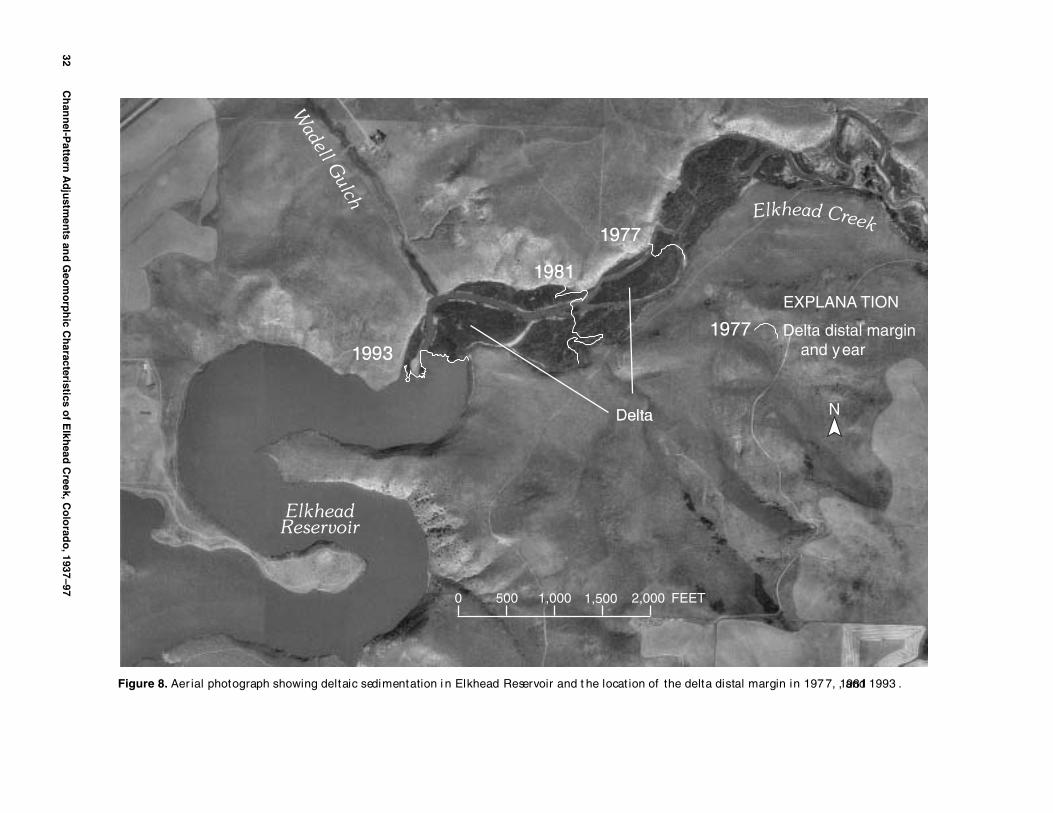
32C
han
nel-P
attern A
dju
stmen
ts and
Geo
mo
rph
ic Ch
aracteristics of E
lkhead
Creek, C
olo
rado
, 1937–97
Elkhead Creek
Wadell G
ulch
ElkheadReservoir
0 500 1,000 1,500 2,000 FEET
EXPLANA TION
N
Delta distal margin and year
Figure 8. Aer ial photograph showing deltaic sedimentation i n Elkhead Reservoir and t he locat ion of the delta distal margin in 1977, 1981, and 1993 .
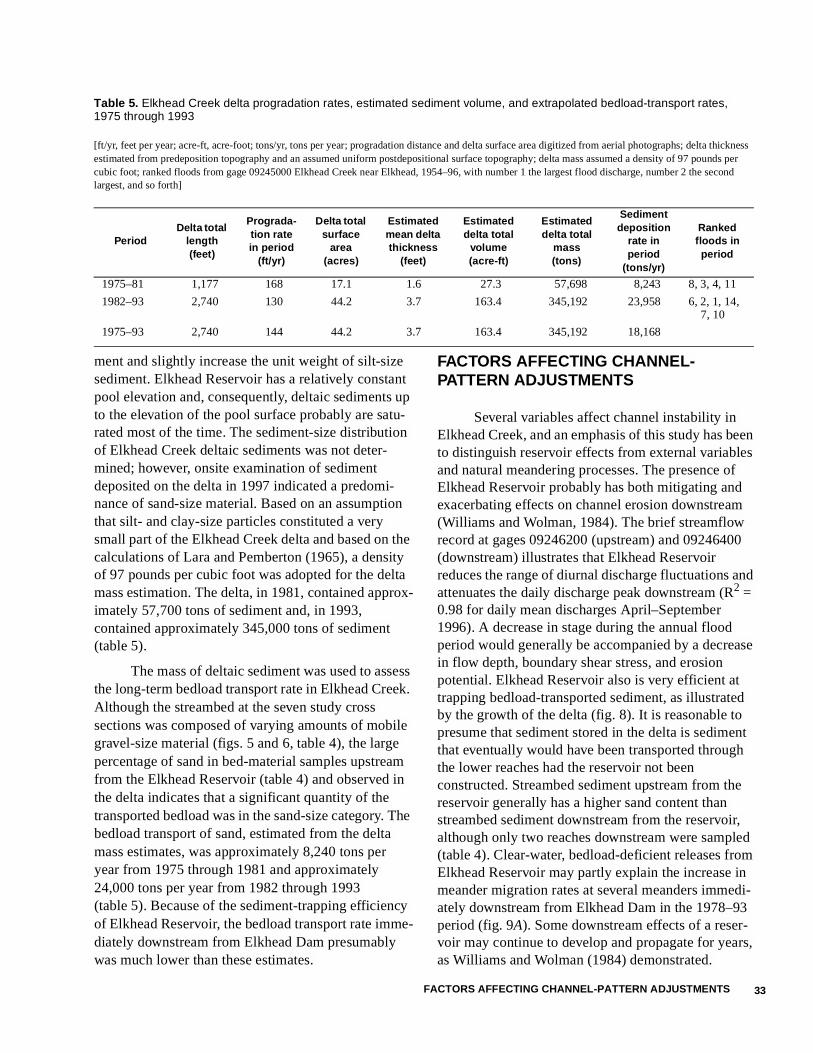
33FACTORS AFFECTING CHANNEL-PATTERN ADJUSTMENTS
ment and slightly increase the unit weight of silt-size sediment. Elkhead Reservoir has a relatively constant pool elevation and, consequently, deltaic sediments up to the elevation of the pool surface probably are satu-rated most of the time. The sediment-size distribution of Elkhead Creek deltaic sediments was not deter-mined; however, onsite examination of sediment deposited on the delta in 1997 indicated a predomi-nance of sand-size material. Based on an assumption that silt- and clay-size particles constituted a very small part of the Elkhead Creek delta and based on the calculations of Lara and Pemberton (1965), a density of 97 pounds per cubic foot was adopted for the delta mass estimation. The delta, in 1981, contained approx-imately 57,700 tons of sediment and, in 1993, contained approximately 345,000 tons of sediment (table 5).
The mass of deltaic sediment was used to assess the long-term bedload transport rate in Elkhead Creek. Although the streambed at the seven study cross sections was composed of varying amounts of mobile gravel-size material (figs. 5 and 6, table 4), the large percentage of sand in bed-material samples upstream from the Elkhead Reservoir (table 4) and observed in the delta indicates that a significant quantity of the transported bedload was in the sand-size category. The bedload transport of sand, estimated from the delta mass estimates, was approximately 8,240 tons per year from 1975 through 1981 and approximately 24,000 tons per year from 1982 through 1993 (table 5). Because of the sediment-trapping efficiency of Elkhead Reservoir, the bedload transport rate imme-diately downstream from Elkhead Dam presumably was much lower than these estimates.
FACTORS AFFECTING CHANNEL-PATTERN ADJUSTMENTS
Several variables affect channel instability in Elkhead Creek, and an emphasis of this study has been to distinguish reservoir effects from external variables and natural meandering processes. The presence of Elkhead Reservoir probably has both mitigating and exacerbating effects on channel erosion downstream (Williams and Wolman, 1984). The brief streamflow record at gages 09246200 (upstream) and 09246400 (downstream) illustrates that Elkhead Reservoir reduces the range of diurnal discharge fluctuations and attenuates the daily discharge peak downstream (R2 = 0.98 for daily mean discharges April–September 1996). A decrease in stage during the annual flood period would generally be accompanied by a decrease in flow depth, boundary shear stress, and erosion potential. Elkhead Reservoir also is very efficient at trapping bedload-transported sediment, as illustrated by the growth of the delta (fig. 8). It is reasonable to presume that sediment stored in the delta is sediment that eventually would have been transported through the lower reaches had the reservoir not been constructed. Streambed sediment upstream from the reservoir generally has a higher sand content than streambed sediment downstream from the reservoir, although only two reaches downstream were sampled (table 4). Clear-water, bedload-deficient releases from Elkhead Reservoir may partly explain the increase in meander migration rates at several meanders immedi-ately downstream from Elkhead Dam in the 1978–93 period (fig. 9A). Some downstream effects of a reser-voir may continue to develop and propagate for years, as Williams and Wolman (1984) demonstrated.
Table 5. Elkhead Creek delta progradation rates, estimated sediment volume, and extrapolated bedload-transport rates, 1975 through 1993
[ft/yr, feet per year; acre-ft, acre-foot; tons/yr, tons per year; progradation distance and delta surface area digitized from aerial photographs; delta thickness estimated from predeposition topography and an assumed uniform postdepositional surface topography; delta mass assumed a density of 97 pounds per cubic foot; ranked floods from gage 09245000 Elkhead Creek near Elkhead, 1954–96, with number 1 the largest flood discharge, number 2 the second largest, and so forth]
PeriodDelta total
length (feet)
Prograda-tion rate in period
(ft/yr)
Delta total surface
area (acres)
Estimated mean delta thickness
(feet)
Estimated delta total
volume (acre-ft)
Estimated delta total
mass(tons)
Sediment deposition
rate in period
(tons/yr)
Ranked floods in period
1975–81 1,177 168 17.1 1.6 27.3 57,698 8,243 8, 3, 4, 11
1982–93 2,740 130 44.2 3.7 163.4 345,192 23,958 6, 2, 1, 14, 7, 10
1975–93 2,740 144 44.2 3.7 163.4 345,192 18,168
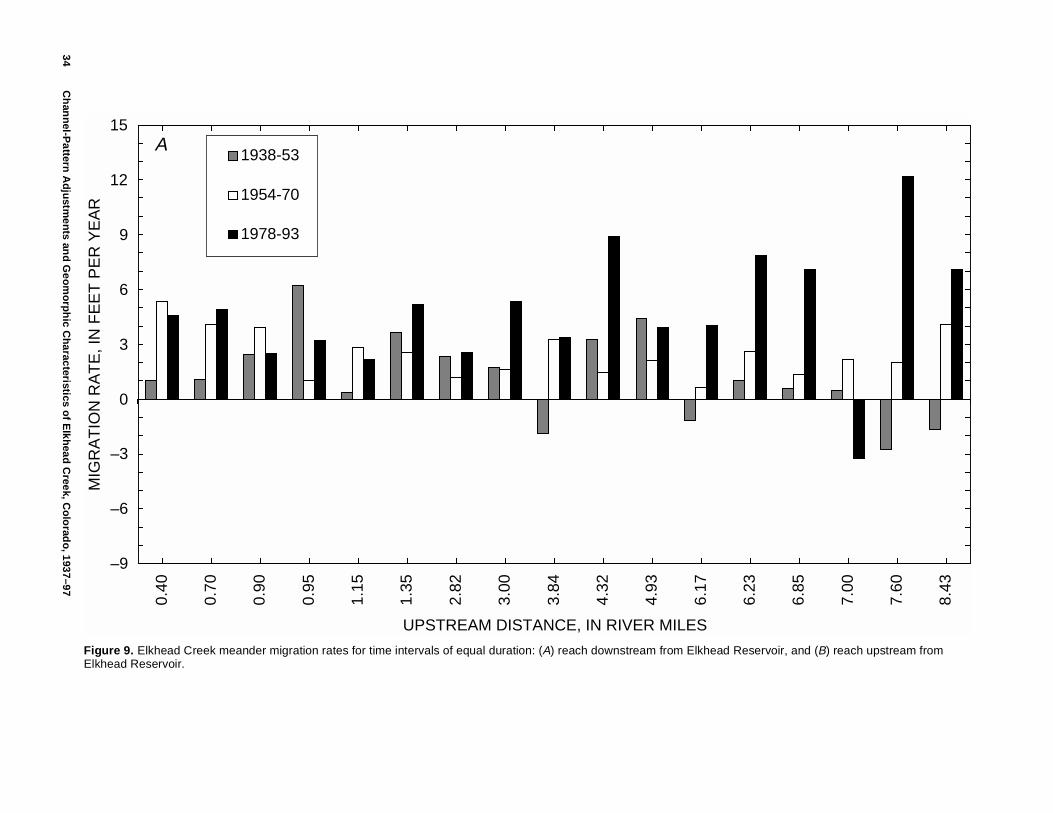
34C
han
nel-P
attern A
dju
stmen
ts and
Geo
mo
rph
ic Ch
aracteristics of E
lkhead
Creek, C
olo
rado
, 1937–97
–9
–6
–3
0
3
6
9
12
15
0.40
0.70
0.90
0.95
1.15
1.35
2.82
3.00
3.84
4.32
4.93
6.17
6.23
6.85
7.00
7.60
8.43
UPSTREAM DISTANCE, IN RIVER MILES
MIG
RA
TIO
N R
AT
E, I
N F
EE
T P
ER
YE
AR
1938-53
1954-70
1978-93
A
Figure 9. Elkhead Creek meander migration rates for time intervals of equal duration: (A) reach downstream from Elkhead Reservoir, and (B) reach upstream from Elkhead Reservoir.
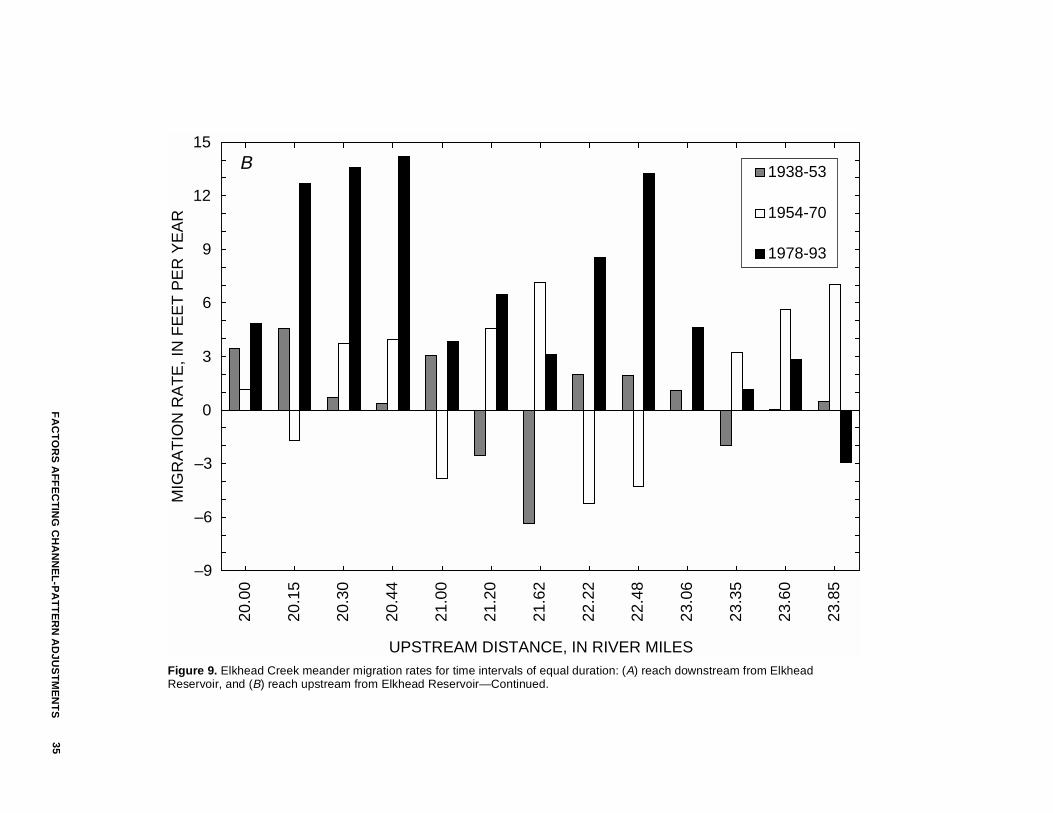
FA
CT
OR
S A
FF
EC
TIN
G C
HA
NN
EL
-PA
TT
ER
N A
DJU
ST
ME
NT
S35
–9
–6
–3
0
3
6
9
12
15
20.0
0
20.1
5
20.3
0
20.4
4
21.0
0
21.2
0
21.6
2
22.2
2
22.4
8
23.0
6
23.3
5
23.6
0
23.8
5
UPSTREAM DISTANCE, IN RIVER MILES
MIG
RA
TIO
N R
AT
E, I
N F
EE
T P
ER
YE
AR
1938-53
1954-70
1978-93
B
Figure 9. Elkhead Creek meander migration rates for time intervals of equal duration: (A) reach downstream from Elkhead Reservoir, and (B) reach upstream from Elkhead Reservoir—Continued.
36 Channel-Pattern Adjustments and Geomorphic Characteristics of Elkhead Creek, Colorado, 1937–97
The preexisting characteristics of the flood-plain and channel sediments and the natural variability of climate and streamflow also affect channel behavior. The influence of these variables can be seen both upstream and downstream from Elkhead Reservoir. A large proportion of the streambed sediment in Elkhead Creek is sand and fine gravel that can be transported by relatively low discharges. The cross-channel shear-stress distributions and critical shear-stress values for various sediments in the channel at cross section LG-1 (fig. 7) and the other surveyed cross sections indicate that sand is entrainable at almost any discharge. Medium gravel (up to 23 mm) can be entrainable from the deeper parts of the channel at low discharges and from nearly all channel boundary locations when discharge is approximately bankfull (approximately 1,800–2,200 ft3/s). Larger or more frequent floods would be more effective at transporting sediment in Elkhead Creek.
The valley-fill stratigraphy exposed at several cross sections provides evidence of the past behavior of Elkhead Creek and the possible mechanisms of future channel adjustments. The buried and subse-quently exhumed Populus deltoides tree trunks near cross section LW-1 (fig. 5F) became established on a sandy surface that may have been an earlier stream-bank or flood-plain surface. The root crown of the tree at cross section LW-1 is buried by clay and loam, typical of overbank sediments, and is approximately 2 to 4 ft below the surface of the adjacent valley floor, indicating a period of vertical aggradation after the tree became established. The age of the tree is unknown but may be on the order of about a century (Wes Signs, Colorado River Water Conservation District, oral commun., 1998). The elevation differ-ence between the contemporary valley-floor terrace surface and the contemporary bankfull surface (2.5 to 6.2 ft) is an indication of vertical incision during the time since the valley floor functioned as the flood plain. Anecdotal evidence indicates that this incision has occurred in recent decades (Donald Van Tassel and Leroy Lawton, local residents, oral commun., 1997).
The physical properties of the valley-fill mate-rial exposed in cutbanks along the study reaches affect the processes of channel adjustment in Elkhead Creek. The sandy gravel and cobble layer of the valley-fill sediment exposed near stream level in many reaches of Elkhead Creek (fig. 5) is easily erodible when inun-dated and, when removed, leaves the overlying loamy sediment unsupported and prone to collapse. Bank
failure adds sediment having a variety of sizes to the bedload, much of it transportable, but the larger parti-cles may form a lag-type pavement or armor that resists further degradation except by very large floods (Milhous, 1982). The presence of a pavement or armor, or the presence of nonentrainable surfaces such as the bedrock exposed in the streambed at cross section PT-2 (fig. 5A) and the cemented cobbles at cross section VT-1 (fig. 5H), could make lateral erosion a more common channel adjustment than stre-ambed scour.
Meander migration rates were calculated for three periods of generally comparable length 1938–53, 1954–70, and 1978–93, inclusive (fig. 9). The 1978–93 period represents the post-reservoir period; stream-flow in the earlier two periods was not affected by Elkhead Reservoir. Only the second and third periods span the time for which continuous streamflow record is available and, because bank erosion and meander migration are partly dependent on streamflow, only the latter two periods are discussed here.
Meander migration rates in the reach down-stream from Elkhead Reservoir (fig. 9A and table 3) had a mean of 2.5 ft/yr and a standard deviation of 1.3 in the 1954–70 period, compared to a mean of 4.8 ft/yr and a standard deviation of 3.3 in the 1978–93 period, following reservoir construction (F-test p=0.0004; t-test p=0.0150; table 3). Based on these statistics alone, one might conclude that Elkhead Reservoir had a substantial effect on hydrology and sediment trans-port leading to the doubled mean meander-migration rate. However, a similar trend in meander migration rates was observed in the study reach upstream from Elkhead Reservoir (fig. 9B and table 3). The mean migration rate in the upstream study reach was 1.6 ft/yr and the standard deviation was 4.3 in the 1954–70 period, whereas the mean was 6.6 ft/yr and standard deviation was 5.4 in the 1978–93 period (F-test p=0.4352; t-test p=0.0156). The fourfold increase in the mean meander-migration rate in the reach unaffected by Elkhead Reservoir requires consideration of other variables that influenced the entire Elkhead Creek watershed.
Channel instability throughout the Elkhead Creek valley may have been influenced by changes in land use, climate, or runoff. Mean annual streamflow at the 09245000 gage increased from 36,062 acre-ft/yr to 44,088 acre-ft/yr between the 1954–70 and 1978–93 periods, and the mean annual flood increased from 923 ft3/s to 1,202 ft3/s between the same periods. Sedi-
37SUMMARY AND CONCLUSIONS
ment-transport rates estimated from the delta volume and mass calculations have potential inaccuracies because the actual thickness of the delta is not known nor is the sediment-size composition and the density of deltaic deposits. However, assuming that these esti-mates are reasonable, one explanation for the 190-percent increase in sediment transport rate from the 1975–81 period to the 1982–93 period is based on the magnitude of seasonal floods in the two periods. Floods greater than the approximate bankfull dis-charge, about 950 ft3/s, occurred, on average, about every other year in both periods; however, the 1982–93 period included the flood of record (1984) and five consecutive years (1982–86) when flood peaks exceeded the bankfull discharge (fig. 2). It is possible that the large floods of the early and middle 1980’s initiated a period of increased bank erosion and sedi-ment remobilization from the flood plain and adjacent terraces, both upstream and downstream from Elkhead Reservoir.
The larger volume of runoff and the larger flood peaks after the late 1970’s may have resulted in more erosive conditions in Elkhead Creek, all else assumed constant. A cause-and-effect relationship between these hydrologic changes and an increase in upstream-reach meander migration rates seems probable. A case for a similar, though more subtle, causal relationship with downstream meander migration rates also can be made because of the operational characteristics of Elkhead Reservoir. Maintenance of a relatively stable, full pool and spillway passage of excess inflow attenu-ates but does not eliminate flood events downstream, as indicated by streamflow analysis of discharge data from the concurrently operated streamflow-gaging stations upstream (09246200) and downstream (09246400) from the reservoir. Periods of large floods and increased meander migration in the upstream reach probably were concurrent with periods of large floods and increased meander migration in the reach downstream from Elkhead Reservoir.
SUMMARY AND CONCLUSIONS
The effect of Elkhead Reservoir on downstream channel instability has become an issue in the Elkhead Creek watershed. A study was conducted to identify the likely causes of streambank erosion in lower Elkhead Creek and to distinguish the relative effects of natural or independent variables from the effects of
regulated streamflow and sediment entrapment. These issues were addressed by evaluating the channel patterns preserved in aerial photographs in the pre- and post-reservoir periods and by comparing the reaches upstream from and downstream from the reservoir. In addition, 44 years of streamflow record, channel cross-section characteristics, and sediment entrainment potential were examined.
A meandering channel pattern is part of a continuum of planimetric channel configurations that reflect discharge, valley gradient, sediment load, bank strength, and other factors. The process of meandering involves a constant adjustment of the channel cross section and pattern around average conditions. These adjustments can involve bank erosion, point bar devel-opment, pattern adjustment (meander-bend amplitude increase, avulsion), streambed scour, and aggradation. All of these adjustments can be considered normal in a “stable channel” that maintains an average channel geometry (width, depth, gradient) and pattern (sinu-osity) over time. Meander migration rates, sediment transport rates, and delta progradation rates probably are highly variable from year to year but, averaged over time, show some correlation with discharge, with and without the effects of Elkhead Reservoir.
The principal conclusions of the study are:1. Bankfull discharge is approximately 1,800 ft3/s in
the study reach upstream from Elkhead Reservoir and approximately 1,800–2,200 ft3/s in the study reach downstream from Elkhead Reservoir. The bankfull width of eight surveyed cross sections ranged from 67 to 122 ft and averaged 88 ft. The bankfull width-to-depth ratio ranged from 12 to 24 and averaged 16.5. Bankfull water-surface slope ranged from 0.0012 to 0.0039 and averaged 0.0023.
2. Buried tree trunks at cross section LW-1 indicate that vertical flood-plain aggradation has occurred in some reaches of Elkhead Creek, possibly within the last century. The contemporary bank-full elevation at the eight cross sections is several feet below the broad, valley-floor terrace that may have been a former flood plain. The eleva-tion difference between the valley-floor terrace and the contemporary bankfull elevation is an indication of more recent incision, possibly within the last few decades. The elevation differ-ence between the valley-floor terrace and the contemporary bankfull stage ranges from 2.5 to 3.8 ft at cross sections in the reach upstream from
38 Channel-Pattern Adjustments and Geomorphic Characteristics of Elkhead Creek, Colorado, 1937–97
Elkhead Reservoir and 2.9 to 6.2 ft at cross sections in the reach downstream from Elkhead Reservoir.
3. The streambed of Elkhead Creek upstream and downstream from Elkhead Reservoir is composed largely of sediment particle sizes entrainable by commonly occurring discharges (up to the bankfull stage). The median grain size ranged from 2 to 41 mm (very fine gravel to coarse gravel), and the largest particle sizes ranged from 98 to 250 mm (medium to large cobbles). The percentage of sand-size or finer sediment in the streambed ranged from 30 to 50 percent at the cross sections upstream from Elkhead Reservoir, whereas at the two sampled cross sections downstream from the reservoir, the percentage of sand-size or finer sediment was 8 percent and 16 percent.
4. Elkhead Reservoir decreases the range of diurnal discharge fluctuations and attenuates but does not eliminate flood peaks downstream. The reservoir is very efficient at trapping bedload-transported sediment. A delta containing approximately 163 acre-ft of sediment in 1993 has developed since Elkhead Reservoir was constructed in 1974. Some lateral erosion of Elkhead Creek immedi-ately downstream from Elkhead Reservoir may be related to bedload-deficient releases from the reservoir.
5. Mean meander migration rates increased in the 1978–93 period relative to earlier periods of comparable length in reaches both upstream and downstream from Elkhead Reservoir. Meander migration rates in the reach downstream from Elkhead Reservoir had a mean of 2.5 ft/yr in the 1954–70 period compared to a mean of 4.8 ft/yr in the 1978–93 period, following reservoir construction. A similar trend in meander migra-tion rates was observed in the study reach upstream from Elkhead Reservoir. The mean migration rate in the upstream study reach was 1.6 ft/yr in the 1954–70 period, whereas the mean was 6.6 ft/yr in the 1978–93 period. The fourfold increase in the mean meander migration rate in the reach unaffected by Elkhead Reservoir requires consideration of other variables that influenced the entire Elkhead Creek watershed.
6. Mean annual streamflow and annual flood magni-tudes affecting both reaches also increased in the 1978–93 period. Mean annual streamflow at the
09245000 gage increased from 36,062 acre-ft/yr to 44,088 acre-ft/yr between the 1954–70 and 1978–93 periods, and the mean annual flood increased from 923 ft3/s to 1,202 ft3/s over the same periods.
7. Channel instability, represented by meander migra-tion rates, has increased since 1977 due to a combination of external factors affecting the entire watershed, such as annual runoff and flood magnitude, as well as local factors, such as reser-voir sedimentation. Land-use practices that potentially affect channel instability, such as intentional meander cutoff and vegetation removal, were not addressed in this study.
REFERENCES CITED
Andrews, E.D., 1983, Entrainment of gravel from naturally sorted riverbed material: Geological Society of America Bulletin, v. 94, p. 1225–1231.
Ayres Associates, 1995, Elkhead Reservoir Contour Map 34–0246.00: Fort Collins, Colorado.
Chow, V.T., 1959, Open-channel hydraulics: New York, McGraw-Hill, Inc., 680 p.
Crowfoot, R.M., Paillet, A.V., Ritz, G.F., Smith, M.E., Jenkins, R.A., and O’Neill, G.B., 1997, Water resources data, Colorado, water year 1996, vol. 2, Colorado River Basin: U.S. Geological Survey Water-Data Report CO–96–2, 551 p.
Elliott, J.G., and Hammack, L.A., 2000, Entrainment of riparian gravel and cobbles in an alluvial reach of a regulated canyon river: Regulated Rivers—Research and Management, v. 16, no. 1, p. 37–50.
Elliott, J.G., and Parker, R.S., 1997, Altered streamflow and sediment entrainment in the Gunnison Gorge: Journal of the American Water Resources Association, v. 33, no. 5, October 1997, p. 1041–1054.
Environmental Systems Research Institute, Inc., 1996, ArcView spatial analyst user’s manual: 147 p.
Gurnell, A.M., 1997, Channel change on the River Dee meanders, 1946–1992, from the analysis of air photo-graphs: Regulated Rivers—Research and Manage-ment, v. 13, p. 13–26.
Hickin, E.J., 1974, The development of meanders in natural river channels: American Journal of Science, v. 274, April 1974, p. 414–442.
Hickin, E.J., and Nanson, G.C., 1984, Lateral migration rates of river bends: American Society of Civil Engi-neers, Journal of the Hydraulics Division, v. 110, no. 11, p. 1557–1567.
39REFERENCES CITED
Jensen, J.R., 1996, Introductory digital image processing—A remote sensing perspective—Upper Saddle River, New Jersey: Englewood Cliffs, N.J., Prentice Hall, 316 p.
Komar, P.D., 1987, Selective gravel entrainment and the empirical evaluation of flow competence: Sedimen-tology, v. 34, p. 1165–1176.
Lane, E.W., 1955, Design of stable channels: Transactions, American Society of Civil Engineers, v. 120, no. 2776, p. 1234–1279.
Lara, J.M., and Pemberton, E.L., 1965, Initial weight of deposited sediments: Proceedings of the Federal Inter-Agency Sedimentation Conference, 1963, U.S. Department of Agriculture, Agricultural Research Service Miscellaneous Publication 970, p. 818–845.
Lisle, T.E., Iseya, F., and Ikeda, H., 1993, Response of a channel with alternate bars to a decrease in supply of mixed-size bed load—A flume experiment: Water Resources Research v. 29, no. 11, p. 3623–3629.
Milhous, R.T., 1982, Effect of sediment transport and flow regulation on the ecology of gravel-bed rivers, in Hey, R.D., Bathhurst, J.C., and Thorne, C.R., eds., Gravel-bed rivers: Chichester, England, John Wiley and Sons, Limited, p. 819–842.
Neill, C.R., 1968, A Re-examination of the beginning of movement for coarse granular bed materials: Walling-ford, United Kingdom, Hydraulics Research Station, Report No. INT 68, 37 p.
Parker, Gary, Klingman, P.C., and McLean, D.G., 1982, Bedload and size distribution in paved gravel-bed streams: American Society of Civil Engineers, Journal of the Hydraulics Division 108(HY4): 544–571.
Schumm, S.A., 1977, The fluvial system: New York, John Wiley and Sons, 338 p.
Schumm, S.A. and Khan, H.R., 1972, Experimental study of channel patterns: Geological Society of America Bulletin v. 83, p. 1755–1770.
Shields, A., 1936, Application of similarity principles and turbulence research to bedload movement, translated from Anwendung der Achnlichkaitsmechanik und der Turbulenzforschung auf die Geschiebewegung: Mittei-lung Preussischen Versuchanstalt fur Wasserbau und Schiffbau, Berlin, No. 26, by W.P. Ott and J.C. von Uchelen, California Institute of Technology Hydro-dynamics, Pasadena, Calif., report no. 167, 43 p.
Thorne, C.R., 1990, Effects of vegetation on riverbank erosion and stability, in Thornes, J.B. ed., Vegetation and erosion: New York, John Wiley, p. 125–144.
Tweto, Ogden, 1976, Geologic map of the Craig 1° × 2° quadrangle, Northwestern Colorado: U.S. Geological Survey Miscellaneous Investigations Series Map I–972.
U.S. Interagency Advisory Committee on Water Data, 1982, Guidelines for determining flood-flow frequency: Reston, Va., U.S. Geological Survey, Office of Water Data Coordination, Bulletin 17B of the Hydrology Subcommittee, 183 p.
Wilcock, P.R., 1992, Flow competence—A criticism of a classic concept: Earth Surface Processes and Land-forms, v. 17, p. 289–298.
Wilcock, P.R., and McArdell, B.W., 1993, Surface-based fractional transport rates—Mobilization thresholds and partial transport of a sand-gravel sediment: Water Resources Research v. 29, no. 4, p. 1297–1312.
Williams, G.P., and Wolman, M.G., 1984, Downstream effects of dams on alluvial rivers: U.S. Geological Survey Professional Paper 1286, 83 p.
Wolman, M.G., 1954, A method of sampling coarse river-bed material: American Geophysical Union Trans-actions, v. 35, p. 951–956.