changing the design philosophy to improve the quality … 2011/075-q11-097.pdf · changing the...
TRANSCRIPT
449
7th Research/Expert Conference with International Participations ”QUALITY 2011“, Neum, B&H, June 01 – 04, 2011
CHANGING THE DESIGN PHILOSOPHY TO IMPROVE THE QUALITY AND SAFETY OF TRAFFIC ON BRIDGING STRUCTURES
Andrej Štrukelj University of Maribor, Faculty of Civil Engineering
Maribor Slovenia
Iztok Ciglarič
Graz University of Technology, Vehicle Safety Institute Graz
Austria
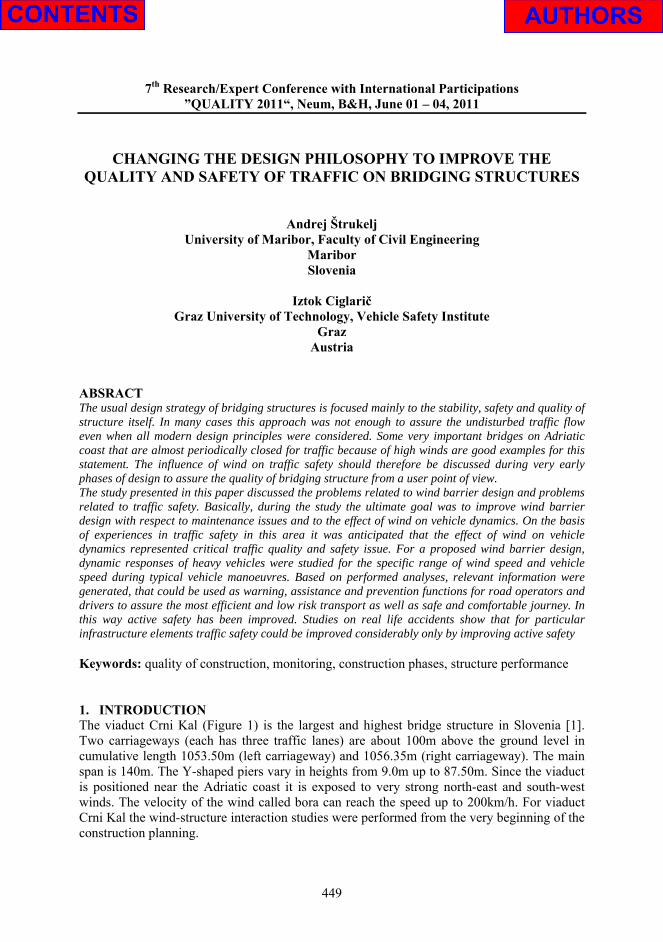
ABSRACT The usual design strategy of bridging structures is focused mainly to the stability, safety and quality of structure itself. In many cases this approach was not enough to assure the undisturbed traffic flow even when all modern design principles were considered. Some very important bridges on Adriatic coast that are almost periodically closed for traffic because of high winds are good examples for this statement. The influence of wind on traffic safety should therefore be discussed during very early phases of design to assure the quality of bridging structure from a user point of view. The study presented in this paper discussed the problems related to wind barrier design and problems related to traffic safety. Basically, during the study the ultimate goal was to improve wind barrier design with respect to maintenance issues and to the effect of wind on vehicle dynamics. On the basis of experiences in traffic safety in this area it was anticipated that the effect of wind on vehicle dynamics represented critical traffic quality and safety issue. For a proposed wind barrier design, dynamic responses of heavy vehicles were studied for the specific range of wind speed and vehicle speed during typical vehicle manoeuvres. Based on performed analyses, relevant information were generated, that could be used as warning, assistance and prevention functions for road operators and drivers to assure the most efficient and low risk transport as well as safe and comfortable journey. In this way active safety has been improved. Studies on real life accidents show that for particular infrastructure elements traffic safety could be improved considerably only by improving active safety Keywords: quality of construction, monitoring, construction phases, structure performance 1. INTRODUCTION The viaduct Crni Kal (Figure 1) is the largest and highest bridge structure in Slovenia [1]. Two carriageways (each has three traffic lanes) are about 100m above the ground level in cumulative length 1053.50m (left carriageway) and 1056.35m (right carriageway). The main span is 140m. The Y-shaped piers vary in heights from 9.0m up to 87.50m. Since the viaduct is positioned near the Adriatic coast it is exposed to very strong north-east and south-west winds. The velocity of the wind called bora can reach the speed up to 200km/h. For viaduct Crni Kal the wind-structure interaction studies were performed from the very beginning of the construction planning.
450
Figure 1. The view of the viaduct Crni Kal
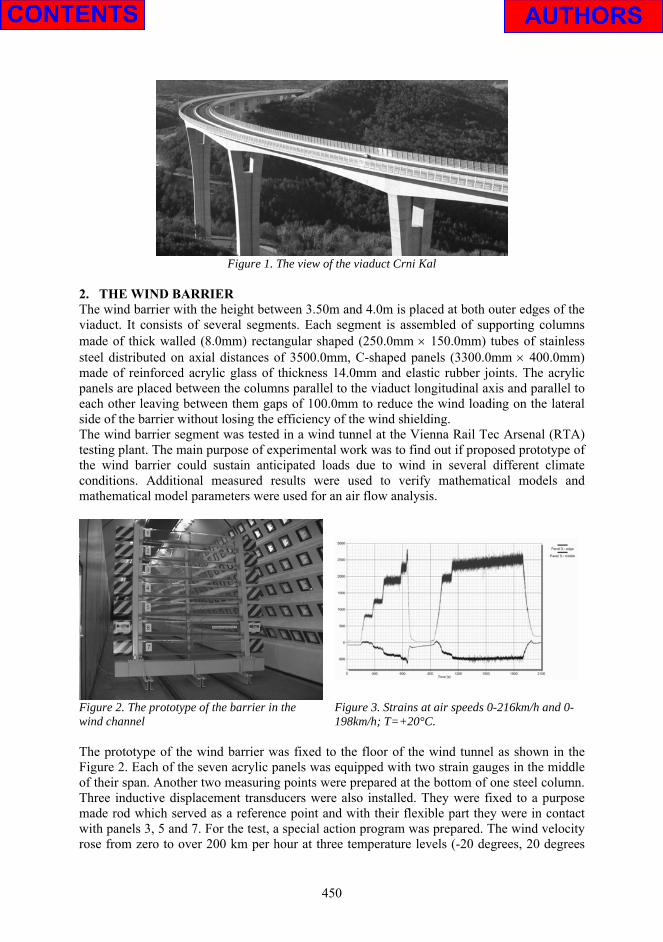
2. THE WIND BARRIER The wind barrier with the height between 3.50m and 4.0m is placed at both outer edges of the viaduct. It consists of several segments. Each segment is assembled of supporting columns made of thick walled (8.0mm) rectangular shaped (250.0mm × 150.0mm) tubes of stainless steel distributed on axial distances of 3500.0mm, C-shaped panels (3300.0mm × 400.0mm) made of reinforced acrylic glass of thickness 14.0mm and elastic rubber joints. The acrylic panels are placed between the columns parallel to the viaduct longitudinal axis and parallel to each other leaving between them gaps of 100.0mm to reduce the wind loading on the lateral side of the barrier without losing the efficiency of the wind shielding. The wind barrier segment was tested in a wind tunnel at the Vienna Rail Tec Arsenal (RTA) testing plant. The main purpose of experimental work was to find out if proposed prototype of the wind barrier could sustain anticipated loads due to wind in several different climate conditions. Additional measured results were used to verify mathematical models and mathematical model parameters were used for an air flow analysis.
Figure 2. The prototype of the barrier in the wind channel
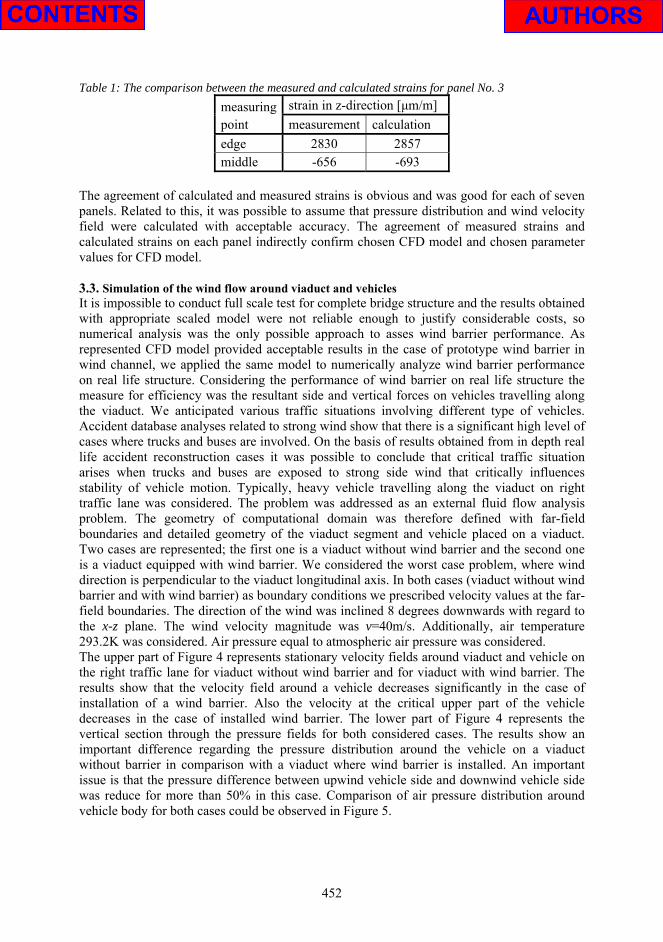
Figure 3. Strains at air speeds 0-216km/h and 0-198km/h; T=+20°C.
The prototype of the wind barrier was fixed to the floor of the wind tunnel as shown in the Figure 2. Each of the seven acrylic panels was equipped with two strain gauges in the middle of their span. Another two measuring points were prepared at the bottom of one steel column. Three inductive displacement transducers were also installed. They were fixed to a purpose made rod which served as a reference point and with their flexible part they were in contact with panels 3, 5 and 7. For the test, a special action program was prepared. The wind velocity rose from zero to over 200 km per hour at three temperature levels (-20 degrees, 20 degrees

451
and 50 degrees Celsius). The strains (16 measuring points), displacements (3 measuring points) and the wind velocities were simultaneously measured all the time. The sampling frequency during the wind loading was 300Hz. Because of a great amount of measured results the review of results in the paper is limited to results obtained on the acrylic panel No.3. Figure 3 shows the time history of strains measured in the middle of the span of the panel No.3 at the temperature T=+20°C. Experimental results show that maximal stresses within acrylic panels due to wind load did not exceed 10% of ultimate stress value. 3. ANALYSIS OF THE AIR FLOW AROUND THE VIADUCT AND VEHICLES
3.1. Air flow computational model Computational analysis was carried out using the COSMOS FloWorks code. The rectangular non-uniform meshing algorithm was used in the case of 2D and 3D computational domain. The meshing algorithm begins with the entire computational domain covered with a uniform base-level regular Cartesian grid. As the calculation progresses, individual grid cells were tagged for refinement, using a criterion that cells are split in the high gradient flow regions (i.e. high gradient of velocity or pressure). After refinement, individual grid patches on a single fixed level of refinement were passed off to an integrator which advances those cells in time. Finally, a correction procedure was implemented to adjust the transfer along coarse-fine grid interfaces in order to ensure that the amount of any conserved quantity leaving one cell exactly balances the amount enter the bordering cell. If at some point the level of refinement in a cell was greater than required, the high resolution grid was removed and replaced with a coarser one. It should be point out that three different types of cells were used, fluid cells, solid cells and partial cells. Partial cells lie in the solid-fluid interface computational domain region, partly in a fluid region and partly in a solid region. 3.2. Comparison of experimental and computational results To compare results, the computer simulation model of tested wind barrier prototype was setup first. The geometry of considered computational domain (wind channel containing wind barrier prototype) was modelled with all detailed geometrical characteristic. The generation of such a precise model was also necessary for the later displacements, stress and strain analysis of the acrylic panels. Two types of boundary conditions were used. The inlet velocity at the wind channel nozzle was prescribed as measured during experiment (v=60 m/s). At the outlet of wind channel the pressure p=101325Pa was prescribed as measured during experiment. In additional air temperature 293.2K was considered. Wind channel walls were considered as ideal wall that correspond to an adiabatic frictionless surface [3]. Calculated results show that due to nozzle effect the local velocity could reach up to 97m/s as anticipated, however velocity decrease rapidly with the respect to the distance from the gap between panels. Therefore gaps have no negative effect related to wind protection. Results also show that pressure distribution around the panels decrease due to gaps. Therefore the resulting mechanical load on supporting structure of wind barrier is considerably reduced. Special attention was paid to the pressure distribution around the surface of the acrylic panels in order to determine mechanical loads due to wind flow accurately. In addition, a detailed stress and strain analysis of each acrylic panels was performed, where calculated pressure distributions was used to determine external loads. To assure the proper boundary conditions, each panel was calculated as an assembly of the acrylic element with the rubber connecting element on both sides. Calculated normal strain for panel No. 3 is compared with measured results in Table 1.
452
Table 1: The comparison between the measured and calculated strains for panel No. 3 measuringpoint
strain in z-direction [μm/m] measurement calculation
edge 2830 2857 middle -656 -693
The agreement of calculated and measured strains is obvious and was good for each of seven panels. Related to this, it was possible to assume that pressure distribution and wind velocity field were calculated with acceptable accuracy. The agreement of measured strains and calculated strains on each panel indirectly confirm chosen CFD model and chosen parameter values for CFD model. 3.3. Simulation of the wind flow around viaduct and vehicles It is impossible to conduct full scale test for complete bridge structure and the results obtained with appropriate scaled model were not reliable enough to justify considerable costs, so numerical analysis was the only possible approach to asses wind barrier performance. As represented CFD model provided acceptable results in the case of prototype wind barrier in wind channel, we applied the same model to numerically analyze wind barrier performance on real life structure. Considering the performance of wind barrier on real life structure the measure for efficiency was the resultant side and vertical forces on vehicles travelling along the viaduct. We anticipated various traffic situations involving different type of vehicles. Accident database analyses related to strong wind show that there is a significant high level of cases where trucks and buses are involved. On the basis of results obtained from in depth real life accident reconstruction cases it was possible to conclude that critical traffic situation arises when trucks and buses are exposed to strong side wind that critically influences stability of vehicle motion. Typically, heavy vehicle travelling along the viaduct on right traffic lane was considered. The problem was addressed as an external fluid flow analysis problem. The geometry of computational domain was therefore defined with far-field boundaries and detailed geometry of the viaduct segment and vehicle placed on a viaduct. Two cases are represented; the first one is a viaduct without wind barrier and the second one is a viaduct equipped with wind barrier. We considered the worst case problem, where wind direction is perpendicular to the viaduct longitudinal axis. In both cases (viaduct without wind barrier and with wind barrier) as boundary conditions we prescribed velocity values at the far-field boundaries. The direction of the wind was inclined 8 degrees downwards with regard to the x-z plane. The wind velocity magnitude was v=40m/s. Additionally, air temperature 293.2K was considered. Air pressure equal to atmospheric air pressure was considered. The upper part of Figure 4 represents stationary velocity fields around viaduct and vehicle on the right traffic lane for viaduct without wind barrier and for viaduct with wind barrier. The results show that the velocity field around a vehicle decreases significantly in the case of installation of a wind barrier. Also the velocity at the critical upper part of the vehicle decreases in the case of installed wind barrier. The lower part of Figure 4 represents the vertical section through the pressure fields for both considered cases. The results show an important difference regarding the pressure distribution around the vehicle on a viaduct without barrier in comparison with a viaduct where wind barrier is installed. An important issue is that the pressure difference between upwind vehicle side and downwind vehicle side was reduce for more than 50% in this case. Comparison of air pressure distribution around vehicle body for both cases could be observed in Figure 5.

453
Figure 4. The simulation of the velocity field (upper part of the Figure) and the pressure field (lower part of the Figure) around the vehicle on the viaduct with (right part of the Figure) and without (left
part of the Figure) the wind barrier
Figure 5. The comparison of the pressure distributions around the vehicle body on the viaduct with
and without wind barrier Considering vehicle geometry and calculated pressure distribution around vehicle body it was possible to calculate resultant forces and their incidence points. This was done by integrating pressure distribution over the vehicle body boundary surface. For considered problems it was possible to calculate that resultant horizontal (side) force magnitude was Fh=5162.0N for a vehicle with typical cross section area 4.0m height and 2.3m of brightness, on each 1m of vehicle length, while resultant vertical force magnitude was Fv=172.0N if a wind barrier was not present. If a wind barrier was installed, forces were reduced considerably. In this case resultant horizontal (side) force magnitude was Fh=2530.0N while resultant vertical force magnitude was Fv=652.0N. It is obvious that calculated forces could have important effect on vehicle dynamic in the term of stability of vehicle motion. To assess the influence of resultant wind forces to the stability of vehicle motion it was necessary to perform an additional analysis as represent in the next chapter.

454
4. ANALYSIS OF THE VEHICLE DYNAMICS DUE TO WIND FLOW In the first case we treat a situation of a vehicle travelling downhill (slope of 3.0%) with the speed 60km/h and without wind barrier. Moreover, 5% of transverse inclination is considered, as road section is curved with curvature radius of 800m. Due to resultant wind force we can observe unstable vehicle motion that in final stage results in rollover. In the second case we treat the same viaduct section, where a vehicle travels with speed 80km/h and there is a wind barrier. Due to resultant wind force we can observe stable vehicle motion; however a vehicle approaches to the right margin of traffic lane. Time sequences of vehicle position and orientation for time increment 0,75s for both cases are shown in Figure 6.
Figure 6. Time sequence of vehicle position and orientation for time increment 0,75s at side wind
speed 140km/h without wind barrier at vehicle travelling speed 60km/h (upper part of the Figure) and with wind barrier at vehicle travelling speed 80km/h (lower part of the Figure)
5. CONCLUSIONS Practice shows that a wind barrier is a very important safety feature which considerably improves the quality of traffic flow. It could be stated that the viaduct structure Crni Kal could not meet basic safety criteria without a wind barrier and therefore could not be released for public use. Despite the fact that from September 2004, when the viaduct was opened for traffic, until today the traffic over the viaduct was practically undisturbed, advanced safety studies show that high vehicles could undergo transversal motion even if wind barrier is mounted. Therefore, further detailed studies should be performed. Finally, it is important to anticipate that the function of viaducts and other traffic related structures is in the first line secure travelling of passengers in any weather conditions. This can be assured only if represented safety analyses are the part of design procedure. 6. REFERENCES [1] Strukelj, A., Pipenbaher, M. The experimental verification of the air flow simulation. V: Topping,
Barry H. V. (ur.), SOARES, Carlos A. Mota (ur.). Proceedings of the fourth International conference on engineering computational technology, Lisbon - Portugal, 7-9 September 2004. Stirling: Civil-Comp, cop. 2004.
[2] Ciglaric, I. In depth truck accident study related to road infrastructure in Slovenia. Internal study related to European project ETAC. REKONSTRUKCIJA s.p., Maribor, 2004.
[3] Bergstroem, R. Two equation turbulence models for swirling Flow. Thesis for the degree of Master of Science in Engineering Physic. Chalmers university of technology, Goeteborg, Sweden, 1997.
[4] Crolla, D. A. Vehicle dynamics-theory into practice. Automobile Division Chairman’s Address, emcee, 1995.