changing sources and environmental factors reduce the ... · 2norwegian institute for air research...
TRANSCRIPT

Atmos. Chem. Phys., 12, 4033–4044, 2012www.atmos-chem-phys.net/12/4033/2012/doi:10.5194/acp-12-4033-2012© Author(s) 2012. CC Attribution 3.0 License.
AtmosphericChemistry
and Physics
Changing sources and environmental factors reduce the rates ofdecline of organochlorine pesticides in the Arctic atmosphere
S. Becker1, C. J. Halsall1, W. Tych1, R. Kallenborn2,3, M. Schlabach2, and S. Manø2
1Lancaster Environment Centre, Lancaster University, Lancaster LA1 4YQ, UK2Norwegian Institute for Air Research (NILU), P.O. Box 100, 2007 Kjeller, Norway3The Norwegian University of Life Sciences (UMB), Department of Chemistry, Biotechnology and Food Scienc, P.O. Box5003, 1432 Aas, Norway
Correspondence to:C. Halsall ([email protected])
Received: 15 October 2008 – Published in Atmos. Chem. Phys. Discuss.: 8 January 2009Revised: 28 March 2012 – Accepted: 13 April 2012 – Published: 8 May 2012
Abstract. An extensive database of organochlorine (OC)pesticide concentrations measured at the Norwegian Arcticmonitoring station at Ny-Alesund, Svalbard, was analysed toassess longer-term trends in the Arctic atmosphere. DynamicHarmonic Regression (DHR) is employed to investigate theseasonal and cyclical behaviour of chlordanes, DDTs andhexachlorobenzene (HCB), and to isolate underlying inter-annual trends. Although a simple comparison of annual meanconcentrations (1994–2005) suggest a decline for all of theOCs investigated, the longer-term trends identified by DHRonly show a significant decline forp,p′-DDT. Indeed, HCBshows an increase from 2003–2005. This is thought to bedue to changes in source types and the presence of impu-rities in current use pesticides, together with retreating seaice affecting air-water exchange. Changes in source typeswere revealed by using isomeric ratios for the chlordanesand DDTs. Declining trends in ratios oftrans-chlordane/cis-chlordane (TC/CC) indicate a shift from primary sources, tomore “weathered” secondary sources, whereas an increasingtrend ino,p′-DDT/p,p′-DDT ratios indicate a shift from useof technical DDT to dicofol. Continued monitoring of theseOC pesticides is required to fully understand the influenceof a changing climate on the behaviour and environmentalcycling of these chemicals in the Arctic as well as possibleimpacts from “new” sources.
1 Introduction
The use of organochlorine (OC) pesticides has been sub-ject to restrictions in the majority of the world for manyyears now due to their persistence in the environment andtheir ability to cause harm. OC pesticides are of particu-lar relevance as they are semi-volatile and prone to long-range atmospheric transport (LRAT), thus affecting areas farremoved from the initial point of release (UNECE, 1998).As such they have been the subject of long term monitor-ing campaigns initiated by the Arctic Environment Protec-tion Strategy (AEPS), which was signed in June 1991 bycircumpolar countries to help protect the Arctic. Air mon-itoring in several circumpolar countries (including Canada,Norway and Russia) falls under the auspices of the Arc-tic Monitoring Assessment Programme (AMAP, 2002). Con-cern over chemicals like the OC pesticides in the Arctic canbe illustrated by considering human exposure to these com-pounds. For example, a study of chlordane exposure to anInuit population living on Broughton Island, Canada. in thelate-1990s estimated a daily intake of∼5 µg kg−1 bw day−1,whereas North Americans (where chlordane use was high),were exposed to∼0.1 µg kg−1 bw day−1 (van Oostdam etal., 2005; Dougherty et al., 2000). To date, there have beenseveral publications investigating the temporal and spatialtrends of OC pesticides, although these have mainly focusedon the Canadian Arctic (e.g. Hung et al. 2002, 2005), orover much shorter time-series (e.g. Oehme et al., 1995; Berget al., 2004). Therefore, this paper investigates the tempo-ral trends of selected OC pesticides in the atmosphere of
Published by Copernicus Publications on behalf of the European Geosciences Union.

4034 S. Becker et al.: Decline of organochlorine pesticides in the Arctic atmosphere
the Norwegian Arctic utilising data collected by the Nor-wegian Air Research Institute (NILU) at Ny-Alesund, Sval-bard for the period 1994-2005. The following OC pesticidedatasets: chlordanes (trans- and cis- isomers), DDTs, andhexachlorobenzene (HCB) were analysed with the use ofdynamic harmonic regression (DHR), a sophisticated time-series modelling tool, to determine the seasonal behaviourand long-term temporal trends of these compounds. Forease of reading, these chemicals are considered separatelythroughout the paper.
Chlordane– Chlordane was used extensively on food andnon-food agricultural crops, residential lawns and gardens,and in buildings for the control of structural pests such astermites. The use of this pesticide was banned in the major-ity of the world in the late 1980s, with use remaining highin areas such as California until 1988, when a ban was in-troduced in the US (Shigenaka, 1990; Connor et al., 2006).Chlordane is a mixture of different chlordane isomers, otherchlorinated hydrocarbons and several other components. Thetwo main constituents in the technical mixture aretrans-chlordane (TC) andcis-chlordane (CC), and both are re-ported in the Norwegian air dataset. Ratios of these two iso-mers can be used to indicate recent or ongoing use of thetechnical mixture as opposed to re-volatilisation from soilsarising from historical use (Bidleman and Leone, 2004). Theratio of these compounds (TC/CC) found in the technicalmixture used in the US is∼1.16 (Jantunen et al., 2000), al-though global ratios in technical chlordane have been seento range from 1.26–1.35 TC/CC (Patton et al., 1991). A re-cent investigation by Hung et al. (2005) found that, althoughthere were occasional spikes in TC/CC ratios observed atAlert between 1995–1997, these were usually related to highepisodes of heptachlor, suggesting use of heptachlor contain-ing TC and CC at these times. Generally, a ratio of<1 in theatmosphere indicates an older source i.e. historical use anddepletion of TC, whereas a ratio>1 indicates recent use ofthis pesticide. The average ratio in the early 2000s observedin the Arctic atmosphere was<1, suggesting that secondarysources from soils and vegetation are now the predominantcontemporary sources to influence the Arctic (Bidleman etal., 2002).
DDTs– The use of DDT in its technical form was widelybanned in the 1970s, but it is still permitted for use in somecountries under special licence. For example, this chemicalis still used in technical form for the control of disease vec-tors in countries such as Africa and South America and inanti-fouling paints in China (Li et al., 2007). Technical gradeDDT is made up of≥80 % p,p′-DDT; ≥15 % o,p′-DDTand smaller quantities ofp,p′- ando,p′-DDD. DDT is alsoused in the production of dicofol which is used to kill mitessuch as the red spider mite on crops (PAN, 2008). From1988–2000, the annual production of DDT in China was esti-mated to be∼ 6000 t, of which∼80 % was used for the pro-duction of dicofol (Yang et al., 2007). DDT and chlorinatedDDT (Cl-DDT) may remain as impurities after the synthe-
sis reactions involved in the production of dicofol (Zhang etal., 2002; Qiu et al., 2005; Li et al., 2006). Thep,p′- ando,p′- isomers of DDT, DDE and DDD are investigated herein order to assess temporal trends and changing source types.Ratios can be used to give an idea of the age of the source ofDDT by taking a ratio of DDT/DDE + DDD, and whether thesignal is from the use of Technical DDT or dicofol by takinga ratio ofo,p′-DDT/p,p′-DDT.
Hexachlorobenzene (HCB)– HCB has had several usesin industry and agriculture, as a porosity control agent, afungicide and as a wood preserving agent. Bans or restric-tions on use were implemented throughout the period 1960–2000, with the latest recorded ban being introduced in 2003in Canada. The use of HCB as an intermediate (mainly forchemicals used in pyrotechnics) occurs in China and Rus-sia (Xu et al., 2004; Barber et al., 2005). Global HCB emis-sions from all emission types have been estimated at between12 000–92 000 kg yr−1 based on information from the mid1990s (Bailey, 2001).
2 Methods
2.1 Air monitoring database
Atmospheric samples were collected weekly over a period of48 h at Ny-Alesund, Svalbard, Norway (78◦55′ N/11◦56′ E).The database extends back to 1993; however as air sampleswere not taken systematically throughout 1993, this year hasbeen excluded from the data analysis. Details of air concen-trations for this period can be found in an earlier publicationby Oehme et al. (1996). The systematic analysis of the DDTsdid not begin until 1994, although these were measured dur-ing shorter sampling campaigns prior to this.
Details of sampling and analysis can be found in previ-ous publications (Oehme et al., 1995, 1996). Briefly, eachsample was collected using a High-Volume sampler aspi-rating 1000–1100 m3 of air, at a rate of∼ 20 m3 h−1 withthe particulate and vapour phases operationally collected ona glass fibre filter (GFF), and two sequential polyurethanefoam (PUF) plugs, respectively. As a quality control proce-dure, prior to sample extraction, the first PUF was spikedwith 50 ng of ε-HCH to test for analyte recovery. TheGFF and PUFs were then extracted separately for 8 h withn-hexane/diethyl ether (9:1). The extracts were then com-bined (since only a small fraction of the compounds analysed(<10 %) are found in the particulate phase) and exchanged to100 µLn−nonane keeper solvent. The resulting extract wasthen subject to acid clean-up (concentrated sulphuric acid)and column chromatography (silica column). Following theaddition of octachloronapthalene as an internal standard, thesamples were reduced to∼100 µL and the OC pesticidesqualified/quantified using GC-MS (operating in NCI mode).Instrumental operating conditions can be found in Oehme etal. (1995, 1996). The resulting POPs database is maintained
Atmos. Chem. Phys., 12, 4033–4044, 2012 www.atmos-chem-phys.net/12/4033/2012/

S. Becker et al.: Decline of organochlorine pesticides in the Arctic atmosphere 4035
Table 1. Annual arithmetic means in pg m−3 (standard deviation) fortrans-chlordane (TC) andcis-chlordane (CC), DDT (individual com-pounds and total DDT) and HCB measured at Zeppelin, Svalbard, Norway 1994–2005. The average summer (June-August) and winter(January–March) ratios of TC/CC are also given.
1994 1995 1996 1997 1998 1999 2000 2001 2002 2003 2004 2005
trans-chlordane 0.70(0.57)
0.42(0.24)
0.59(0.40)
0.54(0.28)
0.37(0.20)
0.36(0.19)
0.26(0.13)
0.34(0.20)
0.37(0.25)
0.26(0.14)
0.25(0.15)
0.25(0.13)
cis-chlordane 1.20(0.41)
0.96(0.30)
1.17(0.50)
0.81(0.45)
0.78(0.35)
0.78(0.19)
0.65(0.15)
0.85(0.29)
0.84(0.21)
0.69(0.20)
0.67(0.14)
0.61(0.13)
TC/CC summer 0.39 0.26 0.34 0.58 0.12 0.28 0.19 1.49 0.21 0.22 0.21 0.23TC/CC winter 0.88 0.69 0.68 0.74 0.70 0.64 0.62 1.03 0.76 0.59 0.59 0.64p,p′-DDT 0.87
(0.60)0.32(0.25)
0.38(0.22)
0.26(0.27)
0.55(0.51)
0.57(0.56)
0.14(0.06)
0.14(0.13)
0.14(0.15)
0.14(0.11)
0.10(0.07)
0.09(0.08)
o,p′-DDT 1.04(0.75)
0.50(0.44)
0.48(0.28)
0.39(0.27)
0.51(0.28)
0.47(0.34)
0.24(0.14)
0.26(0.24)
0.26(0.20)
0.22(0.14)
0.55(0.34)
0.19(0.14)
p,p′-DDE 1.93(1.52)
0.87(0.80)
1.50(2.03)
1.15(1.67)
1.13(0.55)
0.98(1.43)
0.47(0.36)
0.81(1.04)
0.98(2.32)
0.86(0.80)
2.32(10.74)
0.09(0.08)
o,p′-DDE 1.42(1.04)
0.22(0.23)
0.16(0.14)
0.16(0.11)
0.20(0.09)
0.12(0.09)
0.10(0.06)
0.11(0.10)
0.10(0.10)
0.11(0.09)
10.74(1.74)
0.59(0.66)
p,p′-DDD 0.09(0.06)
0.05(0.03)
0.11(0.09)
0.05(0.07)
0.06(0.08)
0.10(0.14)
0.06(0.05)
0.04(0.05)
0.04(0.06)
0.07(0.09)
0.42(0.40)
0.03(0.02)
o,p’-DDD 0.07(0.05)
0.05(0.03)
0.09(0.07)
0.06(0.09)
0.06(0.09)
0.07(0.08)
0.05(0.04)
0.03(0.04)
0.02(0.02)
0.03(0.02)
0.15(0.18)
0.02(0.01)∑
DDT 5.42(3.77)
1.97(1.63)
2.60(2.29)
2.07(2.10)
2.52(1.34)
2.29(1.96)
1.11(0.78)
1.39(1.35)
1.54(2.68)
1.43(1.11)
14.28(12.91)
1.01(0.95)
HCB 115.4(68.74)
99.07(20.54)
91.93(28.28)
108.16(134.72)
80.27(17.29)
86.73(17.54)
55.40(10.15)
59.21(31.40)
52.88(16.29)
54.14(10.85)
65.39(5.96)
67.09(7.73)
Note: Unusually high concentrations in 1994 and 2004 are in italic.
and updated in Excel spreadsheet format, with data periodi-cally fed into AMAP and the Co-operative Programme forMonitoring and Evaluation of the Long Range Transmis-sion of Air Pollutants in Europe (EMEP) programmes (e.g.AMAP, 2002).
2.2 Trend analysis using Dynamic HarmonicRegression (DHR)
DHR is a sophisticated time-series analysis tool usingstochastic time variable parameters (TVPs), which canevolve over time thus allowing the tracking of changes insource strengths and types. Due to this, and the estimationmethod applied, quantitative confidence can be attributedto the resulting ‘smooth’ trend lines estimated using thistool. This modelling approach has been described in detailelsewhere (Young, 1999; Young et al., 1999; Tych et al.,2002; Becker et al., 2006, 2008). In brief, DHR identifiestrend (non-linear), seasonal, cyclical and irregular (or un-modelled) components in the time-series data set which thencan be used to present an overall trend and temporal evolu-tion of seasonal components. A simpler form of the model isused here as the cyclical component is not modelled. This isdescribed by Eq. (1).
yt = Tt + St + et (1)
where yt is the time series; Tt is a longer term trend or low-frequency, slowly changing component; St the seasonal com-ponent and et an irregular or “noise” component due to the
inherent variations found in atmospheric data caused, for ex-ample, by incursions of polluted or ‘clean’ air masses overthe sampling site.
Fortnightly (bi-weekly) concentrations were used for thetime-series analysis. Missing values or outliers (deemed as>3∗inter-quartile range – see Becker et al. (2008)) were re-placed by a “NaN flag” (not a number) allowing DHR to in-terpolate across these points. The quality control proceduresapplied to the dataset ensure that only those weekly concen-trations deemed above the method detection limits were in-cluded in the dataset (Oehme et al., 1995).
3 Results and discussion
Table 1 shows the arithmetic mean concentrations (pg m−3)for all the chemicals investigated (standard deviation inparentheses) for the years 1994–2005 inclusive. A simplecomparison of these arithmetic means recorded in 1994 and2005 show a decline for all compounds throughout the sam-pling period, which is in agreement with studies conductedin Arctic Canada and regions that are operated under theCanadian Northern Contaminants Program (Bailey, 2001;Hung et al., 2005; Su et al., 2008). The following sectionscompare concentrations from previous publications result-ing from earlier sampling campaigns, conducted primarily atZeppelin and Alert, and look at the seasonality displayed byeach of the chemicals investigated. The longer-term trends
www.atmos-chem-phys.net/12/4033/2012/ Atmos. Chem. Phys., 12, 4033–4044, 2012

4036 S. Becker et al.: Decline of organochlorine pesticides in the Arctic atmosphere
are interpreted and related to changing patterns in use andsource distribution.
Chlordanes– Both of the isomers (trans- andcis-) showa slight decline throughout the time series, although con-centrations recorded at the beginning of the sampling cam-paign are not statistically different from earlier campaignsconducted in the spring of 1992 and March-December of1993 (Oehme et al., 1995, 1996) (see Table 1). These earlierstudies report average concentrations of 0.55±0.23 pg m−3
for trans-chlordane (TC) and 0.98±0.38 pg m−3 for cis-chlordane (CC) in 1992 (0.53 and 1.09 pg m−3 in 1993)(Oehme et al., 1995, 1996). The concentrations in 1992 werealso found to be similar to those reported in 1984 (Oehme etal., 1995). Average concentrations of TC and CC measured atAlert were 0.32 and 0.75 pg m−3, respectively, for the period2002–2003 and were similar to those observed at Zeppelin.
Both TC and CC display seasonal variations, althoughthere are different patterns observed for the two isomers. Fig-ure 1 presents the observed data and the DHR model fit forboth TC (A) and CC (B). Strong annual signals are identi-fied by DHR for TC, marked by distinct winter maxima andsummer minima, together with a weaker 6 monthly pattern.In contrast, CC shows a stronger 6 monthly (bi-modal) pat-tern, again with winter maxima, but with two, more distinct“peaks” in spring (March–May), and September–November.These seasonal differences could be due to the preferentialphotodegradation of TC during the summer months, com-pared to CC (Oehme, 1991). This seasonality is also sup-ported by examining the ratios of TC/CC. In 1984, the av-erage summer ratio was∼0.5 and the average winter ratiowas∼1 (Oehme, 1991). The latter winter ratio is similar tothe ratio of technical chlordane, and the author attributes thisto long-range transport primarily from North America, al-though some episodes were associated with air masses orig-inating from southern Europe. Chlordanes were not used incentral Europe (Bidleman et al., 1987) so episodes of ele-vated concentrations may be attributed to chlordane use incountries such as Spain or Portugal, from exchange with sur-face sea water, or mixing with polluted air masses over theNorth Atlantic. Annual average ratios of TC/CC ranged from0.12–0.58 in summer (June–August) and 0.59–0.88 in winter(January–March). The values from 2001 (i.e. 1.49 in sum-mer; 1.03 in winter) are not included in these ranges as sev-eral values in this year were determined when the concentra-tions of either TC or CC were at or below the method de-tection limit, with the effect of skewing the calculated ratios.The seasonal ratios for each year are given in Table 1 and theaverage monthly ratios are displayed in Fig. 2 to show thepattern relating to summertime depletion (possibly reflectingenhanced photodegradation) of TC. Ratios ranging from 0.78to 1.29 in the Canadian Arctic, just west of Ellesmere Islandin February to April in 1988 (Patton et al., 1991) could be in-dicative of use patterns at this time. Previously TC/CC ratiosreported for sampling campaigns during the same period ata number of Arctic sites were all<1 in 1993/1994 (Halsall
et al., 1998). An increase in ratios between 1993–1997 mea-sured at Alert with several episodes where ratios were>1were attributed to sporadic fresh applications of chlordane-based pesticides (Hung et al., 2002, 2005). In more recentinvestigations at Alert and other Arctic locations (with theexception of Point Barrow, Alaska) all ratios have been re-ported to be<1 reflecting a ‘weathered’ signal, probably re-sulting from re-emissions from contaminated soils (Hung etal., 2005; Su et al., 2008). The higher ratios seen at Point Bar-row in 2000–2003 were attributed to applications of technicalheptachlor containing TC and CC, as the higher ratios coin-cided with higher than average heptachlor concentrations (Suet al., 2008).
The long-term trends of TC and CC, as depicted by DHR,in Fig. 1 (c and d) show a decline throughout the time-series, although these were only slight. Whilst the declinefor CC was not consistent across the time-series, with anincreasing trend observed from 2000–2002, both isomershave decreased over the 12 yr period. Berg et al. (2004)did not observe any trend when analysing data from Zep-pelin from 1993–2002, and this current study only shows adecrease of log 0.6 pg m−3 (0.25 pg m−3) in concentrationswhen comparing the beginning and end of the model trendlines. Similarly, trends seen at Alert for the period 1993 to1999 demonstrated only a slight decline (Hung et al., 2005).There are several factors which may influence the rates ofdecline for these two isomers. The shallow gradient of thefitted trend lines, probably reflect the fact that these chem-icals are still being introduced into the atmosphere throughre-volatilisation from soils (Bildeman et al., 2004, Bidlemanand Leone, 2004); although re-volatilisation from ice-freeArctic Ocean surface waters into the overlying atmosphereis uncertain, due to the lack of measurements. The use oftechnical heptachlor which contains both TC and CC mayalso influence levels in the contemporary arctic atmosphere(Hung et al., 2002). The difference in degradation rates forthe two isomers may also influence their relative decline. Thepotential of TC to be degraded through photolysis has beenmentioned previously, however, this isomer is also thoughtto be preferentially degraded by marine biota from severaltrophic levels, and is more readily metabolised to oxychlor-dane, compared to the more stable CC isomer (Kawano et al.,1988).
DDTs– Elevated concentrations of the DDTs observed in2004 (with the exception ofp,p′-DDT) are highlighted inTable 1. These were apparent from mid-June to Decemberwith o,p′-DDE showing the highest concentrations, reach-ing a maximum of 28 pg m−3 in August and September, thendeclining to∼10 pg m−3 in December. At Alert, high con-centrations were also apparent during 2004, with one sampleweek (beginning 17th May) displaying elevated concentra-tions ofo,p′-DDE (30 pg m−3) andp,p′-DDE (41 pg m−3).All other DDT-related compounds were also high during thisevent (H. Hung, personal communication, 2008), althoughthese elevated concentrations were not apparent at Zeppelin
Atmos. Chem. Phys., 12, 4033–4044, 2012 www.atmos-chem-phys.net/12/4033/2012/

S. Becker et al.: Decline of organochlorine pesticides in the Arctic atmosphere 4037
Figure 1: Measured data and model fit for trans-chlordane (A) and cis-chlordane (B) with goodness of fit between observed data and model fit expressed by the r2 value (p<0.05). Seasonally adjusted data and underlying trends are provided in plots C (trans-chlordane) and D (cis-chlordane)
1994 1996 1998 2000 2002 2004 2006-2.5
-2
-1.5
-1
-0.5
0
0.5Model plot: cis-chlordane R2=0.73088
log p
g/m
3
model uncertainty
model
data
1994 1996 1998 2000 2002 2004 2006-2.5
-2
-1.5
-1
-0.5
0
0.5Model plot: cis-chlordane R2=0.73088
log p
g/m
3
model uncertainty
model
data
r2 = 0.89
trans-chlordane A
B cis-chlordane
R2 = 0.73
1994 1996 1998 2000 2002 2004 2006
-1.6
-1.4
-1.2
-1
-0.8
-0.6
-0.4
-0.2
0
0.2
trans-chlordane
log p
g/m
3
trend uncertainty (3*s.e.)
trend uncertainty (s.e.)
trend
seas.adj.data
1994 1996 1998 2000 2002 2004 2006
-1.6
-1.4
-1.2
-1
-0.8
-0.6
-0.4
-0.2
0
0.2
cis-chlordane
log p
g/m
3
trend uncertainty (3*s.e.)
trend uncertainty (s.e.)
trend
seas.adj.data
trans-chlordane
C
D cis-chlordane
Fig. 1. Measured data and model fit fortrans-chlordane(A) andcis-chlordane(B) with goodness of fit between observed data and modelfit expressed by ther2 value (p < 0.05). Seasonally adjusted data and underlying trends are provided in plots(C) (trans-chlordane) and(D)(cis-chlordane).
over the same period. Nonetheless, elevated DDT concentra-tions during 2004 are apparent at both the Canadian and Nor-wegian monitoring stations, indicating some regional sourceor event that lead to these high concentrations. A study byEckhardt et al. (2007), found that extensive forest fires insub-Arctic regions, and areas further south, were a sourceof previously deposited POPs to the atmosphere, includingthe DDTs. Atmospheric long-range transport resulted in thisfire “signal;; being observed at Zeppelin, although this was3–4 weeks later than at the monitoring stations of Barrow(Alaska) and Summit (Greenland) due to the greater distanceinvolved. Back trajectories carried out for 24–26 July 2004(when high values of aerosol light absorption coefficientswere measured at Zeppelin) showed air mass origins withinthe boreal forest region, with air bypassing Alert, but affect-ing Zeppelin (Eckhardt et al., 2007). This is a possible ex-
planation of the elevated values observed at Zeppelin duringthis period.
The seasonality and longer term trend of DDTs identifiedby DHR do not appear to be affected by ‘episodes’ that oc-curred in 2004, with the exception ofo,p′-DDE. For this rea-son, the trend analysis was conducted using the entire time-series for all the DDTs, excepto,p′-DDE, which was inves-tigated from 1994–2003 only.
The seasonality displayed by DDTs is broadly charac-terised by winter maxima and summer minima, although thisis less apparent for the DDDs. This was identified by DHR,with the most pronounced seasonality observed for the DDEs(especiallyo,p′-DDE). These seasonal patterns are shown inFig. 3, which gives the observed data and DHR model fit foreach of the compounds. These patterns are in agreement withprevious studies that have examined Canadian air datasets,but over a much shorter time period (i.e. several years of
www.atmos-chem-phys.net/12/4033/2012/ Atmos. Chem. Phys., 12, 4033–4044, 2012

4038 S. Becker et al.: Decline of organochlorine pesticides in the Arctic atmosphere
Figure 2: Average monthly TC/CC ratios at Zeppelin 1994-2005.
0.00
0.20
0.40
0.60
0.80
1.00
1.20
1.40
1.60
1.80
Jan Feb Mar Apr May Jun Jul Aug Sep Oct Nov Dec
Month
TC
/CC
ratio
1994 1995 1996 1997 1998 1999 2000 2001 2002 2003 2004 2005
24
Fig. 2.Average monthly TC/CC ratios at Zeppelin 1994–2005.
systematic data) (Halsall et al., 1998; Bailey et al., 2000;Hung et al., 2002).
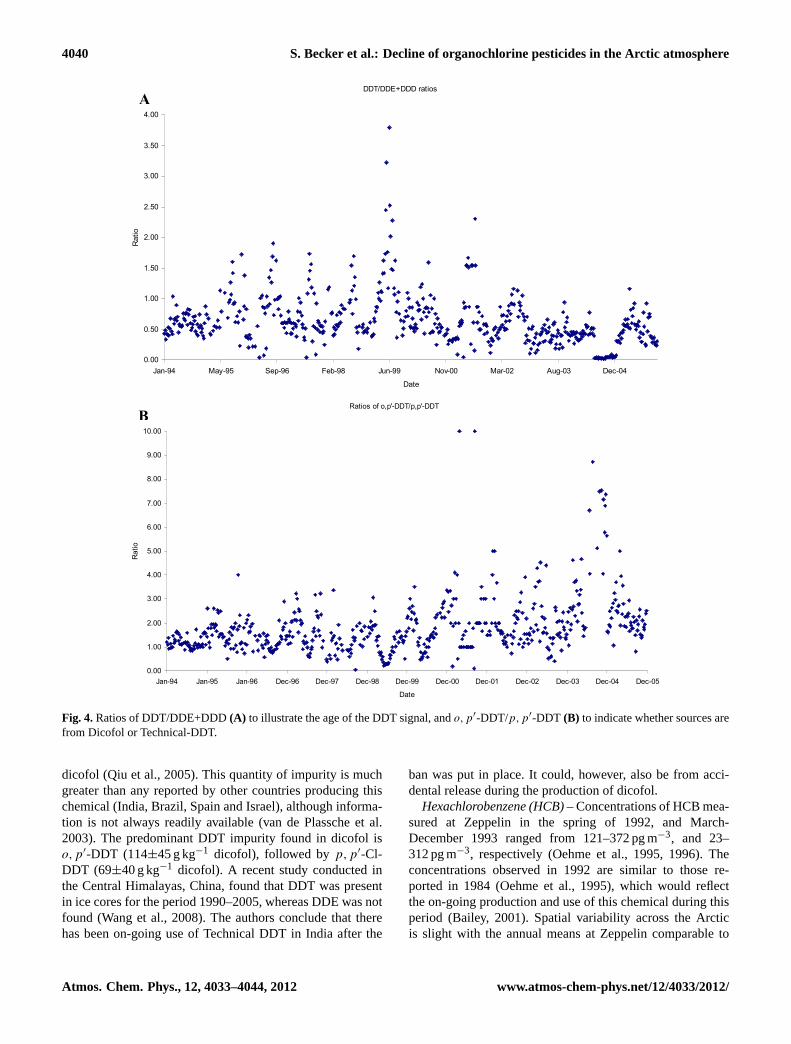
The time series of DDT/DDE+DDD ando,p′-DDT/p,p′-DDT ratios are presented in Fig. 4 and provide a usefulinsight into the seasonal composition of the DDTs. Thesum degradation products from DDT (i.e.o,p′
− andp,p′-isomers of DDE and DDD, compared to both isomers ofDDT) were included here, as use ofp,p′-DDT/p,p′-DDEratios alone may be misleading due to the degradation ofp,p′-Cl-DDT (contained in dicofol) top,p′-DDE (Qiu etal., 2005). Figure 4 illustratesp,p′-DDT dominating duringthe Arctic summer andp,p′-DDE dominating during win-ter, a pattern that was also observed by Bailey et al. (2000)and Berg et al. (2004), who both attributed the higher win-ter values ofp,p′-DDE to long range transport from Asia.Another reason for the winter increase inp,p−DDE (themetabolite ofp,p′-DDT) could be due to transport with par-ticles (aeolian dusts), coinciding with elevated aerosol levelsduring the Arctic Haze period (Halsall et al., 1998; Hung etal., 2002). Furthermore, Su et al. (2006) have recognised thatDDTs could be more susceptible to precipitation scavengingduring the warmer arctic summer.
Figure 5 presents the trends identified by DHR for themajor DDT compounds. A declining trend was only appar-ent for p,p′-DDT across the time series. Although a sig-nificant decrease in concentrations is evident at the begin-ning of the time series foro,p′-DDE, this is thought to bedue to the high values recorded in 1994 (∼7 times greater
than those in previous (Oehme et al., 1996) and subsequentyears, Table 1), rather than a significant decline at this time.It is difficult to explain these high values which may arisedue to a variety of factors, including: episodes associatedwith boreal forest fires (discussed earlier); other phenom-ena such as a pronounced Arctic Haze season; or the freshuse of technical DDT/dicofol and subsequent LRT. The onlyDDT isomer, which shows any consistent decline throughoutthe time series, isp,p′-DDT (Fig. 5). These results are inagreement with other studies investigating DDTs, withp,p′-DDE showing the lowest variation in concentrations acrossthe time series. This would support the theory thatp,p′-Cl-DDT, present in dicofol, may also be a source ofp,p′-DDEand helping to maintain levels in the atmosphere.
Dicofol is produced and used in southern Europe, India,China, Israel and Brazil. Spain produces∼1500 t per year(processing is conducted in Italy), and use was reported tobe 100–150 t in 2000 (van de Plassche et al. 2003). Theamount of DDT related compounds present in dicofol isheavily regulated in most countries, with a maximum of0.1 % DDT impurity permitted. However, a content of 3.5 %DDTs has been reported in dicofol produced in India (van dePlassche et al., 2003). China has been a major producer oftechnical DDT and dicofol, with>85 % of the global tech-nical DDT production occurring here, which amounted to∼97 000 t between 1988 and 2002. Over half of this amount(∼54 000 t) was used to manufacture dicofol (∼40 000 t),which contains average DDT impurities of 244±73 g kg−1
Atmos. Chem. Phys., 12, 4033–4044, 2012 www.atmos-chem-phys.net/12/4033/2012/

S. Becker et al.: Decline of organochlorine pesticides in the Arctic atmosphere 4039
Figure 3: Measured data and model fit for p,p’-DDT (A); o,p’-DDT (B); p,p’-DDE (C); o,p’-DDE (D); p,p’-DDD (E) and o,p’-DDD (F). Goodness of fit is provided in each case by the r2 value (p<0.05).
1994 1996 1998 2000 2002 2004 2006-2.5
-2
-1.5
-1
-0.5
0
0.5Model plot: pp-DDT R2=0.89783
log p
g/m
3
model
data
model uncertainty
1994 1996 1998 2000 2002 2004 2006-2.5
-2
-1.5
-1
-0.5
0
0.5Model plot: op-DDT R2=0.8957
log p
g/m
3
model
data
model uncertainty
p,p’-DDT
A
o,p’-DDT
B
r2 = 0.90
r2 = 0.90
model uncertainty
model
data
1994 1996 1998 2000 2002 2004 2006-2
-1.5
-1
-0.5
0
0.5
1Model plot: pp-DDE R2=0.89355
log p
g/m
3
model
data
model uncertainty
1994 1996 1998 2000 2002 2004-2
-1.5
-1
-0.5
0
0.5
1Model plot: op-DDE R2=0.91954
log p
g/m
3
model uncertainty
model
data
p,p’-DDE
r2 = 0.90
C
o,p’-DDE
r2 = 0.92
D
1994 1996 1998 2000 2002 2004 2006-2
-1.5
-1
-0.5
0
0.5
1Model plot: pp-DDE R2=0.89355
log p
g/m
3
model
data
model uncertainty
1994 1996 1998 2000 2002 2004-2
-1.5
-1
-0.5
0
0.5
1Model plot: op-DDE R2=0.91954
log p
g/m
3
model uncertainty
model
data
p,p’-DDE
r2 = 0.90
C
o,p’-DDE
r2 = 0.92
D
1994 1996 1998 2000 2002 2004 2006-2.5
-2
-1.5
-1
-0.5
0
0.5Model plot: pp-DDD R2=0.77921
log p
g/m
3
model uncertainty
model
data
1994 1996 1998 2000 2002 2004 2006-2.5
-2
-1.5
-1
-0.5
0
0.5Model plot: op-DDD R2=0.82687
log p
g/m
3
model uncertainty
model
data
r2 = 0.78
p,p’-DDD
E
r2 = 0.83
o,p’-DDD F
1994 1996 1998 2000 2002 2004 2006-2.5
-2
-1.5
-1
-0.5
0
0.5Model plot: pp-DDD R2=0.77921
log p
g/m
3model uncertainty
model
data
1994 1996 1998 2000 2002 2004 2006-2.5
-2
-1.5
-1
-0.5
0
0.5Model plot: op-DDD R2=0.82687
log p
g/m
3
model uncertainty
model
data
r2 = 0.78
p,p’-DDD
E
r2 = 0.83
o,p’-DDD F
Fig. 3. Measured data and model fit forp,p′-DDT (A); o,p′-DDT (B); p,p′-DDE (C); o,p′-DDE (D);p,p′-DDD (E) ando,p′-DDD (F).Goodness of fit is provided in each case by ther2 value (p <0.05).
www.atmos-chem-phys.net/12/4033/2012/ Atmos. Chem. Phys., 12, 4033–4044, 2012
4040 S. Becker et al.: Decline of organochlorine pesticides in the Arctic atmosphere
Figure 4: Ratios of DDT/DDE+DDD (A) to illustrate the age of the DDT signal, and
o,p’-DDT/p,p’-DDT (B) to indicate whether sources are from Dicofol or Technical-DDT
DDT/DDE+DDD ratios
0.00
0.50
1.00
1.50
2.00
2.50
3.00
3.50
4.00
Jan-94 May-95 Sep-96 Feb-98 Jun-99 Nov-00 Mar-02 Aug-03 Dec-04
Date
Ratio
Ratios of o,p'-DDT/p,p'-DDT
0.00
1.00
2.00
3.00
4.00
5.00
6.00
7.00
8.00
9.00
10.00
Jan-94 Jan-95 Jan-96 Dec-96 Dec-97 Dec-98 Dec-99 Dec-00 Dec-01 Dec-02 Dec-03 Dec-04 Dec-05
Date
Ratio
A
B
Fig. 4.Ratios of DDT/DDE+DDD(A) to illustrate the age of the DDT signal, ando,p′-DDT/p,p′-DDT (B) to indicate whether sources arefrom Dicofol or Technical-DDT.
dicofol (Qiu et al., 2005). This quantity of impurity is muchgreater than any reported by other countries producing thischemical (India, Brazil, Spain and Israel), although informa-tion is not always readily available (van de Plassche et al.2003). The predominant DDT impurity found in dicofol iso,p′-DDT (114±45 g kg−1 dicofol), followed byp,p′-Cl-DDT (69±40 g kg−1 dicofol). A recent study conducted inthe Central Himalayas, China, found that DDT was presentin ice cores for the period 1990–2005, whereas DDE was notfound (Wang et al., 2008). The authors conclude that therehas been on-going use of Technical DDT in India after the
ban was put in place. It could, however, also be from acci-dental release during the production of dicofol.
Hexachlorobenzene (HCB)– Concentrations of HCB mea-sured at Zeppelin in the spring of 1992, and March-December 1993 ranged from 121–372 pg m−3, and 23–312 pg m−3, respectively (Oehme et al., 1995, 1996). Theconcentrations observed in 1992 are similar to those re-ported in 1984 (Oehme et al., 1995), which would reflectthe on-going production and use of this chemical during thisperiod (Bailey, 2001). Spatial variability across the Arcticis slight with the annual means at Zeppelin comparable to
Atmos. Chem. Phys., 12, 4033–4044, 2012 www.atmos-chem-phys.net/12/4033/2012/

S. Becker et al.: Decline of organochlorine pesticides in the Arctic atmosphere 4041
Figure 5: Seasonally adjusted data and underlying trends for p,p’-DDT (A); o,p’-DDT (B); p,p’-DDE (C); o,p’-DDE (D); p,p’-DDD (E) and o,p’-DDD (F). (o,p’-DDE plot excludes 2004-2005 data)
1994 1996 1998 2000 2002 2004 2006-2
-1.5
-1
-0.5
0
0.5pp-DDT
log p
g/m
3
trend
seas.adj.data
trend uncertainty (3*s.e.)
trend uncertainty (s.e.)
1994 1996 1998 2000 2002 2004 2006-2
-1.5
-1
-0.5
0
0.5op-DDT
log p
g/m
3
trend
seas.adj.data
trend uncertainty (3*s.e.)
trend uncertainty (s.e.)
o,p’-DDT
A p,p’-DDT
B
trend uncertainty (3*s.e.)
trend uncertainty (s.e.)
trend
seas.adj.data
1994 1996 1998 2000 2002 2004 2006
-1.5
-1
-0.5
0
0.5
pp-DDE
log p
g/m
3
trend
seas.adj.data
trend uncertainty (3*s.e.)
trend uncertainty (s.e.)
1994 1996 1998 2000 2002 2004
-1.5
-1
-0.5
0
0.5
op-DDE
log p
g/m
3
trend uncertainty (3*s.e.)
trend uncertainty (s.e.)
trend
seas.adj.data
p,p’-DDE
C
o,p’-DDE
D
1994 1996 1998 2000 2002 2004 2006
-1.5
-1
-0.5
0
0.5
pp-DDE
log p
g/m
3
trend
seas.adj.data
trend uncertainty (3*s.e.)
trend uncertainty (s.e.)
1994 1996 1998 2000 2002 2004
-1.5
-1
-0.5
0
0.5
op-DDE
log p
g/m
3trend uncertainty (3*s.e.)
trend uncertainty (s.e.)
trend
seas.adj.data
p,p’-DDE
C
o,p’-DDE
D
1994 1996 1998 2000 2002 2004 2006-2
-1.8
-1.6
-1.4
-1.2
-1
-0.8
-0.6
-0.4
pp-DDD
log p
g/m
3
trend uncertainty (3*s.e.)
trend uncertainty (s.e.)
trend
seas.adj.data
1994 1996 1998 2000 2002 2004 2006-2
-1.8
-1.6
-1.4
-1.2
-1
-0.8
-0.6
-0.4
op-DDD
log p
g/m
3
trend uncertainty (3*s.e.)
trend uncertainty (s.e.)
trend
seas.adj.data
p,p’-DDD
E
o,p’-DDD
F
1994 1996 1998 2000 2002 2004 2006-2
-1.8
-1.6
-1.4
-1.2
-1
-0.8
-0.6
-0.4
pp-DDD
log p
g/m
3
trend uncertainty (3*s.e.)
trend uncertainty (s.e.)
trend
seas.adj.data
1994 1996 1998 2000 2002 2004 2006-2
-1.8
-1.6
-1.4
-1.2
-1
-0.8
-0.6
-0.4
op-DDD
log p
g/m
3
trend uncertainty (3*s.e.)
trend uncertainty (s.e.)
trend
seas.adj.data
p,p’-DDD
E
o,p’-DDD
F
Fig. 5. Seasonally adjusted data and underlying trends forp,p′-DDT (A); o,p′-DDT (B); p,p′-DDE (C); o,p′-DDE (D);p,p′-DDD (E)ando,p′-DDD (F). (o,p′-DDE plot excludes 2004–2005 data).
www.atmos-chem-phys.net/12/4033/2012/ Atmos. Chem. Phys., 12, 4033–4044, 2012

4042 S. Becker et al.: Decline of organochlorine pesticides in the Arctic atmosphere
Figure 6: Seasonally adjusted data and underlying trend for HCB
1994 1996 1998 2000 2002 2004 2006
1.2
1.4
1.6
1.8
2
2.2
HCB
log p
g/m
3
trend uncertainty (3*s.e.)
trend uncertainty (s.e.)
trend
seas.adj.data
Fig. 6.Seasonally adjusted data and underlying trend for HCB.
those measured at Alert, although several spurious values(>500 pg m−3) were measured at Zeppelin during October1997. A passive sampling campaign carried out from August2000 to August 2001 at Zeppelin by Shen et al. (2005) re-ported a concentration of 71 pg m−3, which is akin to the an-nual averages at Zeppelin for these years. HCB is relativelyvolatile compared to the other OC pesticides examined in thisstudy and breakthrough of this chemical through the sam-pling media is a significant problem, which may lead to anunderestimation of the true atmospheric concentration, par-ticularly during the warmer summer months (e.g. Halsall etal., 1998). Breakthrough of HCB in the sampling media av-eraged 27 % of all air samples taken at Alert (Hung et al.,2005), with a similar range of 20–30 % reported at Zeppelin(Oehme et al., 1995). Meaningful seasonal patterns could notbe distinguished by DHR and therefore, only the longer termtrend is discussed here.
An investigation into long-term trends at Zeppelin re-vealed a 47 % reduction over the period from 1994–2002(Berg et al., 2004). This is in close agreement with the re-duction seen in this study over the same time period, (46 %reduction in arithmetic annual means, 1994–2002). Figure 6displays the underlying trend for HCB at Zeppelin usingDHR. Interestingly, after an initial decrease, there is an ap-parent upturn in concentrations for the last three years of thetime-series (2003–2005). At present it is unclear why thischange in pattern occurs. Re-volatilisation or re-cycling ofHCB between environmental compartments would result ina slowing of any decline (like the other OCs) following use-reduction of this chemical, but is unlikely to cause an in-crease in air concentrations. Although no information on po-tential sources from developing countries has been available,recent investigations into these compounds have found re-volatilisation from previously contaminated soils and vege-tation to be a significant influence on atmospheric concentra-
tions (Bailey, 2001; Barber et al., 2005). However, it is possi-ble that the trend observed here simply reflects a ‘bottoming-out’ of the year-on-year decrease observed throughout the1990s and early 2000s, although a continuation of the time-series will be needed to confirm this. Unlike the isomersof hexachlorocyclohexane (HCH) reported by Becker etal. (2008) from the same database, there was no relationshipobserved between HCB concentrations and either the +ve or−ve phases of the North Atlantic or Arctic Oscillations. HCBhas been shown to be undergoing net deposition to the Arc-tic Ocean for the period 2000–2003 (Su et al., 2006). Sincesurface ocean water surrounding Svalbard is largely ice-freefor most of the year, then the “upturn” in the atmospherictrend evident in the last few years of the Zeppelin dataset,may simply reflect equilibrium between air and marine sur-faces. The recent increase in ice-free months in the oceansurrounding Svalbard due to changes in climate (Kallenbornet al., 2007), could affect the environmental cycling of chem-icals such as HCB, and a further decline in air concentrationsmay only be realised by many more years of sampling. Sincea switch from net deposition to net volatilisation alone maynot explain the increase in HCB concentrations, it is plau-sible that the presence of HCB in currently used pesticidesas an impurity is also having an impact. The fungicides,chlorothalonil and quintozene, and the arachnicide, tetradi-fon, have been shown to contain HCB as impurities (Gouinet al., 2008). In the UK, for example, the use of tetradifonhas declined over the last decade, whereas chlorothalonil onthe other hand, has been applied much more widely over the2004–2006 period. According to the pesticide usage statis-tics database (http://pusstats.csl.gov.uk/), the total mass ap-plied of chlorothalonil (in Great Britain) was estimated to be∼500 t in 2003, compared to∼1500 t in 2006, a 3-fold in-crease. If similar increases in use are apparent in other Euro-pean countries, then this could provide a significant sourceof “new” HCB to the environment. The quantity of HCBcontained within chlorothalonil ranges from 0.1–0.3 g kg−1
(EPA, 2008). Furthermore, Gouin et al. (2008) found thatlevels of HCB in air measured in a central valley in CostaRica were from the historical use of HCB and the ongoinguse of fungicides such as chlorothalonil which is applied inbanana plantations (Chaves et al., 2007).
4 Conclusions
An examination of arithmetic means of the OC pesticidesmeasured in the Norwegian Arctic over the period 1994–2005, reveals a slight decline in concentrations, which isin agreement with the long-term datasets from Alert in theCanadian Arctic. The long-term trends, however, show thatthe rate of decline in concentrations is slow, probably re-flecting ongoing re-emission of these compounds from soiland other secondary sources. Dicofol used in Asia, SouthAmerica, and southern Europe, together with on-going use of
Atmos. Chem. Phys., 12, 4033–4044, 2012 www.atmos-chem-phys.net/12/4033/2012/
S. Becker et al.: Decline of organochlorine pesticides in the Arctic atmosphere 4043
Technical DDT, may also be hindering the decline of some ofthe DDTs particularlyp,p′-DDE, although further evidenceis needed to support this. The trends observed for chlordaneisomers imply that sources affecting the Arctic are now sec-ondary in nature. On the other hand, the initial decline inHCB concentrations over the 1990s and early 2000s is off-set by an increasing trend from 2003 onwards. The increaseduse of chlorothalonil and continued use of other pesticidescontaining HCB as an impurity, combined with environmen-tal factors that affect secondary “reservoirs”, such as the re-duction in sea-ice cover, could be influencing contemporarylevels of this chemical in the Arctic atmosphere.
DHR, in combination with these datasets, is proving to bea highly valuable tool for identifying long-term trends in con-taminant data in the remote Arctic atmosphere.
Acknowledgements.SB was funded under NERC studentshipNER/S/A/2004/12159. The authors would like to thank HayleyHung of Environment Canada and Peter Coleman of NETCEN,UK for useful discussions.
Edited by: J. W. Bottenheim and T. Bond
References
AMAP, Arctic Monitoring and Assessment Programme: Arctic Pol-lution 2002: Persistent Organic Pollutants, Heavy Metals, Ra-dioactivity, Human Health, Changing Pathways, AMAP, Oslo,Norway, 2002.
Bailey, R., Barrie, L. A., Halsall, C. J., Fellin, P., and Muir, D. C.G.L Atmospheric organochlorine pesticides in the western Cana-dian Arctic: Evidence of transpacific transport, J. Geophys. Res.,105, 11805–11811, 2000.
Bailey, R. E.: Global hexachlorobenzene emissions, Chemosphere,43, 167–182, 2001.
Barber, J. L., Sweetman, A. J., van Wijk, D., and Jones, K. C.:Hexachlorobenzene in the global environment: Emissions, lev-els, distribution, trends and processes, Sci. Total Environ., 349,1–44, 2005.
Becker, S., Halsall, C. J., Tych, W., Hung, H., Attewell, S., Blan-chard P., Li, H., Fellin, P., Stern, G., Billeck, B., and Friesen, S.:Resolving the long-term trends of polycyclic aromatic hydrocar-bons in the Canadian Arctic Atmosphere, Environ. Sci. Technol.,40, 3217–3222, 2006.
Becker, S., Halsall, C. J., Tych, W., Kallenborn, R., Su, Y., andHung, H.: Long-term trends in atmospheric concentrations ofα-andγ -HCH in the Arctic provide insight into the effects of leg-islation and climatic fluctuations on contaminant levels, Atmos.Environ., 42, 8225–8233, 2008.
Berg, T., Kallenborn, R., and Stein, M.: Temporal trends in atmo-spheric heavy metal and organochlorine concentrations at Zep-pelin, Svalbard. Arctic, Antarct. Alp. Res., 36, 284–291, 2004.
Bidleman, T. F., Widekvist, U., Jansson, B., and Soderlund, R.:Organochlorine pesticides and PCBs in the atmosphere of South-ern Sweden, Atmos. Environ. 21, 641–654, 1987.
Bidleman, T. F., Jantunen, L. M. M., Helm, P. A., Brorstrom-Lunden, E., and Juntto, S.: Chlordane Enantiomers and Temporal
Trends of Chlordane Isomers in Arctic Air, Environ. Sci. Tech-nol., 36, 539–544, 2002.
Bidleman, T. F., Wong, F., Backe, C., Sodergren, A., Brorstrom-Lunden, E., Helm, P. A., and Stern, G. A.: Chiral signatures ofchlordanes indicate changing sources to the atmosphere over thepast 30 years. Atmos. Environ., 38, 5963–5970, 2004.
Bidleman, T. F. and Leone, A. D.: Soil-air exchange of organochlo-rine pesticides in the Southern United States, Environ. Pollut.,128, 49–57, 2004.
Chaves, A., Shea, D., and Cope, W. G.: Environmental fate ofchlorothalonil in a Costa Rican banana plantation, Chemosphere,69, 1166–1174, 2007.
Connor, M. S., Davis, J. A., Leatherbarrow, J., Greenfield, B. K.,Gunther, A., Hardin, D., Murnley, T., Oram, J. J., and Werme,C.: The slow recovery of San Francisco Bay from the legacy oforganochlorine pesticides, Environ. Res., 105, 87–100, 2006.
Dougherty, C. P., Holtz, S. H., Reinert, J. C., Panyacosit, L., Axel-rad, D. A. and Woodruff, T. J.: Dietary exposures to food con-taminants across the United States. Environmental Research A84, 170–185, 2000.
Eckhardt, S., Breivik, K., Manø, S., and Stohl, A.: Record highpeaks in PCB concentrations in the Arctic atmosphere dueto long-range transport of biomass burning emissions, At-mos. Chem. Phys., 7, 4527–4536,doi:10.5194/acp-7-4527-2007,2007.
Gouin, T., Wania, F., Ruepert, C., and Castillo, L. E.: Field testingpassive air samplers for current use pesticides in a tropical envi-ronment, Environ. Sci. Technol., 42, 6625–6630, 2008.
Halsall, C. J., Bailey, R., Stern, G. A., Barrie, L. A., Fellin, P., Muir,D. G. C., Rosenberg, B., Rovinsky, F. Ya., Kononov, E. Ya., andPastukhov, B.: Multi-year observations of organohalogen pes-ticides in the Arctic atmosphere, Environ. Pollut., 102, 51–62,1998.
Hung, H., Halsall, C. J., Blanchard, P., Li, H. H., Fellin, P., Stern, G.,and Rosenberg, B.: Temporal trends of organochlorine pesticidesin the Canadian Arctic Atmosphere, Environ. Sci. Technol. 36,862–868, 2002.
Hung, H., Blanchard, P., Halsall, C. J., Bidleman, T. F., Stern, G. A.,Fellin, P., Muir, D. G. C., Barrie, L. A., Jantunen, L. M., Helm, P.A., Ma, J., and Konoplev, A.: Temporal and spatial variabilities ofatmospheric polychlorinated biphenyls (PCBs), organochlorine(OC) pesticides and polycyclic aromatic hydrocarbons (PAHs) inthe Canadian Arctic: Results from a decade of monitoring. Sci.Total Environ., 342, 119–144, 2005.
Jantunen, L. M. M., Bidleman, T. F., Harner, T., and Parkhurst, W.J.: Toxaphene, Chlordane, and other organochlorine pesticides inAlabama air, Environ. Sci. Technol., 34, 5097–5105, 2000.
Kallenborn, R., Christensen, G., Evenset, A., Schlabach, M., andStohl, A.: Atmospheric transport of persistent organic pollutants(POPs) to Bjørnøya (Bear island), J. Environ. Monitor., 9, 1082–1091, 2007.
Kawano, M., Inoue, T., Wada, T., Hidaka, H., and Tatsukawa, R.:Bioconcentration and residue patterns of chlordane compoundsin marine animals: invertebrates, fish, mammals and seabirds,Environ. Sci. Technol., 22, 792–797, 1988.
Li, J., Zhang, G., Qi, S., Li, X., and Peng, X.: Concentrations, enan-tiomeric compositions and sources of HCH, DDT and chlordanein soils from the Pearl River Delta, South China. Sci. Total Env-iron., 372, 215–224, 2006.
www.atmos-chem-phys.net/12/4033/2012/ Atmos. Chem. Phys., 12, 4033–4044, 2012

4044 S. Becker et al.: Decline of organochlorine pesticides in the Arctic atmosphere
Li, J., Zhang, G., Guo, L., Xu, W., Li, W., Lee, C. S. L., Ding, A.,and Wang, T.: Organochlorine pesticides in the atmosphere ofGuangzhou and Hong Kong: Regional sources and long-rangeatmospheric transport, Atmos. Environ., 41, 3889–3903, 2007.
Oehme, M.: Further evidence for long range air transport of poly-chlorinated aromatics and pesticides from North America andEurasia to the Arctic, Ambio, 20, 293–297, 1991.
Oehme, M., Haugen, J.-E., and Schlabach, M.: Ambient air levels ofpersistent organochlorines in spring 1992 at Spitsbergen and theNorwegian mainland: comparison with 1984 results and qualitycontrol measures, Sci. Total Environ., 160–161, 139–152, 1995.
Oehme, M., Haugen, J.-E., and Schlabach, M.: Seasonal Changesand Relations between Levels of Organochlorines in Arctic Am-bient Air: First Results of an All-Year-Round Monitoring Pro-gram at Ny-Alesund, Svalbard, Norway, Environ. Sci. Technol.30, 2294–2304, 1996.
PAN (Pesticide Action Network). Active Ingredient Fact Sheets: Di-cofol. http://www.pan-uk.org/pestnews/Actives/dicofol.htm, lastaccess: April 2012.
Patton, G. W., Walla, M. D., Bidleman, T. F., and Barrie, L. A.:Polycyclic Aromatic and Organochlorine Compounds in the At-mosphere of Northern Ellesmere Island, Canada, J. Geophys.Res., 96, 10867–10877, 1991.
Pesticide Usage Survey (PUS). The Food & Environment ResearchAgency, UK (formerly the Central Science Laboratory, CSL),http://pusstats.csl.gov.uk, last access: April 2012.
Qiu, X., Zhu, T., Yao, B., Hu, J., and Hu, S.: Contribution of Dicofolto the current DDT pollution in China, Environ. Sci. Technol. 39,4385–4390, 2005.
Shen, L., Wania, F., Lei, Y. D., Teixeira, C., Muir, D. C. G.,and Bidleman, T. F.: Atmospheric Distribution and Long-RangeTransport Behaviour of organochlorine pesticides in NorthAmerica, Environ. Sci. Technol. 39, 409–420, 2005.
Shigenaka, G.: Chlordane in the marine environment of the UnitedStates: review and results from the National Status and TrendsProgramme. Technical Memorandum NOS OMA 55, NOAA,Seattle, WA, USA, 1990.
Su, Y., Hung, H., Blanchard, P., Patton, G. W., Kallenborn, R.,Konoplev, A., Fellin, P., Li, H., Geen, C., Stern, G., Rosenberg,B., and Barrie, L. A.: Spatial and seasonal variations of hex-achlorocyclohexanes (HCHs) and Hexachlorobenzene (HCB) inthe Arctic Atmosphere, Environ. Sci. Technol. 40, 6601–6607,2006.
Su, Y., Hung, H., Blanchard, P., Patton, G. W., Kallenborn, R.,Konoplev, A., Fellin, P., Li, H., Geen, C., Stern, G., Rosen-berg, G., and Barrie, L. A.: A circumpolar perspective ofatmospheric organochlorine pesticides (OCPs): Results fromsix arctic monitoring stations in 2000–2003. Atmos. Environ.,doi:10.1016/j.atmosenv.2008.01.054, 2008.
Tych, W., Pedegral, D. J., Young, P. C. and Davies, J.: An unob-served component model for multi-rate forecasting of telephonecall demand: the design of a forecasting support system, Int. J.Forecast., 18, 673–695, 2002.
UNECE Protocol to the 1979 convention on long range transbound-ary air pollution on persistent organic pollutants and executivebody decision 1998/2 on information to be submitted and theprocedure for adding substances to annex I, II or III to the pro-tocol on persistent organic pollutants, ECE/EB.AIR/60, UnitedNations, New York and Geneva, 1998.
US EPA: Office for Prevention, Pesticides & Toxic Sub-stances (OPPTS), Re-registration Eligibility Decision (RED):Chlorothalonil, http://www.epa.gov/oppsrrd1/REDs/0097red.pdf, last accessed: April 2012.
Van de Plassche, E. J., Schwegler, M., Rasenberg, M.,and Schouten, G.: DDT in Dicofol, UN-ECE report,http://www.unece.org/fileadmin/DAM/env/lrtap/TaskForce/popsxg/2000-2003/ddtin dicofol.pdf, Accessed: April 2012,2003.
Van Oostdam, J., Donaldson, S. G., Feeley, M., Arnold, D., Ayotte,P., Bondy, G., Chan, L., Dewailly,E., Furgal, C. M., Kuhnlein,H., Loring, E., Muckle, G., Myles, E., Receveur, O., Tracy, B.,Gill, U., and Kalhok, S.: Human health implications of environ-mental contaminants in Arctic Canada: A review. Sci. Total En-viron., 351–352, 165–246, 2005.
Wang, X. P., Xu, B. Q., Kang, S. C., Cong, Z. Y., and Yao, T. D.:The historical residue trends of DDT, Hexachlorocyclohexanesand polycyclic aromatic hydrocarbons in an ice core from Mt.Everest, central Himalayas, China, Atmos. Environ., 42, 6699–6709, 2008.
Young, P., Pedegral, D. J., and Tych, W.: Dynamic Harmonic Re-gression, J. Forecast., 18, 369–394, 1999.
Young, P. C.: Nonstationary time series analysis and forecasting,Prog. Environ. Sci., 1, 3–48, 1999.
Xu, D., Deng, L., Chai, Z., and Mao, X.: Organohalogenated com-pounds in pine needles from Beijing City, China. Chemosphere,57, 1343–1353, 2004.
Yang, X., Wang, S., Bian, Y., Chen, F., Yu, G., Gu, C., and Jiang,X.: Dicofol application resulted in high DDTs residue in cottonfields from northern Jiangsu province, China, J. Haz. Mat., 150,92-98, 2007.
Zhang, G., Parker, A., House, A., Mai, B., Li, X., Kang, Y., andWang, Z. Sedimentary records of DDT and HCH in the PearlRiver Delta, South China, Environ. Sci. Technol., 36, 3671–3677,2002.
Atmos. Chem. Phys., 12, 4033–4044, 2012 www.atmos-chem-phys.net/12/4033/2012/