changing rehabilitation through audit - home - centre · pdf filechanging rehabilitation...
TRANSCRIPT

Changing Rehabilitation through Audit
Specialist Rehabilitation following Major Trauma –
a National Clinical AuditThe Health Quality Improvement Partnership
Prof Lynne Turner-Stokes, on behalf of:
UK Rehabilitation Outcomes Collaborative (UKROC)
Trauma Audit and Research Network (TARN)
Cicely Saunders Institute, Kings College London
The London North West HospitalsNHS Trust

Trauma networks
2010 – Department of Health
– Major Trauma networks
Framework for coordinated trauma care
Key components
– Major Trauma Centres (MTCs)
– Trauma Units
Something missing ???
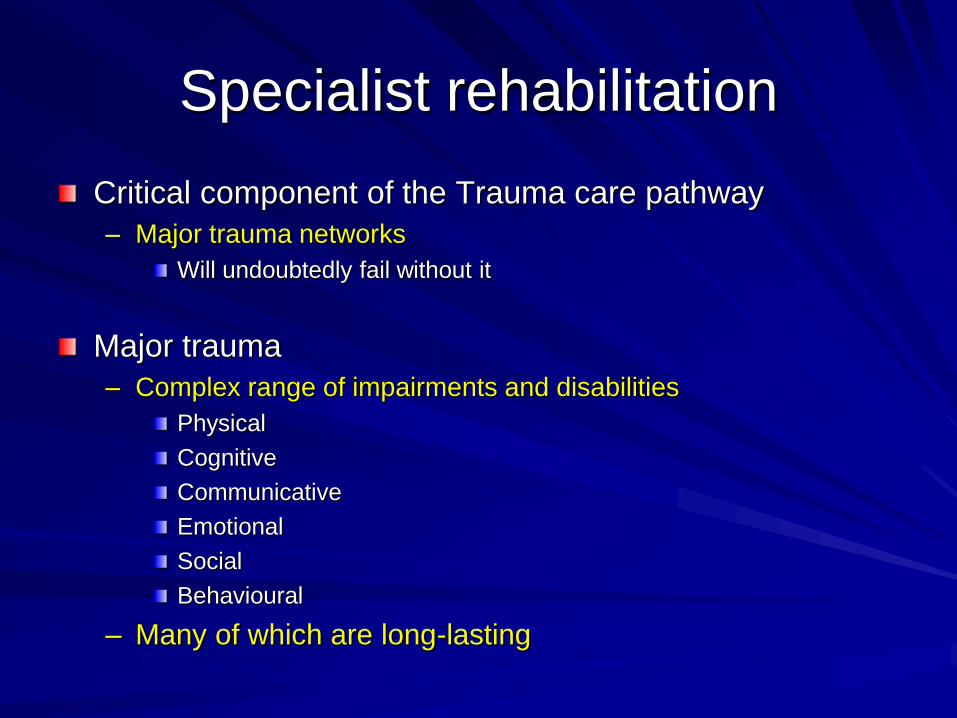
Specialist rehabilitation
Critical component of the Trauma care pathway
– Major trauma networks
Will undoubtedly fail without it
Major trauma
– Complex range of impairments and disabilities
Physical
Cognitive
Communicative
Emotional
Social
Behavioural
– Many of which are long-lasting
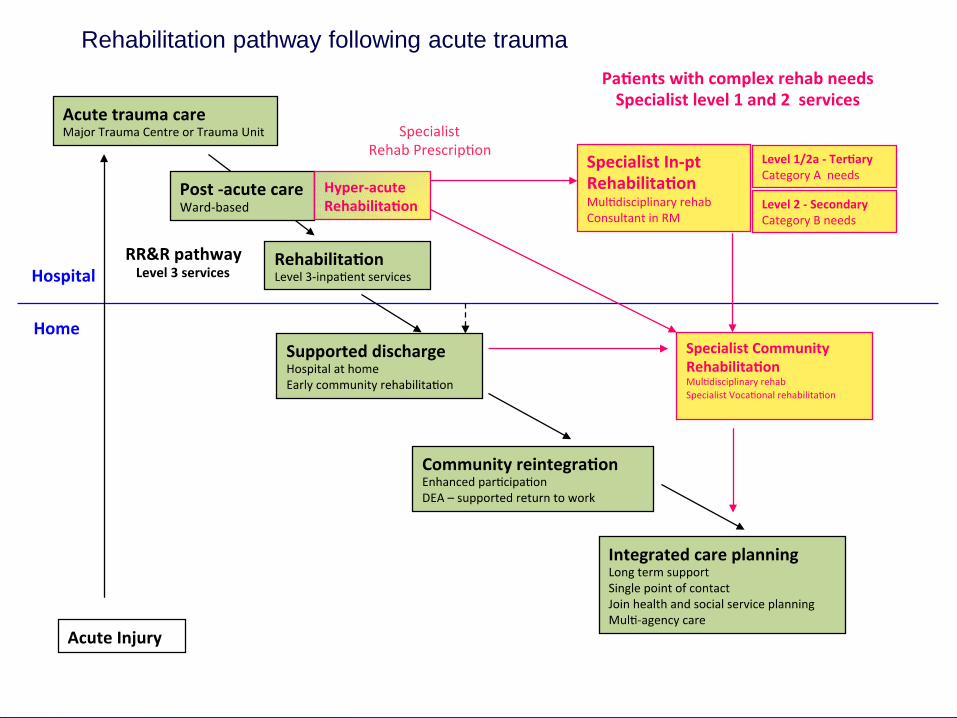
Rehabilitation pathwayRehabilitation pathway following acute trauma
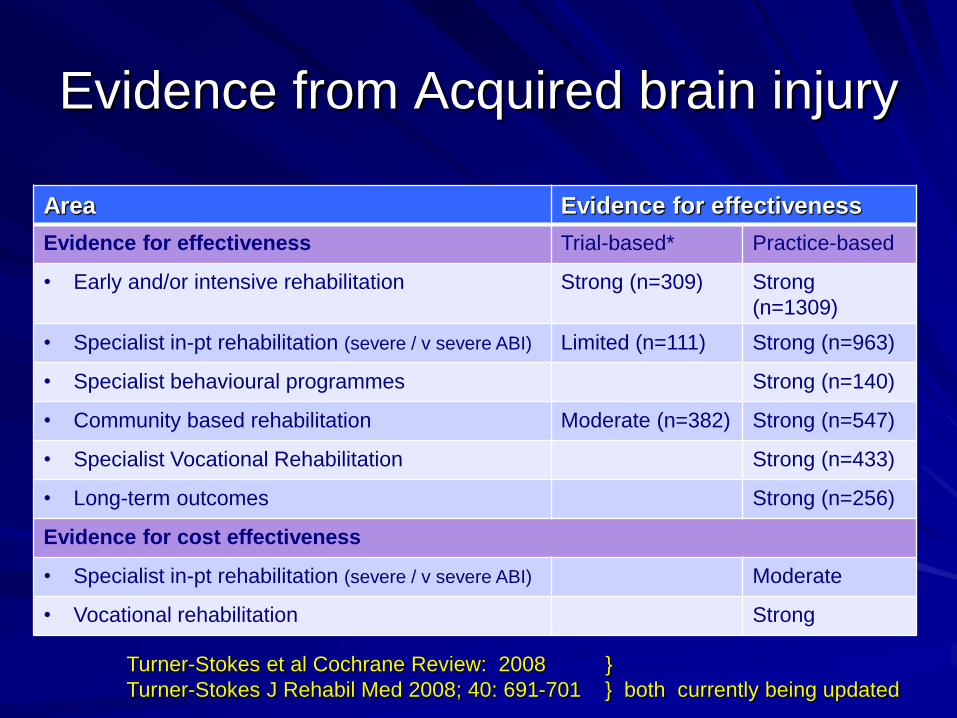
Evidence from Acquired brain injury
Area Evidence for effectiveness
Evidence for effectiveness Trial-based* Practice-based
• Early and/or intensive rehabilitation Strong (n=309) Strong
(n=1309)
• Specialist in-pt rehabilitation (severe / v severe ABI) Limited (n=111) Strong (n=963)
• Specialist behavioural programmes Strong (n=140)
• Community based rehabilitation Moderate (n=382) Strong (n=547)
• Specialist Vocational Rehabilitation Strong (n=433)
• Long-term outcomes Strong (n=256)
Evidence for cost effectiveness
• Specialist in-pt rehabilitation (severe / v severe ABI) Moderate
• Vocational rehabilitation Strong
Turner-Stokes et al Cochrane Review: 2008 }
Turner-Stokes J Rehabil Med 2008; 40: 691-701 } both currently being updated
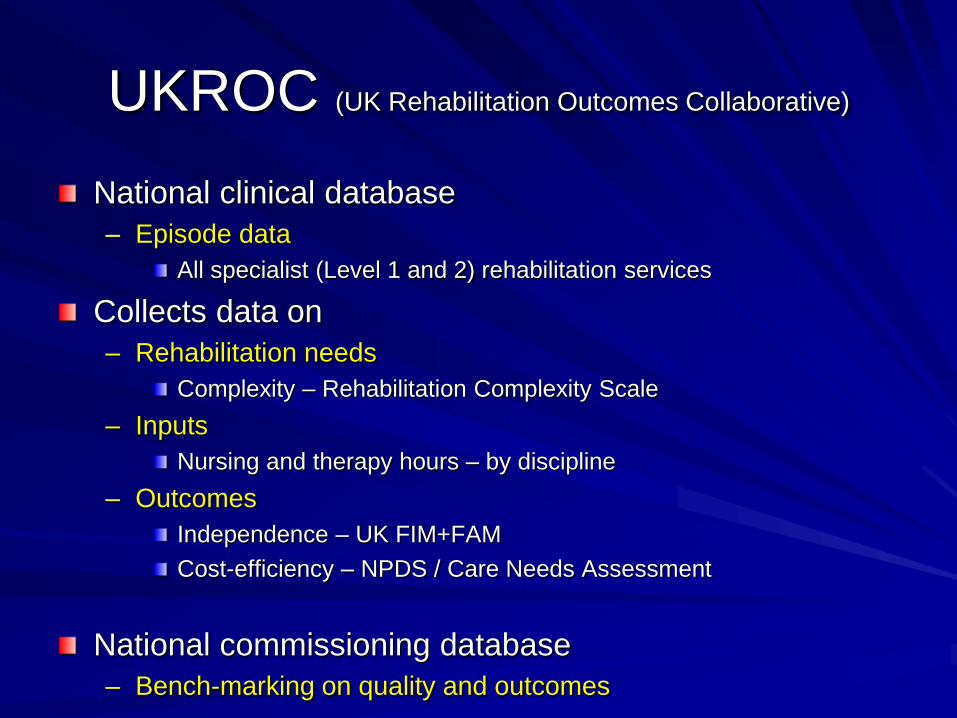
UKROC (UK Rehabilitation Outcomes Collaborative)
National clinical database
– Episode data
All specialist (Level 1 and 2) rehabilitation services
Collects data on
– Rehabilitation needs
Complexity – Rehabilitation Complexity Scale
– Inputs
Nursing and therapy hours – by discipline
– Outcomes
Independence – UK FIM+FAM
Cost-efficiency – NPDS / Care Needs Assessment
National commissioning database
– Bench-marking on quality and outcomes

Analysis
Dataset 2010-2014 – 5 years
– Total 11,428 episodes
– Trauma 1663 episodes
87% traumatic brain injury
12% spinal cord injury
1% other
– Mean age 45.4 years
– Mean length of stay 91 days
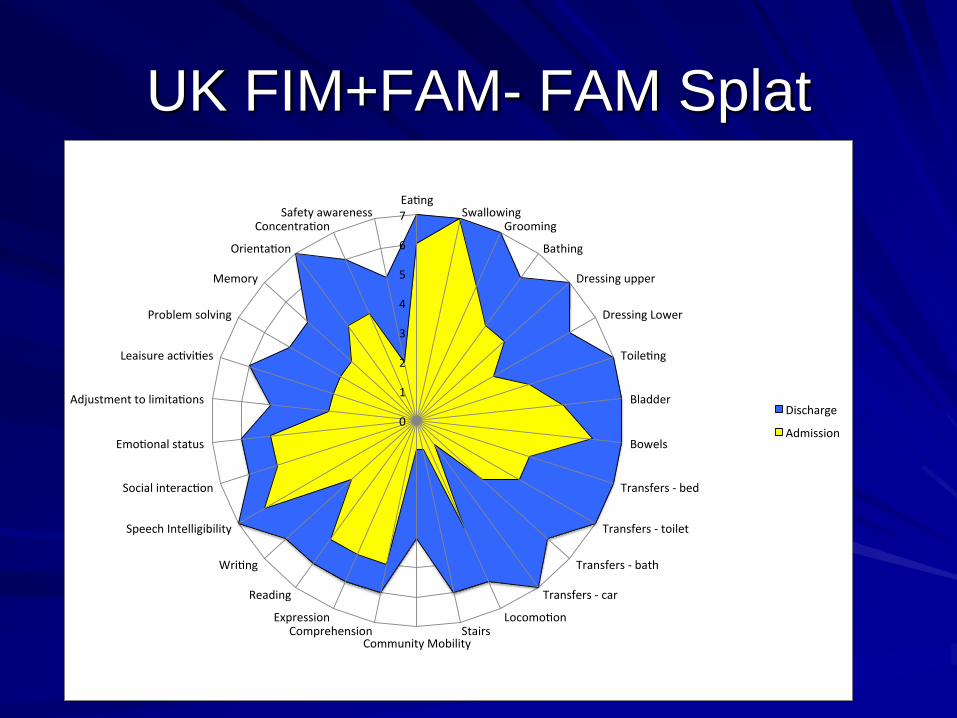
UK FIM+FAM- FAM Splat
0
1
2
3
4
5
6
7Ea ng
SwallowingGrooming
Bathing
Dressingupper
DressingLower
Toile ng
Bladder
Bowels
Transfers-bed
Transfers-toilet
Transfers-bath
Transfers-car
Locomo onStairs
CommunityMobilityComprehension
Expression
Reading
Wri ng
SpeechIntelligibility
Socialinterac on
Emo onalstatus
Adjustmenttolimita ons
Leaisureac vi es
Problemsolving
Memory
Orienta on
Concentra onSafetyawareness
Discharge
Admission
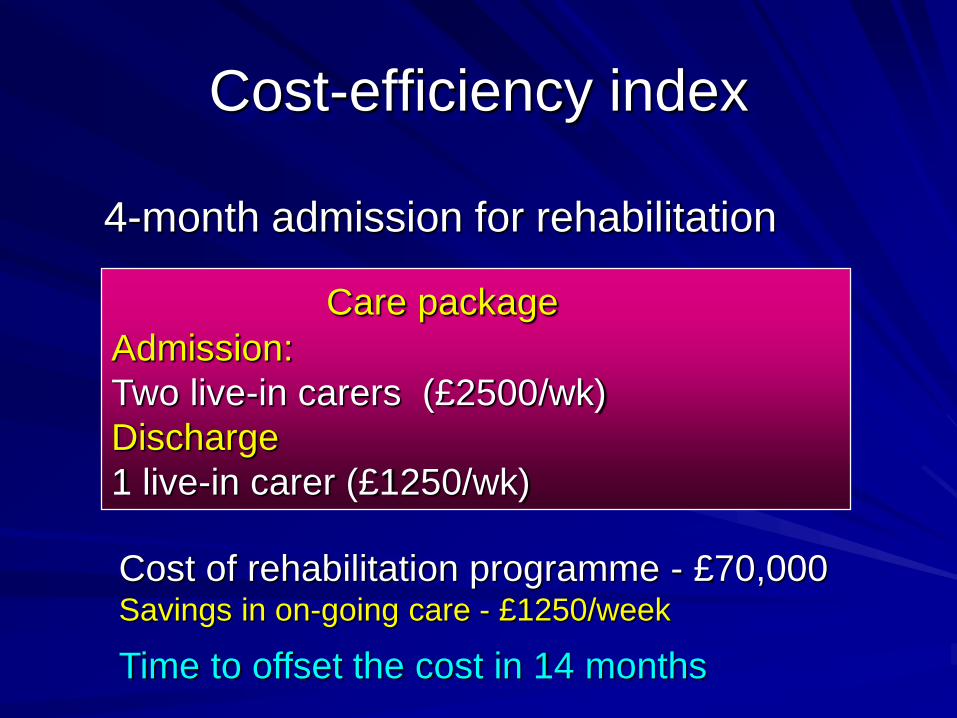
Cost-efficiency index
Care package
Admission:
Two live-in carers (£2500/wk)
Discharge
1 live-in carer (£1250/wk)
Cost of rehabilitation programme - £70,000Savings in on-going care - £1250/week
Time to offset the cost in 14 months
4-month admission for rehabilitation

Cost efficiency
Parameter Mean
Cost of treatment
Length of stay 91 days
Cost per day £425
Episode costs £38,311
Subset n=809 – reported NPCNA
Mean reduction in
care costs
£527
per week
Cost efficiency index 5.8
Time to offset cost of
rehabilitation
18 months
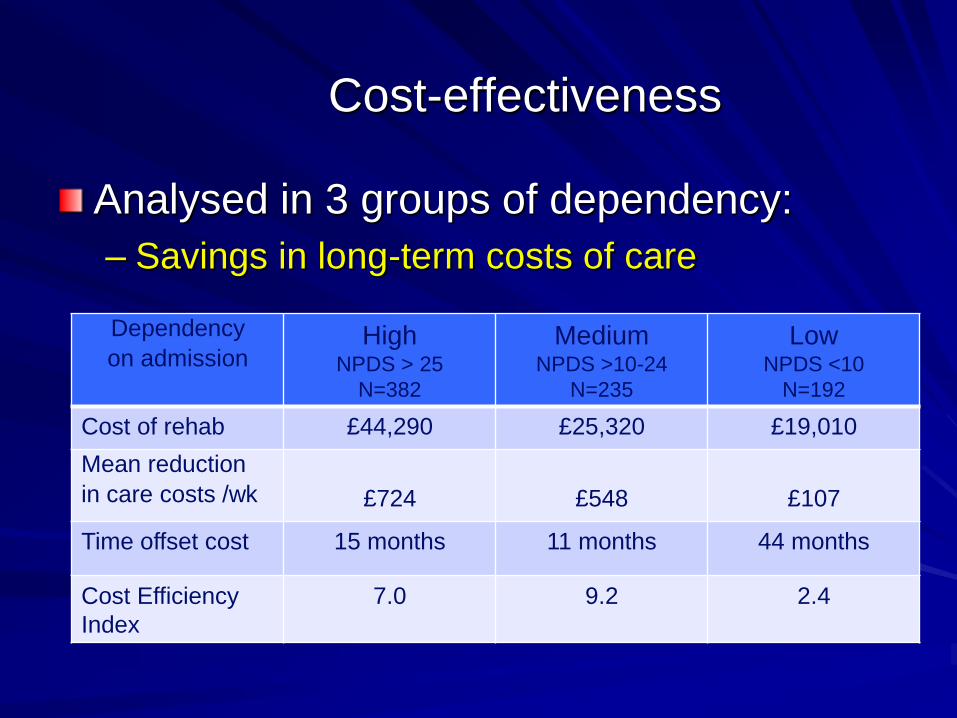
Cost-effectiveness
Analysed in 3 groups of dependency:
– Savings in long-term costs of care
Dependency
on admissionHigh
NPDS > 25
N=382
Medium NPDS >10-24
N=235
Low NPDS <10
N=192
Cost of rehab £44,290 £25,320 £19,010
Mean reduction
in care costs /wk £724 £548 £107
Time offset cost 15 months 11 months 44 months
Cost Efficiency
Index
7.0 9.2 2.4

Northwick Park Hospital

Our unit:
Changing
profile since
2010
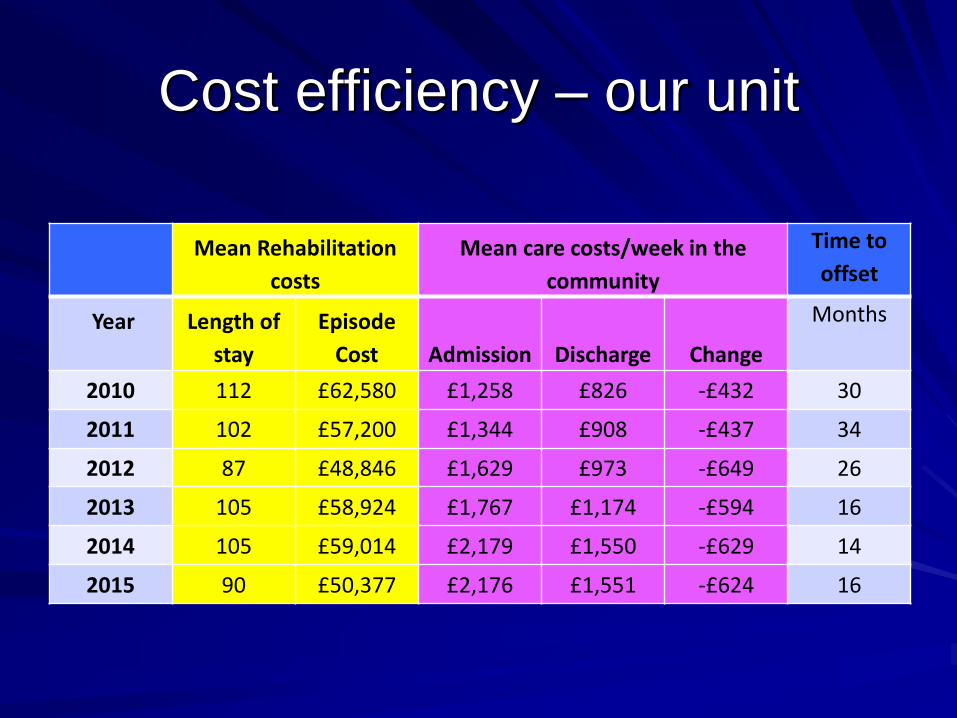
Cost efficiency – our unit
Mean Rehabilitation
costs
Mean care costs/week in the
community
Time to
offset
Year Length of
stay
Episode
Cost Admission Discharge Change
Months
2010 112 £62,580 £1,258 £826 -£432 30
2011 102 £57,200 £1,344 £908 -£437 34
2012 87 £48,846 £1,629 £973 -£649 26
2013 105 £58,924 £1,767 £1,174 -£594 16
2014 105 £59,014 £2,179 £1,550 -£629 14
2015 90 £50,377 £2,176 £1,551 -£624 16
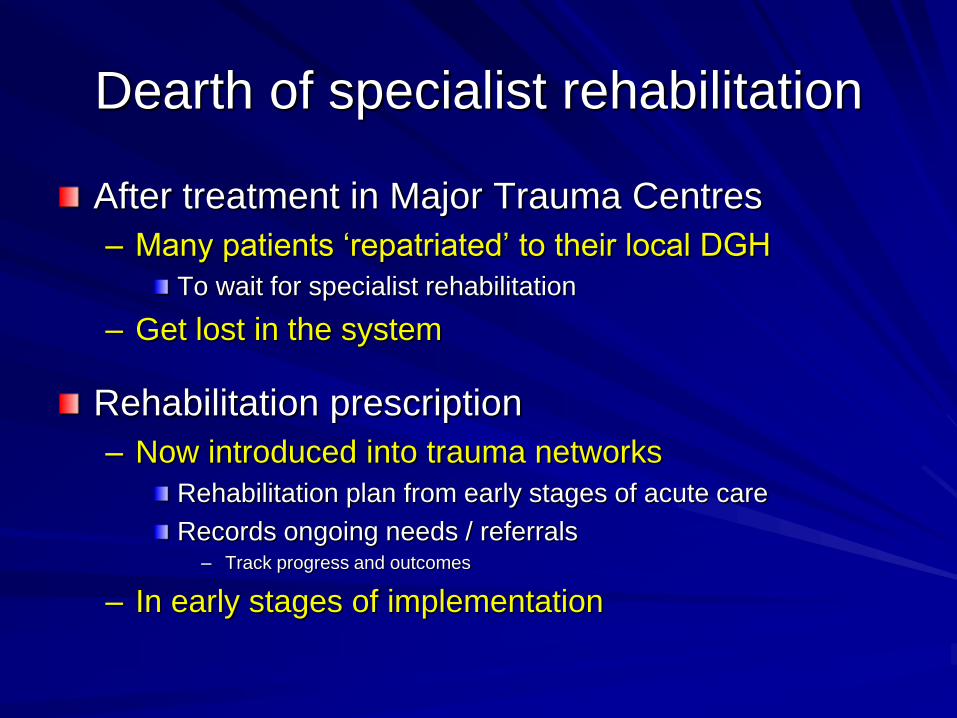
Dearth of specialist rehabilitation
After treatment in Major Trauma Centres
– Many patients ‘repatriated’ to their local DGH
To wait for specialist rehabilitation
– Get lost in the system
Rehabilitation prescription
– Now introduced into trauma networks
Rehabilitation plan from early stages of acute care
Records ongoing needs / referrals– Track progress and outcomes
– In early stages of implementation

Specialist Rehabilitation Prescription
British Society for Rehabilitation Medicine (BSRM)
– Specialist rehabilitation following Major Trauma
Core Clinical Standards
– Specialist Rehabilitation Prescription
For patients with complex rehabilitation needs– Requiring specialist rehabilitation (Level 1 and 2) services
– Key features: Extension of the RP (not a replacement)
Drawn up by a Consultant in Rehabilitation Medicine– In-reach from specialist rehabilitation services
Defines complex rehabilitation needs (category A and B)– Patient Categorisation Tool (PCAT), Rehabilitation Complexity Scale
Sign-posts patient down the correct pathway
Expedites referral and transfer to Level 1 and 2 services
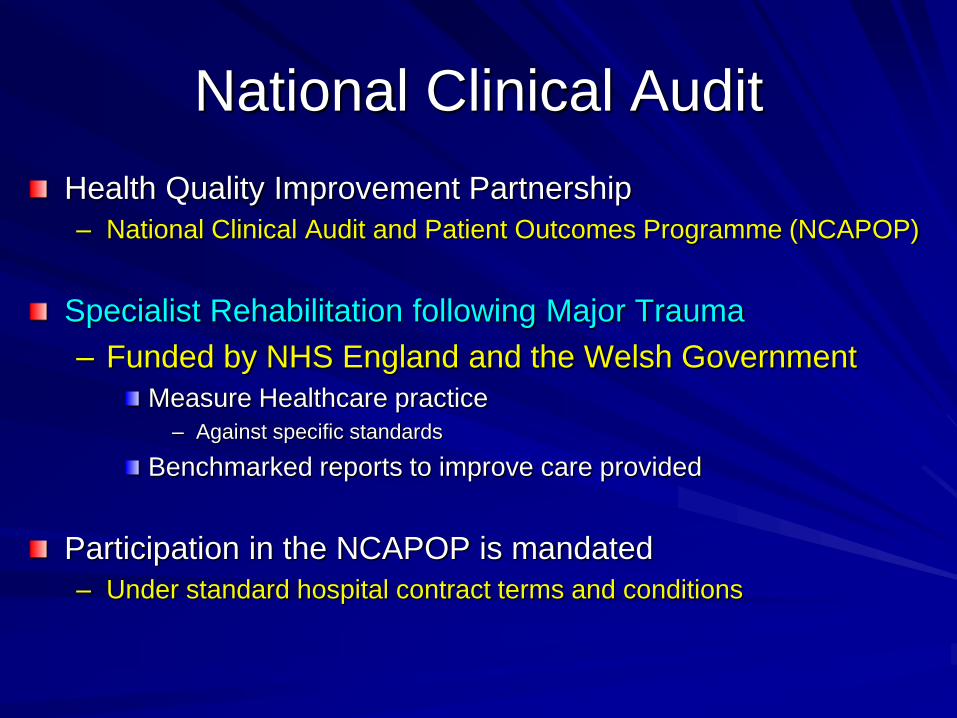
National Clinical Audit
Health Quality Improvement Partnership
– National Clinical Audit and Patient Outcomes Programme (NCAPOP)
Specialist Rehabilitation following Major Trauma
– Funded by NHS England and the Welsh Government
Measure Healthcare practice
– Against specific standards
Benchmarked reports to improve care provided
Participation in the NCAPOP is mandated
– Under standard hospital contract terms and conditions

Key standards
NHS England services specifications
– Major Trauma
– Specialist Rehabilitation
BSRM – core clinical standards
Standards concern:
– Prompt assessment of rehabilitation needs
By a consultant specialist in Rehabilitation Medicine
– Timely transfer to Level 1 and 2 services
– Rehabilitation provision
Specialist skills and facilities
Appropriate intensity of multi-disciplinary rehabilitation programmes
– Outcomes and cost-efficiency
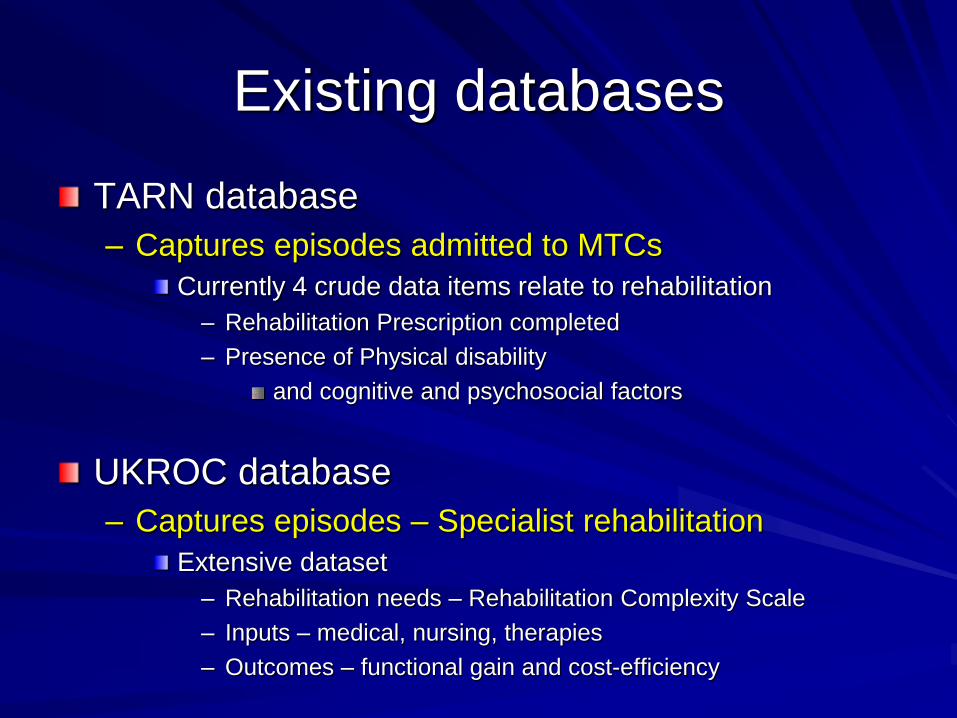
Existing databases
TARN database
– Captures episodes admitted to MTCs
Currently 4 crude data items relate to rehabilitation
– Rehabilitation Prescription completed
– Presence of Physical disability
and cognitive and psychosocial factors
UKROC database
– Captures episodes – Specialist rehabilitation
Extensive dataset
– Rehabilitation needs – Rehabilitation Complexity Scale
– Inputs – medical, nursing, therapies
– Outcomes – functional gain and cost-efficiency
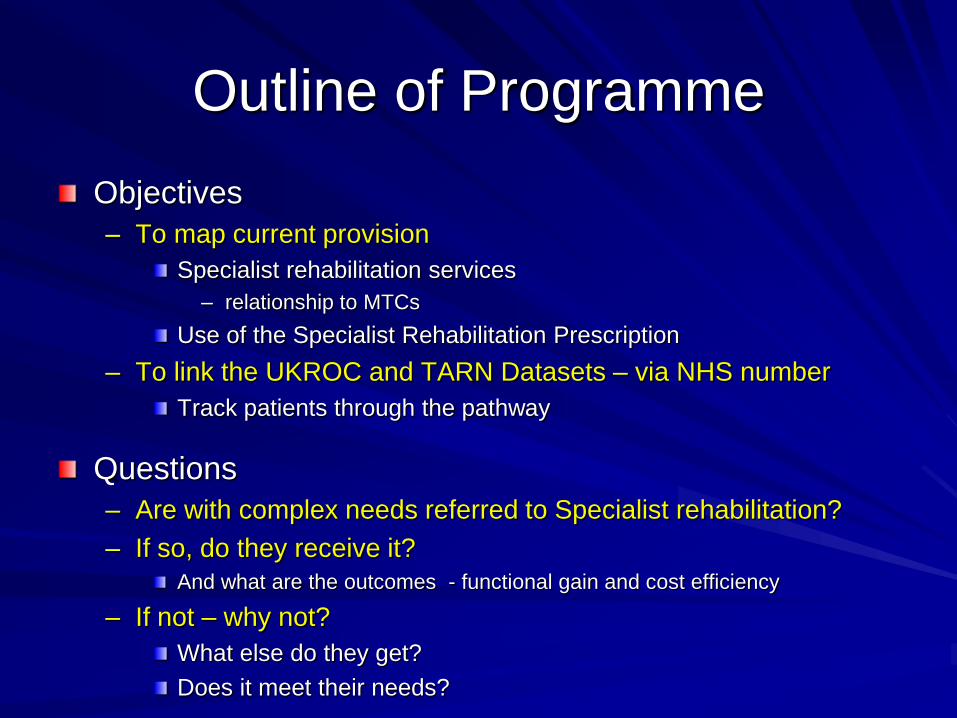
Outline of Programme
Objectives
– To map current provision
Specialist rehabilitation services
– relationship to MTCs
Use of the Specialist Rehabilitation Prescription
– To link the UKROC and TARN Datasets – via NHS number
Track patients through the pathway
Questions
– Are with complex needs referred to Specialist rehabilitation?
– If so, do they receive it?
And what are the outcomes - functional gain and cost efficiency
– If not – why not?
What else do they get?
Does it meet their needs?

3 main parts
Organisational audit – year 1
– Identify Level 1 and 2 services
Providing care to trauma patients
Map pathways – into and out of these services
Prospective clinical audit – year 2-3
– Of patients presenting to MTCs with category A and B needs
How many receive specialist rehabilitation?
If they do not – why not
Feasibility study – year 2-3
– Identify pathway and outcomes
For patients with complex needs requiring Level 1/2 services
– Who do not subsequently attend
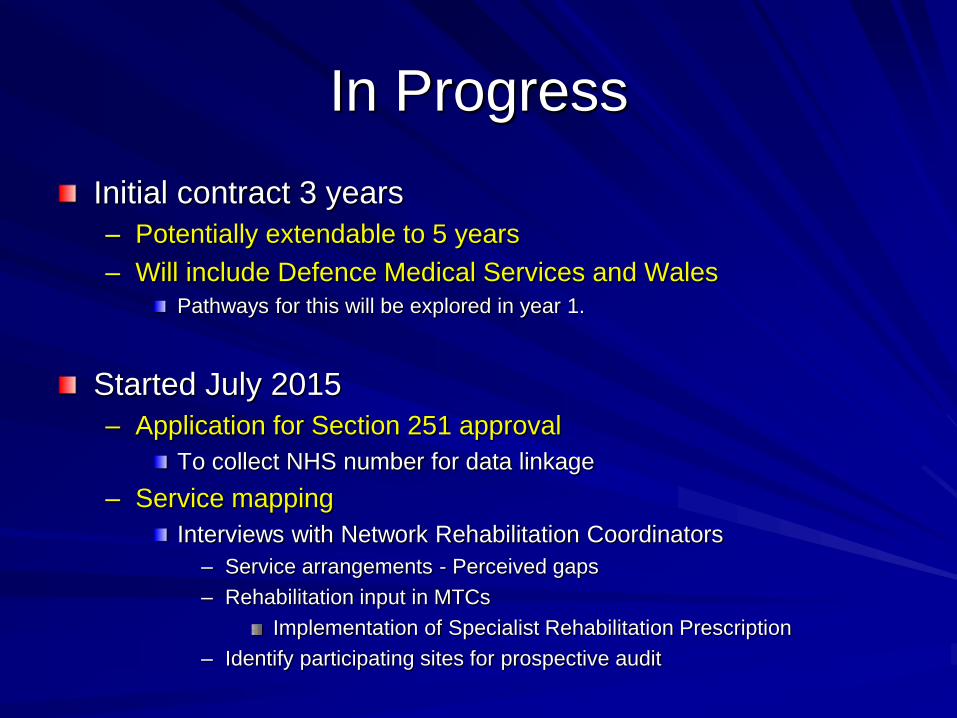
In Progress
Initial contract 3 years
– Potentially extendable to 5 years
– Will include Defence Medical Services and Wales
Pathways for this will be explored in year 1.
Started July 2015
– Application for Section 251 approval
To collect NHS number for data linkage
– Service mapping
Interviews with Network Rehabilitation Coordinators
– Service arrangements - Perceived gaps
– Rehabilitation input in MTCs
Implementation of Specialist Rehabilitation Prescription
– Identify participating sites for prospective audit
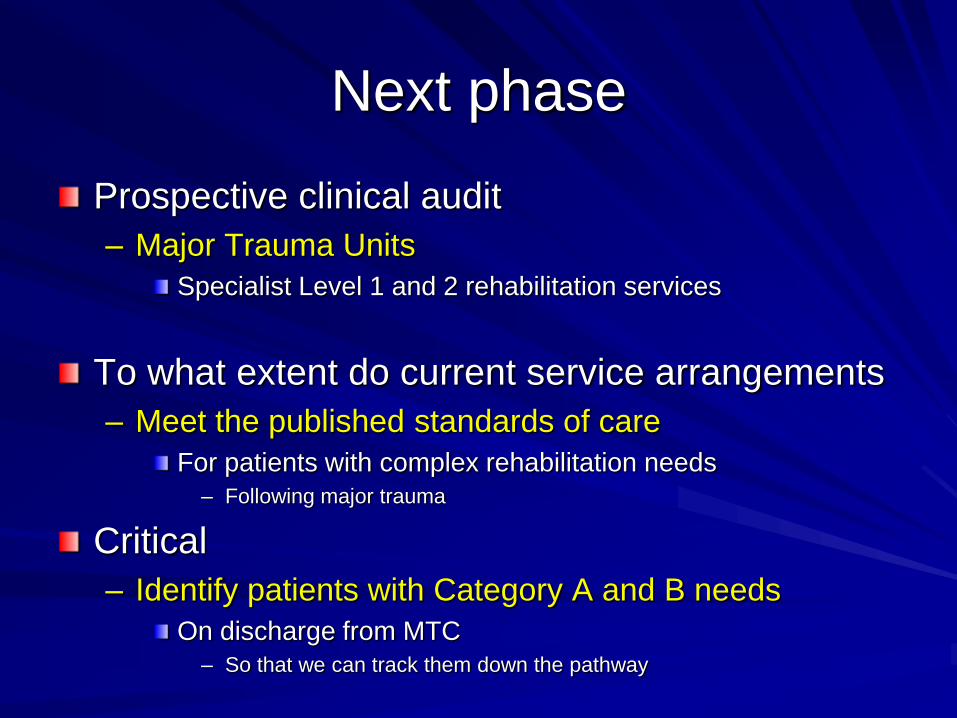
Next phase
Prospective clinical audit
– Major Trauma Units
Specialist Level 1 and 2 rehabilitation services
To what extent do current service arrangements
– Meet the published standards of care
For patients with complex rehabilitation needs
– Following major trauma
Critical
– Identify patients with Category A and B needs
On discharge from MTC
– So that we can track them down the pathway
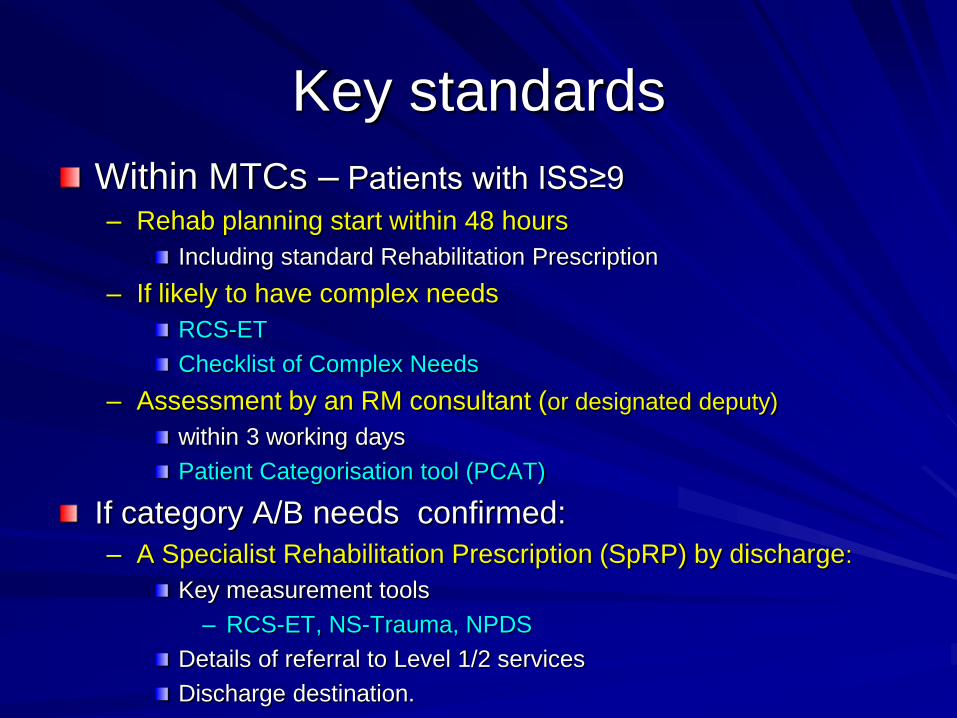
Key standards
Within MTCs – Patients with ISS≥9
– Rehab planning start within 48 hours
Including standard Rehabilitation Prescription
– If likely to have complex needs
RCS-ET
Checklist of Complex Needs
– Assessment by an RM consultant (or designated deputy)
within 3 working days
Patient Categorisation tool (PCAT)
If category A/B needs confirmed:
– A Specialist Rehabilitation Prescription (SpRP) by discharge:
Key measurement tools
– RCS-ET, NS-Trauma, NPDS
Details of referral to Level 1/2 services
Discharge destination.

Standards for assessment and
transfer to Level 1/2 rehabilitation
Following referral
– Assessed by rehab service within 10 days
PCAT tool confirmed – or completed if not done already
If accepted, but not yet fit for Transfer
– ‘Inactive waiting list’
– Serial RCS-M scores until R point reached
(RCS-ET M=3-4)
Patients requiring Level1/2 services
– Should be admitted within 6 weeks of R point
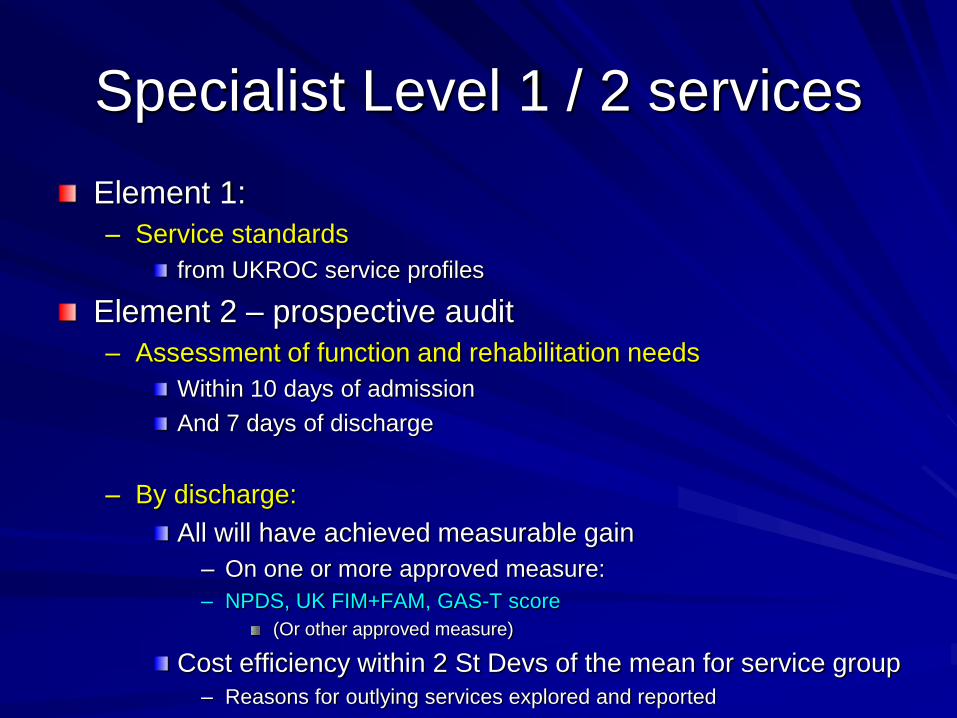
Specialist Level 1 / 2 services
Element 1:
– Service standards
from UKROC service profiles
Element 2 – prospective audit
– Assessment of function and rehabilitation needs
Within 10 days of admission
And 7 days of discharge
– By discharge:
All will have achieved measurable gain
– On one or more approved measure:
– NPDS, UK FIM+FAM, GAS-T score
(Or other approved measure)
Cost efficiency within 2 St Devs of the mean for service group
– Reasons for outlying services explored and reported

Tools

Complexity checklist

RCS-ET – score range 0-25
0 1 2 3 4 5 6
Medical None active
Basic Specialist Potentially unstable
Acute medical / surgical
TU MTC
Care Independent 1 carer 2 carers 3 carers 1:1 supervision
Risk None Low Medium High Very high
Nursing None Qualified Rehab nurse Specialist nursing
High acuity
Therapy disciplines
None 1 2-3 4-5 6
Therapy Intensity
(Total therapy time)
None Low level(< daily)
<15 hrs/wk
Moderate(eg daily)
15-24 hrs/wk
High(+ assistant)
25-30 hrs/wk
Very high
>30 hours/wk
Equipment None Basic Specialist Extremely -

PCAT toolCategory A
needs(Score 3)
Category B needs
(Score 2)
Category Cneeds
(Score 1)
Medical/neuropsychiatric Complex Medium Low
Therapy Intensity Very high High Standard
Clinical needs Severe / complex Moderate / standard None/ high level
Physical 3 2 1
Tracheostomy/ventilatory 3 2 1
Swallowing / nutrition 3 2 1
Communication 3 2 1
Cognitive 3 2 1
Behavioural 3 2 1
Mood/emotion 3 2 1
Complex disability management 3 2 1
Social / discharge planning 3 2 1
Family support 3 2 1
Emotional load on staff 3 2 1
Vocational Complex Standard None
Medico-legal Complex Standard None
Equipment High/y specialist Moderate One/ off the shelf
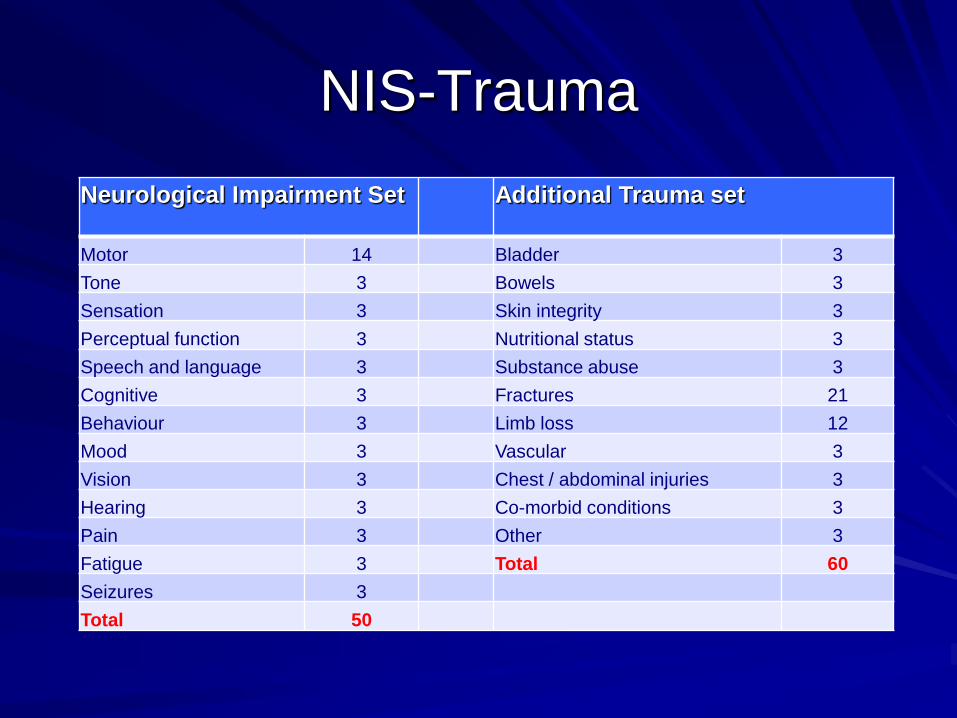
NIS-Trauma
Neurological Impairment Set Additional Trauma set
Motor 14 Bladder 3
Tone 3 Bowels 3
Sensation 3 Skin integrity 3
Perceptual function 3 Nutritional status 3
Speech and language 3 Substance abuse 3
Cognitive 3 Fractures 21
Behaviour 3 Limb loss 12
Mood 3 Vascular 3
Vision 3 Chest / abdominal injuries 3
Hearing 3 Co-morbid conditions 3
Pain 3 Other 3
Fatigue 3 Total 60
Seizures 3
Total 50
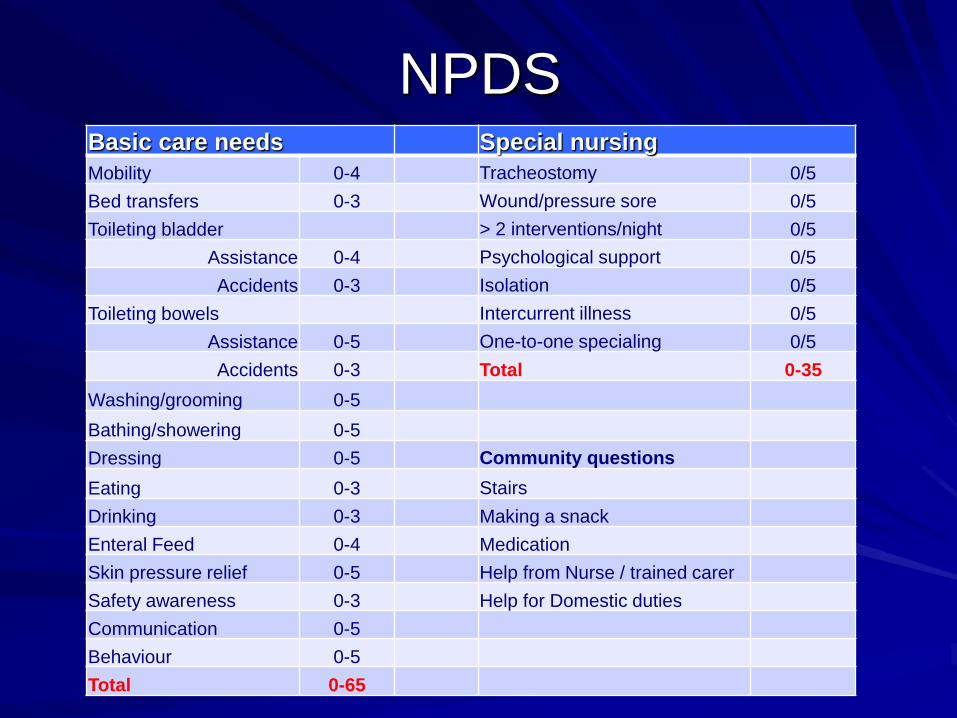
NPDSBasic care needs Special nursing
Mobility 0-4 Tracheostomy 0/5
Bed transfers 0-3 Wound/pressure sore 0/5
Toileting bladder > 2 interventions/night 0/5
Assistance 0-4 Psychological support 0/5
Accidents 0-3 Isolation 0/5
Toileting bowels Intercurrent illness 0/5
Assistance 0-5 One-to-one specialing 0/5
Accidents 0-3 Total 0-35
Washing/grooming 0-5
Bathing/showering 0-5
Dressing 0-5 Community questions
Eating 0-3 Stairs
Drinking 0-3 Making a snack
Enteral Feed 0-4 Medication
Skin pressure relief 0-5 Help from Nurse / trained carer
Safety awareness 0-3 Help for Domestic duties
Communication 0-5
Behaviour 0-5
Total 0-65

Discussion
Phase 2 to start in July 2016
Feasibility
– Ideas for data collection
– How can we help?
Acknowledgement
This presentation presents independent research funded by the National Institute for Health Research (NIHR) under its Programme Grants for Applied Research funding scheme (RP-PG-0407-10185).
The views expressed in this presentation are those of the authors and not necessarily those of the NHS, the NIHR or the Department of Health.
Financial support for the preparation of this presentation was also provided by the Dunhill Medical Trust, the Luff Foundation
With many thanks to the UKROC team and all the clinicians and patients who contributed data to the UKROC programme.
The UKROC programme is registered PbR Improvement Project. As a service evaluation it does not require research ethics permission.
The UKROC database is house at Northwick Park Hospital and overseen by a steering group of the British Society of Rehabilitation Medicine (BSRM)
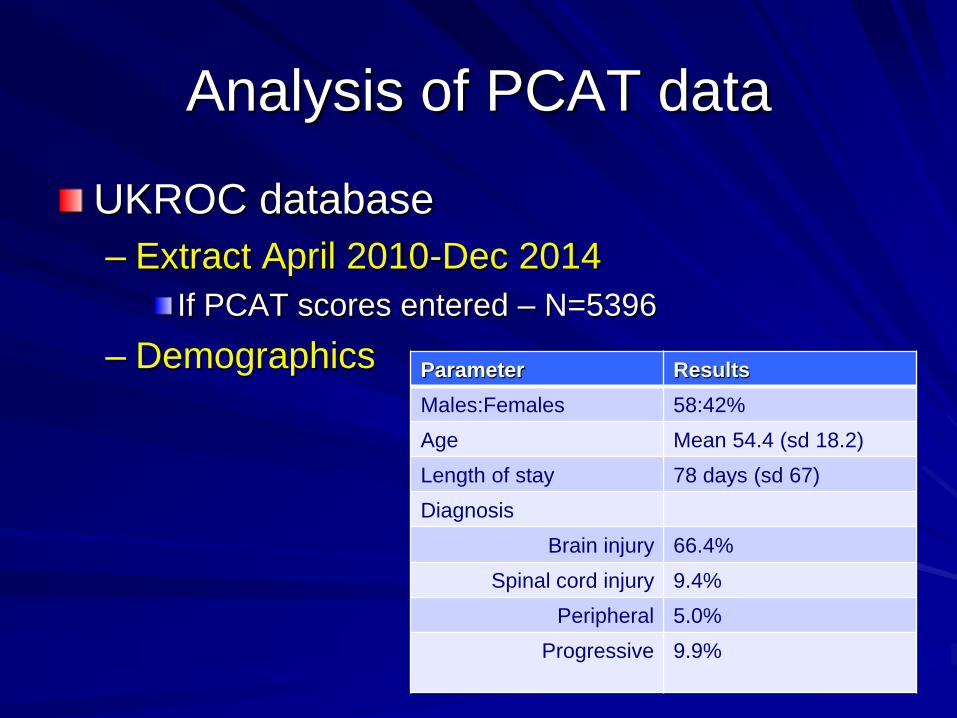
Analysis of PCAT data
UKROC database
– Extract April 2010-Dec 2014
If PCAT scores entered – N=5396
– Demographics Parameter Results
Males:Females 58:42%
Age Mean 54.4 (sd 18.2)
Length of stay 78 days (sd 67)
Diagnosis
Brain injury 66.4%
Spinal cord injury 9.4%
Peripheral 5.0%
Progressive 9.9%
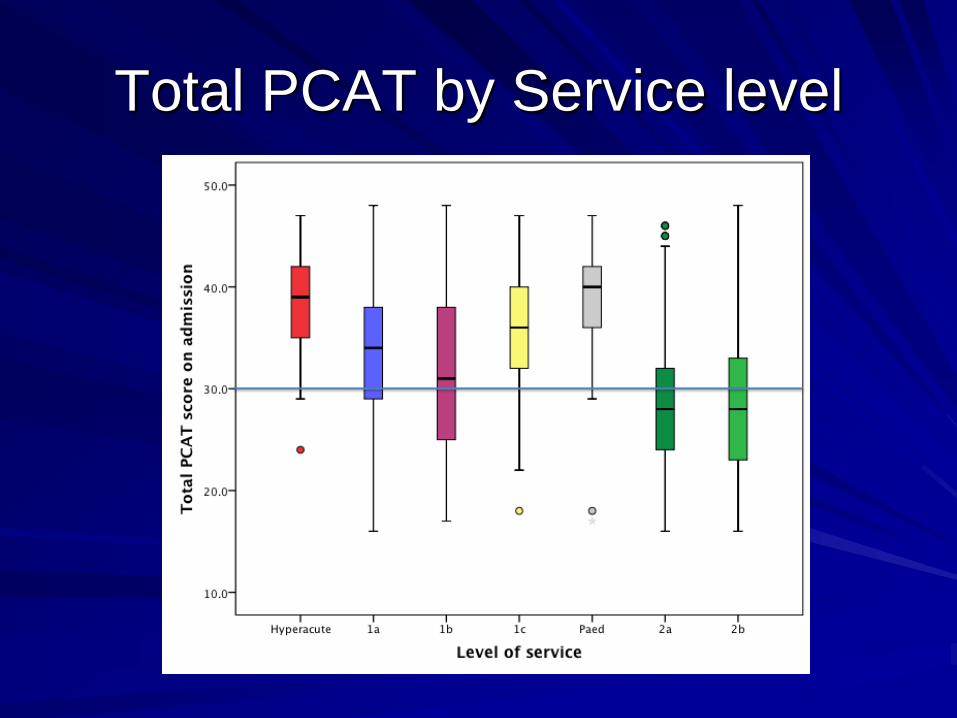
Total PCAT by Service level
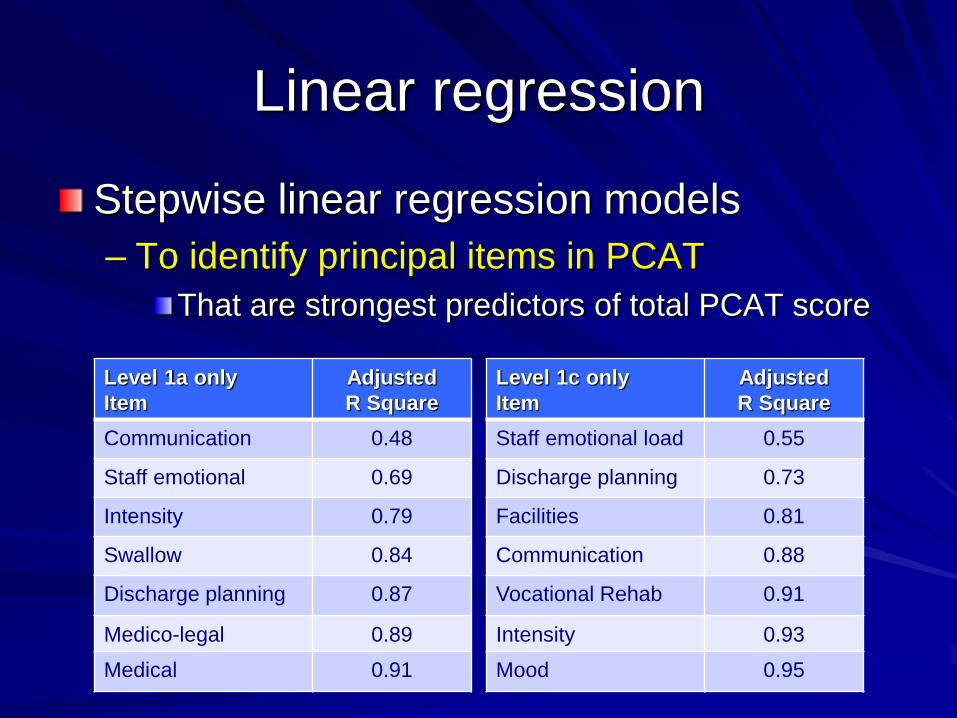
Linear regression
Stepwise linear regression models
– To identify principal items in PCAT
That are strongest predictors of total PCAT score
Level 1c only
Item
Adjusted
R Square
Staff emotional load 0.55
Discharge planning 0.73
Facilities 0.81
Communication 0.88
Vocational Rehab 0.91
Intensity 0.93
Mood 0.95
Level 1a only
Item
Adjusted
R Square
Communication 0.48
Staff emotional 0.69
Intensity 0.79
Swallow 0.84
Discharge planning 0.87
Medico-legal 0.89
Medical 0.91
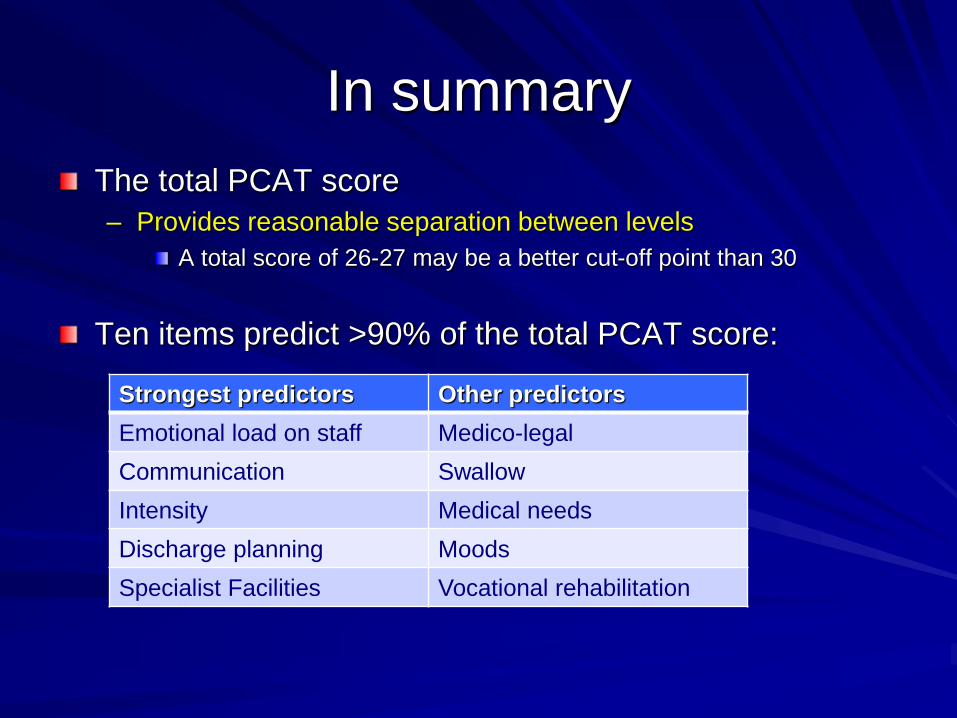
In summary
The total PCAT score
– Provides reasonable separation between levels
A total score of 26-27 may be a better cut-off point than 30
Ten items predict >90% of the total PCAT score:
Strongest predictors Other predictors
Emotional load on staff Medico-legal
Communication Swallow
Intensity Medical needs
Discharge planning Moods
Specialist Facilities Vocational rehabilitation