changing landscape of global value chains: redefining role
TRANSCRIPT

Page 1 of 72
Changing Landscape of Global Value Chains: Redefining role of Asian Economies
Neha Gupta1
Abstract
The paper looks at changing nature and pattern of global value chains (GVCs) integration in Asian
economies, mainly East, South-East and South Asian ones. GVCs began as regional chains from Japan and
then flourished to other countries, and so the theories explaining GVCs also changed according to the trade
and industrial patterns in such economies. Changes in theories have moved from flying geese to
fragmentation and agglomeration theory to upgrading in GVCs the pattern of snakes and spiders, which are
all now further undergoing transformations in some of their predications due to widespread interplay of
digital technologies, fourth industrial revolution (with more adoption of standards in intellectual property
and artificial intelligence). The paper studies Asian countries’ changing foreign trade and investment
policies as well as industrial strategies to understand how well they are equipped to deal with such changing
patterns. There are now movements to promote domestic manufacturing to move up value chains rather
than purely relying on imported contents (viz. ‘Made in China 2025’ initiative in China, ‘Make in India’
initiative in India). In fact, since 2013-14, some Asian countries are now experiencing more decline in
foreign value content share of gross exports or backward linkages, as compared to some European countries,
using TiVA Database. For example, the share has declined for China from 21% in 2012 to 17% in 2016,
and for India from 25% to 16% over the same period, suggesting more rise in domestic value added content.
The paper estimates changes in Asian GVCs in terms of backward and forward linkages in comparison to
European and American economies. Although China-centered GVCs is slowing down, but due to
digitalization and use of smart manufacturing and changes in trade policies, many developing countries of
Asia mainly China is all set to emerge with different look in GVCs. US and EU value chains have matured
much leaving much ground for Asia to take over and build new paradigms even in manufacturing. The
paper suggests way of how policies of some Asian countries should be adjusted so that they can place
themselves in their most promising sectors in global/regional value chains.
1Fellow, Indian Council for Research on International Economic Relations (ICRIER), New Delhi, India.
Email address: [email protected]
The author would like to thank Ms.Varsha Jain, Research Assistant, ICRIER, for compiling the data and policy
documents.

Page 2 of 72
Changing Landscape of Global Value Chains: Redefining role of Asian Economies
Neha Gupta
1. Introduction
It was agreed by some policy makers that there would be greater yet speedy consolidation of global value
chains (GVCs) post 2009-crisis which may prompt shifting of major powers from Developed North to
emerging South (Cattaneo, Gereffi and Staritz, 2010), along with more trade challenges for latter. This will
urge all the countries to restructure their policies and better manage their value chains. In fact, post-crisis,
as per WTO (2019), developing countries have in fact have become equally integrated into GVCs as the
developed ones (i.e., GVC participation for both groups was found to be around 41 per cent in their exports
for the year 2015). However, the struggle for LDCs and less developing economies would be more in Asia
while competing with those who rise up the value chains in terms of investments in infrastructure,
innovation, R&D activities and use of digitalised technologies with easy purchase and sale of goods and
services at just one-click to catch up with advanced countries in these fields. Specifically, the Fourth
Industrial Revolution/ Industry 4.0 is growing exponentially with level of complexities varying across
industries and countries. As the scale and speed of new digital-cum-technological transformation are much
advanced, rapid and full of uncertainties with growing cross-linkages (UNCTAD, 2018; Park, 2017), these
are likely to have tremendous effect on the growth of international trade. WTO (2018a) presents how digital
technologies (DT) such as Artificial Intelligence (AI), Internet of Things (IoT), Blockchain, etc. are fast
developing and how they can lead to a decline in trade costs. That is, as per this report, global trade is
projected to grow by additional 34 percentage points during the period 2016-30.
After quick spread of GVCs since mid-50s, it has no longer been sufficient to have comparative advantages
in some particular kind of finished products and to export them at lower costs for achieving favourable
trade balance and gains. Even if any country has large quantitative values of exports, this does not
necessarily imply an equivalent rise in its production. In fact, countries have increasingly developed
comparative advantages in different production processes or tasks, carried out in various geographical
locations, to propel ample transactions in intermediate goods and services which accounted for almost 60%
of world’s trade (UNCTAD, 2013). This trend was mainly popularized after the rise of China in GVCs
which was further fuelled by continuous liberalization of trade and foreign direct investments (FDI), and
gradual advancements made in the field of information, communication and technologies (ICT), along with
fall in transportation and logistics costs. But in the coming years, country’s comparative advantages would
eventually be traced in terms of data flows, privacy, IPR regulation powers, and progression of digitalisation
(WTO, 2018a). It would be thus interesting to review how GVCs theories have progressed over the years
and whether they have been modelled as per changing AI/robotics and digital economy aspects, which is
one of the main objectives of this paper.
Despite the recovery of trade in 2017, global economy has been facing serious challenges in the form of
increasing protectionism (viz. 39 new trade restrictive measures imposed by G20 during October 2017-
May 2018 period2), questioning the functioning of WTO multilaterism, excessive using of non-tariff
measures and practices such as licenses and quotas, growing anti-globalization tendencies especially post
2 For G20 measures, see https://www.wto.org/english/news_e/news18_e/monit_04jul18_e.htm

Page 3 of 72
Brexit, etc. All these have been fuelled by recent US withdrawal from Trans-Pacific Partnership (TPP) and
imposing of additional tariffs on imports of China and other trading partners which is likely to create both
new market access and opportunities especially with Asia along with challenges (UNESCAP, 2011)
Further, there have been evidence of falling foreign value added share in gross exports of major developing
countries of Asia after crisis mainly for China and its move towards enhancing domestic industrialization
and supply chains (Kee and Tang, 2015). Although Gupta (2015) shows rising backward linkages for many
manufacturing industries of another emerging Asian economy, that is India, but rise has been slower during
2009-11 mainly for its machinery industries (Gupta 2016). In fact, as per estimations from Goldar, Das,
Sengupta, and Das (2007), it can be inferred that domestic value added share of merchandise exports
declined only slightly during 2007-11 period in case of India. Further, ‘Make in India’ has been India’s
popular initiative since 2015 as part of its foreign trade policy. Thus, there seems to be some major policy
changes in these Asian economies to become industrialized with more domestic value added content, along
with usage of domestic supplies in exports. But the question rises whether the other Asian countries of
South are also undergoing policy transformations after 2008-09 financial upheavals? If yes, do their policy
documents reflect the changes in trade patterns and in industrial policies and digital economy aspects?
Further, it may be noted that, post-crisis, there has not only been the case of just GVCs’ reorganization, but
many countries also got plagued with number of uncertainties and doubts over continuing their integration
with other economies. On one hand, the trade under GVCs or regional value chains (RVCs) appears to be
slowing down for major developing economies such as China (sse, Wingaraja, Tyson, Prizzon, & Velde,
2018), while on the other hand, there are instances of growing maturity of GVCs or stagnation in many
advanced economies such as US, Japan and even some European countries. However, recent data in the
case of manufacturing shows that the share of intermediate goods in total trade has remained more or less
stable in both pre- and post-crisis period, except some slight downfall near the crisis. For instance, shares
of merchandise intermediate exports and imports in total global exports and imports have increased from
42% in 2002 to 44% and 43%, respectively, in 2006, thereafter which there has been slight decline (although
increased during 2010 with 43 in case of exports and 44 in case of imports). A decline was again seen
during 2011-14 period where the shares remained in the range of 42% (exports) and 43% (imports). Both
have risen after 2015 as the trade also revived from 2017, showing revival in GVCs trade also although at
a slower pace (45% in case of imports and 44% in case of exports in 2017). Further, as per WTO (2019),
“from 2011, developing economies’ exports to other developing economies surpassed its exports to
developed economies. “South-South” trade represented an estimated US$ 4.28 trillion or 52% of total
developing economies’ exports in 2018.” Thus, the trade trends are confusing for many countries
particularly after crisis for developing countries mainly Asia, and also the rising protectionism has been the
favourite playing card for many countries (mainly the advanced ones).
Thus, the need of the hour is not only to compare pre and post-crisis periods, but to study the period after
crisis say, the 2011-12 to 2017-18 period, which needs to be observed with regard to changing landscape
of GVCs (particularly in case of Asian economies). This is because Asia has registered highest level of
regional trade during 2008-18 (WTO, 2019). This paper appropriately studies trends in Asian GVCs using
international input-output tables from the OECD-WTO Trade in Value Added (TiVA) database of 2018
which provides data for the period 2005-16, and compares them with those of some European and American
economies. Analysis has been mainly done for post crisis times, comparing the periods 2011 and 2015/16.
Countries’ integration into the GVCs has been studied from two angles: share of backward linkages or share
of foreign value added (FVA) content in gross exports which is actually the respective country’s imported
content which it uses for production of its exports; and share of forward linkages which is presented in the
database as Domestic Value Added (DVA) in exports of intermediates as share of total exports, which

Page 4 of 72
estimates the exports of value added by exporting country for addition into the importing countries’ exports
as well as their final consumption. It may be noted that only the South East Asian (SEA), East Asian (EA)
and South Asian (SA) countries have been considered for analysis in this paper, along with EU 28, North
America, and South/Central America. It may also be noted that TiVA provides data only for India in case
of SA.
Using the secondary sources, this paper reviews existing foreign trade and investment policies of Asian
economies to understand how well they are equipped to deal with changes in the economy in terms of
intermediate goods trade, more focus on domestic value added creation, usage of IT technologies and smart
manufacturing. Rather than adopting empirical model estimations, this paper does ground work for future
research by providing a much needed review paper to understand the changing landscape of Asian GVCs
and their shifting role therein.
The paper is organised as follows: next section reviews trade and investment trends in Asia and other
economies, followed by a section on understanding theoretical evolution of GVCs. The fourth section
reviews the changes in Asian countries’ policy announcements post-crisis, followed by a section on
assessing the changing trends in backward and forward linkages. Sixth section provides main policy
suggestions to strengthen Asian GVCs. The last section concludes the paper.
2. Trade and Investment Patterns between Asia and others
Overall, the global exports and imports declined from USD 16 trillion in 2008 to USD 12.5 trillion in 2009
which, thereafter, rose till 2013 (USD 19 trillion), but then fell drastically. The global crisis of 2008-09 had
delivered varied yet differential impacts worldwide including the economic slowdown and shriveling in
world trade, which was felt hardly since 2013. However, global trade revived in value terms in 2017,
estimated at USD 17.7 trillion and further rose to USD 19.4 trillion in 2018, using data from WTO (2019).
Also, global trade revived and recorded the strongest growth in volume terms in 2017, as mentioned by
WTO (2018) as: “Merchandise trade growth in 2017 was up sharply from 2016, when trade volume grew
by just 1.8 per cent, the smallest increase since the financial crisis of 2008. Strong growth in trade volume
in 2017 was driven primarily by cyclical factors, as world growth in GDP at market exchange rates rose to
3.0 per cent from 2.3 per cent the previous year. This economic activity was driven by increased investment
spending, particularly in the United States, and rising consumption, notably in Japan. Meanwhile, China
and the European Union maintained a steady rate of expansion, providing a solid base for global demand.”
The main reason behind this has been the increased demand for imports in many regions but most
prominently in Asia which emerged as the top contributor.
Although global economic recovery has been considered to be modest, much of the contribution to global
economic growth has been expected to be driven by developing countries, especially emerging economies
like India and China. It is found that global economic power balance may be shifting, viz. growing influence
of ‘BRIC’ to surpass G6 by 2030 (World Economic Forum, 2017). Although developing countries’ shares
in global merchandise exports and imports have declined from 2015 to 2016, while the corresponding shares
for developed economies have risen (Table 1), but thereafter the trend reversed for both set of countries.
Notably, shares of developed ones continued to decline in exports but more in case of imports. On the other
hand, the rise in shares of developing economies has been greater particularly during 2016-17 as compared
to modest rise in later years. From these set of countries, rise in shares from 2017 to 2018 can be attributed
to Middle East’s exports which increased from 5.5% to 6% and even that of Africa (rise from 2.4% to
2.5%), but not attributed much to Developing Asia whose export shares declined post-2015. However, the
shares of latter continued to rise in imports contributing to the rising share of developing countries’ imports

Page 5 of 72
in world imports. Conversely, there has not been much change in shares of Developing Latin America and
Europe, showing almost similar level of participation in world’s trade.
Table 1: Shares of regions in world’s merchandise trade (%)
REGIONS
Exports Imports
2014 2015 2016 2017 2018 2014 2015 2016 2017 2018
Developing economies 43.6 43.4 42.4 43.2 43.5 41.0 40.9 39.7 40.7 41.1
Developing Latin America 5.6 5.8 5.7 5.8 5.7 6.2 6.3 5.9 5.8 5.8
Developing Europe 1 1.1 1.1 1.1 1.1 1.5 1.5 1.5 1.6 1.4
Developing Asia 26.8 28.9 28.4 28.4 28.1 25.6 25.3 25.0 26.2 27.1
Developed economies 52.4 53.5 54.9 53.8 53.2 56.3 57.0 58.2 57.1 56.6
Source: Data extracted from WTO (2019) and WTO (2016)
Moreover, in terms of share of merchandise exports in world’s exports (Part A of Table 2), there has been
decline in the shares of North America (NA) mainly US and of Japan in the range of 1-2% from 2008
(period when crisis started) till 2012 (period after crisis) and to 2017 (period much after crisis). Decline has
been gradual over these years. After 2008-09 crisis period, the share of EU 28 has declined by almost 6
percentage points during 2008-12, which continued further. Whereas Developing Asia’s shares improved
by 3.7 percentage points during 2008-12, but rose by 5 percentage points even much after the end of crisis,
i.e. during 2012-17, signifying greater forward participation in world trade and GVCs. Highest rise was
contributed by developing East Asia of 6 percentage points from 2008 to 2017 (mainly by China, followed
by Chinese Taipei and South Korea), trailed by rise of 2 percentage points in the case of SEA (majority of
the countries registered stable shares: rise in shares was only of 0.8 percentage points by Vietnam, and of
0.2 percentage points by Malaysia and Thailand). Brunei Darussalam, Cambodia, and even Myanmar have
almost nil shares. South Asia’s shares increased by just 0.5 percentage points, with only rise in participation
by India (Table 2). On the other hand, as depicted in Part B of Table 2, the share of developing Asia’s
intermediate imports in their total exports rose by 0.1 percentage points during 2008-17 signifying lesser
use of imported inputs or slow growth in GVCs trade for the region. In fact, just after crisis, this share
increased from 37.7% in 2008 to 39.3% in 2012 but thereafter, in 2017 declined to almost 2008 level.
Interestingly, world’s share too declined from 44% in 2008 to 42% in 2017, and so has been the case of
EU-28 (fall of 5 percentage points). Japan and US shares declined by 1 percentage points, indicating almost
stable position in trade. But it is important to note that the share of intermediate exports in world has risen
for developing SEA and EA from 2008-17, but not of intermediate imports in their total exports which
actually witnessed decline in share of 2 and 5 percentage points, respectively. But the decline was only for
Thailand and Vietnam, while significant rise in usage of imported inputs post-crisis (which did dropped in
2012 before again rising upto 2017) has been for Brunei, Cambodia and Philippines majorly by 19, 13 and
12 percentage points respectively. Most notable is region-wise rise in share of imported inputs in exports
for Developing South Asia from 41% in 2008 to 48.7% in 2012 and 50% in 2017. Although India’s shares
increased during 2008-12 but declined thereafter, while the rise in shares has been seen by Afghanistan,
Nepal, and Pakistan, followed by Sri Lanka. That is, the number of developing countries which have been
on lower rungs of development have actually started an increased usage of imported inputs in manufacturing
to link into GVCs trade, post-crisis.

Page 6 of 72
Table 2: Shares of countries/regions in Merchandise exports (2008-17)
A: Shares of countries'/regions' merchandise
intermediate exports in their total merchandise world
exports (%)
B: Shares of merchandise intermediate
imports in total merchandise exports
(%)
Region/Country 2008 2012 2017 2008 2012 2017
North America 15.1 14.3 13.6 52 51.7 51.5
US 10.6 9.9 9.3 54.9 52.1 53.6
EU 28 39.8 33.9 33.8 45 42.5 40
Japan 5.9 5.6 4.6 36.3 37 35.9
Developing Asia 23.5 27.2 31.8 37.7 39.3 37.8
Developing South
Asia 1.5 1.9 2 41.2 48.8 50.1
Afghanistan 0 0 0 150.2 123.4 377.3
Bangladesh 0.03 0.03 0.02 107.2 96.9 77.4
Bhutan 0 0 0 47.6 100.8 27.8
India 1.4 1.7 1.8 69.8 76.9 75.9
Maldives 0 0 0 0.2 0.2 0.4
Nepal 0.01 0.01 0 110.4 341.8 595.3
Pakistan 0.1 0.1 0.1 94.3 79.2 121.1
Sri Lanka 0.03 0.03 0.04 85.7 94.3 88.2
Developing
Southeast Asia 7.2 8 8.7 52.2 51.5 50.4
Brunei Darussalam 0 0.01 0 11.3 11.8 29.7
Cambodia 0.02 0.01 0.02 57.3 54.2 69.9
Indonesia 1.1 1.1 1.1 50.4 52.4 51.8
Malaysia 1.4 1.6 1.6 47 51.6 48.4
Myanmar 0.02 0.04 0.05 45.2 38.4 46
Philippines 0.5 0.4 0.6 74.3 70.8 86
Singapore 2.8 2.8 2.8 46.2 41.8 42.9
Thailand 1.3 1.5 1.5 58.9 59 44.8
Viet Nam 0.2 0.5 1 76.6 67.1 60.9
Developing East
Asia 14.7 17.3 21.2 43.6 43.4 38.7
China 8.9 10.6 12.3 50.1 51.9 47.5
Hong Kong, China 0.1 0.2 0.2 5.9 6.8 1.8
Korea, Republic of 3.1 3.8 4.4 49.8 42.7 37.8
Macao, China 0 0 0 72.9 93.3 162.9
Mongolia 0 0 0 33.7 40.6 19.4
Chinese Taipei 2.5 2.6 4.1 51.4 46.5 38.3
Source: WTO (2019)

Page 7 of 72
Along with this, FDI outflow has also increased after crisis for developing economies from 28% in 2012 to
41% in 2018, although there has been decline from 79% to 55% in the same period for developed economies
(Appendix Table A). The contribution has been growing from developing Asia whose FDI increased from
24% in 2012 to 32% in 2014, which declined afterwards to 26% in 2016, before rising to 40% in 2018. The
share has increased mainly from developing EA by 10 percentage points from 2012-18, by 3 percentage
points for Developing SEA, and only 0.3 percentage points for developing SA. Japan’s outward investments
have increased from 10% to 14% over the years, and from 25% to 39% for EU 28, whereas, outward
investments from NA declined drastically.
At the same time, FDI inflows in developing economies have also risen during 2012-18 period, where
majority went to developing Asia with rise from 28% to 40% (both outflow and inflow shares have
converged in 2018 for the region) which has always been in a greater need for inviting FDI (Appendix
Table B), as also supported by UNESCAP (2018). Interestingly, the share of developing SA’s FDI inflows
has increased from 2.2% in 2012 to 4.2% in 2018. The shares have also risen for developing SEA and EA
from 8% in 2012 to 12% in 2018, and from 14% to 22% over the years, respectively.
All this makes developing and emerging Asian countries now more integrated into trade and investment
terms, which needs to be understood from changes in value added linkages, theories and policies perspective
as well to factor into after-crisis effects. This justifies the need to review the trends and policy documents
for a number of Asian countries. Although there are rising annual reports or sector-specific case studies by
WTO and UN agencies in recent times to review the changing trends mainly in Asia such as by WTO
(2019), UNCTAD (2018b), UNIDO (2018), etc., but the focus has not been much on changing theoretical
framework and connection of GVCs linkages trends with policy formulations in those countries.
3. Conceptual-Theoretical Evolution of GVCs and Literature Review with respect to Asia
Global economic map has been continuously changing whereby new geographies of production,
distribution and consumption are getting created. But, past events and the long history of evolution about
industrialization and connection of world markets are vital in explaining the current scenario of GVCs as
well as in predicting its future pathways (Dicken, 2011). GVCs are not a new-fangled phenomenon to be
amazed at. They have been a part of the world economy say at least since the 17th century. However,
major turning point came when there was an industrial revolution in Britain around mid-18thcentury till
mid-19th century. This was the time when innovative methods and machines were used for facilitating
production. During this period, steam engines were invented which helped in flow of goods from one place
to the other. The trade and transportation costs were reduced and this made the separation of production
and consumption across countries feasible. New manufacturing processes were developed, along with
spinning machines; iron and textiles played a key role and soon this revolution spread to Western Europe
and North America. In mid-19th century, the technology revolution started and more number of
manufactured goods flooded the markets leading to industrial development in many countries. America
became super power after WWI in the early stages of 20th century, and then Soviet Union also emerged as
a major player. The colonial powers began their search for raw materials and moved beyond their economic
territory towards underdeveloped and developing countries of Asia which had abundant supply of labour
and natural resources. So, as the Southern countries de-industrialized, there was rise of industrialisation in
Northern countries (World Economic Forum, 2012; Baldwin, 2012). However, till mid-20th century, after
the end of WWII, no one anticipated the rise of Japan in East Asia which was so remarkable that marked
the beginning of evolution of GVCs, which became more dominant in the 21st century. This trend changed

Page 8 of 72
the outlook of trade owing to the intimate way in which the global economies have become interconnected
since then and the overriding role that has been played by globalisation particularly till 2009-09 economic
crisis.
In earlier times, trade was in the form of internationalisation which refers to phenomenon of crossing the
national boundary and reaching to the outside markets. The term was defined as “the geographic spread of
economic activities across national boundaries” (Gereffi, Humphrey, Kaplinsky, & Strugeon, 2001). But,
this phenomenon has been extended over the years to globalisation which refers to “functional integration
between internationally dispersed activities (Dicken 1988:5)” (as cited in Gereffi et al., 2001). Since 1980s-
90s, production and supporting activities have been taking place almost globally, irrespective of the borders
of a nation. The idea has been to explore the international markets for achieving cost-competitiveness of
products and this phenomenon came to known as GVCs.
GVCs of today began as regional supply chains in East Asian region in the 1950s with Japan initiating the
process as lead goose and stimulating 'flying geese' pattern of investment and trade. It actively pursued
vertically integrated production systems and developed big national brands and large conglomerates. It
actively used FDI and trade to become major investor and exporter of the region. Over time, Japan moved
from low-cost products to more sophisticated products. It shifted light labour-intensive manufacturing
industries to other East Asian countries and set up its plants to develop them as export platforms. Later in
1960s, this development spread to the 1st generation Newly Industrialising Economies (NIEs) namely
Singapore, South Korea, Taiwan and Hong Kong. At that time, US and European firms had also started
looking for low-cost locations for their products, and thus shifted their manufacturing base to Asian
countries owing to locational advantages and wage differences. The 1st generation NIEs started to provide
subcontracting services to these firms, including the Japanese firms. Eventually, capital intensity of the
products by 1st generation NIEs increased, with increase in production and use of innovative methods. Also,
more number of high-wage and advanced countries moved their labour-intensive manufacturing to East and
South-East Asian economies. This led the 1st generation countries to move up the ladder in the late 70s
and early 80s giving opportunity to 2nd generation NIEs, that is, Philippines, Malaysia, Thailand and
Indonesia, to produce low-end consumer goods and enter the trading system. These countries soon became
specialised in the production of many machinery parts and components. Both first and second generation
NIEs effectively used incoming FDI and became export platforms. This led to a changing of the scenario
from where inputs were produced in one country, assembled in some other country, and finished products
exported by a third country to the final consumers. But the major change came in the world economy when
China entered these chains in the mid-80s, along with Vietnam, Cambodia, etc., (Haddad, 2007; World
Economic Forum, 2012; Gupta, 2012). Many of the above countries set up their base in China for building
their GVCs.
Over the years, Japan’s development passed through ‘tonne age’ (heavy machines, steel, ship building,
textiles, etc.) to ‘kilo age’ (automobiles, consumer electronics, office equipment, etc.), and then ‘gram age’
(semiconductors, robotics, precision instruments, etc.), but it failed to move effectively towards ‘vacuum
age’ (internet). It was China which took immense advantage of the ICT revolution of 1980s along with
increased globalised market forces, which led to its sudden rise in GVCs (World Economic Forum, 2012).
It soon became an assembly hub of Asia and obtained most of the inputs from other neighbouring countries
and assembled them to produce final goods for Western countries. It had massive cheap labour as well as
actively utilised the inward FDI flows. It thus became major producer and exporter of manufactured goods,

Page 9 of 72
and that too at lowest cost. Its mass production of almost all types of goods ranging from textiles, toys to
electronics to some highly sophisticated machines led to development of ‘factory Asia’ (Baldwin, 2012;
Elms & Low, 2013). However, there are efforts to move away from Factory Asia status with declining
share of FVA in gross exports post-crisis (Kee & Tang, 2015).
Second, the available literature also clearly highlights as to how the GVCs as a concept has evolved over
the years. Its initial conceptualization dates back to the pioneering works of Michael Porter in mid-1980s
(value chain) and of geographer Peter Dickens in 1992 (production chain). In the former concept, primary
activities of inbound logistics, operations, outbound logistics, production, marketing, and after sales
services are separated from secondary activities such as planning, human resource management, technology
development, etc. which provides support in the completion of these primary tasks, and this intra-linkages
of activities are referred to as value chains by Porter (Kaplinsky & Morris, 2001). The term ‘filiere’ was
also coined by French economists which is defined as “a system of agents producing and distributing goods
and services for the satisfaction of a final demand” (Henderson, Dicken, Hess, Coe, and Yeung, 2002); but
this concept was said to be more applicable to domestic value chains (Kaplinsky & Morris, 2001).
One of the prominent conceptualization of these chains was put forward by Gereffi and Korzeniewicz
(1994) who presented ‘global commodity chain (GCC)’ as “consisting of a number of ‘‘nodes’’ that
comprise the pivotal points in the production process: extraction and supply of raw materials, the stage(s)
of industrial transformation, export, and marketing. Each node is itself a network connected to other nodes
concerned with related activities; local, regional, national and world economies are seen as ever more
intricate web-like structures of these chains.” The main point was that the global economy has become
increasingly integrated where different countries are continuously upgrading their industries in order to
occupy distinct export niches. Thus, GCC includes “sets of inter-organizational networks clustered around
one commodity/ product, linking households, enterprises, and states to one another within the world-
economy” (Gereffi & Korzeniewicz, 1994).
The whole idea of these chains is to move a product from the stage of conception to its ultimate users. This
is clearly reflected in the work of Hopkins and Wallerstein (1986: 159) (as cited in Gereffi & Korzeniewicz,
1994) which conceptualizes commodity chains as “a network of labor and production processes whose end
result is a finished commodity.” In terms of governance structure, there have been two types of commodity
chains: producer-driven commodity chains and buyer-driven commodity chains. Former set of chains are
those where large manufacturer coordinates the entire production network, both upstream and downstream,
and this is more prevalent in case of capital and technology intensive industries such as automobiles,
aircrafts, computer, heavy machines, etc. While, the latter set of chains are prominent in labour-intensive
industries like garments, leather, etc. In this case, large retailers and brand owners play important role in
setting up of decentralised production networks, such that production takes place in Third World Countries
as per specifications of the buyers located in developed countries (Gereffi, 1999), and such chains have
been more aligned with 21st century trade. However, success in these chains depended on how the industry
transforms from assembly of imported inputs to the full-package supply or Original Equipment
Manufacturing, and further to the Original Brand Name Manufacturing (OBM) system (Gereffi &
Memedovic, 2003).
Further, in their pioneering work, Henderson et al. (2002) and Henderson (2002) put forward the concept
of ‘global production network (GPN)’ as a “conceptual framework that is capable of grasping the global,

Page 10 of 72
regional and local economic and social dimensions of the processes involved in many (though by no means
all) forms of economic globalization”. GPN has been thus defined as the globally organized “nexus of
interconnected functions and operations through which goods and services are produced, distributed and
consumed....Such networks not only integrate firms (and parts of firms) into structures which blur
traditional organizational boundaries - through the development of diverse forms of equity and non-equity
relationships - but also integrate national economies (or parts of such economies) in ways which have
enormous implications for their well-being. At the same time, the precise nature and articulation of firm-
centered production networks are deeply influenced by the concrete socio-political contexts within which
they are embedded.” This process is highly complex as GPNs are not very territorially specific (Figure 1).
Figure 1: Framework of GPN Analysis
Source: Reproduced from Henderson et al. (2002) and Henderson (2002)
However, these approaches were, in fact, in converse with the ‘new regionalism’ literature which placed
significant importance on local institutions and “their capacity to ‘hold down’ global networks (for
overviews see MacLeod 2001a; Scott 1988; Storper 1997)” (as cited in Coe, Hess, Yeung, Dicken, &
Henderson, 2004). The work of Coe et al. (2004) has been phenomenal in the field of facilitating and
globalizing regional development. This study derived insights from above mentioned literatures and
focuses on “the dynamic 'strategic coupling' of global production networks and regional assets, an interface
mediated by a range of institutional activities across different geographical and organizational scales”. It
explored how through this coupling process, the value is created, enhanced and captured which ultimately
decides the development of a region. “Regional development is not just shaped by regionally specific
institutions, but also by a variety of extra-local institutions (e.g. national, supra-national) that will impact
on activities within a region” (Coe et al., 2004). Regional economies of scale and scope are only
advantageous to the regions and transform in a slow manner; while the strategic needs of the trans-local
actors positioned within GPNs keep on changing rapidly, and thus, when there exists complementary effect
between the two, relational advantages of regions meet the needs of actors leading to regional development.
Overtime, the literature on international trade used the terms like ‘international production network’ or
‘global production sharing’ to highlight “the breakup of a production process into vertically separated stages
carried out in two or more countries” (Athukorala & Menon, 2010). These terms are the outcomes of a new
stream of thoughts: the fragmentation theory and new economic geography, mainly with respect to East
Asia’s machinery sector. International production network (IPN) can be defined as “the organisation,
across national borders, of the relationships (intra and increasingly inter-firm) through which firms conduct

Page 11 of 72
research, development, product definition and design, procurement, manufacturing, distribution and
support services” (Borrus, 1996) (as cited in Gaulier, Lemoine, &Unal-Kesenci, 2007). Increasingly, wide
product coverage of global production sharing and its rapid spread from developed countries of North (with
mature industries) to the developing countries of South became the novel features of production networks
(Athukorala & Nasir, 2012).
More importantly, above concepts show that trade in finished goods (like exchange of cloth for wine, as
per traditional trade theory) has been replaced by trade in particular production process or tasks (for
example, trade is between task of cutting and stitching, task of designing, task of branding, etc. in garment
industry) which has become very prominent in the decade of 2000s (Nathan, 2010). Many terms have also
been coined for IPNs such as ‘Global Supply Chains (GSCs)’ (see, UNCTAD, 2011; Baldwin, 2012) before
finalising the term ‘Global Value Chains (GVCs)’ (UNCTAD, 2013; Banga, 2014). Cattaneo, Gereffi and
Staritz (2010) mentioned that “GVCs encompass the full range of activities that are required to bring a good
or service from conception through the different phases of production – provision of raw materials; the
input of various components, subassemblies, and producer services; the assembly of finished goods – to
delivery to final consumers, as well as disposal after use.”
The activities propounded by international production networks or value chains began in electronics and
garments industries in the late 1960s. These have gradually spread to other industries, namely, footwear,
automobiles, television, radio receivers, office equipments, sewing machines, electrical machines, power
and machine tools, camera, watches, printing, publishing, and ICT products (Athukorala & Menon, 2010;
Athukorala, 2010; Athukorala, 2014). Thus GVCs have been mesmerized by growth in the manufacturing
sector. Services also started being increasingly traded in GVCs, but level of offshoring in these activities
remained much less than that in manufacturing over many years (OECD, 2008). Athukorala and Nasir
(2012) show how the manufacturing sector led to greater integration of Asian developing countries in GVCs
during 2000s as: “over the past four decades, the nature of world trade has been transformed by the
emergence of developing countries as major exporters of manufactured goods....manufacturing trade of
developing countries is heavily concentrated in developing Asia. Developing Asia’s share in world
manufacturing exports increased from 11.1% in 1996-97 to 33.8% in 2009-10.” China has become the
epicentre of GVCs in Asia (World Economic Forum, 2012; Banga, 2014) by producing and exporting varied
range of manufactured goods, particularly labour-intensive and electronics products. In fact, the most
successful yet complex international production and distribution networks have been established in the
machinery industry of East Asian and South-East Asian countries (Kimura & Ando, 2005; Ando, 2006;
Haddad, 2007; etc.). But South Asia remained one of the least integrated regions in GVCs because of high
exports of natural resources and services which are not used much for creating exports in other countries
(UNCTAD, 2013).
However, several countries particularly Asian have entered the GVCs by participating in textiles and
apparel value chains. A number of studies, namely, Gereffi (1999), Gereffi and Memedovic (2003), etc.
have accordingly been undertaken to understand how the advanced countries of West shifted their
production in textiles and apparel industry to developing Asian economies particularly since 1950s and how
this shift led to the industrial upgrading in these economies in later years. The study of East Asian model,
North American model, as well as Mexican and Caribbean Basin model show how and why the industrial
upgrading and innovation occurred in global apparel value chains (Gereffi & Memedovic, 2003). Gereffi,
Spencer and Bair (2002) particularly highlights how the apparel industry in North America developed and
how it impacted the job and wage level in different countries as well as mentions the changes in industry

Page 12 of 72
that occurred in the post-NAFTA period. Gereffi (1999) emphasized the role of retailers, marketers and
branded manufacturers in apparel industry. It also shows how the experience of industrial upgrading in Asia
can influence the apparel sourcing in North American commodity chains. Thus, textiles and apparels and
machinery have been the leading industries in the functioning of GVCs (Ando & Kimura 2005; Kimura,
2006). East Asia and South-East Asia have maintained highest participation in GVCs.
To summarize the changes mainly since 1970s-80s, the spread of GVCs has not just been a geographical
spread, but there have many qualitative transformations also which deal with where and how the production,
distribution and consumption of goods and services are taking place. As compared to the early 20th century
when there was a shallow integration in international economies with more of arm’s length trade
transactions, in the recent decades there has been deeper integration mainly due to rising intra-firm trade
which is organised in the complex global production networks (Dicken, 2011). A product came to be made
globally by various countries based on costs and quality considerations. Figure 2 illustrates the distinction
between trade of 20th century and 21st century (Baldwin, 2011; World Economic Forum, 2012). This is also
undergoing changes post-crisis period due to digitisation, which will be discussed further in this section.
Figure 2: 20th Century Trade (Upper Part) and 21st Century Trade (Lower Part)
Source: Reproduced from Baldwin (2011)
There is no particular trade model or theory which explains all the features of GVCs. At various points in
time, different theories have been developed describing formations of value chains. As development of
GVCs began in EA countries around 1950, followed by SEA countries, the theories till last decade largely
focused on the development and spread of value chains and production networks in these countries.
However, these theories also effectively explain the general working of value chains on the global platform.
At the same time, they have raised questions regarding traditional trade theories, namely, Ricardo's theory
of Comparative Advantage and Heckscher-Ohlin (HO) theorem which postulates that countries trade
finished products among themselves (Ando & Kimura, 2009). Ricardian theory states that the country has
comparative advantage in production of any commodity which it can produce at a lower opportunity costs
as compared to other countries. It specializes in the production of such commodity and exports this in
exchange for those commodities in which other countries have comparative advantage and its comparative
disadvantage is higher. Here, the differences in technologies were of crucial importance. However, H-O

Page 13 of 72
theorem assumed technology as same, but considers the differences in factor cost prices. The country
exports the products which use its abundant factors/ resources, while imports those products which use its
scarce factors. That is, the labour-abundant country produces and exports the products which require use
of labour-intensive techniques, and the capital-abundant country exports capital-intensive products. As per
these theories, trade is said to follow the typical pattern of North-South trade where developed countries of
North supply finished products to developing Southern countries in lieu of their primary products. But, this
has not been true in the current GVCs scenario.
The most prominent theory in explaining spread of GVCs has been the “Flying Geese Theory of
Development” which was formulated by Akamatsu Kaname in 1930s to show how the developing countries
may develop in a short span of time. This theory was set out in the context of Asian economies and its
importance started to grow after World War II. It was originally framed with regard to Japan’s clothing,
machine and tools industries. It was considered similar to the western theory of 1960s known as “Vernon
Product-Cycle Theory” which focused on how individual firm decides to locate its production facilities of
a particular product in its life cycle. This theory stipulated that there are three stages of product
development: new product, maturing product, and standardized product (Vernon, 1966). Advanced
countries develop new and innovative products and export them to other countries. When these products
become mature and get adapted in global markets, the advanced countries shift their production location to
other industrialized countries. Finally, when the stage of standardized product is reached, the production
location moves to developing countries. The products are then imported by the countries that initially
produced them. The theory thus presented how producers of developing countries could undertake
production of standardised products and become their exporters. But Vernon product life cycle theory had
a very micro-economic approach opposed to macro-economic approach of flying geese theory. This also
does not show how the economies could upgrade their development stages (Schroeppel and Mariko, 2002).
On the other hand, the flying geese theory of industrial development showed how less-advanced countries
develop in a short time-period after entering into the trade relations with advanced western countries. It
explained three sequential stages of development: imports, production and exports of manufactured goods.
That is, less-advanced countries import relevant labour-manufacturing industries from advanced countries
and start the production in home markets. These industries deal with low-value and simple items, including
labour-intensive textile goods or manufactured consumer goods. As domestic demand for consumer goods
rises in less-advanced countries, the required raw materials and technologies are imported. Over time,
capital goods such as machinery are also imported. As a result, a stage arrives when domestic goods
industry develops and starts to export. Imports start to fall over time in relation to higher rise in exports.
Meanwhile, indigenous production also begins for capital goods used in the manufacturing of domestic
consumer goods. When domestic consumer goods industry reaches to the standard of advanced countries,
its exports of consumer goods decline. Labour-intensive industries are then relocated to other less-advanced
countries. In the later stages, domestic industrialization in capital goods takes place leading to rise in their
exports. This way, one country leads the process of development by acting as ‘goose’ and triggers the
process of economic growth in other less-advanced countries (Figure 3). The curves of production and
exports move beyond the curves of imports in a lesser time in case of consumer and crude products as
compared to capital and refined products (Akamatsu, 1962; Korhonen, 1994; Schroeppel and Mariko,
2002).

Page 14 of 72
Figure 3: Process of Flying-Geese Theory of Development
Source: Reproduced from Akamatsu (1962)
The above theory explained the development of GVCs in Japan and other East Asian economies around
1960s and 1970s. But in the later years, when in machinery industry particularly, the production processes
became distributed among different countries, with parts and components being produced in one country,
and assembled or exported by another country, a new theory emerged in 1990s to explain the phenomenon,
which was the “Fragmentation Theory”. This was accompanied with emergence of a new wave of research
as “New Economic Geography” (originally put forward by Paul Krugman). These theories provided useful
explanation for understanding the IPNs developed in EA and SEA countries.
In original sense, fragmentation refers to the phenomenon where production processes of a firm are
separated into production blocks (PBs) and then relocated to far-flung regions which have varied locational
advantages, with the ultimate aim of reducing total costs of production. This concept was advocated by
Jones and Kierzkowski (1990) as explained in Figure 3, thereby assuming that a large factory was placed
(say, in an electronics industry) which integrates all the upstream and downstream production processes at
a single location, but these processes actually differ in terms of technologies, factor inputs requirements,
etc. which eventually makes their fragmentation inevitable (Kimura, 2009). All these fragmented PBs are
connected by service links (SL) costs, that is, all the costs relating to transportation, telecommunication,
coordination, etc.

Page 15 of 72
Figure 4: Simple Version of Fragmentation Theory
Source: Reproduced from Kimura (2009)
The above phenomenon is reflected in one of the well-known example of intra-firm fragmentation where
there has been cross-border production sharing between the U.S. and Mexico on the basis of lower wages
and SL costs in particular. The American firm had its affiliates located in Maquiladora (Mexico) which
assembles the parts/components, exported by parent firm to them, and then sends back the finished products
to the US headquarter. But this simple illustration could not capture highly sophisticated GPNs which
actually built up in East Asian countries where both the intra-firm as well as arm’s-length trade transactions
took place in a very complex manner (Kimura & Ando, 2005; Ando & Kimura, 2009). For better
understanding of these complexities in fragmentation activities, Kimura and Ando (2005) proposed the
concept of two-dimensional fragmentation (as depicted in Figure 5).
Figure 5: Two-Dimensional Fragmentation Theory
Source: Reproduced from Kimura and Ando (2005)

Page 16 of 72
The figure captures the original idea of fragmentation on the horizontal axis which was based on the
geographical distance of fragmented PBs (FPBs) which begins with original position and then relocation
within the domestic territory, until PBs cross the boundary of the nation as depicted by dotted line in the
middle of axis. After this point, the fragmentation becomes cross-border in nature. The vertical axis
represents controllability of a firm over fragmented PBs and dotted line in the middle of axis acts as
boundary of firm. Below this line, there is intra-firm fragmentation, which may occur within the country or
in different countries, and similarly, above the line there is arm’s length (inter-firm) fragmentation which
also could be domestic or cross-border (Kimura, 2009; Ando & Kimura, 2009). But all such kinds of
fragmentation are feasible only when total production costs reduce which is combination of production cost
per se and SL costs. To summarize, production costs per se decreases because of location advantages of the
place where FPB is located and counterpart’s ownership advantages. On the other hand, SL costs escalate
when there is rise in geographical distance and loss in controllability of corporate activities of a firm. It is
mentioned in the theory that SL costs in arm’s length transactions are very sensitive to geographical
distance, especially in case of products which require just-in-time system, and thus PBs are concentrated in
a particular geographical location and costs are saved. Thus, along with fragmentation, agglomerations are
also formed as happened in the case of East Asia.
Ando and Kimura (2009) argue that long-distance transactions are mainly intra-firm, while transactions in
local markets are predominantly arm’s length thereby reinforcing the creation of agglomeration. This
observation has been further supported by Kimura (2009) who brought out the concept of four layers
transactions in production/distribution networks, with respect to machinery industries, namely: 1st layer
(local); 2nd layer (sub-regional); 3rd layer (regional); and 4th layer (entire world). It is stipulated in the theory
that arm’s length transactions are predominant in the 1st layer (local), while intra-firm transactions occupy
a larger share in 3rd layer. Further, there are various factors affecting the choice of these transaction layers,
including network set-up costs, SL costs, and intimacy of inter-firm relationships. Geographical distance
remains a decisive factor, that is, short distance transactions are preferred when close monitoring and
communications are required.
The theory provided important insights about the development strategies that have been followed by
countries in which both the forces of fragmentation and agglomeration are successfully used. It stated that
a country at the early stage of development should join the GPNs by hosting production blocks (PBs) which
move out of congested agglomerations located in the neighbouring regions. The transactions by invited PBs
occur mostly in the second layer. But when developing countries reach higher stages of development, they
need to develop big industrial agglomerations, where transactions in the first layer become important. All
this was based in the local and regional context, but while connecting with counties outside a particular
region, long-distance transactions are essential which refers to the third layer.
Thus, industrial agglomerations are essentially important part of fragmentation theory as this helps to offer
more opportunities for local firms and entrepreneurs to penetrate into GPNs developed by MNEs, and also
foster transfer of technologies into the developing countries. To support the fragmentation theory, “New
Economic Geography theory” claimed that whenever the trade costs decline owing to various measures of
trade facilitation and development of logistic infrastructure, this may lead to either more concentration or
more dispersion of economic activities. Positive effects in fragmentation lead to concentration forces, as
mentioned above. But, negative agglomeration effects or congestion effects in industrial agglomerations
drive the dispersion forces as a result of which some of the economic activities located therein, typically
labour-intensive activities, initiate the process of searching for and moving to new production sites in the
peripheries (Figure 6). This is crucial from the perspective of lagging-behind countries or regions, as then

Page 17 of 72
they get the chance to attract PBs moving out of congested agglomerations, but the peripheries are required
to improve their investment climate and infrastructure facilities, along with existence of significant location
advantages and reduction in SL costs (Kimura & Obashi, 2009). The crux of this theory put forward by
Krugman (1991) states that “emergence of a core-periphery pattern depends on transportation costs,
economies of scale, and the share of manufacturing in national income.”
Figure 6: Agglomeration and Dispersion Forces
Source: Reproduced from Kimura and Obashi (2009)
However, increased fragmentation of economic activities in GVCs need to be managed and governed in a
particular manner so that the gains from trade are distributed evenly and developing countries could connect
with chains in a better manner (Gereffi, Humphrey, & Sturgeon, 2005; Humphrey & Schmitz, 2001).
Accordingly, the “Theory of GVCs Governance” was formulated in the mid-2000s, by Gereffi et al. (2005),
to show how different value chains are governed. It provides five types of GVCs governance structures,
namely, markets, modular, relational, captive and hierarchy, which are differentiated by degree of explicit
coordination and power asymmetry between the buyers and the suppliers in the value chains. The
conditions under which these structures would arise ultimately depends on three key variables: (i) the
complexity of information and knowledge transfer, relating mostly to product and process specifications,
in inter-firm transactions; (ii) the extent to which these complexity can be codified, that is, degree to which
such information and knowledge can be transmitted easily between various parties involved in the
transaction; and (iii) the capabilities of the supply-base, that is, whether actual and potential suppliers have
the required ability to meet the requirements of buyers in the transaction (Gereffi et al, 2005). Figure 7
shows various combinations of these factors determining governance of GVCs.
In case of markets structure, there are simple classic inter-firm transactions like in any market, where
exchanges are solely based on prices with very little interaction between buyers and sellers. When
codification ability moves to complex products, then comes the modular structure where suppliers are
competent enough to supply full packages, and there is greater interaction between lead firms, suppliers
and customers, as compared to market chains. Along with prices, other information also flows in high
volume in inter-firm linkages. In both the GVCs structures, the costs of switching to new partners are low.
In relational value chains structure, buyers and sellers exchange tacit knowledge with each other, and the
suppliers are extremely competent which forces lead firms to outsource. There is frequent face-to-face
interaction between the parties which require mutual trust and dependence which are generally regulated
through reputation, social and spatial proximity, family ties, etc. In this case, there are high costs involved
in switching to new partners.

Page 18 of 72
Figure 7: Factors Affecting GVCs Governance Structure
Source: Gereffi et al. (2005)
In case of captive value chains, products and specifications are complex, but suppliers’ competence is low
which require greater intervention by lead firms in the chains. Suppliers are captive in narrow range of
activities such as simple assembly; while lead firm concentrate on core activities of design, logistics, etc.,
but at the same time it provides enough resources and market access to suppliers and helps in upgrading of
their production capabilities. This way, supply chains of lead firms are strengthened. In hierarchy structure,
lead firms are vertically integrated undertaking all the manufacturing in-house. They control all the
resources and intellectual property and thus, tacit knowledge is exchanged between value chain activities
(see Figure 8). This type of GVCs structure characterises intra-firm trade where integration is basically
through FDI (Gereffi et al., 2005; Keane, 2014).
Figure 8: Theory of GVCs Governance Structure
Source: Gereffi et al. (2005)

Page 19 of 72
However, emerging economies face number of competitive pressures while integrating into GVCs. As a
result, the firms in these economies need to move to those activities in production and in services which
involve higher barriers to entry and provide greater rents (Kaplinsky & Morris, 2001; Humphrey & Schmitz,
2002). That is, they continuously tend to upgrade and deepen their capabilities in GVCs in order to reach
higher value added activities and acquire competitive market shares. Accordingly, Kaplinsky and Morris
(2001) identified the “Theory of Upgrading in GVCs”. The theory provides four trajectories which firms
in emerging economies must pursue for upgrading in value chains. These are - (i) process upgrading, which
means efficient transformation of the inputs into output using superior technologies; (ii) product upgrading,
which implies production of more sophisticated products or faster improvements in the existing products;
(iii) functional upgrading, which implies acquiring of new functions within a particular chain such as shift
from production activities to designing or marketing; (iv) chain upgrading, which means moving to a new
chain or new productive sectors such as shift from manufacturing of televisions to laptops (Gereffi,
Humphrey, Kaplinsky, & Sturgeon, 2001; Kaplinsky & Morris, 2001; Humphrey & Schmitz, 2002).
However, it is argued by Kaplinsky and Morris (2001) that there is hierarchy of upgrading in GVCs (see
Figure 9).
In other words, firms in developing countries mainly enter GVCs through simple activities of assembling
of parts or inputs provided by advanced countries. They initially indulge in improvement of processes as
part of upgrading. As their capabilities rise, they first move to manufacturing of products and later to the
functions of designing or marketing. That is, they build their own brands over time. As their knowledge
level and capabilities rises within a chain, they gradually move to a new chain. The value added content
emanating from disembodied activities rises as the firms move from one trajectory to another (Kaplinsky
& Morris, 2001; Kaplinsky, 2013).
Figure 9: Upgrading in GVCs
Source: Reproduced from Kaplinsky and Morris, 2001
The initial theories revolved around trade-nexus and then in around 1970s and 1980s, this shifted to trade-
investment nexus and in post 1990s, economic development is based on ‘trade-investment-services nexus’
(Baldwin, 2011; World Economic Forum, 2012), where along with the trade of intermediate inputs and
goods, foreign investments are effectively utilised and services are used to enhance production activities.
Recent theories are largely based on this nexus. However, Baldwin (2012) extended this to include
intellectual property (IP) rights, that is, "trade-investment-services-IP nexus”. This shows that trade is not
only restricted to parts and components, and overseas investments in different production processes,

Page 20 of 72
training, technology etc., but also in the use of various infrastructure and logistics services to coordinate
dispersed production activities, such as, telecom, internet, air cargo, finance for trade, custom clearances,
etc. Most importantly, 21st century trade encompasses flow of managerial and marketing know-how, that
is, formal IP and tacit knowledge, across the borders, and this is one of the decisive factors for value-added
gains from trade.
Importantly, Baldwin and Venables (2013) brought out new insights on the concepts of fragmentation,
offshoring and particularly new economic geography by developing “Theory of Snakes and Spiders”. It
explains how the fragmentation and offshoring actually takes place in the world economy and displays the
various forms that different GVCs take. On one hand, there are centrifugal forces based on differences in
international costs, owing to different factor intensities of different stages, which result in dispersion of
economic activities or unbundling; and on the other hand, there are co-location/ agglomeration forces or
centripetal forces which bind different activities together, based on existence of unbundling costs (costs of
coordination, management or shipping, etc.). These two forces interact with each other to decide where and
how different stages of production will be located. Location of and linkages between such stages ultimately
depend on the engineering of production process or technology, which distinguishes between two extremes
of production processes, that is, spiders and snakes (Figure 10).
Figure 10: Theory of Snakes and Spiders
Source: Baldwin and Venables (2013)
‘Snakes’ refers to a linear process where goods move in a particular sequence from upstream to downstream
and value added is done at each stage. But, when different parts come together for assembly, it is called
‘spider’, and this may not always be final product. Simple example to explain: process of raw cotton to
cotton yarn to cotton fabric to a cotton shirt is snake, while adding buttons to shirt is spider. That is, a
spider could be a part of snake, or different snakes may form one spider, and all the production processes
are combination of these two. That is, products in GVCs can undergo transformation at any stage. One of
the important implications from this theory has been that as costs of unbundling falls, initially offshoring
happens in a slow manner, but over time, it may move rapidly with relocation of key stage like of
assembling and of many parts producers. Offshoring is not a continuous process, but the interaction
between above mentioned forces leads to its overshooting. However, when advancement of ICT further
weakens co-location forces, the production of offshored parts tends to go back to its low-cost location, that
is, process of reshoring (Baldwin & Venables, 2013; Keane, 2014). This is what proliferation of digital
technologies (DT) and Industry 4.0 may lead to in next 4-5 years.

Page 21 of 72
To summarize, there has been famous Smiley Curve (Baldwin, 2012) to depict the changes in the value
chains which transformed drastically from 1970s to 21st century (Figure 11a).
Figure 11a: Traditional Smiley Curve of GVCs
Source: Reproduced from Baldwin (2012)
Initially, the smile was narrow showing that value added and gains generated by developing world were not
in much difference with those generated by developed countries. But, as GVCs have progressed, the smile
became very deep, where manufacturing activities came to be located at the bottom of the curve with least
share in total value added, while the activities of product design and R&D (pre-manufacturing) as well as
sales, marketing and after sales services (post-manufacturing) started to incur higher share of value-added
and gains as they get to be located at the extreme ends of value chains. Presence of higher-skilled workforce
and ultimate consumers required at these two stages has been easily traced in developed nations. However,
developing countries or LDCs have remained still largely stuck in the manufacturing and assembling stage,
offshored to them by developed countries. Banga (2013) argues that “if most of the rents in GVCs come
from shifting to services component of manufactured exports, developing countries may stand little chance
in maximizing gains through functional up-gradation in the value chains.” This has been major concern that
can affect the future growth of these countries in global production and trade (Baldwin, 2012; Banga, 2014).
Kaplinsky and Morris (2001) further postulated that value chains lead to creation of different types of
economic rents which arises due to possession of scarce factors and presence of high barriers to entry such
as in the form of IPRs, which are provide more rents to firms located in North (UNCTAD, 2018b). Over
the years, many developing countries have acquired greater competence in development of their industries.
But this has resulted into the decline of barriers to entry and escalation of competitive pressures in the case
of production activity. Thus, economic rents tend to be large in the pre- and post-production activities;
however, high entry barriers exist even in some activities with production chain. It has been argued that
higher rents mostly depend on firm’s control over disembodied or intangible activities in the GVCs
(Kaplinsky & Morris, 2001). However, the way now, after crisis, digital technologies (DT) are playing a
critical role in industrial production and accessing technologies, inviting investments, following standards,
etc. is definitely changing the shape of traditionally prepared smiley curve. Mayer (2018) presents much
refined smiley curve incorporating effects of digital economy (DE) given in Figure 11b. In this case,
production stage after factoring digitalisation includes effects of induistrial robots; pre-manufacturing
includes benefits of additive manufacturing/3D printing; while CAD/CAM technologies, Internet of Things

Page 22 of 72
(IoT) related technologies such as cloud computing, big data analytics, etc. are to be at all the three stages
of prior, post and during production. To explain, in post-manufacturing stage, use of such technologies can
raise effectiveness of production, logistics, management of inventory and of sales and after-sales services
due to higher and easy interaction bewteen firms and its customers. In pre-manufacturing stage, DTs can
help firms to make more flexible designs that too in limited time at lower costs. In manufacturng stage,
usage of robots can help to escalate products’ quality standards for lead firms located in advanced countries
where value chains of robotics is already advancing. As economies of North are said to be higher on DE
and AI thereby gaining higher value-added shares at higher ends, thus the smiley curve tends to become
deeper for North side post-DT. They also use strict standards and more advanced technologies and have
strong applicability of IPR. Also, they are likely to replace labour by developing more robots to compensate
the labour-intensive manuafcturing that has been offshored to developing nations in South, thus making
much more deep U as comapred to the traditional smiley curve. There is a large possibility to have
digitalization and robotization to remain largely confined to the developed world. On the other hand, much
flatter curve is expected than traditional smiley curve in the Southern hemisphere, with gains likely to
become lesser for them in the form of value added in pre- and post-production zones. That is, DE willl
revolutionise the maufacturing undertaken in value chains (UNCTAD, 2018b), where robotization has
already progressed much, especially since 2010, while additive manufacturing is growing rapidly but at
nascent stage. However, the question arises how far anticipated digitalised curve can resolve the exisitng
anxieties between the developed countries for de-industrialization and the developing coutnries having fear
of thin industrialization (Mayer, 2018), as depicted by traditional curve.
Figure 11b: Smiley Curve after factoring into Digital Economy aspects
Source: Re-produced from the study of Mayer (2018)
Importantly, UNCTAD (2018), Banga (2019a) show growing online trade of digitizable products, but also
widening ‘digital divide’ in the exports of manufacturing items between developed and developing
countries. WTO (2018) shows that due to technological breakthroughs, the share in global trade could rise
for latter. However, challenges are also greater for them (say, for India when compared with China) in
terms of weak digital infrastructure to support trade activities, low knowledge diffusion as well as capacities
in the field of digital economy, etc. (Banga, 2019b; UNCTAD, 2018). On the other hand, developed

Page 23 of 72
economies mainly US and EU have been able to invest heavily in advanced digital infrastructure which has
led to more usage of AI, robotics, IoT, remote additive manufacturing/3D printing, etc. This has helped
them to bring out innovative and efficient products and services at the global platform, improve just-in-
manufacturing and logistics costs (Meltzer, 2018).
Brynjolfsson, Hui, and Liu (2018) display some direct and growing effects of AI on productivity and
international trade activities. This has used the case of introducing AI-based eBay Machine Translation to
show rise in US exports on eBay by 17.5 per cent. On the other hand, Goldfarb and Trefler (2018), who
looks at various features of AI with respect to scale and knowledge creation, stress on greater need for
exploration in this new field to get full understanding of AI’s effect on trade. In short, existing literature
maps the future opportunities for growth and advancements in international trade due to AI. At the same
time, they highlight challenges that even developed countries are facing, for instance, greater protectionist
measures have prevented many big US firms (including Google, Amazon) from entering Chinese markets,
and this has in fact propelled China to develop high AI capabilities (Goldfarb & Trefler, 2018). On one
hand, AI is likely to create new industries as well as boost services-led economic growth (Meltzer, 2018).
WTO (2018) also shows impact in terms of lowering of trade costs, reallocation of production tasks from
labour to capital which is likely to increase income, as well as growing servicification process in
manufacturing by using more of ICT services.
Furthermore, Banga (2019b) also stresses that rising digitalization and application of AI can affect countries
at all the stages of value chains, that is, some existing GVCs could become obsolete, some may reorganize,
or some new ones may emerge. Smart manufacturing could be developed as a positive sign using highly
specialized pre- and post-production services (R&D, design, data analytics) with more specific participation
of countries (Meltzer, 2018). To summarize, Banga (2019b) highlights that “Even though reining in the
fast-growing super platforms and big tech firms is a challenge for developing countries, these platforms are
also opening access to new markets and exposing domestic consumers to new products and producers
through e-commerce. Further, digital technologies like robotics and 3D printing are increasingly being used
in the production stage. This is creating opportunities for developing countries to upgrade their position in
GVCs, as a higher amount of digital content can add value to their exports. However, it also heightens risk.”
On AI, this study shows rising investments and advancements by China along with US, while the same
being at a very low scale in developing countries like India. How well countries use the robots in industrial
production due to rising automation and AI technologies will be one of the major indicators of
manufacturing trade competitiveness in future, as highlighted by this study. Further, due to increasing
digital divide, the benefits of DT may be taken up by few winners. With respect to utilizing Industry 4.0,
“most governments are still in the early stages of developing policy frameworks, and international
coordination is similarly nascent.” (World Economic Forum, 2019). Meltzer (2018) presents that increased
automation could lead to greater job losses for low-skilled people and those in manufacturing line, which
in a way relates to the analysis of digitalized smiley curve as discussed by Mayer (2018). Research on this
area is yet to be fully explored particularly for developing nations, including India which is one of the
pioneers in the field of IT software and digital economy. In fact, Banga (2019c) show product upgradation
and earning of higher value-added in GVCs due to competence in digital technologies in the context of
Indian firms using empirical model. Baldwin (2019) mentions about digitally-driven trends of globalization
and robotics called as globotics which will help initially to increase income and standard of living but over
the years can lead to major disturbances on socio-economic fronts. There are also challenges to the
implementation of smart factories, despite benefits in terms of lowering of costs, better quality, etc., but all
this must be designed based on 3 guiding principles of “cultivating digital people, introducing agile
processes, and configuring modular technologies” so that production can be digitally transformed to lead
to a higher innovation path (Sjödin, Parida, Leksell & Petrovic, 2018).

Page 24 of 72
Thus, there is clearly growing nexus of trade-investment-services-IPR-digital technologies-automation/
Industry 4.0 as a next mark in the field of GVCs and a more formal theory is yet to be developed which can
suit all the regions mainly for Asian developing countries’ linkages. However, using case of developed
countries, Szalavetz (2019) provides one of the new theoretical framework as ‘DT-driven Upgrading in
GVCs’ which is extension of Upgrading in GVCs theory based on DT and Industry 4.0 revolution (Figure
12). This framework states that rising digitalization in manufacturing does help ‘factory economy actors’
or manufacturing firms in process and functional upgrading (by improving efficiency of production as well
as its related activities and by allowing suppliers to rise up to take higher-value added tasks or new
knowledge-based activities). While, use of DT allows lead firms to expedite the product upgrading (in terms
of development of new products), process upgrading (i.e., more efficiently deploying technologies and
using innovation even at core activities such as planning, designing, controlling chains through use of big
data, etc. along with production), and particularly chain upgrading (shifting to new activities or sectors via
invention of new economic models based on DT and due to servitisation). As a result, upgrading will happen
due to DT as per the framework, but “manufacturing subsidiaries and lead companies are poles apart
regarding the specifics of digitalisation-induced upgrading…manufacturing suppliers’ DT-driven
upgrading will not diminish the gap between lead companies and manufacturing subsidiaries in terms of
value generation.” (Szalavetz, 2019).
Figure 12: Framework to explain Theory of ‘DT-driven upgrading in GVCs’
Source: Reproduced from Szalavetz (2019)
4. Changing Policies of Asia as per Trends
This section analyses the policy changes in Asian economies even in post-crisis period to understand how
well foreign trade, investment and even industrial policies are revolving as per changing trends, patterns
and theoretical framework or empirical findings, as mentioned in previous sections. Importantly, this
reviews existing official policy documents of Asian countries, released by their governmental bodies, which
includes policies, plans, strategies and related documents (see Table 3).

Page 25 of 72
Table 3: Main Policy Documents of Asian countries post crisis
Country Documents Broad Objectives and Features
By South Asian Countries
India
Foreign trade policy of
India (2015-20)
Aimed at increasing India’s total exports to $900 billion by 2019-20 and raising share in world’s trade from 2 to 3.5
percent; Replaced multiple schemes and introduced two focused schemes of Merchandise Exports from India Scheme
(MEIS) and Service Exports from India Scheme (SEIS) for increasing exports of specified goods (high rewards for
items with high domestic value-added) and services, respectively. Features cover more benefits to special economic
zones (SEZs, reduction in Export obligations for domestic procurement of capital goods under Export Promotion Capital
Goods (EPCG) scheme, Paperless working in 24*7 environment, support to e-commerce exports for handlooms, books,
leather etc. through courier or foreign post offices; etc. Under policy regime, there has been introduction of Goods and
Services Tax (GST), boosting MEIS rewards for labour intensive MSME sectors, launching single window contact point
for exporters and importers (Contact@DGFT); creation of new Logistics Division, etc.
‘Make in India’ Initiative
and ‘Digital India’
To promote India as a manufacturing and investment hub with greater ease in doing business; To make India digitally
empowered with higher internet speed, electronics manufacturing and digital literacy.
Foreign trade policy of
India (2009-14)
Special initiatives like market diversification, technological upgradation, and in the field of green products and
technologies, and for exports from India’s North Eastern (NE) Region; number of schemes to boost exports as Focus
Product Scheme (FPS), Focus Market Scheme (FMS) and Market linked FPS with addition of 26 new markets.
Proposed New Industrial
Policy (Yet to be
released, likely to be in
2019-20)
Vision for enhancing role of industries in economic growth and enhancing India’s competitiveness on global platform;
Cover long and midterm strategies of establishing full GVCs in selected sunrise industries of food processing,
electronics, etc., promoting Indian brands globally with increased role of MSMEs and stable FDI regime to increase
domestic value addition in manufacturing activities, etc. That is, policy lists outcomes in terms of developing
ecosystem/action plan for adopting smart manufacturing, innovation, technology upgradation in line with Industry 4.0
changes in the world and for strengthening IT industry.
National Manufacturing
Policy, 2012 (to be
subsumed into the New
Industrial Policy, which
is yet to be released)
Aims to increase share of manufacturing sector in country’s GDP to 25% by end of 2022 thereby improving its global
competitiveness and promoting investments as well as creating about 100 million job opportunities.
Features: Industrial growth and development of infrastructure on PPP basis with involvement of State Government.
Setting up of National Investment & Manufacturing Zones (NIMZs) equipped with world-class infrastructure; Clean
technologies and facilities for skill development in order to provide conducive environment for new businesses in
manufacturing as well as boost exports.
Consolidated FDI Policy
(2017 and 2016 both)
For attracting more FDI into the country to support skills development; technology acquisition or upgradation and
domestic base of domestic capital and to enhance India’s economic growth level. Prescribes general and specific rules
for government approval on FDI (recent policy includes more liberalised rules).
Science, Technology and
Innovation Policy, 2013
Aims to link science, technology and innovation systems with economic agendas and set up world-class R&D
infrastructure to emerge as the top leader in the field by 2020.
Afghanistan
IT Industry Development
Policy, 2015-2020
Vision to develop a sustainable IT/ITeS industry in Afghanistan to create more wealth and job opportunities; seeks to
boost domestic IT software /hardware products and services by building skilled workforce as well as by reinforcing
national institutions in line with WTO to adopt global best practices.

Page 26 of 72
Aims “to ensure that all public sector procurements are made through domestic market software and hardware
developers, manufacturers, assemblers and service providers, within the parameters of the international trade
agreements.” Covers measures of improving infrastructure, covering skill gap in IT industry, enhancing skill levels,
providing better regulatory framework, and for removing obstacles of low internet connectivity, lack of funds, etc.
Afghanistan
National
Peace And
Development
Framework
(ANPDF)
2017 to 2021 – (covers
features of trade and
investment policy)
One of the goals include “making Afghanistan an attractive trans-Asia shipment hub; diversifying export routes; and
improving security by enhancing confidence and mutual benefit from stable trade.” Guides in building productive and
self-reliant economy to make country exporters of many industrial goods to regional as well as global markets.
Outlines step for increasing foreign investments, enabling higher growth of SMES, and promoting domestic investments
in physical infrastructure, human capital as well as technologies, supporting industrial parks, advancing RTAs and FTAs
and associations with other regions and their organizations and prospects of joining the projects such as OBOR, making
accessible easily the trade support services, strengthening logistics, etc.
National Export strategy,
2018-22
Main action plan document to promote growth in export sector of the country; gives sector-specific measures for selected
priority industries in terms of increasing production and competitiveness in international markets; Gives roadmap of
improving capacities of traditional sectors, reducing reliance on imports and gradual diversification of exports with
more value-added components; covering strategies for easy access to technology, quality inputs, land, etc., better
coordination among different sectoral based value chains with improved business climate, skills, and compliance with
international level standards; Also includes action plan for strengthening trade support services, access to finance, etc.
Bangladesh
Export Policy 2015-2018
Aimed to increase country’s export earnings to US$ 60 billion by 2021; to increase access to market and diversify export
basket; invite FDI in export-oriented industries and promote Bangladeshi products as brands; encourage production of
traditional labor-intensive products; liberalize trade regime as per WTO; improve infrastructure, port capacities and
upgrade the testing facilities as per international standards, increase stake of ICT and other services, produce high quality
and higher-value added products for exports, encourage usage of world-class environment-friendly technologies,
enhance linkages with other South Asia with special initiatives for exports to them and to other Asian countries.
Identified high-priority sectors for exports; upgrade export base, policy focusses on electronics, ceramic products, light
engineering ones, value added processed marine products, silk, rubber, paper and coir products, handloom and
handicrafts, tourism, and consultancy services.
Export Policy 2018-21
(has been approved by
the cabinet but not yet
published)
Draft policy aims to enhance Bangladesh’s trade role in global markets and make its exports more competitive and
dynamic with focus on high-end products such as denim, active pharmaceutical ingredients, etc.
Import Policy 2015-2018 Focused on easing out imports of raw materials for use in exports purposes, provided rules for mentioning of country
of origin on packaging of products as well as lists out new rules for prohibited/restricted imports.
Outline Perspective Plan
of Bangladesh (2010-
Visionary plan for promoting industrialization and digitalization in Bangladesh by 2021 with the target of reaching 10
percent annual GDP growth by 2021, increasing competitiveness of manufacturing sector in international markets
with measures of product and market diversification, capturing opportunities in production GVCs and in low-cost

Page 27 of 72
2021): Making Vision
2021 A Reality’ (basic
document for National
Industrial Policy 2016)
labour-intensive industries; simulating flow of inward FDI; expanding ICT usage along with science and technology;
etc.
Pakistan
Investment Policy, 2013-
2018
To build conducive climate for doing business in Pakistan with reduction in costs, attracting more FDI, and promoting
ease of doing business and more linking with trade and industrial policies.
Trade Related Investment
Policy Framework 2015-
23
Draft framework aims to “attract investment in export-oriented manufacturing; to make the manufacturing sector more
competitive in the international market as well as to enable domestic industries integrate into the global and regional
value chains.
New Industrial Policy,
2018 by Pakistan
Business Council (PBC)
This policy seeks to “promote employment, value-added exports and import substitution” in order to reverse
deindustrialization and promote ‘Make-in-Pakistan’.
Digital Pakistan Policy,
2018
Vision to become a strategic enabler for an accelerated digitization eco system to expand the knowledge based
economy and spur socio- economic growth”; Aims to promote sector-wise digitalization and e-commerce, increase
exports of IT products, promote Inward FDI therein, accelerate adoption of new IT technologies including AI, IoT,
cloud computing, etc. Involving educating youth, opening innovation centres, etc.
Strategic Trade Policy
Framework 2015-18 and
STPF 2018-23 (Not yet
released)
Aimed to enhance annual exports to US$ 35 Billion; improve export competitiveness; transition from “factor-driven”
economy to “efficiency-driven” and “innovation-driven” economy; increase share in regional trade”; with focus on
features of diversification, market access, trade facilitation, etc.
To further increase exports above US$40 billion mark, the new framework is yet to be released.
Sri Lanka
Vision 2025 Aim to transform the country as the “export-oriented economic hub at the centre of the Indian Ocean” with
competitive and rich economy.
National Export Strategy
of Sri Lanka 2018-2022
Provides a clear map to promote faster export growth to make Sri Lanka hub in the field with improved and
transparent business policies, predictable environment, focus on trade facilitation and efficient logistics, export
diversification via innovation and entrepreneurship with emphasis on sectors like IT, wellness tourism,
electronics/electrical goods, processed food, spices, etc.
Aims to transform Sri Lanka into hub for high value-added exports, as well as to transform the country with rapid
economic development by 2025 as well as with New Trade Policy. Focus is on skills and job creation, attracting
investments, integrating SMEs into GVCs, etc.
New Trade Policy, 2017
Aimed to liberalize trade regime with rationalisation of tariff and non-tariff barriers’ stimulating FDI flows; better
foreign market access; improving trade facilitation with more economic integration; harmonisation in trade
processes/documents via digitalization; increasing capacity of domestic firms to export and compete globally with
special focus on SMEs; creating more jobs with help of trade growth in the country; upgrading R&D activities, etc.
Bhutan Economic Development
Policy 2016
Aims to become self-reliant by 2020 by promoting its organic brand; objective to “increase and diversify exports,
promote industries that build the Brand Bhutan image.”; development of business and ICT infrastructure and
encourage of investments.

Page 28 of 72
Nepal
Nepal Trade Integration
Strategy (NTIS) 2016
Aimed to increase share of trade in country’s growth with exports promotion, to make conducive environment;
emphasis on product development; strengthening of institutional capacity and infrastructure.
Identified priority Export Potential Sectors as agro-based, craft and manufacturing-based (textiles, footwear and
leather), and services (IT and tourism)
Trade policy 2015
Aimed at promoting trade-led growth in Nepal in alignment with NTIS.
Focus on promotion of exports with the aim “to strengthen supply-side capacity, and minimize trade deficit by
increasing exports of value-added competitive products and services in the world market; to enhance access of goods,
services and intellectual property to regional and world markets.”
Seeks to increase accesses to Nepalese goods as well competitiveness in exportable services and their linkages in
RVCs and GVCs.
Industrial Policy 2010
(new policy did not came
in public domain after
2010)
Provided for industrial development with increased exports of manufacturing goods by enhancing their quality and
competitiveness, protect IPRs and become attractive for getting investments in the country.
East Asian Countries
China
Made in China 2025
Umbrella scheme of Chinese Government with focus on rapid and vigorous development and advancements in ten areas
or industries, namely, new generation of IT industry (with efforts to improve designs of ICT equipment, master high-
tech core technologies in computing and communication), high-end machine tools and robots (including AI and
machinery learning, etc.), aerospace equipment, Marine engineering equipment along with high-tech ships, rail transit
equipment, energy saving/new energy vehicles, power equipment, agricultural machinery, new materials, and
biomedical and high-performance based medical devices.; Provide roadmap on improving China’s industrial capabilities
and competitiveness with focus on smart manufacturing, innovation, use of AI, robotics, etc.,
Objective to make China as manufacturing power by 2025 but enter the middle level of global manufacturing powers
by 2035. The plan aims that: ‘by 2020, 40% of core infrastructure components and key infrastructure materials will be
guaranteed independently, and By 2025, 70% of the core basic components and key basic materials will be
independently guaranteed, and 80 kinds of iconic advanced technologies will be promoted and applied.” Among number
of objectives, the plan seeks to “innovate the processing trade model, extend the domestic value-added chain of
processing trade, and promote the transformation and upgrading of processing trade.” The plan aims to formulate
‘intelligent manufacturing technology’ standards.
Foreign Investment Law
of China
Effective from January 2020 to provide feature of ‘pre-establishment national treatment’, ‘negative list management’
for foreign investments, and rules for protection of IPRs of foreign investors.
New Generation of
Artificial Intelligence
Development Plan
Objective to bring China on the forefront of innovative economic centre of the world; to develop new generation of
artificial intelligence theories, keeping at global level its technology system and applications, and to develop the
industry into the high-end GVCs.
Japan
Japan Revitalisation
Strategy - Toward the
Strategy to achieve target of GDP of 600 trillion yen; revolutionizing productivity, promoting investments in
technologies and innovation for promotion of fourth industrial revolution along with consideration of Society 5.0
strategy and redesigning institutional system and R&D promotion in the wake of IoT and AI (covering measures such

Page 29 of 72
Fourth Industrial
Revolution, 2016
as developing infrastructure and workforce for the same); creation high-quality health care industries using AI, IoT and
new strategies for robot utilization;
objectives to capture international markets and inviting FDI, expansion of infrastructure for exports and promotion of
cool Japan initiatives in the field of public-private partnerships, as well as promotion of Reform 2020 (covering next-
generation systems for transportation, robotics, automatic driving technologies, etc.) and promotion of local Abenomics
including improvement in services industry, enhancement in agricultural reforms, etc.
Japan Revitalisation
Strategy-Japan is Back,
2013
Plan for revitalization or strengthening of Japanese industrial base, strengthening business competitiveness even for
special zones, emerging as IT-led society, and reforming employment structure’;
Plan for creation of new markets with strategies for building next-generation and economical infrastructure set up; and
plan for expanded global outreach which included features of developing and promote economic relations and
cooperation via regional trade agreement such as TPP, RCEP, and encourage domestic globalization including inward
investments
Growth Strategy, 2019 To revamp Japan’s socio-economic system by utilizing general purpose technologies
Foreign Investment
Strategy 2018
To widen the scope of growth strategies and implement the measures under New Economic Policy package which are
also on same lines of promoting Industry 4.0, Society 5.0 and use of digital technologies including AI, etc. Included
features such as increasing efficiency of investments, promoting them in next generation computing and digital
technologies (viz. edge-processing ones incorporating AI chips).
New Economic Policy
Package, 2017
Promote two agenda of ‘supply system innovation’ by implanting Society 5.0, and investments of SMEs and ‘human
resources development revolution’ by 2020 which will boost productivity through use of AI, IoT, etc.
Korea “Plan for the Fourth
Industrial Revolution,
2017
Aims to create diverse new industries through intelligent technology innovation and strengthen major industries; secure
world-class intelligent technologies, data, and networks accessible to all.
Government has brought I-Korea 4.0 as policy brand to further development in fourth industrial revolution with focus
on ‘intelligence, innovation, inclusiveness, and interaction’.
South-East Asian Countries
Singapore
Report of the Committee
on the Future Economy,
2017
Outlines strategies such as to “deepen and diversify our international connections; acquire and utilise deep skills;
strengthen enterprise capabilities to innovate and scale up; build strong digital capabilities; develop and implement
Industry Transformation Maps (ITMs); and Partner each other to enable innovation and growth.” for higher growth.
Research Innovation
Enterprise 2020 Plan
(released in 2016) -
Plan to continue commitment to research, innovation and enterprise to speed up economic growth, with focus on
strategic domains: Advanced Manufacturing and Engineering (AME) covering robotics, digital manufacturing,
automation, additive manufacturing, etc.; Services and Digital Economy covering AI and machine learning.
Myanmar
Myanmar Investment
Promotion Plan 2016/17 -
2035/36
Aim to attain quality investments in Myanmar to become middle-income country by 2030 with focus on improved
business climate, higher industrial linkages, etc., and investments in export-oriented industries in first growth path.
Myanmar Sustainable
Development Plan (2018
– 2030)
Aim at overall development of all sectors using economic model mainly manufacturing and for greater exports.
Strategies include “reform trade sector and strengthen regional and international cooperation and linkages”; creating

Page 30 of 72
value chains and linking with buyers; enhancing linkages of domestic firms in RVCs/GVCs as well as improving
custom procedures, regulations and logistic services.
National Export Strategy
2015-2019 (first plan
ever)
Aimed at quality infrastructure and recognition of country’s products nationally and globally; strategies to renew
standards and non-tariff measures as per international levels; upgrading trade facilitation regulations, etc.
National Export Strategy
2020-2025 (to be
formally released)
Aimed to boost Myanmar’s exports for regional as well as global markets; encourage growth of MSMEs in new agro-
processing sector, and gaining competitiveness constraints and improve efficiency of regulations with modernization.
Myanmar Industrial
Development Vision:
Next Frontier in Asia:
Factory, Farm, and
Fashion (2015)
Aimed for industrial development; expansion of international connectivity and strategy to get more foreign capital
(with focus high-value added items in the field of agriculture, fishery and forestry)
Cambodia
Rectangular Strategy
for Growth,
Employment, Equity and
Efficiency: Building the
Foundation toward
Realizing the Cambodia
Vision 2050 (2018)
Covers key aspect of ‘Economic Diversification’ with features of “improving logistics system and enhancing transport,
energy and digital connectivity; developing key and new sources of economic growth; readiness for digital economy
and industrial revolution 4.0” (involving further implanting of Further implementing Cambodia Industrial Development
Policy 2015-2025, attracting more investments even in SEZ and building required physical and digital infrastructure).
Cambodia Industrial
Development Policy
2015 – 2025)
Objective of building market-oriented industrial economy with the vision of “transformation and modernization of
Cambodia's industrial structure from a labor-intensive industry to a skill-based industry by 2025; Linking with GVCs;
integrating into regional production networks and developing clusters while strengthening competitiveness and
improving productivity of domestic industries; and marching towards developing a modern technology and knowledge
based industry.”
Law On The Investment
Of The Kingdom Of
Cambodia, 1994
Provides rules for encouraging investments in High technology, agro and, export-oriented industries and in, Special
Promotion Zones, Physical infrastructure and energy, etc.; Treating FDIs in a non-discriminatory manner except for
land-ownership; and allowed to invest freely in many areas. Current Law on Investment provides incentives to the
investors, who are given Final Registration Certificates,; and improvement in investment facilitation services.”
Philippines
Development Plan, 2017-
22
Covered objectives of making the country as upper middle-income by 2022; focus on easy assessing economic
opportunities from both domestic and foreign markets (features of strengthening value chains, stimulating FDI,
strengthening backbone services of transport, logistics, financial, telecom, etc., improve competitiveness and
resilience of both industry and services sectors with focus on boosting exports; trade facilitation with more linkages
and expansion of products and markets to boost Philippines exports mainly of high quality goods and services).
Innovation, using global practices and deploying better ICT infrastructure.
Development Plan, 2014-
16
Strived to achieve highly-competitive and innovative industrial and services sectors at the global level with more
value-added, exports and ability to create employment.

Page 31 of 72
Malaysia Eleventh Malaysia Plan
2016-2020: anchoring
growth on people
Aims to make Malaysia an advanced country with focus on strengthening macroeconomic resilience; accelerating
human capital; building infrastructure and re-engineering economic growth (covering moving of economic sectors to
become more knowledge based with high value-added component and diversification in manufacturing, and inclusion
of ICT in services), and enhancing exports growth and balance of trade, and moving up GVCs, etc.
Thailand
The Twelfth National
Economic And Social
Development Plan (2017-
2021)
Objective “to promote an economy that is strong, competitive, stable, and sustainable. Aims to strengthen existing
production and service bases as well as develop new ones by using intensive innovation; to strengthen the connectivity
between Thailand and other countries; to promote Thailand as a leading actor in trade, services, and investment within
sub-regional, regional, and international collaboration frameworks.”; promotion of investments in technology and R&D
including in digital technologies like AI/IoT, and in high industries such as of robotics; creating new value-added
economy with focus on upgrading manufacturing activities base along with services sector.
Thailand 4.0Policy To create a ‘new value-based economy’ with focus on innovation and on industries namely bio fuels, digital economy,
medical hub, automation and robotics, aviation and logistics.
Vietnam
Vietnam’s Socio-
Economic Development
Strategy For the Period
OF 2011-2020
Aim to build modern industrial society with improved production in technical and economic areas with higher share of
domestic value added and usage of science and technologies.
Gives priority to the development of products which have competitive advantage and possibility to join in the
production network and global value chain in such industries as high technology, mechanics, information and
communications technology, and pharmaceuticals.
National digital
transformation scheme
2019 (to be launched) -
Aim to transform Vietnam into a digital economy by 2030 (covers features of building digital infrastructure,
digitalising industries including SMES, developing digital ecosystem for value chains, etc.)
Overall strategy for
international integration
through 2020, vision to
2030 (approved in 2016)
Aims to transform Vietnam into industrialized nation with aim of expanding markets; more integration within
ASEAN using more of technology and knowledge, fast development of domestic industries and firms and placing
country higher in RVCs/GVCs.
Strategy on exports and
imports for 2011-2020,
with visions to 2030
Aims to enhance competitiveness in both exports and imports and make country more integrated into GVCs with
becoming “self-reliant in international economic integration”; exploit Vietnam’s comparative advantages to improve
production capacities mainly for exports; diversify products and markets and increase the share of higher value-added
items in export including highly processed or high-tech and environmentally friendly items.
Strategy aim to shift structure of the economy toward industrialization with balance of trade and creation of more jobs.
Industrial Development
Strategy through 2025,
vision toward 2035
(signed in 2014)
Aims to develop and revamp country’s industrial sector using all domestic and external resources with development of
skilled workforce and to prioritize the development and transfer of technologies in the industrial sub-sectors and fields
with competitive advantages and modern and advanced technologies such as agricultural, forestry and fishery product
processing, electronics, telecommunications, new and renewable energy, mechanical engineering, and pharmaceutical
chemistry.

Page 32 of 72
To promote greater linkages of production activities with services and trade for deeper participation in GVCs. One of
the targets is: “annual growth rate of industrial added value will reach 6.5-7.0% by 2020, 7.0-7.5% during 2021 -
2025, and 7.5-8.0% during 2026 - 2035.”
Indonesia Long-Term National
Development Plan Of
Indonesia (RPJPN),
2005-2025
Making nation competitiveness with objectives like “strengthening the domestic economy with a global Orientation
and competitiveness”, with increased usage of S&T, innovation and building of advanced infrastructure, and promote
foreign investments.
Sources: The information is collected from country’s official government documents (AEC, 2019; Government of Sri Lanka 2018; Board of Investment,
Government of Pakistan, 2013; Cabinet Secretariat, Government of Japan 2013; Cabinet Secretariat, Government of Japan, 2016; Cabinet Secretariat, Government
of Japan, 2017; Cabinet Secretariat, Government of Japan, 2019; CFE, 2017; DIPP, 2011; DIPP, 2017; Economic Planning Unit, Prime Minister’s Department of
Malaysia, 2015; Export.gov, 2018; Government of Vietnam, 2011; Government of Vietnam, 2014; Government of Vietnam, 2016; Library of Congress, 2019;
Mayer, J., 2018; Ministry of Commerce & Textile, 2018; Ministry of Commerce and Industry, Government of India, 2009; Ministry of Commerce and Industry,
Government of India, 2015; Ministry of Commerce and Industry, Government of India, 2016; Ministry of Commerce and Industry, Government of India, 2017;
Ministry of Commerce, Government of Nepal, 2015; Ministry of Commerce, Government of Nepal, 2016; Ministry of Commerce, Government of the People's
Republic of Bangladesh, 2015; Ministry of Commerce, Government of the People's Republic of Bangladesh, 2016; Ministry of Commerce, Government of Pakistan,
2016; Ministry of Commerce, 2015; Ministry of Communications and IT, Government of the Islamic Republic of Afghanistan, 2015; Ministry of Economy, Trade
and Industry, 2015; Ministry of Electronics and Information Technology, Government of India, 2018; Ministry of Finance, Government of the Islamic Republic of
Afghanistan, 2016; Ministry of Industry and Commerce, Government of the Islamic Republic of Afghanistan, 2018; Ministry of Industry and Handicraft, 2015;
Ministry of Industry, Government of Nepal, 2010; Ministry of Information and Communication, Government of Vietnam, 2019; Ministry of IT & Telecom,
Government of Pakistan, 2018; Ministry of Planning and Finance, 2018; Ministry of Planning and Investment, Government of Vietnam, 2011; Ministry of Science
and Technology, Government of India, 2013; MODSIT, 2017; MOEA, 2016; Myanmar Investment Commission, 2018; National Development Planning Agency,
Government of Indonesia, 2007; NEDA, 2017; NESDB, Government of Thailand, 2017; New Age, 2018; NRF, 2016; Pakistan Business Council, 2018; PCFIR,
2017; Planning Commission, Government of the People's Republic of Bangladesh, 2012; Prime Minister’s Office, Sri Lanka, 2017; RGC, 2018; State Council,
China, 2017; Thailand Board of Investment, 2018; The National Assembly, Kingdom of Cambodia, 1994; Towel Manufacturers’ Association of Pakistan, 2018)

Page 33 of 72
The first observation is that major countries of EA have reinvented their trade and industrial policies for
revival of their economy and to rise up the GVCs ladder, post-crisis period but mainly after 2012 when
reforms actually kicked up in order to boost domestic industrialization. This may have resulted in a decline
in overall exports of many countries since 2013. For instance, Japan, which has been the facilitator of supply
chains in EA has been witnessing stagnation in its economic growth since 80s and 90s, along with ageing
population, falling workforce coupled with prolonged deflation and restrictions of investments even in
R&D. Post crisis, in 2013, Japan had to come up with ‘Japan Revitalization Strategy-Japan is Back’ to
restore its economic growth which is now planned to be driven by technologies and also to promote the
‘Made by Japan’ initiative. This covered features related to the restructuring of industrial base, including
development of SMEs through innovation and emerging IT usage platform as well as increasing access to
many international markets and attracting more investments. The strategy has been revised over the years,
before bringing out more comprehensive one in 2016 as ‘second stage of growth strategy’ majorly covering
features of Industry 4.0 and big data analytics and AI for overall better economic growth of Japan across
all the sectors: manufacturing, services and agriculture (see Table 3). This was also prepared keep in mind
continuous stagnation in global demand and growth even in major developing countries including China.
Further, Japanese Government has developed the ‘Action plan for the Growth Strategy’ of 2019 along with
‘Future Investment Strategy’ of 2018 to overhaul country’s socio-economic system, improve productivity,
etc. by fully utilizing potential of general purpose technology (GPT) covering AI, IoT, robots, big data,
block chain, and other DT relating to Fourth Industrial Revolution, etc. along with realizing full potential
of Society 5.0 by improving rules for digital markets. Second, on trade fronts, China’s policies have been
orienting towards promotion of domestic value added content in gross exports and reduction on dependence
of imported inputs. Hence, China launched most strategic action plan in 2015 of ‘Made in China’ which
guides how Chinese manufacturing sector can be made strong internally and on international level. The
idea has been to move towards producing high-value added products and services and escalating
manufacturing further up in the value chains. Similarly, in 2017, ‘New Generation of Artificial Intelligence
Development Plan’ has been issued to capture growing opportunities in AI development with the aim to
“build China's first-mover advantage in artificial intelligence development”. Both of these documents have
been focused on usage of Industry 4.0 and AI technologies in developing China as a manufacturing power.
In order to strengthen trade, investment and infrastructure set up, China proposed One Belt One Road
(OBOR) in 2013 to promote increased cooperation and connectivity mainly among the countries in
European and Asian continents, and primarily to emerge as dominant economic bloc. This is definitely an
opportunity for other developing countries of Asia in terms of boosting their capital levels, improving
infrastructure along with IT development (UNESCAP, 2018). Further, Korea too has brought inclusive
policy for Industry 4.0.
That is, due to wide apprehension for slowing down of Chinese-centered GVCs and even in other EA, there
has been fear in such countries for stagnation and losing major share in trade and already established GVCs.
Such reasons might have pushed them to launch major policies to match the changes that are taking place
in many advanced countries such as US and of Europe and acquire at par niche in DT and automation, and
to remain dominant power in manufacturing sector with upgraded GVCs and rising servitisation.
Such efforts are also underway in many SEA countries, where many of them are coming up with broad
development plans and strategy, viz. by Indonesia, Vietnam, Myanmar, Philippines, Singapore, etc., to
boost exports, achieve higher GVCs integration with more domestic value added component and industrial
competitiveness, more FDI, along with huge consideration of resolving social factors like poverty,
enrichment of human resources, strengthening innovation as well as scientific ecosystem, skill and
infrastructure development, better ICT usage, etc. That is, these countries currently do not provide formal
and exclusive trade policy or FDI policy or even industrial policy, rather focus on overall development and

Page 34 of 72
improved income level among different countries with the vision up to certain time period say 2020, 2025
or 2030, such as Myanmar’s aim to rise to middle-income country level by 2030, Malaysia’s aim to become
advanced country, and Philippines’s aim to become upper middle-income group country by 2022. In fact,
Philippines’ policies of trade now focus on improving bilateral relations, also with non-traditional partners,
via preferential schemes, use of free trade agreements, etc. with strategies such as “promote utilization of
PH-EFTA FTA, maximize opportunities in the US and EU GSP/+ schemes.” (Rodolfo, 2018). This is also
the strategy of many other SEA economies such as Vietnam.
Some of SEA countries have also included ambitious strategies to consider factors of changing digital
economy aspects and even of Industry 4.0 in their plans, such as, by Singapore, Thailand and even readiness
for the same in case of Cambodia. SEA thus do not desire to be left out in the changing times with their
own pattern of development with consideration of socio-economic as well as environmental aspects, which
in a way is quite diverse than policy announcements by EA countries.
Third observation is that for many developing countries in SA, post-crisis period saw emergence of
dedicated trade policies to boost exports and their share in world trade rather than to directly plunge in the
pond of vastly growing fourth industrial revolution and AI/IoT. In fact some of the countries embarked on
such measures even before crisis, due to following of multiple strategies, but the actual effect took off only
after crisis. For instance, India followed inward-looking import-substitution policy with suspicion towards
export-led growth during 50s-60s, and then to export promotion measures 1980s along with greater import
liberalization and then to liberalization and globalization reforms 1990s before launching Foreign Trade
Policy (FTP) of 2004-09 as first-integrated policy. This FTP aimed to double India’s share in global
merchandise trade by end of the policy period and lead towards trade-led growth and employment. This has
been the major announcement due to more focused strategies for liberating controls, simplifying costs and
procedures, giving attention to different ‘special focus areas’ so as to make India a global trade hub. This
included special initiatives for traditional sectors namely agriculture, handicrafts, handlooms, gems and
jewellery, and leather and footwear, and even the IT hardware and sports goods. A special feature was
encouragement to services exports. However, it was since crisis period that India more actively looked
through opportunities and modifying its policies to support domestic industries and export competitiveness.
2009-14 FTP was much diversified due to the need of the hour in wake of recessionary trends which started
out with immediate goals so that the economy remains resilient and well-protected and can resolve adverse
effects due to declining demand in traditional markets. That is, FTP set out the target of 15 percent annual
growth for first two years so that exports could reach $200 billion by end of fiscal year 2010-11. This
further postulated 25 percent annual growth rate in the remaining years. Focus areas to achieve targets in
2009-14 policy were improved infrastructure, lowering of transaction costs and full refund of indirect taxes.
In fact, seed for doubling India’s trade share in world market by 2020 have been sown in this policy, which
was carried further in FTP 2015-20. The latter has however been more visionary in nature by clubbing
number of initiatives into few targeted schemes and focusing on advancement in entire trade. This policy
came to overcome the concern of India’s declining exports since 2013. Major focus areas have been trade
facilitation in both manufacturing and services sectors, and ease of doing business, along with stress on
industrial growth, infrastructure, IT and communication, skill development and employment creation (that
is, connecting all initiatives of Make in India, Skill India and Digital India). The policy also mentions about
increasing domestic value addition and linking in GVCs and/or leading RVCs in sectors like textiles,
pharmaceuticals, auto-components, etc. Owing to such efforts, India’s Doing Business rank upgraded from
130 in 2016 to 77 in 2018 (highest reached by a large country after 2011) (World Bank 2018, 2019) mainly
on aspects of dealing with construction permits, trading across borders, starting a business, getting credits,
etc. To further facilitate Make in India, Government in 2019 budget has introduced comprehensive
digitalization system of export/import transactions and electronic tagging RFID technology to improve

Page 35 of 72
export logistics. In fact, in Logistics Performance Index, India’s position has improved from 54 in 2014 to
44 in 2018, which is likely to increase India’s export competitiveness (World Bank 2018a). It is ascertained
that the logistic sector in India is to be about USD 215 billion in 2019-20 with annual growth rate of more
than 10%. However, still there is a long way to go as the sector is not yet well developed and much-efficient
in India (the rank declined from 35 in 2016). But this is the necessary segment to resolve as with the decline
of 10 percent in indirect logistics costs, Indian exports could rise in the range of 5-8 per cent (Ministry of
Finance, 2018). India had already ratified WTO’s Trade Facilitation Act (TFA) in 2016 to streamline
movement, release and clearance of goods, simplify custom procedures and to connect with GVCs.
Nevertheless, unlike Japan and China, Indian trade policies still do not grasp the usage of Industry 4.0 and
AI and robotization. Although India’s FDI policies show liberalization in many sectors post-crisis, but wait
is for the release of New Industry Policy which will be centered on Make in India initiative, smart
manufacturing digitalization and usage of certain features of Industry 4.0, linking into GVCs even for
MSMEs, innovation and balanced FDI policy regime.
Regarding other SA countries, efforts have been initiated since the last 4-5 years to bring focused export
policies along with IT or industrial policy to strengthen domestic markets at least in traditional industries,
as well as garnering upgraded shares in high-end industries. Trade facilitation, export diversification,
building institutional capacity and improving infrastructural set up have been their key strategies. The
primary aim of such policy announcements has been to improve connectivity with foreign markets
particularly for capturing rising share in regional or global value chains, and attracting higher FDI inflows.
Such countries largely include Bangladesh, Nepal, Pakistan, and Sri Lanka.
Further, Pakistan’s Digital Policy seeks to adopt to DT such as AI. Even Afghanistan through its Draft IT
policy seeks to achieve the objective of realizing full potential of IT infrastructure for development
purposes. Sri Lanka is too keen on leveraging trade-investment nexus with India, China, Singapore, etc. via
exploring free trade agreements (FTAs), along with gaining better role in OBOR project along with
infrastructure development efforts (Hewage, 2017). Countries like Afghanistan plan to move from agro
based economy to becoming an exporter of industrial products, and Pakistan plan to move from factor-
driven to innovation-driven economy. Many SA countries wish to improve growth of SMEs and increase
their role in value chains’ participation such as by India, Afghanistan, etc., and aim to improve custom
procedures and logistics such as by India, Nepal, etc. Overall, there are efforts to promote country-wise
product brands on the global platform such as by Pakistan, Bhutan, and Afghanistan (with the target of
achieving ‘Made in Afghanistan’ in terms of domestic software and hardware technology brand).
However, several policy documents with development plans and strategies in many countries have
overlapping objectives and interlinkages in them such as in case of Nepal, Vietnam, etc. Such efforts have
gained more momentum post 2014 due to a decline in the global exports.
Given huge policy announcements by Japan and developing economies in Asia mainly dedicated strategies
to lead Industry 4.0 revolution and promote digitalized manufacturing, even by South East Asian
economies, and promotion of usage of ICT in domestic industries in many South Asian countries (who too
are in the process of building capacities to embrace DT and automation changes in their upcoming industrial
and sector-specific policies), thus the anticipated much flatter digitalized curve than traditional smiley
curve, as discussed in previous section, may not come largely true in case of such developing Asia. Also,
as manufacturing activities are developing with DT, the gap may not stay wide between suppliers in GVCs
and lead firms as some of these Asian economies are very likely to be able to lead GVCs in some of the
industries as well as upgrade in those chains in terms of new product development, movement to new
activities, etc. These chains would be largely those in which country’s forward and backward linkages have
been established more in the post-crisis period. This part is analyzed in the next section of this paper.

Page 36 of 72
5. Value-Added Analysis of Asian Manufacturing GVCs
This section enumerates changes in Asian GVCs in terms of backward & forward linkages, in the post-
crisis period, in comparison to European and American economies.
5.1 Trends in GVCs Backward linkages
The TiVA database does not present much decline in share of backward linkages (BL) from pre-crisis
(2005-06) to the time of crisis and just after crisis (when shares in fact increased up to 2011) for the selected
regions (Appendix Table C). However, the shares declined thereafter except in case of South and Central
America (SCA). For instance, Association of Southeast Asian Nations (ASEAN) had 31.4% FVA shares
in their exports in 2005, which initially declined in 2009 to 28% before rising to 29.1% in 2012, which
decreased to 28% in 2016. East Asia (EA) had 15% FVA share in 2005, which also followed similar pattern
of reaching the highest level at 18% in 2011, before declining afterwards. It may be noted that all these
regions had experienced gradual decline in shares post 2012, but this was stronger and faster post 2014
when exports also declined in many countries. The BL shares’ decline has been more particularly higher in
case of South Asia (SA) and EA, followed by EU 28, but relatively lower in case of ASEAN. To elaborate,
SA’s fall in BL has been gradual from 25% in 2012 to 23% in 2014, but then rapidly to 16% in 2016. EA’s
share declined by 1 percentage points during 2012-14, but registered fall from 17.6% in 2012 to about 13%
in 2016 (Korea and Hong Kong majorly contributed to this trend, including China). EU-28’s share declined
from 14.3% in 2012 to 13% in 2014 and 11.6% in 2016 (although majority of the countries continued to
have quite stable linkages in GVCs even post-crisis, but decline has been traced for Bulgaria, Latvia,
Lithuania, Greece, Spain, Sweden, UK, as well as Czech Republic during 2012-16). Share of North America
(NA) had declined slightly from 9.7% in 2012 to about 9% in 2014 but to 7.4% in 2016, where US
contributed to the trend. On the contrary, share of Mexico increased from 33.8% in 2012 to 36.4% in 2016.
ASEAN’s share decreased only by 0.9 percentage points during 2012-16, and the decline has been mainly
about 1 percentage points in case of majority of the ASEAN countries during 2015-16 period. Only Brunei
Darussalam and Cambodia have registered a rise in shares in this period. In case of SCA’s exports, FVA
share have risen from 9.4% in 2012 to 10.3% in 2015, although declined to 8.7% in 2016 owing to greater
fall in the shares of Chile, Colombia and Brazil (Appendix Table C). All this suggest significant rise in
DVA content of exports for SA & EA countries in particular in the period after crisis mainly post 2013-14.
Sector-wise, backward participation in GVCs has declined in all the three sectors (agriculture,
manufacturing and total business services (TBS)) from 2011 to 2016 for almost all the regions selected in
this paper (Figure 13 and Figure 14). That is, impact has been more powerful in years after crisis for GVCs
integration at regional level. Dependence has reduced for usage of imported inputs which aligned with
overall declining exports of world during 2013-16. Only exception has been the ASEAN region in case of
agriculture, with rise of 3.5 percentage points in 2011-16, and in TBS with almost similar shares in both
the periods. However, the shares for ASEAN in manufacturing only declined by about 3 percentage points
during the two period. Thus, ASEAN continued to have comparatively much higher shares than other
regions not only in this sector, but also in agriculture and services. Notably, there has been an overall decline
in the backward linkages in agriculture of 1-2 percentage points for the all other regions except SCA. In
case of TBS, EU-28’s position remained almost same, while there has been decline of 2-3 percentage points
in case of SA and EA, and 1 percentage points in case of American countries. Notably, the decline in the
FVA shares has been greater in case of manufacturing during 2011-16, where maximum fall has been
registered for SA (India) with decline of about 12 percentage points, followed by EA (6 percentage points),
NA and EU-28 (3.4 percentage points), and ASEAN. SCA experienced fall of 1-2 percentage points in both
backward and forward linkages. Country-wise, in Table 4, information on decline BL shares have also

Page 37 of 72
shown similar patterns in case of manufacturing, although country-wise there has been rising shares in case
of TBS such as in case of EU-28.
Figure 13: Region wise FVA share of gross exports (2011) (%)
Source: Data from OECD-WTO TiVA Database 2018 version
Figure 14: Region wise FVA share of gross exports (2016) (%)
Source: Data from OECD-WTO TiVA Database 2018 version
0
10
20
30
40
50
60
70
80
Ag
ricu
lture
, fo
rest
ry &
fish
ing
Man
ufa
ctu
rin
g
Fo
od p
rod
uct
s,
bev
erag
es &
to
bac
co
Tex
tile
s, a
pp
arel
&
leat
her
pro
du
cts
Woo
d &
its
pro
duct
s
Pap
er &
its
pro
duct
s
Cok
e &
ref
ined
pet
role
um
pro
duct
s
Chem
ical
s &
phar
mac
euti
cal…
Rub
ber
& p
last
ic
pro
duct
s
Oth
er n
on
-met
alli
c
min
eral
pro
du
cts
Bas
ic m
etal
s &
fabri
cate
d m
etal
…
Com
pute
rs, el
ectr
on
ic
& e
lect
rica
l eq
uip
men
t
Mac
hin
ery
&
equip
men
t
Mo
tor
veh
icle
s
Oth
er t
ransp
ort
equip
men
t
Oth
er m
anu
fact
uri
ng
;
repai
r et
c.
To
tal
bu
sines
s se
rvic
es
South Asia (Only India) ASEAN East Asia North America EU28 South and Central America
05
101520253035404550
Ag
ricu
lture
, fo
rest
ry &
fish
ing
Man
ufa
ctu
rin
g
Fo
od p
rod
uct
s,
bev
erag
es &
to
bac
co
Tex
tile
s, a
pp
arel
&
leat
her
pro
du
cts
Woo
d &
its
pro
duct
s
Pap
er &
its
pro
duct
s
Cok
e &
ref
ined
pet
role
um
pro
duct
s
Chem
ical
s &
phar
mac
euti
cal
pro
duct
s
Rub
ber
& p
last
ic
pro
duct
s
Oth
er n
on
-met
alli
c
min
eral
pro
du
cts
Bas
ic m
etal
s &
fabri
cate
d m
etal
pro
duct
s
Com
pute
rs, el
ectr
on
ic &
elec
tric
al e
qu
ipm
ent
Mac
hin
ery
& e
qu
ipm
ent
Mo
tor
veh
icle
s
Oth
er t
ransp
ort
equip
men
t
Oth
er m
anu
fact
uri
ng
;
repai
r et
c.
To
tal
bu
sines
s se
rvic
es
South Asia (Only India) ASEAN East Asia North America EU28 South and Central America

Page 38 of 72
Within manufacturing sector, in terms of GVCs backward linkages, ASEAN region’s shares declined in all
the activities except textiles and wood products during 2011-16 (Tables 5 and 6). EU 28 continued to stay
as important link for other transport equipment (other than automotive). On the other hand, faster decline
in BL has been in case of number of manufacturing activities in case of SA and EA (of more than 20
percentage points in case of petroleum products, of 8-10 percentage points and more for machineries
including ICT and electrical goods, motor and transport equipment in case of India, and for chemical, metal
and paper products in case of SA (India) as well as EA. However, decline in the linkages’ shares has been
below 5 percentage points for electrical and computer equipment, machinery equipment, and motor vehicles
for EA and ASEAN. This implies that strong supply chains still exist in these regions for such machine
products even years after crisis, but where India has reduced its dependence on usage of imported inputs in
exports. Further, the shares have been below 2 percentage points for other regions in these categories. That
is, American and European regions have shown relatively lower declining pattern in FVA shares, owing to
maturity of their existing value chains, as compared to the Asian region. For these two regions, integration
has also been much lower in case of TBS (even lower than that in agriculture). Although backward linkages
in manufacturing have been higher in 2011 than TBS, but SA and EA still had significant shares in latter
of around 10% (although declined to 8% in 2016) and ASEAN had much higher level of 21% in both the
periods (see Figures 13 and 14). Nevertheless, the manufacturing GVCs remained to be the focal point for
all the regions particularly for Asia, with highest FVA share of gross exports in the sector by ASEAN, and
then SA (shares although declined) in both the periods, while others had shared in the range of 12-14% in
2016.
ASEAN: In 2011, ASEAN region largely imported inputs from the sub-sector of coke and refined
petroleum, computer and electrical equipment, machinery equipment, and from transport equipment (shares
of 40% and above), followed by rubber and plastics, basic and fabricated metal products,
chemical/pharmaceutical products (in the range of 35-38%), as well, as textiles, apparel and leather items
(30%). In 2016 too, the trend remained the same (except in case of textiles where shares have risen by 2
percentage points). However, there has been a mild decline of 3-4 percentage points in ASEAN sourcing
in case of ICT machinery, rubber, and 9% in case of coke oil, etc. That is, ASEAN countries still connect
with rest of the world for inputs used in exports for various machinery and metal products. Country-wise,
see Tables 3 to 5, highest FVA shares in exports during 2011 in manufacturing sector have been registered
by Singapore (53%), Malaysia, Vietnam and Thailand (shares in the range of 46-49%), but their shares
declined in 2016 to the range of 39-43% (Vietnam has been the exception). These were followed by
Cambodia and Philippines with 30-34% shares in 2011 and importantly their shares have risen up to 2016.
Interestingly, shares of Brunei Darussalam and also of Vietnam increased in case of agriculture,
manufacturing and services showing their growing linkages into GVCs during 2011-16.
EA: During 2011, EA imported inputs for use in its production of exports from the categories of coke oil
(70%), followed by metals (28%), chemicals (24%), other transport equipment, ICT, rubber/plastic (19-
20%). Shares declined sharply over the years suggesting rise in EA’s DVA content of exports, although
significant shares remained in case of petrol and metals. Country-wise, in 2011, Hong Kong, Korea and
Chinese Taipei had shares above 45% in backward linkages, which declined to around 34% in case of latter
two. China’s share declined from 23% in 2015 to 18% in 2016.
SA: SA largely imported coke oil with 65% share in 2011 & 41% during 2016, and imported ICT goods,
metal items, machinery equipment transport equipment (32% - 40% shares) and even chemicals (30%).
Their shares declined sharply in 2016 (imported content of ICT and metals still significant thought at around
30%).

Page 39 of 72
NA: The region imported just about 16% for use in exports in 2011, which was largely from coke oil, motor
vehicles, metals, and machinery equipment (16%). In 2016, motor vehicles shares remained important as
around 20%. Country-wise, situation has been altogether different, as Mexico imported about 46% in both
the periods, and Canada did above 32%. It has been the actual slowdown of US in manufacturing value
chains.
SCA: The region largely imported petrol products in 2011, followed by rubber and plastic items, ICT/
electrical goods, other transport equipment. In 2016, shares did not show much decline for these categories.
In fact, share increased in case of transport machinery. Country-wise, in 2011, highest usage of imported
content in exports has been by Costa Rica, Chile, and Peru (above 20%). Their shares declined in 2016
mainly for Cost Rica, except doubling of shares for Colombia.
EU-28: EU in 2011 largely imported coke oil, followed by metals, other transport equipments and ICT
products. Trend has been the same in 2016 although with fall in shares of coke oil, metals, and chemicals.
Country-wise, FVA content in exports in 2011 has been much 30% for all except in case of Romania,
Germany. Highest imported content has been observed in Slovak Republic, Luxembourg, Hungary, Malta,
Bulgaria, Estonia and Lithuania. Except Romania & Netherland, there has been declined in FVA shares of
all EU countries in 2016, and the main countries with higher GVCs shares have been Hungary, Slovak
Republic, Malta, Czech Republic, Estonia, Luxembourg, etc.
To summarize, decline in FVA content in exports or backward linkages share has been greater for countries
in EA and SA, followed few ASEAN countries such as Singapore, Thailand, Malaysia, as well as those in
SCA as compared to lower level of decline for EU and NA in the case of manufacturing.
Among all the regions, highest share of BL has been 35% in case of ASEAN, thus this has been taken as
the benchmark for understanding key players in industrial value chains (see highlighted sub-sectors in tables
5 and 6 showing shares at this benchmark and above). Main findings are:
a. BL have declined over the years but is present in entire manufacturing value chain ranging from textiles,
wood and paper products to chemicals and metals and to ICT/electrical and transport machinery. This
is very true for EU-28 and ASEAN which have been connected to many GVCs.
b. Integration of US and SCA countries have been lower and further declined during 2011-16, thereby
having presence in only few industry value chains such as coke oil, automotive, etc. However, Mexico
continued to be more integrated.
c. SA initially had significant role as buyer of inputs in GVCs of coke oil, metals, machinery and chemical
products, which reduced over the years. On the other hand, EA along with ASEAN in 2011 had a
greater presence in all types of machinery goods, coke oil, chemicals, rubber, plastics, etc. In 2015,
EA’s role became restricted to few value chains of coke oil, metals, ICT, machinery equipment, and
automotive (majorly by Chinese Taipei and Hong Kong).
d. ASEAN’s role has been significant & spreading across machinery, ICT, metals, textiles, etc.
e. In the food value chain, ASEAN countries dominated as key buyer with few EU and EA countries, as
highlighted in the table. Number of countries in EA (excluding Japan and China) and SEA had
significant role in textile and leather value chains in 2011, which although has reduced further mainly
for EA countries.
f. In textiles and leather and paper value chains, ASEAN, Mexico, EA (Hong Kong and Chinese Taipei)
& even European countries dominated. This has also been the case for chemicals, rubber plastic,
mineral products, and machinery equipment value chains, but more number of European countries were

Page 40 of 72
found therein with high FVA shares. Singapore, Vietnam, Hong Kong, and Chinese Taipei have
important role in wood value chains.
g. In metals value chain, SA, ASEAN, Europe & even EA have been important buyers. Europe and
ASEAN have more participation in ICT value chains.
Overall there has been restructuring of Asian GVCs post-crisis in terms of transferring their shares in total
manufacturing GVCs pie perhaps to less developing countries, and LDCs both in Africa and Asia. This is
to stay immune from the after-effects of crisis, capture opportunities due to slowdown in advanced
economies, tackle the lack of global demand and make domestic industries stronger, which is also the need
of the hour.
Table 4: Sector-wise countrywide FVA share of gross exports (2011 and 2016) (%)
Country
2011 2016
Agriculture,
forestry &
fishing
Manufacturin
g
Total
busines
s
Agriculture
, forestry &
fishing
Manufacturin
g
Total
busines
s s
India 5.5 35.1 10.6 3.7 22.9 7.9
ASEAN
Brunei
Darussalam 36.1 17.3 16.7 37.5 23.5 18.3
Cambodia 18.7 34.4 21.3 16.9 34.3 23.0
Indonesia 6.3 19.3 8.3 4.7 15.5 5.8
Malaysia 17.3 48.5 22.6 14.4 43.1 21.7
Philippines 10.3 30.9 13.9 8.6 33.5 12.1
Singapore 29.7 53.1 31.3 27.3 47.7 32.1
Thailand 14.3 46.0 22.9 11.2 38.7 19.6
Viet Nam 31.9 46.9 26.8 31.0 47.5 27.6
East Asia
Japan 11.4 17.2 6.5 9.4 13.2 6.1
Korea 19.0 45.4 25.8 14.3 33.4 16.1
China 6.9 23.3 8.0 6.0 17.5 6.5
Hong Kong 33.1 48.0 29.0 24.4 44.5 21.9
Chinese
Taipei 29.5 47.5 17.8 19.3 34.6 13.4
North America
Canada 18.7 34.3 8.0 19.4 32.5 9.4
Mexico 9.4 46.4 5.5 9.7 45.9 7.8
US 10.9 20.4 5.4 8.7 15.3 4.0
EU 28
Czech
Republic 28.4 45.3 20.8 27.5 44.1 19.8
Estonia 27.9 49.6 23.5 27.9 46.4 21.7
Hungary 27.1 58.1 21.3 27.2 54.0 21.5
Latvia 24.1 31.0 16.7 21.9 28.6 15.0

Page 41 of 72
Lithuania 33.0 48.1 15.7 33.7 40.7 16.7
Poland 20.9 36.6 14.5 22.3 34.8 14.6
Slovak
Republic 25.1 54.8 19.2 22.6 52.6 21.1
Slovenia 24.5 43.0 19.8 22.5 39.4 18.5
Bulgaria 26.8 48.6 18.9 25.7 43.9 19.3
Croatia 18.6 28.5 12.9 19.6 28.4 13.4
Cyprus 20.3 33.5 23.6 19.6 28.1 23.7
Malta 37.9 60.2 75.9 56.3 57.9 66.0
Romania 11.9 25.7 21.6 15.4 27.4 15.4
Austria 21.6 39.0 13.8 22.1 35.5 13.8
Belgium 36.3 48.2 22.7 36.4 45.0 24.2
Denmark 25.4 31.5 31.2 26.1 26.8 30.2
Finland 18.1 37.4 15.7 15.6 31.7 15.5
France 17.8 32.4 11.6 18.2 30.6 11.7
Germany 20.5 27.7 11.4 21.5 24.4 10.6
Greece 18.3 41.0 16.6 15.9 36.0 13.7
Ireland 42.2 39.4 41.0 40.0 35.7 48.1
Italy 14.1 32.1 11.6 11.9 27.9 10.3
Luxembourg 50.1 54.6 61.7 49.0 49.7 69.0
Netherlands 26.0 38.5 15.9 25.6 39.5 17.0
Portugal 22.7 39.4 13.4 21.2 38.1 12.8
Spain 14.1 34.7 10.2 13.2 31.2 9.5
Sweden 16.1 31.0 13.6 14.9 27.0 12.0
United
Kingdom 20.2 31.5 10.1 16.6 27.6 9.2
South and Central America
Chile 18.4 23.9 19.0 14.1 17.5 11.0
Argentina 6.4 15.0 7.2 4.1 9.3 5.1
Brazil 7.8 13.8 4.9 8.2 13.0 5.7
Colombia 6.7 15.8 7.1 7.1 34.3 6.5
Costa Rica 18.8 28.9 11.3 17.0 17.6 8.9
Peru 8.0 19.9 9.1 6.5 14.6 8.7
Source: Data from OECD-WTO TiVA Database 2018 version
Although not much comparable, using some estimation from UNCTAD EoRA database, sector-wise
backward linkages have been calculated for other SA economies (other than SA). The results show very
low levels of their integration in manufacturing except in case of paper products for Bangladesh (in metals
too) and Pakistan (also transport equipment), whereas Afghanistan, Nepal, Bangladesh, Pakistan and
Bhutan have high FVA shares in fishing. Thus among SA, India is still better integrated into GVCs (even
though less than other better integrated Asian economies).

Page 42 of 72
Table 5: Country wise FVA share of gross exports (2011) – Only manufacturing activities (%)
Country
Food
prod
ucts,
bever
ages
&
tobac
co
Texti
les,
appa
rel &
leath
er
prod
ucts
Woo
d &
its
prod
ucts
Pape
r &
its
prod
ucts
Coke
&
refine
d
petrol
eum
produ
cts
Chemical
s &
pharmac
eutical
products
Rub
ber
&
plast
ic
prod
ucts
Othe
r
non-
meta
llic
mine
ral
prod
ucts
Basic
metal
s &
fabric
ated
metal
produ
cts
Comp
uters,
electro
nic &
electri
cal
equip
ment
Machi
nery
&
equip
ment,
nec
Moto
r
vehicl
es&
traile
rs
Other
transp
ort
equip
ment
Other
manufact
uring;
repair
etc.
India 7.7 17.2 11.5 25.7 64.5 29.4 23.9 32.4 37.6 40.7 34.4 33.9 33.3 34.0
ASEAN
Brunei
Darussalam 41.3 18.4 33.8 29.6 8.2 15.2 31.0 9.0 12.6 37.1 32.8 36.8 31.9 21.5
Cambodia 23.6 41.7 13.7 46.4 41.8 38.7 45.8 35.4 46.0 41.6 40.9 40.2 37.0 33.1
Indonesia 9.2 22.1 7.1 16.8 21.8 18.8 29.0 8.5 16.9 35.5 35.8 20.2 40.3 18.8
Malaysia 33.0 35.1 22.1 30.1 29.9 40.4 48.7 33.3 53.0 60.4 46.9 60.3 55.2 42.4
Philippines 11.5 17.8 23.0 32.7 58.9 35.8 36.0 28.2 27.6 35.9 31.4 34.9 34.5 25.5
Singapore 40.9 37.9 37.9 35.3 84.3 45.8 40.2 46.8 45.8 45.9 46.4 40.2 44.0 41.1
Thailand 19.6 25.9 31.3 35.8 58.4 42.4 49.2 35.5 56.7 57.6 58.9 51.9 52.4 47.2
Viet Nam 37.9 45.5 49.7 45.8 43.8 50.9 54.2 34.7 53.0 54.7 61.2 51.8 56.4 49.6
East Asia
Japan 11.5 18.5 12.6 10.5 57.4 18.1 15.9 13.3 26.6 16.0 13.4 12.4 14.6 15.1
Korea 30.7 34.4 33.3 33.5 80.9 46.1 38.9 37.8 50.3 41.5 38.6 37.8 42.3 37.2
China 10.3 13.1 16.5 16.8 42.4 21.4 22.3 16.0 25.2 31.4 21.2 20.7 20.2 16.0
Hong
Kong 32.3 41.0 40.4 33.9 53.1 39.9 35.3 39.0 60.0 48.6 64.6 43.4 39.4 39.2
Chinese
Taipei 36.8 44.5 45.3 43.2 83.2 63.6 50.4 45.0 56.7 37.4 49.1 45.9 43.3 39.6
North America
Canada 21.3 27.6 16.1 20.2 37.4 26.7 33.1 16.3 40.0 31.0 28.8 47.2 28.8 22.6
Mexico 27.6 45.3 32.0 41.6 26.0 43.0 48.1 45.6 30.5 57.9 38.5 46.4 43.0 38.1
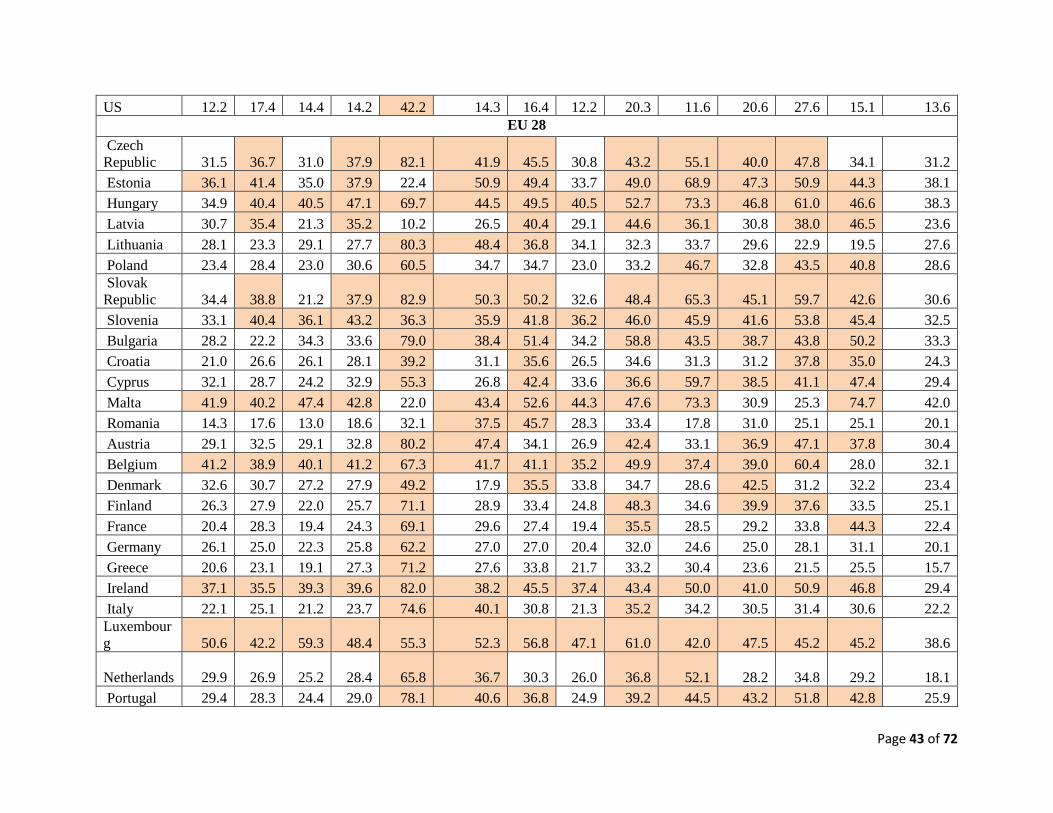
Page 43 of 72
US 12.2 17.4 14.4 14.2 42.2 14.3 16.4 12.2 20.3 11.6 20.6 27.6 15.1 13.6
EU 28
Czech
Republic 31.5 36.7 31.0 37.9 82.1 41.9 45.5 30.8 43.2 55.1 40.0 47.8 34.1 31.2
Estonia 36.1 41.4 35.0 37.9 22.4 50.9 49.4 33.7 49.0 68.9 47.3 50.9 44.3 38.1
Hungary 34.9 40.4 40.5 47.1 69.7 44.5 49.5 40.5 52.7 73.3 46.8 61.0 46.6 38.3
Latvia 30.7 35.4 21.3 35.2 10.2 26.5 40.4 29.1 44.6 36.1 30.8 38.0 46.5 23.6
Lithuania 28.1 23.3 29.1 27.7 80.3 48.4 36.8 34.1 32.3 33.7 29.6 22.9 19.5 27.6
Poland 23.4 28.4 23.0 30.6 60.5 34.7 34.7 23.0 33.2 46.7 32.8 43.5 40.8 28.6
Slovak
Republic 34.4 38.8 21.2 37.9 82.9 50.3 50.2 32.6 48.4 65.3 45.1 59.7 42.6 30.6
Slovenia 33.1 40.4 36.1 43.2 36.3 35.9 41.8 36.2 46.0 45.9 41.6 53.8 45.4 32.5
Bulgaria 28.2 22.2 34.3 33.6 79.0 38.4 51.4 34.2 58.8 43.5 38.7 43.8 50.2 33.3
Croatia 21.0 26.6 26.1 28.1 39.2 31.1 35.6 26.5 34.6 31.3 31.2 37.8 35.0 24.3
Cyprus 32.1 28.7 24.2 32.9 55.3 26.8 42.4 33.6 36.6 59.7 38.5 41.1 47.4 29.4
Malta 41.9 40.2 47.4 42.8 22.0 43.4 52.6 44.3 47.6 73.3 30.9 25.3 74.7 42.0
Romania 14.3 17.6 13.0 18.6 32.1 37.5 45.7 28.3 33.4 17.8 31.0 25.1 25.1 20.1
Austria 29.1 32.5 29.1 32.8 80.2 47.4 34.1 26.9 42.4 33.1 36.9 47.1 37.8 30.4
Belgium 41.2 38.9 40.1 41.2 67.3 41.7 41.1 35.2 49.9 37.4 39.0 60.4 28.0 32.1
Denmark 32.6 30.7 27.2 27.9 49.2 17.9 35.5 33.8 34.7 28.6 42.5 31.2 32.2 23.4
Finland 26.3 27.9 22.0 25.7 71.1 28.9 33.4 24.8 48.3 34.6 39.9 37.6 33.5 25.1
France 20.4 28.3 19.4 24.3 69.1 29.6 27.4 19.4 35.5 28.5 29.2 33.8 44.3 22.4
Germany 26.1 25.0 22.3 25.8 62.2 27.0 27.0 20.4 32.0 24.6 25.0 28.1 31.1 20.1
Greece 20.6 23.1 19.1 27.3 71.2 27.6 33.8 21.7 33.2 30.4 23.6 21.5 25.5 15.7
Ireland 37.1 35.5 39.3 39.6 82.0 38.2 45.5 37.4 43.4 50.0 41.0 50.9 46.8 29.4
Italy 22.1 25.1 21.2 23.7 74.6 40.1 30.8 21.3 35.2 34.2 30.5 31.4 30.6 22.2
Luxembour
g 50.6 42.2 59.3 48.4 55.3 52.3 56.8 47.1 61.0 42.0 47.5 45.2 45.2 38.6
Netherlands 29.9 26.9 25.2 28.4 65.8 36.7 30.3 26.0 36.8 52.1 28.2 34.8 29.2 18.1
Portugal 29.4 28.3 24.4 29.0 78.1 40.6 36.8 24.9 39.2 44.5 43.2 51.8 42.8 25.9

Page 44 of 72
Spain 21.7 26.7 22.0 20.8 75.7 32.3 29.0 19.6 35.2 30.8 26.3 42.7 28.6 18.5
Sweden 25.1 27.6 24.0 24.5 73.4 22.2 29.7 25.5 38.4 26.0 29.6 33.7 23.1 25.0
United
Kingdom 23.2 20.9 26.4 22.1 58.5 29.4 26.5 27.0 37.5 29.7 26.7 35.9 31.9 17.8
South and Central America
Chile 18.9 30.7 19.7 21.4 79.4 27.4 34.6 20.7 20.2 32.1 23.1 44.2 20.8 26.1
Argentina 7.8 11.8 8.3 12.4 12.5 15.4 18.7 9.7 15.5 20.2 15.5 29.3 18.0 10.8
Brazil 8.8 10.0 7.6 10.6 25.8 16.9 15.3 9.7 16.6 18.6 15.0 14.6 18.1 10.5
Colombia 10.7 15.3 11.2 13.4 15.1 18.8 23.6 10.3 15.9 23.8 17.5 32.0 41.2 12.6
Costa Rica 22.1 30.3 13.1 28.9 39.6 32.4 37.9 23.9 37.1 31.8 43.6 43.2 38.0 30.5
Peru 13.8 23.8 9.4 18.4 28.2 23.4 30.2 11.8 17.9 32.9 26.2 30.4 23.7 17.1
Source: Data from OECD-WTO TiVA Database 2018 version
Table 6: Country wise FVA share of gross exports (2016) – only manufacturing activities (bold figures indicate decline in shares from
2011 to 2016) (%)
Country
Food
prod
ucts,
bever
ages
&
tobac
co
Texti
les,
appa
rel &
leath
er
prod
ucts
Woo
d &
its
prod
ucts
Pape
r &
its
prod
ucts
Coke
&
refine
d
petrol
eum
produ
cts
Chemical
s &
pharmac
eutical
products
Rub
ber
&
plast
ic
prod
ucts
Othe
r
non-
meta
llic
mine
ral
prod
ucts
Basic
metal
s &
fabric
ated
metal
produ
cts
Comp
uters,
electro
nic &
electri
cal
equip
ment
Machi
nery
&
equip
ment,
nec
Moto
r
vehicl
es&
traile
rs
Other
transp
ort
equip
ment
Other
manufact
uring;
repair
etc.
India 6.2 13.4 8.2 18.1 41.2 21.9 21.2 22.3 29.6 31.1 25.8 23.5 19.8 24.1
ASEAN
Brunei
Darussalam 44.8 21.5 31.6 30.9 5.3 12.5 30.4 10.1 13.2 40.4 35.5 39.7 33.5 23.1
Cambodia 20.7 37.0 12.6 42.4 49.8 39.5 44.4 36.3 44.3 38.5 36.3 34.9 38.9 27.9
Indonesia 7.3 20.0 6.4 15.1 14.5 13.7 25.6 7.0 14.9 26.4 27.8 16.2 33.3 16.2
Malaysia 26.7 35.3 18.5 26.6 19.2 35.2 43.8 29.8 46.4 54.6 43.6 55.6 49.7 34.0
Philippines 10.5 16.2 21.8 28.4 37.9 28.5 31.9 24.0 23.1 38.9 31.7 40.9 35.8 24.8

Page 45 of 72
Singapore 39.0 34.7 37.5 31.4 73.6 43.0 34.4 46.4 49.3 43.6 44.3 39.7 39.2 42.5
Thailand 15.9 20.8 26.4 27.2 43.6 32.2 41.4 28.4 48.0 47.9 52.2 45.8 47.6 39.2
Viet Nam 36.8 44.8 49.4 43.8 31.1 46.4 51.8 32.5 50.5 61.4 62.3 51.5 54.3 48.2
East Asia
Japan 10.1 17.6 13.3 9.7 42.1 14.1 12.6 10.9 18.5 13.6 10.5 10.4 15.2 12.9
Korea 24.5 28.9 25.4 23.5 64.8 31.6 27.8 26.0 34.4 34.0 28.5 27.8 33.4 28.5
China 7.8 9.4 13.4 11.7 29.7 14.4 15.1 10.9 15.9 25.1 15.2 15.8 15.3 12.3
Hong
Kong 25.5 34.0 33.8 29.1 43.1 31.0 28.3 31.0 59.1 47.5 66.5 39.7 34.0 38.9
Chinese
Taipei 27.2 32.6 32.7 33.0 57.1 45.9 35.7 32.8 46.2 27.7 43.0 40.1 38.6 32.7
North America
Canada 21.3 26.7 17.8 21.7 30.3 26.5 33.7 19.9 37.9 30.7 27.9 45.9 27.4 20.9
Mexico 24.3 39.3 27.4 37.8 30.9 42.3 40.3 45.4 35.1 54.0 41.2 47.4 43.6 34.4
US 9.8 16.3 13.6 12.2 26.8 9.8 13.8 9.9 15.6 10.0 18.0 23.8 14.3 11.3
EU 28
Czech
Republic 30.2 37.9 30.4 37.2 65.0 37.2 42.5 30.4 38.1 50.4 39.5 50.5 34.6 32.6
Estonia 36.0 38.0 33.4 36.3 23.4 50.5 45.6 33.7 45.8 65.3 44.5 46.0 44.6 35.7
Hungary 34.4 39.5 41.4 42.9 53.7 38.5 47.1 40.4 48.3 66.8 50.1 60.4 52.7 40.7
Latvia 29.3 33.0 23.1 32.0 17.3 28.4 38.3 26.1 36.4 34.8 34.2 35.7 33.5 23.6
Lithuania 29.6 25.5 30.2 27.4 71.8 46.5 40.3 31.2 35.6 35.3 30.8 38.0 22.1 28.6
Poland 24.5 29.3 23.3 30.3 50.5 33.9 34.6 22.3 30.8 46.3 35.4 42.6 40.9 27.1
Slovak
Republic 30.7 35.5 20.1 36.0 63.6 43.2 44.7 32.4 42.6 66.5 45.1 59.9 43.9 32.8
Slovenia 31.9 35.6 35.1 42.6 46.8 34.9 38.5 32.0 39.6 43.1 37.2 49.4 39.7 27.8
Bulgaria 31.6 28.0 29.6 37.0 68.8 39.1 50.3 32.8 54.4 46.0 42.7 46.9 51.5 33.7
Croatia 22.7 31.3 27.6 27.9 26.2 29.8 35.4 25.1 30.1 33.2 32.5 39.0 35.1 26.4
Cyprus 30.2 31.0 20.8 30.2 23.7 23.0 39.6 24.6 27.1 26.7 37.4 40.5 54.0 24.1
Malta 46.2 48.0 41.5 46.2 18.2 50.8 54.8 51.1 56.5 70.0 37.5 17.9 78.1 43.3
Romania 17.4 22.5 20.9 23.5 24.2 28.1 33.9 19.1 30.7 28.1 25.7 32.8 29.0 21.3

Page 46 of 72
Austria 28.9 33.7 28.3 30.5 70.4 41.0 32.4 25.1 35.6 31.3 35.9 44.6 41.0 26.8
Belgium 41.4 39.6 40.5 40.5 60.6 38.8 41.5 35.0 49.1 37.2 39.2 61.1 31.0 33.9
Denmark 34.0 28.8 26.1 25.5 39.4 14.1 30.8 28.8 28.0 24.1 35.6 33.1 38.5 20.8
Finland 25.9 26.5 19.3 23.7 53.3 28.9 31.2 23.3 40.6 30.9 35.7 38.4 39.2 25.3
France 20.8 28.3 18.9 22.1 58.0 24.8 25.1 17.9 31.8 26.4 27.9 34.6 45.4 21.4
Germany 24.7 24.3 22.1 23.1 46.5 23.7 25.3 18.0 25.4 22.7 22.4 25.5 27.7 18.5
Greece 18.3 26.2 32.2 32.1 62.6 21.4 39.3 19.9 24.8 30.9 24.4 28.1 27.0 19.6
Ireland 28.9 34.8 37.8 29.3 62.8 38.0 37.2 35.2 35.4 42.5 28.6 40.9 15.9 24.6
Italy 20.2 21.7 18.9 21.8 57.8 32.7 26.3 18.5 28.9 32.1 29.0 32.5 29.4 19.9
Luxembour
g 47.7 33.4 59.5 47.6 48.7 47.3 45.7 36.2 58.9 39.6 46.2 41.6 42.6 34.1
Netherlands 32.4 29.5 25.3 34.3 56.3 35.9 31.7 28.2 32.5 63.4 31.2 39.6 36.7 20.6
Portugal 28.2 28.4 25.1 28.0 68.0 37.7 35.2 25.3 37.9 43.0 41.7 56.1 53.5 25.9
Spain 21.6 27.4 21.7 20.9 63.1 27.7 26.6 19.8 29.7 28.6 23.5 42.5 30.2 17.4
Sweden 24.8 27.2 19.4 21.8 54.8 21.8 26.8 23.4 30.3 27.4 27.0 28.9 21.8 22.9
United
Kingdom 20.4 14.9 24.6 18.7 37.5 24.5 22.8 19.4 30.9 27.5 29.4 31.0 38.0 17.8
South and Central America
Chile 14.5 25.2 12.4 16.6 58.4 22.0 29.3 16.9 16.1 20.8 17.0 29.5 28.2 20.1
Argentina 5.1 9.2 5.8 9.1 9.8 10.8 14.0 6.7 8.3 15.9 11.0 21.6 15.0 7.7
Brazil 9.8 9.4 8.3 10.5 16.3 15.0 14.5 9.6 13.5 17.7 14.7 14.8 22.0 10.6
Colombia 12.0 15.9 10.3 13.1 17.2 21.2 26.6 8.8 16.1 23.2 15.7 30.5 33.0 11.1
Costa Rica 20.4 24.7 14.0 26.6 38.6 27.7 33.9 20.6 28.9 34.2 42.4 34.9 29.0 25.4
Peru 12.5 21.9 11.3 15.3 19.1 20.8 27.0 10.8 10.0 20.9 15.4 24.0 16.8 12.8
Source: Data from OECD-WTO TiVA Database 2018 version

Page 47 of 72
5.2 Trends in GVCs Forward linkages
In 2005, pre-crisis period, the share of ASEAN GVCs forward linkage (FL) was 41% (only 10 percentage
points higher BL), while there was large difference between the two shares for the other regions. However,
the gap widened over the years for ASEAN by 14-15 percentage points post 2009. The region’s FL has
increased only by 2 percentage points from 2005-15 (BL declined by 3 percentage points during 2005-16),
and rather declined by 1 percentage point post 2012 in both the measures.
Except SCA region, there has been rise in forward participation in GVCs in manufacturing by all the other
regions during 2011 and 2016. Highest increase has been registered by EA (6 percentage points), and SA
(India) by 5 percentage points, and then by EU 28 (4 percentage points). On the other hand, very low
changes of 0.6 percentage points in FL have been shown by NA. Interestingly, all the regions except
ASEAN have registered a rise in FL shares by about 2-3 percentage points in agriculture (where ASEAN
has higher BL). In case of TBS, FL increased only for the regions of EA and EU by 3 percentage points
each. To summarize, EA and EU has rising forward participation in GVCs in all the three broad sectors,
India and NA in case of agriculture and manufacturing, while ASEAN only in manufacturing, and SCA
only in agriculture sector. Overall, shares of manufacturing remained high in forward participation in
selected regions mainly in Asia (i.e., SA and EA). Country-wise, the trends are almost the same as shown
in Table 7.
In the context of manufacturing GVCs, SA’s FL share increased for almost all the activities from 2011 to
2016 (except decline of 5 percentage points in food products) thereby making the region (or India) as the
growing significant player in leading the GVCs. The shares have been higher in case of wood, non-metallic
mineral and paper products, and even in refined petroleum products (rise of 12-18 percentage points),
followed by about 7 percentage points rise in case of metals, and computer/electrical equipment. SA/India
has although reduced focus on FVA usage in imports for many of its manufacturing sub-sectors, but has
been increasing exports of intermediate goods prominently in these industrial sub-sectors.
Except in case of motor vehicles, EA’s FL has increased in all the sub-sectors from 2011 to 2016. Rise has
been mainly in metals and computer equipment (8-10 percentage points), rubber/plastic items of 6
percentage points, and machinery and equipment, textiles, chemicals and petroleum products of 4-5
percentage points. ASEAN’s FL increased much lesser but nonetheless in case of textiles (along with
backward linkages therein), chemicals, but particularly in ICT and electronics of 7 percentage points. EU’s
FL increased more in petroleum, chemical, wood, metals, machinery, and even textiles products. NA’s
linkages have been growing in petroleum, motor vehicles and electronics (rise upto 10 percentage points).
Whereas, rise in shares for SAC during 2011-16 has been in textiles and wood products of 3 percentage
points, while lower rise or declining shares in others mainly other transport equipment and chemicals
(Tables 8 and 9).
To elaborate, in case of manufacturing, in 2011, the share of ASEAN, EA, SA was in the range of 32-38%,
which increased to 37% to 45% (in case of EA) in 2015. Share of SCA, NA has been almost amount 51-
52%, & 47% respectively in 2015. EU-28’s share rose from 41% in 2011 to 45% in 2015.
ASEAN: The region largely exported inputs in 2011 from the sub-sectors of wood and paper (65-75%
share), metals (59%), chemicals and rubber/plastic items (52%). In 2016, share of these products remained
largely the same, while FL share of ICT products rose to 37% in 2016 from 30% in 2011. Maximum
forward participation in manufacturing has been by all the countries of ASEAN in 2011, although shares
of Singapore, Thailand, Vietnam, and Malaysia have been in the range of 25-31% (improved in later years).
On the other hand, Brunei had higher share (above 50%) in 2011 which decreased drastically to 15% in
2015. Interestingly, Indonesia and Philippines displayed significant shares of above 40% in 2015.

Page 48 of 72
SA: In 2011, Indian largely supplied inputs in case of rubber/plastic, metals, chemicals, food, and paper
products (shares of 40% and above). In 2015, the region’s FL shares have increased in all sub-sectors,
except food and the most significant ones have been chemicals and non-metallic mineral products, metals
and paper products. FL is about 30% in ICT and machinery equipment, less than that of EA region.
Figure 15: Region-wise DVA in exports of intermediates as a share of total exports (2011) (%)
Source: Data from OECD-WTO TiVA Database 2018 version
Figure 16: Region-wise DVA in exports of intermediates as a share of total exports (2015) (%)
Source: Data from OECD-WTO TiVA Database 2018 version
0102030405060708090
Ag
ricu
lture
, fo
rest
ry &
fish
ing
Man
ufa
ctu
rin
g
Fo
od p
rod
uct
s,
bev
erag
es &
to
bac
co
Tex
tile
s, a
pp
arel
&
leat
her
pro
du
cts
Woo
d &
its
pro
duct
s
Pap
er &
its
pro
duct
s
Cok
e &
ref
ined
pet
role
um
pro
duct
s
Chem
ical
s &
phar
mac
euti
cal…
Rub
ber
& p
last
ic
pro
duct
s
Oth
er n
on
-met
alli
c
min
eral
pro
du
cts
Bas
ic m
etal
s &
fabri
cate
d m
etal
…
Com
pute
rs, el
ectr
on
ic
& e
lect
rica
l eq
uip
men
t
Mac
hin
ery
&
equip
men
t
Mo
tor
veh
icle
s
Oth
er t
ransp
ort
equip
men
t
Oth
er m
anu
fact
uri
ng
;
repai
r et
c.
To
tal
bu
sines
s se
rvic
es
South Asia (Only India) ASEAN East Asia North America EU28 South and Central America
0102030405060708090
Ag
ricu
lture
, fo
rest
ry &
fish
ing
Man
ufa
ctu
rin
g
Fo
od p
rod
uct
s,
bev
erag
es &
to
bac
co
Tex
tile
s, a
pp
arel
&
leat
her
pro
du
cts
Woo
d &
its
pro
duct
s
Pap
er &
its
pro
duct
s
Cok
e &
ref
ined
pet
role
um
pro
duct
s
Chem
ical
s &
phar
mac
euti
cal
pro
duct
s
Rub
ber
& p
last
ic
pro
duct
s
Oth
er n
on
-met
alli
c
min
eral
pro
du
cts
Bas
ic m
etal
s &
fabri
cate
d m
etal
…
Com
pute
rs, el
ectr
on
ic &
elec
tric
al e
qu
ipm
ent
Mac
hin
ery
& e
qu
ipm
ent
Mo
tor
veh
icle
s
Oth
er t
ransp
ort
equip
men
t
Oth
er m
anu
fact
uri
ng
;
repai
r et
c.
To
tal
bu
sines
s se
rvic
es
South Asia (Only India) ASEAN East Asia North America EU28 South and Central America

Page 49 of 72
EA: In 2011, the region too largely supplied inputs belonging to the industry of wood, papers, rubber,
plastic, chemicals, metals (above 50% share), along with above 30% share in ICT, machinery equipment,
food and textile products. In 2015, EA’s FL share rise has been more in case of electric items, metals,
rubber/plastic, machinery equipment and even coke oil. Country-wise, in manufacturing, the share of Japan
has been the highest, and there has been rise in FL shares of all countries (Hong Kong’s share did not rise
much). China’s FL increased by 6 percentage points, Chinese Taipei by 10 percentage points, and Korea
by 8 percentage points. Thus, this region exports more of its value added for adding into other countries’
exports (rise of 6.3 percentage points as compared to just 2 percentage points in ASEAN region).
NA: In 2011, the region exported large DVA from wood, paper, chemicals and mineral products, metals,
also some textile and ICT sub-sectors. In 2015, the shares of most of them declined except for coke oil &
ICT products, as well as motor vehicles. Country wise too, same trend has been followed by US. Mexico’s
FL has been lower than that of US, but still remains significant (mainly in metals and wood) during both
the periods. Canada’s FL largely declined during 2011-16 in motor vehicles and chemicals, but rose in ICT
products.
SCA: In 2011, the region significantly exported value added from industrial sub-sectors of wood, paper,
chemical, metals, like NA. In 2016, shares declined except for textiles, wood and also electrical machinery.
Country-wise, shares in manufacturing have been about 50% and above for Peru, Chile and Colombia in
2011. Except Peru, the shares of other countries declined in 2016 but still remained above 48%.
EU-28: The region too largely exported inputs belonging to the category of wood, paper products,
chemicals, rubber-plastics, metals, and computer products (above 60%), as well as textiles (above 40%) but
remained less integrated than NA (though equivalent or slightly better placed than ASEAN). From 2011 to
2016, shares of FL in coke oil, ICT/electrical products, wood, and machinery equipment, have increased.
Country-wise, in 2011, shares were in the range of 21-22% (Hungary and Malta) to above 40-42% (Finland,
Latvia). In 2015, the share increased for many of the countries in the range of 25% (Malta) to 46% (Finland).
It may be noted that product-country combinations have been highlighted where share of FL is 50% or
more in the tables 8 and 9. This is because the highest share of forward linkages among the regions during
2011 and 2015 has been around 50% which is taken as benchmark for finding prominent suppliers in
different industry value chains. Main findings are as follows:-
a. In both the years, FL has been significantly large in selected value chains only, that is, in case of wood,
paper, rubber and plastic, non-metallic mineral products and basic & fabricated metal products’ value
chains. In these chains, all the regions have been the important suppliers.
b. However, in 2011, maximum number of ASEAN and EA countries (mainly Japan and China), US,
along with SCA countries played more significant role in chemical and pharmaceutical as compared to
few European countries. The trend continued even in 2015 with more nations such as Korea but with
increasing role of EA countries (also, shares of ASEAN countries did not fall except in case of Brunei
Darussalam).
c. As prominent coke oil suppliers in GVCs, Indonesia, Malaysia and some SCA countries dominated in
both years, EU-28’s link in this chain in 2015 was lower.
d. Using the 50% benchmark, Japan has higher FL in textiles and leather value chains in both the years,
but has improved shares in ICT & electrical value chains (along with Chinese Taipei and US) in 2015.
On the other hand, SA (India) has been a key player in the value chains of wood, paper, rubber/plastic,
chemical, metals, and mineral products, with rising shares.
e. Shares of ASEAN and SCA countries have been significant in case of wood value chains during 2015.

Page 50 of 72
f. Although forward linkages by regions have been lower for motor vehicles, machinery equipment, and
other transport equipment value chains, but the shares did not decline during 2011-16 for many Asian
countries (except for ASEAN’s decline in automotive FL).
The reasons for rising FL in many ASEAN regions matches with the visions of newly announced trade and
industrial policies, which have made to meet growing import demands and to develop domestic
industrialization with higher value added content to link better or upgrade into GVCs/RVCs.
Table 7: Country-wise DVA in exports of intermediates as a share of total exports (2011 and 2016
for sectors) (%)
Country
2011 2015
Agriculture,
forestry &
fishing
Manufacturi
ng
Total
business
services
Agriculture,
forestry &
fishing
Manufactur
ing
Total
business
services
India 53.6 32.1 46.0 56.0 37.0 43.4
ASEAN
Brunei
Darussalam 12.1 54.9 56.2 21.1 14.8 49.0
Cambodia 52.3 32.0 35.5 56.8 34.4 32.9
Indonesia 61.0 46.5 55.4 58.6 45.1 51.6
Malaysia 47.1 31.2 39.9 46.1 36.2 41.3
Philippines 50.3 40.9 49.5 55.5 43.5 50.1
Singapore 25.4 28.2 49.7 38.8 31.9 49.0
Thailand 53.9 31.3 36.3 53.7 34.5 33.8
Viet Nam 43.3 25.2 36.3 43.4 27.1 35.2
East Asia
Japan 32.9 44.6 61.2 45.8 46.0 58.4
Korea 48.5 30.9 48.3 48.2 39.3 51.6
China 57.4 38.8 46.9 56.6 44.5 50.0
Hong Kong 9.7 27.5 38.3 15.6 28.0 41.5
Chinese
Taipei 42.4 33.9 52.3 41.7 44.1 54.0
North America
Canada 52.4 41.7 54.9 53.1 39.5 53.7
Mexico 63.6 26.5 46.4 63.0 24.1 41.0
US 53.1 43.3 52.0 57.3 45.8 51.3
EU 28
Czech
Republic 46.9 29.9 40.2 45.9 31.6 40.8
Estonia 47.7 29.7 45.8 44.0 32.1 43.1
Hungary 43.2 21.9 41.3 39.7 26.7 40.0
Latvia 50.4 42.3 45.9 47.7 43.3 44.2
Lithuania 41.7 27.4 44.5 40.1 30.8 42.9
Poland 47.5 35.2 45.4 45.6 37.8 44.3

Page 51 of 72
Slovak
Republic 46.2 25.6 40.0 47.8 28.2 41.2
Slovenia 44.0 32.9 37.6 45.6 37.5 37.9
Bulgaria 42.3 30.0 33.5 41.6 30.1 37.9
Croatia 32.3 34.8 25.4 33.5 35.5 23.7
Cyprus 41.1 27.1 47.1 40.4 30.6 42.6
Malta 22.1 20.6 12.8 18.9 24.5 17.8
Romania 53.2 39.4 42.0 49.6 39.3 45.7
Austria 39.2 37.4 44.1 39.6 40.6 43.0
Belgium 41.3 32.7 50.8 40.2 33.2 48.3
Denmark 41.2 31.5 46.5 38.2 34.9 44.1
Finland 51.6 40.2 49.0 53.4 45.9 48.7
France 46.1 36.4 50.1 47.8 38.5 51.5
Germany 49.2 38.0 52.6 47.5 40.0 53.8
Greece 39.6 35.6 43.6 38.4 34.1 35.5
Ireland 30.6 27.8 39.3 27.7 30.7 32.2
Italy 51.1 35.1 43.9 50.5 38.1 43.8
Luxembourg 28.5 32.2 25.4 24.0 31.8 20.5
Netherlands 45.3 35.7 55.2 44.7 33.8 52.2
Portugal 44.0 34.8 37.6 43.8 35.8 35.0
Spain 51.2 35.0 40.5 50.3 36.9 39.4
Sweden 48.6 39.1 49.9 48.7 42.3 49.4
United
Kingdom 48.0 34.5 58.1 46.7 38.6 57.1
South and Central America
Chile 53.0 51.7 55.0 54.5 50.5 54.1
Argentina 53.4 43.7 52.0 56.9 44.4 50.1
Brazil 56.6 49.1 61.7 58.4 48.3 57.7
Colombia 63.4 55.9 45.2 62.1 47.9 40.8
Costa Rica 54.9 34.3 36.6 55.0 33.1 40.6
Peru 61.8 49.5 44.3 61.1 52.7 40.4
Source: Data from OECD-WTO TiVA Database 2018 version

Page 52 of 72
Table 8: Country-wise DVA in exports of intermediates as a share of total exports (2011) – only manufacturing (%)
Country
Food
prod
ucts,
bever
ages
&
tobac
co
Texti
les,
appa
rel &
leath
er
prod
ucts
Woo
d &
its
prod
ucts
Pape
r &
its
prod
ucts
Coke
&
refine
d
petrol
eum
produ
cts
Chemical
s &
pharmac
eutical
products
Rub
ber
&
plast
ic
prod
ucts
Othe
r
non-
meta
llic
mine
ral
prod
ucts
Basic
metal
s &
fabric
ated
metal
produ
cts
Comp
uters,
electro
nic &
electri
cal
equip
ment
Machi
nery
&
equip
ment,
nec
Moto
r
vehicl
es&
traile
rs
Other
transp
ort
equip
ment
Other
manufact
uring;
repair
etc.
India 40.3 34.3 19.8 39.1 26.3 43.5 55.4 41.4 44.2 27.5 26.2 20.1 16.1 14.6
ASEAN
Brunei
Darussalam 11.9 11.8 46.4 24.0 4.7 76.2 55.3 82.4 86.5 17.6 38.4 1.1 32.1 5.2
Cambodia 31.5 16.7 75.8 46.5 6.9 27.3 40.4 44.5 42.1 25.3 14.2 15.4 19.0 13.4
Indonesia 34.8 27.1 84.7 70.1 59.6 67.8 59.0 82.4 79.6 33.8 24.0 29.8 13.3 17.4
Malaysia 25.9 22.2 68.0 49.7 57.5 50.3 43.7 60.0 43.4 22.1 19.5 13.5 11.8 16.9
Philippines 35.9 12.7 72.1 55.4 32.9 53.9 56.0 66.4 70.0 38.9 29.3 28.9 23.1 40.4
Singapore 22.3 12.9 40.5 53.6 12.6 40.0 47.1 49.7 45.9 33.2 23.6 19.8 13.6 15.6
Thailand 34.2 34.1 64.4 50.3 33.1 50.3 42.3 57.1 39.3 23.7 14.7 15.8 12.7 8.8
Viet Nam 26.1 20.1 47.2 42.6 42.7 40.4 38.0 59.0 44.0 22.1 13.8 25.9 14.4 9.6
East Asia
Japan 39.0 61.6 37.8 76.8 34.8 68.8 71.3 79.7 70.0 49.9 32.8 26.9 22.0 19.5
Korea 29.1 44.5 50.5 54.2 15.8 46.4 50.9 54.2 45.4 33.7 20.9 18.7 18.6 14.8
China 39.7 33.3 68.5 66.4 46.2 59.3 62.1 72.2 65.7 32.2 32.8 25.6 21.5 17.0
Hong
Kong 18.6 28.0 5.7 51.2 38.5 41.8 55.7 55.5 35.3 29.9 11.6 3.0 18.8 16.3
Chinese
Taipei 24.2 38.5 45.9 47.7 13.9 32.5 42.8 50.6 39.9 38.1 18.3 16.6 14.9 12.2
North America
Canada 31.1 27.6 76.5 65.6 38.6 48.2 50.1 69.7 57.4 35.9 43.8 19.2 15.0 21.3
Mexico 25.0 10.3 53.0 39.7 44.0 38.5 36.8 46.0 63.6 18.1 42.3 19.3 17.6 11.5
US 32.1 45.5 76.2 68.1 39.4 59.5 68.7 77.1 72.7 47.2 23.3 20.2 25.7 17.4
EU 28

Page 53 of 72
Czech
Republic 26.0 27.1 52.8 50.4 11.2 40.9 45.0 57.4 47.5 21.7 27.5 20.0 22.2 20.0
Estonia 22.3 19.3 56.1 51.3 51.7 36.9 40.4 56.2 37.9 13.2 21.1 14.9 21.9 21.5
Hungary 25.9 24.9 47.7 42.9 19.7 30.5 39.9 48.6 38.3 12.0 24.8 16.8 17.5 21.6
Latvia 21.9 18.3 66.8 42.1 58.8 35.3 48.8 50.7 50.5 25.5 25.3 18.4 14.0 26.9
Lithuania 26.6 24.4 54.8 59.5 12.6 39.3 52.6 56.6 51.8 28.8 23.3 22.1 23.4 16.8
Poland 30.2 23.6 60.5 56.8 26.4 46.6 52.8 63.7 54.7 26.4 29.9 21.4 18.6 19.0
Slovak
Republic 24.0 25.4 62.4 50.7 11.5 35.0 41.1 56.5 45.9 15.9 25.7 14.7 19.9 21.5
Slovenia 23.1 27.8 47.9 46.0 41.1 30.8 43.0 54.2 45.7 30.1 26.1 17.9 19.6 20.6
Bulgaria 22.9 18.4 53.1 47.6 14.2 36.0 41.0 54.8 39.0 27.9 23.6 20.4 16.3 18.3
Croatia 21.2 23.6 52.7 40.9 30.4 43.7 44.6 60.4 52.9 33.6 29.9 21.7 27.4 24.9
Cyprus 18.3 8.4 15.3 42.0 32.9 19.7 48.5 52.9 58.3 14.1 19.3 11.9 20.2 33.9
Malta 22.0 16.9 8.8 49.1 8.7 15.5 39.3 45.3 39.9 15.8 34.7 22.3 8.7 21.3
Romania 30.1 27.6 73.8 65.9 44.6 47.0 46.4 61.3 63.0 42.5 30.4 26.3 22.3 19.3
Austria 29.5 30.3 58.5 54.4 13.2 38.0 54.1 61.2 51.5 34.3 26.1 21.5 18.7 31.5
Belgium 25.5 27.3 49.7 47.6 21.5 40.2 48.3 54.0 46.5 32.2 24.7 13.1 24.5 25.4
Denmark 26.8 24.5 56.4 51.5 32.3 34.0 51.4 54.5 53.0 32.0 25.5 26.0 20.9 17.6
Finland 27.9 29.1 65.5 61.0 19.7 51.1 54.6 60.9 48.0 30.5 22.6 20.9 24.0 23.7
France 33.2 28.2 67.7 61.9 19.6 46.2 61.6 69.6 59.8 33.4 26.7 23.7 14.8 32.9
Germany 29.4 35.0 66.0 61.2 24.6 51.1 61.0 68.0 61.3 37.3 27.8 23.2 25.4 25.8
Greece 28.1 23.9 53.7 46.4 20.1 42.7 53.0 58.7 62.6 33.1 24.8 26.1 21.6 29.9
Ireland 27.3 22.6 51.3 49.1 8.6 27.3 44.7 50.3 45.1 24.9 29.4 20.7 20.0 20.6
Italy 31.5 32.3 47.1 60.6 16.0 39.5 55.9 64.7 54.4 32.5 25.1 24.2 21.8 22.7
Luxembour
g 20.1 24.1 34.9 41.8 3.5 39.0 36.6 44.3 36.7 24.6 20.7 15.7 19.3 35.0
Netherlands 30.1 30.2 58.0 56.2 21.5 47.3 58.2 63.1 52.3 22.1 31.3 24.2 24.0 34.2
Portugal 29.5 28.6 65.4 56.5 13.8 42.5 53.8 66.0 51.7 26.3 24.9 16.2 23.4 27.2
Spain 30.9 27.3 61.2 60.1 15.6 44.3 56.1 66.6 56.2 33.7 28.5 17.9 23.8 30.0
Sweden 30.5 28.8 64.2 61.6 16.1 43.3 57.2 60.2 56.0 36.8 29.3 20.6 21.6 23.4
United
Kingdom 33.9 30.9 48.5 54.3 27.6 40.3 57.4 59.7 54.5 31.9 31.2 21.2 18.7 25.1
South and Central America

Page 54 of 72
Chile 35.5 25.8 72.6 69.1 15.1 55.7 53.6 67.6 73.9 29.7 25.5 15.8 21.4 29.8
Argentina 37.4 45.0 79.3 68.4 64.1 59.0 65.1 78.3 79.0 39.9 30.0 19.7 22.5 29.3
Brazil 35.4 44.0 81.1 74.5 52.4 60.6 67.6 76.9 80.4 39.7 33.4 32.1 19.1 34.8
Colombia 35.3 29.6 73.7 65.4 53.4 56.3 62.4 77.2 82.1 41.2 36.3 8.1 13.6 24.3
Costa Rica 32.4 13.0 69.6 58.4 47.3 47.1 52.9 63.8 58.6 38.0 26.7 19.3 9.5 11.7
Peru 36.4 18.7 82.6 59.0 44.7 59.5 60.8 81.4 80.5 28.5 34.9 7.0 13.8 14.0
Source: Data from OECD-WTO TiVA Database 2018 version
Table 9: Country-wise DVA in exports of intermediates as a share of total exports (2015) – only manufacturing (bold ones indicate decline
from 2015 to 2011) (%)
Country
Food
prod
ucts,
bever
ages
&
tobac
co
Texti
les,
appa
rel &
leath
er
prod
ucts
Woo
d &
its
prod
ucts
Pape
r &
its
prod
ucts
Coke
&
refine
d
petrol
eum
produ
cts
Chemical
s &
pharmac
eutical
products
Rub
ber
&
plast
ic
prod
ucts
Othe
r
non-
meta
llic
mine
ral
prod
ucts
Basic
metal
s &
fabric
ated
metal
produ
cts
Comp
uters,
electro
nic &
electri
cal
equip
ment
Machi
nery
&
equip
ment,
nec
Moto
r
vehicl
es&
traile
rs
Other
transp
ort
equip
ment
Other
manufact
uring;
repair
etc.
India 35.7 37.2 38.1 51.4 36.2 47.5 58.0 57.1 50.9 33.9 29.1 22.4 18.2 19.1
ASEAN
Brunei
Darussalam 15.3 7.9 34.2 5.4 3.3 37.4 49.8 81.2 85.6 15.1 25.9 0.6 23.8 3.5
Cambodia 33.0 26.2 83.2 50.1 0.6 47.4 48.5 58.7 50.4 41.9 23.6 29.9 23.1 17.1
Indonesia 31.3 33.1 86.4 68.1 59.6 68.3 60.9 87.9 77.9 41.8 28.1 27.3 14.4 21.0
Malaysia 25.0 24.2 70.1 52.1 61.9 53.9 46.7 66.0 47.0 29.1 25.0 16.0 15.5 22.1
Philippines 33.8 22.5 76.6 53.5 36.8 62.1 61.0 75.0 74.3 43.4 33.7 26.5 24.3 42.0
Singapore 22.9 17.8 35.9 54.9 16.6 40.7 50.6 46.3 45.3 37.9 24.1 18.8 17.4 22.1
Thailand 33.9 33.6 69.0 48.9 37.7 56.5 48.1 61.0 44.7 32.5 17.9 17.5 15.3 14.5
Viet Nam 25.4 24.5 47.9 42.4 47.5 44.1 40.8 59.2 44.9 22.4 14.9 23.0 12.9 9.4
East Asia
Japan 33.9 53.8 36.2 73.0 34.9 67.3 72.2 77.8 73.7 54.8 40.6 23.7 22.5 27.3
Korea 29.9 47.8 56.3 60.5 21.0 55.3 60.4 65.1 57.6 44.7 28.6 19.5 23.3 22.3

Page 55 of 72
China 40.4 36.9 71.2 68.1 48.5 62.8 68.1 77.3 73.1 40.2 38.1 25.8 21.0 18.2
Hong
Kong 30.8 28.7 0.3 39.6 36.0 45.1 61.1 61.8 34.9 27.0 10.4 4.9 19.7 19.1
Chinese
Taipei 26.3 46.7 51.8 53.2 18.1 43.0 52.8 61.7 49.7 50.4 25.9 15.4 18.6 18.6
North America
Canada 32.0 26.7 74.5 63.4 36.9 42.7 51.7 66.6 59.2 40.1 42.8 9.8 18.4 25.3
Mexico 26.0 14.6 57.9 42.3 40.8 35.6 42.6 48.7 56.5 26.6 38.8 12.1 20.5 13.8
US 35.5 44.3 77.4 67.6 48.5 59.1 65.3 76.6 72.7 52.9 27.8 29.6 28.1 24.4
EU 28
Czech
Republic 25.4 28.4 55.3 48.9 11.7 46.0 47.2 56.2 51.2 26.1 28.6 22.3 23.7 26.9
Estonia 20.5 21.6 58.4 49.5 46.7 38.7 43.6 58.9 41.0 17.1 23.2 18.7 26.1 25.8
Hungary 24.7 27.1 47.6 44.3 20.1 33.5 42.2 50.4 40.0 19.5 27.6 22.3 18.0 24.2
Latvia 22.3 21.1 65.4 45.8 48.0 36.4 52.6 56.0 50.6 28.6 27.7 17.8 19.1 26.3
Lithuania 26.1 23.1 62.1 58.8 13.0 42.1 52.6 58.2 47.6 30.8 26.2 24.4 29.2 24.0
Poland 28.2 27.4 61.4 56.4 28.9 46.1 54.6 64.6 54.6 30.1 29.7 30.0 19.7 24.0
Slovak
Republic 22.9 26.7 64.0 51.3 18.3 42.9 47.6 57.7 50.1 19.0 25.4 18.3 19.1 22.6
Slovenia 24.3 28.1 48.4 46.5 23.1 34.5 48.7 58.7 49.3 33.7 28.6 26.7 25.6 28.1
Bulgaria 23.3 19.4 59.8 46.6 14.5 31.8 41.9 55.7 37.0 28.4 23.0 20.3 17.6 22.0
Croatia 22.2 25.0 52.2 41.5 31.2 41.5 48.7 61.7 54.2 34.0 30.5 24.0 22.0 26.7
Cyprus 18.9 13.3 18.6 39.0 27.0 24.0 48.4 63.5 57.4 33.5 23.7 19.3 22.9 41.9
Malta 22.6 13.2 13.0 40.5 5.0 16.2 39.9 42.4 31.6 23.3 32.0 23.9 13.0 22.8
Romania 25.8 28.0 67.7 57.3 44.8 54.5 54.3 69.3 62.9 39.7 31.5 29.5 22.7 26.0
Austria 28.6 30.0 59.3 55.3 16.1 45.0 55.4 63.5 56.1 39.8 29.9 27.3 20.2 35.5
Belgium 24.3 24.9 50.0 48.1 22.5 38.9 47.9 52.9 46.7 34.1 27.5 15.9 25.3 30.4
Denmark 25.2 26.5 59.7 52.8 42.9 35.2 55.8 61.8 59.7 39.3 31.5 30.6 21.6 23.2
Finland 29.7 30.8 68.4 61.2 28.5 53.5 58.6 64.5 56.4 35.3 28.3 30.0 23.7 29.3
France 33.1 31.6 69.9 61.9 22.6 49.9 65.7 71.2 65.0 38.2 29.9 29.7 15.8 42.9
Germany 28.9 33.4 66.1 61.2 27.6 51.3 62.7 68.1 64.1 42.4 31.8 26.8 26.9 35.9

Page 56 of 72
Greece 26.8 22.1 43.2 41.9 17.7 45.1 48.6 66.7 70.2 31.4 24.4 23.7 26.0 22.5
Ireland 28.3 23.6 47.4 61.5 15.2 29.6 53.2 52.3 51.1 31.4 34.8 22.2 31.5 27.1
Italy 31.7 36.4 54.8 60.8 18.5 45.3 59.9 68.3 58.2 36.4 28.8 24.1 22.6 27.4
Luxembour
g 18.2 23.8 33.6 42.5 4.1 38.5 43.4 51.8 35.1 23.7 21.1 20.3 13.8 37.3
Netherlands 28.7 29.7 57.8 50.4 19.7 46.2 57.9 60.1 53.4 18.3 30.8 26.8 23.8 36.6
Portugal 27.5 31.8 66.0 55.2 15.0 41.6 55.7 66.0 51.2 28.3 24.7 20.5 19.3 24.9
Spain 30.0 30.2 62.7 56.5 19.3 47.1 58.3 66.9 59.4 35.0 29.7 22.9 24.8 27.1
Sweden 30.4 31.7 67.9 61.7 25.5 44.3 58.8 62.3 62.7 39.2 32.4 24.1 24.5 29.5
United
Kingdom 34.9 31.4 51.4 57.3 35.5 42.5 64.5 67.5 64.4 38.4 33.2 25.5 20.7 35.1
South and Central America
Chile 35.6 33.3 78.1 70.7 25.6 53.7 55.3 69.2 69.1 33.4 28.8 16.9 22.4 35.8
Argentina 35.4 48.6 81.1 68.9 62.3 54.5 67.8 80.4 85.7 46.2 36.4 27.0 30.3 28.4
Brazil 34.0 44.6 81.2 72.5 49.7 57.7 65.7 76.8 79.1 41.6 33.3 24.9 16.0 36.0
Colombia 31.1 25.3 61.3 59.3 44.9 47.4 54.3 78.1 77.5 36.4 29.9 18.3 12.4 25.9
Costa Rica 30.9 30.1 72.7 59.2 45.8 45.9 56.0 68.1 63.7 41.5 31.8 14.9 27.4 14.9
Peru 34.6 23.7 80.8 58.1 51.3 55.9 61.6 82.0 89.8 32.0 38.4 13.4 16.9 15.6
Source:Data from OECD-WTO TiVA Database 2018 version

Page 57 of 72
6. Policy Directions to Reshape Asian Role in GVCs
Review of Asian countries’ announced policy documents and analysis of trends in forward and backward
linkages vis-à-vis economies in Europe and America reveal the potentialities and capabilities that former
have in terms of upgrading or leading GVCs and even strengthening RVCs. Asia can emerge as major
leader in manufacturing value chains if the region properly integrate industry-specific policies with those
related to services sector mainly IT and digital policies.
FDI has never been a separate issue as most of the GVCs happen to be highly influenced by FDI flows that
goes into number of developing countries, as well as by latter’s outward FDI flows that feed other country’s
value chains. Thus, the paper suggests for improved policy synchronization of FDI, trade and industrial
policies which is although currently happening in few countries of Asia. But more dedicated efforts are
required to weave together the objectives placed in different plans, policies and strategies. For instance,
development of Industry 4.0 must rise but a view to support domestic industries who are largely export-
oriented in nature so that a country can improve its global competitiveness. Ministries or government
departments in each country dealing with implementation of investment, trade and industrial policies must
meet regularly to discuss the progress so that united efforts can be taken, particularly in SA countries. To
elaborate, India could think of combining its foreign trade policies with digitalization, for instance as
suggested by Banga (2019b) to come up with ‘Digitally-Informed’ foreign trade policy with a view to
“improve India’s digital infrastructure for trade, enhance the digital content in its exports, build digital skills
in tradeable sectors, promote the use of digital technologies in manufacturing exports, and use big data
analytics to inform foreign trade policy.” (Banga, 2019b) All such efforts are crucial for major developing
countries such as India to deal with rising challenges and opportunities from Industry 4.0, advanced digital
technologies and innovation which are taking place in East Asian countries at transformational level, as
India still lags behind in gaining comparative advantages in IPR, DT, AI, etc.
The way US and other advanced countries are progressing in terms of robotization in manufacturing can
led to job losses in and reshoring of activities from developing countries of Asia. But former’s efforts are
also said to be harmful for their own economy in terms of rising de-industrialization. Thus, Asia can lead
differently by incorporating such technologies but with a view of creating and vastly adopting new model
of globalization, automation and digitation along with well-thought yet quick consideration of social and
environmental aspects too, such as coming up with more environmentally-friendly biodegradable or green
products, keeping human resources on equal stand foot as robots in production phase so to meet growing
need for employment of rising population in countries like India, China, etc. All this is further required on
the two grounds: (i) the kind of jobs that Developing Asia creates as compared to developed ones in the
form of small business related jobs located in villages, agriculture-based jobs, small-items manufacturing
based jobs with high component of labour-usage, etc.; and (ii) Asia cannot escape effects of robotizatioon
and DT that are currently advancing in abroad economies, and thus need more sustainable level of readiness
to deal with continuous challenges that they are currently facing and will continue to face on this front. The
question of how all this is to be done is critical but not difficult to answer due to rising efforts of countries
even for Society 5.0 such as in Japan.
However, while it is important to learn lessons from successful experiences of countries in the post-crisis
period, the differences in each country’s trade and investment climate, and size of markets should be kept
in mind particularly in Asia which has variety of political, social and cultural set up. For instance, many
SEA and EA countries have followed export-led industrialization, while focus of India has been on
domestic growth over many years though recently it is making policies to double exports’ share at world’s
level and move up in GVCs.

Page 58 of 72
Moreover, there are also challenges for applying smart production in traditional industries’ production
patterns where more awareness needs to be spread so that better quality products for exports purposes could
be easily supplied by developing Asian economies.
The key takeaway is that unless different Asian regions’ cooperate among themselves, they will even fail
to compete with rising heads of advanced nations. The efforts first must be done at country level, then for
growth at regional level in different industry value chains, so as to create dynamic cross-region linkages,
such as in case of machinery equipment, automotive, textile and leather value chains. For instance, countries
at lower rungs of development say in South Asia could help many ASEAN and East Asian countries to
move up the ladder easily in this chain by providing backward linkages’ support. India’s services sector
could be linked to manufacturing value chains of EA and SEA, while it can continue to strengthen its
growing forward linkages in case of metals, minerals, paper industry as well as rubber and plastics, and
build more capacities along with ASEAN for linkages in computer/ICT/electrical goods, machinery and
equipment and transport equipment. Many Asian counties have higher forward linkages in wood value
chains too, along with many economies of Europe and America, but scope for Asia also lies in improving
position as key supplier in food and textile/leather value chains.
Although post crisis, shares of many Asian countries are declining, but this is also indicative of shifting
share of GVCs pie to number of less developing countries. Thus the suggestion is that each country should
to strive maintain balance between backward and forward linkages as per industry requirement. This should
be decided formally by regular interactions of industrial associations, policy makers along with government
bodies at regional level which will help to pin-point more particular targets for each country in the region
and the areas where each can contribute to strengthen regional value chains in identified competitive
manufacturing sub-sectors. There is also a scope for increasing participation in total business services sector
for value chains integration purposes mainly by ASEAN.
Also as the trade-war between China and US is rising, affecting many other countries including India, thus
more opportunities could be captured in strengthening GVCs by reshaping the position of other Asia
including India. Also, FDI outward and inward flows of devolving Asia are also rising post-crisis as
compared to developed world, thus making it more suitable to harness such opportunities.
Protectionism can also not serve growing efforts for bilateral and regional free trade agreements in the
longer run, and thus it is essential that Asia should unite, even with EU, to build its policies and strategies
as per the multilateral framework of WTO. This is because liberal trade regime has found to have largely
delivered good results over the years in terms of strengthening economic relations among the countries.
Successful negotiation of Regional Comprehensive Economic Partnership (RCEP) agreement could be a
game-changer if all ASEAN countries can be involved even those who are at lower strata of GVCs and
investments currently.
7. Conclusion
The paper has reviewed the changing nature and pattern of GVCs integration, via backward and forward
linkages in selected Asian economies (i.e. South East Asia, East Asia and South Asian economies),
particularly in comparison with European and American economies. Manufacturing GVCs have been
continuously reorganizing post crisis of 2008-09, and the trends have been dwindling for many economies
post 2013-14 when global exports largely declined. From this period onwards, many Asian economies have
registered a decline in their FVA context in gross exports, particularly in East Asian ones such as China,
and in South Asia (India), thereby suggesting rise in domestic value content in exports and particularly in
forward linkages. Total business services and agriculture sectors still could not find higher backward or

Page 59 of 72
forward linkages post-crisis despite declining FVA shares in both the sectors for many regions. However,
ASEAN region as a whole has shown significantly rising integration in these sectors, along with much
higher share of FVA in manufacturing.
It may be noted that very high forward linkages in Asia (and even Europe) have mostly been in wood,
paper, chemicals, metals, etc., but higher backward linkages were found in ICT, machinery and transport
equipment, along with coke oil, metals, and even textiles.
This paper has also reviewed the changing theoretical platform of GVCs which has been organised mainly
with focus on Asian integration, starting from flying-geese pattern, fragmentation and agglomeration, to
the snakes and spiders patterns, encompassing nexus of trade-investment-services along with IPR issues.
However, smiley curve is now anticipated to change as per the interplay of digital technologies (DT) and
fourth industrial revolution such as AI, big data analytics, automation in manufacturing, etc. thereby scoep
for widening the value added that can be earned by Southern developing and Northern advanced countries.
Recent explanation has been found in the framework of DT-driven upgrading in GVCs owing to growing
nexus of trade-investment-services-IP-DT-Industry 4.0. However, more theoretical models of GVCs
incorporating major changes in GVCs mainly in developing countries still need to be properly formulated.
But it is clear that comparative advantages in GVCs would not only be restricted to trade in tasks,
production, processes but would also extend in IT usage, IPR policies and use of smart innovative
manufacturing technique, including robotics and data flows across the regions or within it.
Foreign trade, industrial, and even investment policy documents of Asian economies have also been
properly analysed and it is found that China, Japan and Korea are making their policies more attuned to DT
and AI, while SEA countries such as Philippines, Myanmar, Vietnam, Singapore, Cambodia, Thailand are
coming up strong holistic development plans incorporating objectives of export promotion, FDI growth,
and DT. SA countries like India, Nepal, Bangladesh, Pakistan, etc. are coming up with dedicated trade and
industrial policies with the aim of promoting their own brands globally and to better link into GVCs.
Post crisis, big developing Asian countries are promoting their domestic value added in manufacturing via
schemes like India’s ‘Make in India’, China’s ‘Made in China 2025’, etc. This is critical in terms of rising
protectionism practices being followed by many countries, along with import restrictions and tariff hikes
by US on China and other trading partners. The idea is now to synchronize policies of Asia - first region-
wise and then their linking with each other - to strengthen Asian value chains as European & American
value chains in manufacturing are either slowing down or are already developed so that any further linking
may not happen that fast. For the Asian economies, this is the right time to cooperate rather than compete
which will require fresh innovative thinking and brainstorming sessions. For instance, EA and SEA should
increase forward linkages in more sophisticated complex stream of manufacturing in machinery, ICT as
well as in the metal segment. SA should now use opportunity to strengthen textile and leather value chain,
and in metals and chemical products where India holds capacity.
Although China-centered GVCs are slowing down, but due to digitalization, automation, and innovation
and associated changes in trade policies that have been gradually taking place, many developing countries
of Asia mainly China, Korea, SEA countries such as Thailand, Singapore, Vietnam, etc. as well as many
South Asian economies such as India (even though sector-specific and lesser integration than other Asia)
are all set to emerge with a different look in GVCs. Japan is now reviving to strengthen its domestic as well
as regional value chains. On the other hand, US and EU value chains have matured much, leaving significant
opportunity for Asia to take over and build new paradigms, even in manufacturing. Asian economies can
thus take global trade and growth out of prolonged grim state.

Page 60 of 72
ANNEXURE
Table A: Share of region/country in global FDI outflows (%)
Region/Country 2012 2013 2014 2015 2016 2017 2018
Developed economies 69.5 64.8 60.0 73.9 71.3 64.9 55.1
Developing economies 27.9 29.7 34.4 24.2 27.1 32.4 41.2
EU 28 25.1 24.9 16.5 38.9 31.6 29.0 38.5
North America 29.3 26.2 30.3 19.7 23.2 26.7 -1.3
United States 24.9 22.0 25.6 15.7 18.7 21.1 -6.3
Developing Asia (excluding
Japan) 24.0 26.3 31.7 22.1 25.7 28.9 39.6
South Asia 0.8 0.2 0.9 0.5 0.4 0.8 1.1
Afghanistan 0.0 0.0 0.0 0.0 0.0 0.0 0.0
Bangladesh 0.0 0.0 0.0 0.0 0.0 0.0 0.0
India 0.7 0.1 0.9 0.5 0.3 0.8 1.1
Pakistan 0.0 0.0 0.0 0.0 0.0 0.0 0.0
Sri Lanka 0.0 0.0 0.0 0.0 0.0 0.0 0.0
South-East Asia 4.6 5.9 6.9 4.1 3.2 5.0 6.9
Cambodia 0.0 0.0 0.0 0.0 0.0 0.0 0.0
Indonesia 0.4 0.5 0.5 0.4 -0.8 0.1 0.8
People's Democratic Republic of
Lao 0.0 0.0 0.0 0.0 0.0 0.0 0.0
Malaysia 1.3 1.0 1.3 0.6 0.5 0.4 0.5
Philippines 0.3 0.2 0.5 0.3 0.1 0.1 0.1
Singapore 1.6 3.3 4.0 2.7 2.6 3.1 3.7
Thailand 0.8 0.8 0.4 0.1 0.8 1.2 1.7
Timor-Leste 0.0 0.0 0.0 0.0 0.0 0.0 0.0
Viet Nam 0.1 0.1 0.1 0.1 0.1 0.0 0.1
East Asia 16.9 16.9 22.2 15.2 19.5 20.4 26.8
China 6.9 7.8 9.5 8.7 12.7 11.1 12.8
Hong Kong 6.5 5.9 9.6 4.3 3.9 6.1 8.4
Republic of Korea 2.4 2.1 2.2 1.4 1.9 2.4 3.8
Macao 0.0 0.1 0.1 0.0 -0.1 0.0 0.0
Mongolia 0.0 0.0 0.0 0.0 0.0 0.0 0.0
Taiwan Province of China 1.0 1.0 1.0 0.9 1.2 0.8 1.8
Japan 9.6 9.9 10.1 8.1 9.8 11.3 14.1
South and Central America 3.1 2.5 1.8 1.5 0.7 2.5 0.6
Source: UNCTAD (2019) [Note: Developing countries is as per UNCTAD database]
Table B: Share of region/country in global FDI inflows (%)
Region/Country 2012 2013 2014 2015 2016 2017 2018
Developed economies 50.4 48.6 45.9 62.4 62.4 50.7 42.9

Page 61 of 72
Developing economies 45.1 45.6 49.9 35.8 34.2 46.1 54.4
EU 28 25.6 24.1 19.6 31.3 29.0 22.7 21.4
North America 16.5 18.9 19.2 25.1 26.5 20.2 22.5
United States 13.5 14.1 14.9 23.0 24.6 18.5 19.4
Developing Asia (excluding Japan) 27.6 29.0 33.9 25.3 24.7 32.9 39.4
South Asia 2.2 2.5 3.1 2.5 2.8 3.5 4.2
Afghanistan 0.0 0.0 0.0 0.0 0.0 0.0 0.0
Bangladesh 0.1 0.1 0.1 0.1 0.1 0.1 0.3
Bhutan 0.0 0.0 0.0 0.0 0.0 0.0 0.0
Maldives 0.0 0.0 0.0 0.0 0.0 0.0 0.0
Nepal 0.0 0.0 0.0 0.0 0.0 0.0 0.0
India 1.6 2.0 2.5 2.2 2.3 2.7 3.3
Pakistan 0.1 0.1 0.1 0.1 0.1 0.2 0.2
Sri Lanka 0.1 0.1 0.1 0.0 0.0 0.1 0.1
South-East Asia 7.6 8.3 9.5 5.6 6.1 9.6 11.5
Brunei Darussalam 0.1 0.1 0.0 0.0 0.0 0.0 0.0
Cambodia 0.1 0.1 0.1 0.1 0.1 0.2 0.2
Indonesia 1.3 1.3 1.6 0.8 0.2 1.4 1.7
People's Democratic Republic of
Lao 0.0 0.0 0.1 0.1 0.1 0.1 0.1
Malaysia 0.6 0.8 0.8 0.5 0.6 0.6 0.6
Myanmar 0.0 0.0 0.1 0.1 0.2 0.3 0.3
Philippines 0.2 0.2 0.4 0.2 0.4 0.6 0.5
Singapore 4.1 4.0 5.4 2.9 3.8 5.1 6.0
Thailand 0.6 1.1 0.4 0.3 0.1 0.4 0.8
Timor-Leste 0.0 0.0 0.0 0.0 0.0 0.0 0.0
Viet Nam 0.6 0.6 0.7 0.6 0.7 0.9 1.2
Developing East Asia 14.4 15.5 19.0 15.6 14.1 17.9 21.5
China 8.2 8.7 9.5 6.7 7.0 9.0 10.7
Hong Kong 4.8 5.2 8.3 8.6 6.1 7.4 8.9
Democratic People's Republic of
Korea 0.0 0.0 0.0 0.0 0.0 0.0 0.0
Republic of Korea 0.6 0.9 0.7 0.2 0.6 1.2 1.1
Macao 0.3 0.3 0.3 0.1 0.1 0.0 0.1
Mongolia 0.3 0.1 0.0 0.0 -0.2 0.1 0.2
Taiwan Province of China 0.2 0.3 0.2 0.1 0.5 0.2 0.5
Japan (Developed Asia) 0.1 0.2 0.9 0.1 0.9 0.7 0.8
South and Central America 13.3 12.8 11.6 7.5 6.9 10.1 11.1
Source: UNCTAD (2019)

Page 62 of 72
Table C: FVA share of gross exports in the world (%)
Region/Country 2005 2008 2009 2011 2012 2014 2015 2016
India 18.8 24.5 21.8 25.1 25.1 23.0 19.1 16.1
ASEAN 31.4 30.5 28.1 28.9 29.1 29.2 28.9 28.2
Brunei Darussalam 7.5 7.3 7.5 9.0 11.3 6.9 5.4 7.7
Cambodia 29.5 27.6 25.5 26.4 27.4 27.7 26.9 28.6
Indonesia 18.4 15.0 12.1 12.8 13.3 14.1 12.9 11.3
Malaysia 45.0 40.3 39.8 39.4 38.1 36.6 36.9 36.1
Philippines 26.3 24.8 21.9 23.5 23.9 20.4 22.0 23.4
Singapore 42.8 45.2 42.1 43.5 43.8 43.0 40.9 39.5
Thailand 38.4 39.0 34.4 38.8 38.4 36.7 33.6 32.5
Viet Nam 36.1 41.5 37.2 41.8 40.9 42.4 44.5 43.6
East Asia 14.5 17.8 14.7 18.1 17.6 16.5 13.5 12.7
Japan 10.2 15.2 10.9 14.3 14.0 15.8 13.2 11.4
Korea 32.7 41.2 37.2 42.4 42.0 37.3 32.6 30.4
China 26.3 23.0 19.5 21.7 20.8 19.5 17.3 16.7
Hong Kong 27.7 32.7 29.1 32.4 31.9 29.2 26.6 24.8
Chinese Taipei 37.1 43.7 36.4 42.1 41.2 38.3 32.4 29.8
North America 8.1 9.9 7.6 9.7 9.7 8.7 7.7 7.4
Canada 19.6 19.6 20.1 20.9 21.7 20.1 21.2 20.6
Mexico 34.0 33.3 33.6 32.3 33.8 34.1 36.1 36.4
US 10.8 12.9 9.4 12.7 12.4 11.2 9.5 9.0
EU 28 10.4 12.7 10.8 14.0 14.3 12.9 12.2 11.6
Czech Republic 34.4 35.5 33.3 38.7 39.3 39.7 39.3 37.7
Estonia 30.4 31.8 27.8 38.4 38.6 36.9 34.8 34.5
Hungary 44.0 46.7 43.5 47.8 47.0 46.0 43.1 44.1
Poland 24.7 27.8 24.4 28.4 27.3 27.5 26.6 26.9
Slovak Republic 43.0 45.1 41.9 46.7 46.6 45.9 44.8 44.5
Slovenia 33.3 35.2 30.6 35.5 35.1 33.9 32.5 31.6
Bulgaria 32.4 40.7 31.7 37.2 38.0 37.3 36.2 32.2
Croatia 22.3 21.8 19.0 19.4 18.8 19.0 20.0 19.2
Cyprus 23.6 27.6 25.7 24.1 24.0 27.2 27.8 23.6
Latvia 21.4 20.4 18.8 23.2 24.8 22.2 22.4 20.7
Lithuania 29.5 33.5 26.8 35.5 34.8 32.6 31.6 29.4
Malta 50.9 60.3 62.3 67.9 65.7 61.5 59.2 59.3
Romania 27.6 22.7 19.8 23.7 24.3 23.6 22.9 21.6
Austria 25.5 27.2 23.3 29.7 29.9 28.7 26.5 26.6
Belgium 30.6 35.3 30.8 36.5 37.0 35.5 34.1 33.9
Denmark 26.2 31.5 27.7 29.5 30.1 29.1 29.3 28.1
Finland 27.5 31.6 27.8 31.4 32.1 29.9 25.9 25.9
France 20.4 22.3 18.9 23.4 23.2 22.2 21.4 22.1

Page 63 of 72
Germany 18.6 21.4 18.1 23.2 23.1 21.7 21.0 20.3
Greece 19.1 20.2 17.0 25.3 29.8 28.3 24.5 21.5
Ireland 35.7 40.2 39.1 40.1 42.8 44.7 40.2 41.7
Italy 20.5 23.9 19.8 25.5 24.7 22.8 22.2 22.0
Luxembourg 58.2 61.9 59.0 60.7 62.9 66.8 68.8 67.4
Netherlands 22.9 23.3 21.3 26.4 26.6 26.7 27.9 27.0
Portugal 26.4 28.4 23.7 29.6 30.2 29.5 28.4 28.0
Spain 23.0 24.4 19.0 24.3 25.0 23.7 22.7 21.6
Sweden 24.7 27.0 22.7 24.5 24.8 22.7 20.7 19.7
United Kingdom 14.3 16.6 15.9 18.8 18.8 16.3 15.1 15.4
South and Central
America 10.2 10.5 8.2 8.8 9.4 10.1 10.3 8.7
Argentina 11.0 11.8 9.0 11.3 9.7 9.1 6.9 6.9
Brazil 11.2 11.0 8.3 9.7 10.6 11.5 12.5 10.2
Chile 17.7 19.4 15.4 15.8 15.5 15.0 15.1 12.4
Colombia 10.5 10.6 8.8 7.6 7.7 9.4 11.6 10.1
Costa Rica 22.9 23.1 19.0 19.6 20.0 19.0 16.2 16.0
Peru 13.3 15.0 12.4 12.1 12.7 12.3 10.3 9.8
Source: Data from OECD-WTO TiVA Database 2018 version
Table D: DVA in exports of intermediate products as a share of total gross exports (%)
Region/Country 2005 2008 2009 2011 2012 2014 2015
India (South Asia) 42.9 41.6 39.5 38.1 37.9 38.8 40.0
ASEAN 41.4 42.9 43.3 44.4 43.8 43.1 42.8
Brunei Darussalam 82.8 85.4 84.6 85.4 83.4 86.9 87.8
Cambodia 38.1 35.6 34.9 38.9 38.6 40.5 39.2
Indonesia 55.4 58.0 59.7 62.3 60.6 57.2 55.8
Malaysia 34.1 38.3 37.1 38.0 39.2 40.9 41.0
Philippines 38.9 44.3 45.4 45.1 43.9 47.2 46.9
Singapore 38.2 35.7 37.2 37.2 36.9 38.3 40.3
Thailand 33.6 33.5 35.7 33.2 32.6 32.8 34.2
Viet Nam 35.9 32.8 34.3 31.6 32.7 31.8 30.2
East Asia 44.3 42.2 42.9 40.6 40.8 42.8 46.3
Japan 51.6 48.4 52.5 49.1 49.0 48.5 49.9
Korea 41.1 35.4 37.0 33.4 34.4 37.5 41.2
China 39.8 41.5 41.1 39.9 40.0 41.7 45.2
Hong Kong 41.0 37.8 39.1 35.4 34.8 36.2 38.1
Chinese Taipei 41.7 37.7 42.2 37.0 38.1 40.5 46.0
North America 50.8 50.6 51.1 52.0 51.2 51.0 51.1
Canada 55.3 56.2 54.3 55.9 54.0 55.7 54.1
Mexico 37.3 39.7 36.7 40.3 38.7 35.7 31.8
US 47.2 46.6 48.1 47.6 47.4 47.8 48.4

Page 64 of 72
EU 28 48.1 46.4 46.4 44.6 44.6 45.2 45.8
Czech Republic 35.5 34.5 34.5 33.0 32.9 32.7 34.1
Estonia 39.7 41.4 42.6 36.7 35.9 36.6 37.3
Hungary 28.6 27.4 28.5 27.5 28.7 29.1 30.6
Poland 41.0 40.0 40.8 39.6 39.6 39.8 40.6
Slovak Republic 33.3 30.7 31.0 29.0 29.4 29.8 31.3
Slovenia 34.5 34.5 35.5 35.0 35.6 36.7 38.0
Bulgaria 33.0 29.9 32.1 32.7 32.3 32.8 34.9
Croatia 25.7 25.8 28.2 28.4 28.2 28.4 28.0
Cyprus 37.0 40.3 42.4 44.1 41.8 39.2 40.4
Latvia 48.3 48.0 46.9 44.7 43.5 44.6 44.0
Lithuania 35.8 35.4 37.3 34.3 34.9 36.0 36.2
Malta 25.0 20.2 20.0 14.4 15.6 16.7 17.4
Romania 38.6 43.5 43.5 40.9 41.3 41.7 42.5
Austria 41.1 40.9 42.3 39.8 40.0 40.5 41.3
Belgium 41.9 40.5 42.4 40.6 40.2 40.9 40.8
Denmark 43.6 42.1 43.0 42.2 41.5 40.5 40.7
Finland 45.6 41.4 42.9 42.4 42.4 43.8 46.7
France 41.2 41.2 42.0 41.7 41.8 42.6 43.7
Germany 45.1 43.6 45.3 41.8 42.1 42.8 43.7
Greece 39.3 40.7 39.7 39.9 36.6 34.6 34.4
Ireland 34.0 32.6 33.1 33.7 32.6 30.8 31.4
Italy 39.8 38.3 39.4 37.4 38.3 38.7 39.4
Luxembourg 27.2 26.5 27.3 26.1 24.8 22.6 21.2
Netherlands 47.0 48.1 48.0 47.2 47.2 46.0 44.5
Portugal 36.5 36.8 37.6 36.3 36.2 35.4 35.8
Spain 36.4 37.7 38.6 37.6 37.8 37.7 38.2
Sweden 43.4 41.9 44.6 43.6 43.5 44.9 45.5
United Kingdom 51.1 51.0 51.0 48.8 49.0 49.5 49.5
South and Central
America 59.4 61.5 62.4 65.9 64.7 62.9 60.5
Argentina 52.8 49.7 51.3 49.4 50.1 48.6 49.0
Brazil 55.1 58.8 59.0 61.9 59.9 59.0 56.6
Chile 65.8 65.9 68.7 70.5 70.2 68.6 67.2
Colombia 62.8 66.4 66.8 75.6 76.1 73.1 66.7
Costa Rica 32.9 33.7 36.3 37.6 36.4 38.7 38.5
Peru 64.0 64.5 65.5 69.5 67.7 64.3 65.4
Source: Data from OECD-WTO TiVA Database 2018 version

Page 65 of 72
REFERENCES
AEC.(2019). Myanmar: Updated National Export Strategy to add new sectors, address constraints.(Article).
ASEAN Economic Community. Retrieved from http://aec.utcc.ac.th/myanmar-updated-national-export-
strategy-to-add-new-sectors-address-constraints
Akamatsu, K. (1962). A historical pattern of economic growth in developing countries. The Developing
Economies, 1(s1), 3-25.
Ando, M. (2006). Fragmentation and vertical intra-industry trade in East Asia. North American Journal of
Economics and Finance, 17, 257-281.
Ando, M., & Kimura, F. (2005). The formation of international production and distribution networks in East
Asia. In Takatoshi Ito and Andrew K. Rose (ed.), International Trade in East Asia. NBER-East Asia
Seminar on Economics, Volume 14, Chicago and London: The University of Chicago Press, 177-216.
Ando, M., & Kimura, F. (2009). Fragmentation in East Asia: Further evidence. Economic Research Institute
for ASEAN and East Asia Discussion Paper ERIA-DP-2009-20. Retrieved from
http://www.eria.org/pdf/ERIA-DP-2009-20.pdf
Athukorala, P. C. (2010). Production networks and trade patterns in East Asia: Regionalization or globalization?
Asian Development Bank, ADBI Working Paper Series, No. 56.
Athukorala, P. C. (2014). Global production sharing and Asian trade patterns: Implications for the Regional
Comprehensive Economic Partnership (RCEP). Australian National University, Departmental Working
Papers 2014-16. Retrieved from
https://crawford.anu.edu.au/acde/publications/publish/papers/wp2014/wp_econ_2014
Athukorala, P. C., & Nasir, S. (2012). Global production sharing and South-South trade. Indian Growth and
Development Review, 5(2), 173-202.
Athukorala, P.C. & Menon, J. (2010). Global production sharing, trade patterns, and determinants of trade
flows in East Asia. ADB Working Paper Series on Regional Economic Integration No. 41.
Baldwin (2012). Global Supply Chains: Why they emerged, why they matter, and where they are going. Fung
Global Institute Working Paper FGI-2012-1.
Baldwin, R. (2011). 21st Century Regionalism: Filling the gap between 21st century trade and 20th century
trade rules. Centre for Economic Policy Research Policy Insight No.56. Retrieved from
http://dev3.cepr.org/pubs/PolicyInsights/PolicyInsight56.pdf
Baldwin, R. (2019).(eds).The Globotics Upheavel: Globalisation, Robotics and the Future of Work. Oxford:
Oxford University Press.
Baldwin, R., & Venables, A. J. (2013). Spiders and snakes: Offshoring and agglomeration in the global
economy. Journal of International Economics, 90, 245-254.
Banga, K. (2019c). Digital technologies and ‘value’ capture in global value chains: Empirical evidence from
Indian manufacturing firms. (WIDER Working Paper 2019/43). Finland: United Nations University World
Institute for Development Economics Research Publications.
Banga, R. (2013). Measuring value in global value chains. IIFT Working Paper CWS/WP/200/8.
Banga, R. (2014). Linking into global value chains is not sufficient: Do you export domestic value added
contents? Journal of Economic Integration, 29(2), 267-297.
Banga, R. (2019a). Growing trade in electronic transmissions: Implications for the South. (UNCTAD Research
Paper No. 29). Geneva: United Nations Publication.
Banga, R. (2019b). Is India digitally prepared for international trade? Economic and Political Weekly, LIV(5),
53-62.
Board of Investment, Government of Pakistan. (2013).Investment Policy 2013. (Policy). Pakistan: Board of
Investment, Prime Minister’s Secretariat. Retrieved from https://invest.gov.pk/sites/default/files/inline-
files/InvestmentGuide.pdf
Borrus, M. (1996). Left for dead: Asian production networks and the revival of US electronics. Berkeley
Roundtable on the International Economy. Berkeley.

Page 66 of 72
Brynjolfsson, E., Hui, X., & Liu, M. (2018). Does machine translation affect international trade? Evidence
From a large digital platform. (NBER Working Paper No.24917). Cambridge, MA: National Bureau of
Economic Research.
Cabinet Secretariat, Government of Japan.(2013).Japan Revitalization Strategy -Japan is
Back.(Policy).Japan:Cabinet Secretariat, Government of Japan.Retrieved from
https://www.kantei.go.jp/jp/singi/keizaisaisei/pdf/en_saikou_jpn_hon.pdf
Cabinet Secretariat, Government of Japan.(2016).Japan Revitalization Strategy 2016.(Policy).Japan:Cabinet
Secretariat, Government of Japan.Retrieved from
https://www.kantei.go.jp/jp/singi/keizaisaisei/pdf/hombun1_160602_en.pdf
Cabinet Secretariat, Government of Japan.(2017).New Economic Policy Package.(Policy).Japan:Cabinet
Secretariat, Government of Japan.Retrieved from
https://www5.cao.go.jp/keizai1/package/20171208_package_en.pdf
Cabinet Secretariat, Government of Japan.(2019).Action Plan of the Growth Strategy.(Policy).Japan:Cabinet
Secretariat, Government of Japan.Retrieved from
https://www.kantei.go.jp/jp/singi/keizaisaisei/pdf/ap2019en.pdf
Cattaneo, O., Gereffi, G. and Staritz, C. (2010). (eds.) Global value chains in a postcrisis world: A development
perspective. Washington, DC: World Bank.
CFE.(2017).Report of the Committee on the Future Economy.(Report).Singapore:Committee on the Future
Economy.Retrieved from https://www.mti.gov.sg/-/media/MTI/Resources/Publications/Report-of-the-
Committee-on-the-Future-Economy/CFE_Full-Report.pdf
Coe, N. M., Hess, M., Yeung, H. W-C., Dicken, P., & Henderson, J. (2004). ‘Globalizing' regional
development: A global production networks perspective. Transactions of the Institute of British
Geographers, New Series, 29(4), 468-484.
Dicken, P. (1998). Global Shift: Transforming the World (3rd ed.). New York: Guilford Press.
Dicken, P. (2011). (eds.) Global shift: Mapping the changing contours of the world economy. New York and
London: The Guilford Press.
DIPP.(2011).National Manufacturing Policy.(Policy).New Delhi:Department of Industrial Policy and
Promotion, Ministry of Commerce and Industry.Retrieved from https://dipp.gov.in/sites/default/files/po-
ann4.pdf
DIPP.(2017).Industrial Policy – 2017.(Discussion Paper).New Delhi:Department of Industrial Policy and
Promotion, Ministry of Commerce and Industry.Retrieved from https://dipp.gov.in/whats-new/industrial-
policy-2017-discussion-paper
Economic Planning Unit, Prime Minister’s Department of Malaysia. (2015). Eleventh Malaysia Plan 2016-
2020: anchoring growth on people. Retrieved from
https://policy.asiapacificenergy.org/sites/default/files/11th%20Malaysia%20plan.pdf
Elms, D. K., & Low, P. (2013). Global value chains in a changing world. WTO Publications.
Export.gov.(2018).Bangladesh - Prohibited & Restricted Imports.(Article). Retrieved from
https://www.export.gov/article?id=Bangladesh-Prohibited-Restricted-Imports
Gaulier, G., Lemoine, F., &Unal-Kesenci, D. (2007). China’s integration in East Asia: Production sharing, FDI
& high-tech trade. Economic Change and Restructuring, 40(1–2), 27–63.
Gereffi, G. (1999). International trade and industrial upgrading in the apparel value chain. Journal of
International Economics, 48(1), 37-70.
Gereffi, G. and Korzeniewiez, M. (1994). (eds.) Commodity chains and global capitalism. Westport, USA:
Praegar.
Gereffi, G., & Memedovic, O. (2003). The global apparel value chain: What prospects for upgrading by
developing countries. United Nations Industrial Development Organization.
Gereffi, G., Humphrey, J., & Sturgeon, T. (2005). The governance of global value chains. Review of
International Political Economy, 12(1), 78–104.

Page 67 of 72
Gereffi, G., Humphrey, J., Kaplinsky, R., & Sturgeon, T. J. (2001). Introduction: Globalisation, value chains
and development. IDS Bulletin, 32(3).
Gereffi, G., Spencer, D., & Bair, J. (Eds.). (2002). Free trade and uneven development: The North American
apparel industry after NAFTA. Philadelphia, US: Temple University Press.
Goldar, B., Das, D.K., Sengupta, S., & Das, P.C. (2017). Domestic Value addition and Foreign Content: An
Analysis of India’s Exports from 1995 to 2011. (Working Paper No. 332). New Delhi: Indian Council for
Research in International Economic Relations.
Goldfarb, A., & Trefler, D. (2018). AI and international trade. (NBER Working Paper No.24254). Cambridge,
MA: National Bureau of Economic Research.
Government of Sri Lanka. (2018). National Export Strategy of Sri Lanka 2018-2022. (Policy). Sri Lanka:
Government of Sri Lanka. Retrieved from http://www.srilankabusiness.com/pdf/nes/sri-lanka-nes-4-3-
web.pdf
Government of Vietnam.(2011).Strategy on exports and imports for 2011-2020, with visions to
2030.(Article).Vietnam:Government Portal, Socialist Republic of Vietnam.Retrieved from
http://www.chinhphu.vn/portal/page/portal/English/strategies/strategiesdetails?categoryId=30&articleId=
10051303
Government of Vietnam.(2014).Industrial Development Strategy through 2025, vision toward
2035.(Article).Vietnam:Government Portal, Socialist Republic of Vietnam.Retrieved from
http://www.chinhphu.vn/portal/page/portal/English/strategies/strategiesdetails?categoryId=30&articleId=
10054959
Government of Vietnam.(2016).Overall strategy for international integration through 2020, vision to
2030.(Article).Vietnam:Government Portal, Socialist Republic of Vietnam.Retrieved from
http://www.chinhphu.vn/portal/page/portal/English/strategies/strategiesdetails?categoryId=30&articleId=
10056863
Gupta, N. (2012). Integration of the Indian machinery sector into global production networks. In Shahid Ahmed,
eds., Foreign Direct Investment, Trade and Economic Growth: Challenges and Opportunities, Routledge,
303-335.
Gupta, N. (2015c). Estimating Linkages of Indian Manufacturing Industries into Global Value Chains using
International Input-Output Table. Review of Development and Change, Special Issue, XX(2), 177-202.
Gupta, N. (2016). Domestic value-added growth is vital: Are Indian industries gaining by linking into value
chains? South Asia Economic Journal, 17(2), 271-294.
Haddad, M. (2007). Trade integration in East Asia: The role of China and production networks. World Bank
Policy Research Working Paper 4160.
Henderson, J. (2002). Globalisation on the ground: Global production networks, competition, regulation and
economic development. Centre on Regulation and Competition Working paper No.38. 1-34.
Henderson, J., Dicken, P., Hess, M., Coe, N., & Yeung, H. W.-C. (2002). Global production networks and the
analysis of economic development. Review of International Political Economy, 9(3), 436-464.
Hewage, K.V. (2017). Industrial Policy & Development in Sri Lanka. (Presentation). Sri Lanka: Institute of
Policy Studies of Sri Lanka.
Hopkins, T. K., & Wallerstein, I. (1986). Commodity Chains in the World-Economy Prior to 1800. 1(1), 57-
70.
http://english.www.gov.cn/2016special/madeinchina2025/
Humphrey, J. & and Schmitz, H. (2001). Governance in global value chains.IDS Bulletin, 32(3).
Humphrey, J. & and Schmitz, H. (2002). How does insertion in global value chains affect upgrading in industrial
clusters? Regional Studies, 36(9), 1017-1027.
Jones, R. W. &Kierzkowski, H. (1990). The Role of services in production and international trade: A
theoretical framework. in R. W. Jones and A. O. Krueger, eds., The Political Economy of International
Trade: Essays in Honor of R. E. Baldwin, Oxford: Basil Blackwell, 31-48.

Page 68 of 72
Kaplinsky, R. (2013). Global Value Chains, where they came from, where they are going and why this is
important. IKD Working Paper No. 68. Retrieved from http://www.open.ac.uk/ikd/documents/working-
papers/ikd-working-paper-68.pdf
Kaplinsky, R., & Morris, M. (2001). A handbook for value chain research. IDRC. Retrieved from
http://www.prism.uct.ac.za/papers/vchnov01.pdf
Keane, J. (2014). Global value chain analysis: What’s new, what’s different, what’s missing?.ODI Working
Paper.
Kee, H. L., & Tang, H. (2015). Domestic value added in exports: Theory and firm evidence from China (World
Bank Policy Research Working Paper No. 7491). Washington, DC: World Bank.
Kimura, F. (2006). International production and distribution networks in East Asia: Eighteen Facts, Mechanics
and Policy Implications. Asian Economic Policy Review, 1, 326- 344.
Kimura, F. (2009). The Spatial Structure of Production/Distribution Networks and its Implication for
Technology Transfers and Spillovers. Economic Research Institute for ASEAN and East Asia Discussion
Paper ERIA-DP-2009-02.
Kimura, F., & Ando, M. (2005). Two-dimensional Fragmentation in East Asia: Conceptual Framework and
Empirics. International Review of Economics and Finance, 14(3), 317-348.
Kimura, F., & Obashi, A. (2009). International Production Networks: Comparison between China and ASEAN.
Economic Research Institute for ASEAN and East Asia Discussion Paper ERIA-DP-2009-01.
Korhonen, P. (1994). The theory of the flying geese pattern of development and its interpretations. Journal of
Peace Research, 31(1), 93-108.
Krugman, P. (1991). Increasing returns and economic geography. The Journal of Political Economy, 99(3),
483-499.
Library of Congress.(2019).China: Foreign Investment Law Passed.(Article).USA:Library of
Congress.Retrieved from https://www.loc.gov/law/foreign-news/article/china-foreign-investment-law-
passed/
MacLeod, G. (2001a). New regionalism reconsidered: globalization and the remaking of political economic
space. International Journal of Urban and Regional Research.
Mayer, J. (2018). Digitalization and industrialization: Friends or foes? (UNCTAD Research Paper No. 25:
NCTAD/SER.RP/2018/7). Geneva: United Nations Publications.
Mayer, J. (2018). Digitalization and industrialization: Friends or foes? (UNCTAD Research Paper No. 25:
UNCTAD/SER.RP/2018/7). Geneva: United Nations Publications.
Meltzer, J.P. (2018). The impact of artificial intelligence on international trade. (Report by Artificial
Intelligence and Emerging Technologies Initiative). Washington, DC: Brookings Institution. Available at
https://www.brookings.edu/research/the-impact-of-artificial-intelligence-on-international-trade/
Ministry of Commerce & Textile.(2018).Trade Related Investment Policy Framework (TRIPF), 2015-
23.(Policy draft). Pakistan: Commerce division, Ministry of Commerce & Textile. Retrieved from
http://www.commerce.gov.pk/wp-content/uploads/2018/10/Trade-Related-Investment-Policy-
Framework-2015-23.pdf
Ministry of Commerce and Industry, Government of India.(2009). Foreign Trade Policy [27th August 2009 -
31st March 2014].(Policy).New Delhi:Ministry of Commerce and Industry.Retrieved from
https://dgft.gov.in/sites/default/files/ftp-plcontent0910_0.pdf
Ministry of Commerce and Industry, Government of India.(2015). Foreign Trade Policy [1st April, 2015 – 31st
March, 2020].(Policy).New Delhi:Ministry of Commerce and Industry.Retrieved from
https://dgft.gov.in/sites/default/files/ft17-051217%20%283%29.pdf
Ministry of Commerce and Industry, Government of India.(2016). Consolidated FDI Policy (Effective from
June 07, 2016).(Policy).New Delhi:Ministry of Commerce and Industry.Retrieved from
https://dipp.gov.in/sites/default/files/FDI_Circular_2016%281%29.pdf

Page 69 of 72
Ministry of Commerce and Industry, Government of India.(2017). Consolidated FDI Policy (Effective from
August 28, 2017).(Policy).New Delhi:Ministry of Commerce and Industry.Retrieved from
https://dipp.gov.in/sites/default/files/CFPC_2017_FINAL_RELEASED_28.8.17.pdf
Ministry of Commerce, Government of Nepal.(2015).Trade Policy 2015.(Presentation).Nepal:Federation of
Nepalese Chambers of Commerce and Industry.Retrieved from
http://www.fncci.org/ckfinder/userfiles/files/02%20TradePolicy_2015.pdf
Ministry of Commerce, Government of Nepal.(2016).Nepal Trade Integration Strategy
2016.(Policy).Nepal:Ministry of Commerce.Retrieved from
https://www.moc.gov.np/downloadfile/NTIS%202016_1546150729.pdf
Ministry of Commerce, Government of Pakistan.(2016).Strategic Trade Policy Framework 2015-18.(Policy).
Pakistan: Ministry of Commerce. Retrieved from https://www.tdap.gov.pk/pdf/trade_policy_18.pdf
Ministry of Commerce, Government of the People's Republic of Bangladesh.(2015). Export Policy 2015-
2018.(Policy).Bangladesh:Ministry of Commerce. Retrieved from
https://mincom.portal.gov.bd/sites/default/files/files/mincom.portal.gov.bd/page/e177ee18_f389_4f9e_a4
0c_57435cfac5b2/Export%20Policy%202015-2018_English.pdf
Ministry of Commerce, Government of the People's Republic of Bangladesh.(2016). Import Policy Order 2015-
2018.(Policy).Bangladesh:Ministry of Commerce.Retrieved from
https://mincom.portal.gov.bd/sites/default/files/files/mincom.portal.gov.bd/page/e177ee18_f389_4f9e_a4
0c_57435cfac5b2/Import%20Policy.pdf
Ministry of Commerce. (2015). National Export Strategy (Quality Management, Cross-Sector Strategy) 2015-
2019.(Policy). Myanmar: Ministry of Commerce. Retrieved from
https://www.myantrade.org/files/2018/9/5b9785e35d72a0.91618058.pdf
Ministry of Communications and IT, Government of the Islamic Republic of Afghanistan.(2015). IT Industry
Development Policy For Afghanistan (Draft) 2015-2020.(Policy).Afghanistan: Ministry of
Communications and IT. Retrieved form
http://old.mcit.gov.af/Content/files/IT%20Industry%20Development%20Policy-Draft.pdf
Ministry of Economy, Trade and Industry.(2015).Myanmar Industrial Development Vision (Next Frontier in
Asia: Factory, Farm, and Fashion), 2015.(Policy). Myanmar: Ministry of Economy, Trade and Industry.
Retrieved from https://www.meti.go.jp/meti_lib/report/2015fy/000937.pdf
Ministry of Electronics and Information Technology, Government of India.(2018).Digital India
Programme.(Presentation).New Delhi:Ministry of Electronics and Information Technology. Retrieved
form https://digitalindia.gov.in/writereaddata/files/Digital%20India%20Progress_13.02.2018.pdf
Ministry of Finance, Government of India. (2018). Economic Survey 2017-18. New Delhi: Economic Division,
Ministry of Finance.
Ministry of Finance, Government of the Islamic Republic of Afghanistan.(2016 ). Afghanistan National Peace
And Development Framework (ANPDF) 2017 to 2021.(Policy). Afghanistan: Ministry of Finance.
Retrieved from http://policymof.gov.af/home/afghanistan-national-peace-and-development-framework-
anpdf/
Ministry of Industry and Commerce, Government of the Islamic Republic of Afghanistan.(2018). Afghanistan’s
National Export Strategy 2018-2022.(Policy). Afghanistan: Ministry of Industry and Commerce. Retrieved
from
http://www.intracen.org/uploadedFiles/intracenorg/Content/Redesign/Projects/AAT/AFG_Main%20NES.
Ministry of Industry and Handicraft. (2015). Cambodia Industrial Development Policy 2015 – 2025. (Policy).
Cambodia: Ministry of Industry and Handicraft. Retrieved from
http://www.mih.gov.kh/File/UploadedFiles/12_9_2016_4_29_43.pdf

Page 70 of 72
Ministry of Industry, Government of Nepal.(2010).Industrial Policy, 2010.Nepal:Ministry of
Industry.Retrieved from http://moi.gov.np/uploads/files/Industrial%20Policy,%202010.pdf
Ministry of Information and Communication, Government of Vietnam.(2019).Digital transformation to come
under spotlight at Vietnam ICT Summit 2019.(Article).Vietnam: Ministry of Information and
Communication, Government of Vietnam. Retrieved from
https://english.mic.gov.vn/Pages/TinTuc/139449/Digital-transformation-to-come-under-spotlight-at-
Vietnam-ICT-Summit-2019.html
Ministry of IT & Telecom, Government of Pakistan.(2018).Digital Pakistan Policy.(Policy).Pakistan: Ministry
of IT & Telecom.Retrieved from
http://moib.gov.pk/Downloads/Policy/DIGITAL_PAKISTAN_POLICY(22-05-2018).pdf
Ministry of Planning and Finance.(2018).Myanmar Sustainable Development Plan (2018 – 2030).(Policy).
Myanmar: Ministry of Planning and Finance. Retrieved from
https://themimu.info/sites/themimu.info/files/documents/Core_Doc_Myanmar_Sustainable_Development
_Plan_2018_-_2030_Aug2018.pdf
Ministry of Planning and Investment, Government of Vietnam.(2011).Vietnam’s Socio-Economic Development
Strategy For the Period OF 2011-2020.(Report). Vietnam Government. Retrieved from
https://www.economica.vn/Portals/0/Documents/1d3f7ee0400e42152bdcaa439bf62686.pdf
Ministry of Science and Technology, Government of India.(2013). Science, Technology and Innovation Policy,
2013.(Policy).New Delhi:Ministry of Science and Technology.Retrieved from
http://dst.gov.in/sites/default/files/STI%20Policy%202013-English.pdf
MODSIT. (2017). New Trade Policy, 2017.(Policy).Sri Lanka: Ministry of Development Strategies &
International Trade. Retrieved from http://modsit.gov.lk/images/pdf/NTP_-_ENGLISH.pdf
MOEA. (2016).Economic Development Policy 2016.(Policy). Bhutan: Ministry of Economic Affairs. Retrieved
from http://www.moea.gov.bt/wp-content/uploads/2017/07/Economic-Development-Policy-2016.pdf
Myanmar Investment Commission.(2018). Myanmar Investment Promotion Plan 2016/17 - 2035/36.(Policy).
Myanmar: Myanmar Investment Commission. Retrieved from
https://www.dica.gov.mm/sites/dica.gov.mm/files/news-
files/mipp_english_version_with_cover_pages.pdf
Nathan, D. (2010). Trade (in tasks) and development. Frontiers of Commodity Chain Research. (J. Bair, Ed.)
Economic & Political Weekly, XLV(31), 27-31.
National Development Planning Agency, Government of Indonesia.(2007).Law of the Republic of Indonesia
Number 17 of 2007 on Long-Term National Development Plan of 2005-2025.(Policy). Indonesia: State
Secretariat of the Republic of Indonesia. Retrieved from
https://policy.asiapacificenergy.org/sites/default/files/LONG-
TERM%20NATIONAL%20DEVELOPMENT%20PLAN%20OF%202005-2025%20%28EN%29.pdf
NEDA.(2017).Philippine Development Plan, 2017-22.(Policy). Philippines: National Economic and
Development Authority. Retrieved from http://www.neda.gov.ph/wp-content/uploads/2018/01/Abridged-
PDP-2017-2022_Updated-as-of-01052018.pdf
NESDB, Government of Thailand.(2017).The Twelfth National Economic and Social Development Plan (2017-
2021).(Policy). Thailand: National Economic and Social Development Board. Retrieved from
http://www.nesdb.go.th/nesdb_en/ewt_dl_link.php?nid=4345
New Age.(2018).Cabinet okays export policy for 2018-21.(Article). Retrieved from
http://www.newagebd.net/article/55318/cabinet-okays-export-policy-for-2018-21
NRF.(2016).Research Innovation Enterprise 2020 Plan.(Report).Singapore: National Research Foundation.
Retrieved from https://www.nrf.gov.sg/docs/default-source/default-document-library/rie2020-publication-
(final-web).pdf

Page 71 of 72
Pakistan Business Council. (2018).Contours of a New Industrial Policy.(Report). Pakistan: Pakistan Business
Council.Retrieved from https://www.pbc.org.pk/wp-content/uploads/Contours-of-a-New-Industrial-
Policy.pdf
Park, S. (2017). The 4th industrial revolution and R&D policy. (Proceedings of the 33rd International Academic
Conference). Vienna: International Institute of Social and Economic Sciences. Available at
http://iises.net/proceedings/33rd-international-academic-conference-vienna/table-of-
content/detail?article=the-4th-industrial-revolution-and-r-d-policy
PCFIR.(2017).People-Centered “Plan for the Fourth Industrial Revolution” to Promote Innovative
Growth.(Policy).Korea:Presidential Committee on the Fourth Industrial Revolution.Retrieved from
http://www.4th-ir2018.co.kr/bbs/download.php?bo_table=reference_en&wr_id=6&no=1
Planning Commission, Government of the People's Republic of Bangladesh.(2012). Perspective Plan of
Bangladesh, 2010-2021.(Policy).Bangladesh: General Economics Division, Planning Commission.
Retrieved from
https://bangladesh.gov.bd/sites/default/files/files/bangladesh.gov.bd/page/6dca6a2a_9857_4656_bce6_13
9584b7f160/Perspective-Plan-of-Bangladesh.pdf
Prime Minister’s Office, Sri Lanka. (2017).Vision 2025. (Policy).Sri Lanka: Prime Minister’s Office. Retrieved
from http://www.pmoffice.gov.lk/download/press/D00000000061_EN.pdf
RGC.(2018). Rectangular Strategy for Growth, Employment, Equity and Efficiency: Building the Foundation
toward Realizing the Cambodia Vision 2050 (2018).Retrieved from http://cnv.org.kh/wp-
content/uploads/2012/10/Rectangular-Strategy-Phase-IV-of-the-Royal-Government-of-Cambodia-of-the-
Sixth-Legislature-of-the-National-Assembly-2018-2023.pdf
Rodolfo, C.S. (2018). Philippine Trade Policies & Strategies. (Presentation prepared for 2018 Manufacturing
Summit). Retrieved from http://industry.gov.ph/wp-content/uploads/2018/11/Philippine-Trade-Policy-
and-Strategies.pdf
Schröppel, C., & Mariko, N. (2002). The changing interpretation of the flying geese model of economic
development. 203-229. Retrieved from
http://contemporaryjapan.org/back_issues/japanstudien_14_japan_als_fallbeispiel/dij-jb14-Schroeppel-
Nakajima.pdf
Scott, A. J. (1988). New industrial spaces. London: Pion, 8.
Sjödin, D.R., Parida, V., Leksell, M., & Petrovic, A. 2018) Smart Factory Implementation and Process
Innovation. Research-Technology Management, 61(5), 22-31.
State Council, China.(2017).China’s New Generation of Artificial Intelligence Development
Plan.(Article).USA:Future of Life Institute.Retrieved from https://flia.org/wp-content/uploads/2017/07/A-
New-Generation-of-Artificial-Intelligence-Development-Plan-1.pdf
Storper, M. (1997). The regional world: territorial development in a global economy. New York: The Guilford
Press.
Szalavetz, A. (2019). Digitalisation, automation and upgrading in global value chains – factory economy actors
versus lead companies. Post-Communist Economies, 31(5), 646-670.
Thailand Board of Investment.(2018).Thailand 4.0 – a new value-based economy. (Presentation). Thailand:
Thailand Board of Investment. Retrieved from
https://www.boi.go.th/upload/content/Thailand,%20Taking%20off%20to%20new%20heights%20@%20
belgium_5ab4e8042850e.pdf
The National Assembly, Kingdom of Cambodia.(1994).Law on the Investment of the Kingdom of
Cambodia.(Report). Switzerland: World Trade Organisation. Retrieved from
https://www.wto.org/english/thewto_e/acc_e/khm_e/WTACCKHM3A3_LEG_45.pdf
Towel Manufacturers’ Association of Pakistan.(2018). STPF 2018-23. (Article). Pakistan: Towel
Manufacturers’ Association of Pakistan. Retrieved from
https://www.towelassociation.com/assets/editor_img/sep/28/STPF_2018-23-BR.pdf

Page 72 of 72
UNCTAD. (2011). Integration of developing countries in global supply chains, including through adding value
to their exports. Note TD/B/CI/16. United Nations.
UNCTAD. (2013). World investment report: Global value chains: Investment and trade for development. New
York and Geneva: United Nations Publication.
UNCTAD. (2018a). South-South digital cooperation for industrialization: A regional integration approach.
Geneva: United Nations Publication.
UNCTAD. (2018b). (Report). Geneva and New York: United Nations Publications.
UNCTAD.(2019).World Investment Report 2019: Special Economic Zones.(Report).Geneva: United Nations
Publication.
UNESCAP. (2018). Trade and investment in Asia and the Pacific: Policy challenges and secretariat response.
(Secretariat Note). Bangkok, Thailand: United Nations Publication.
UNIDO. (2018). Global Value Chains and Industrial Development: Lessons from China, South-East and South
Asia. Austria, UNIDO.
Vernon, R. (1966). International investment and international trade in the product cycle. The quarterly journal
of economics, 80(2), 190-207. Wingaraja, G., Tyson, J., Prizzon, A., & Velde, D, W. (2018). Asia in 2025: development prospects and
challenges for middle-income countries. (Research Report). London: Overseas Development Institute.
World Bank. (2018a). Doing Business 2019: Training for Reform. Washington, D.C.: World Bank Group.
World Bank. (2018b). Connecting to Compete 2018 -Trade Logistics in the Global Economy: The Logistics
Performance Index and Its Indicators. Washington, D.C.: World Bank Group. World Economic Forum. (2012). The Shifting Geography of Global Value Chains: Implications for Developing
Countries and Trade Policy. (Report). Switzerland:World Economic Forum.
World Economic Forum. (2017). The global economic balance of power is shifting. Retrieved from
https://www.weforum.org/agenda/2017/09/the-global-economic-balance-of-power-is-shifting
WTO. (2016). World Trade Statistical Review 2016. (Report). Geneva: World Trade Organization.
WTO. (2018a). World Trade Report 2018 - The future of world trade: How digital technologies are
transforming global commerce. Geneva: World Trade Organisation.
WTO. (2018b). World Trade Statistical Review 2018. (Report). Geneva: World Trade Organization.
WTO. (2019). World Trade Statistical Review 2019. (Report). Geneva: World Trade Organization.