changing economic fortunes for europeans: implications...
TRANSCRIPT

Chapter 6
Changing Economic Fortunes for Europeans:Implications for Foreign Policy
Maria Demertzis1
Seen from the perspective of the European Union (EU),2 the world looksvery different today than just one or two years ago. The U.S. election out-come has changed geopolitical dynamics and challenged what the EUconsiders its “natural alliance.” At the same time, in combination with theUK’s decision to leave the EU (Brexit) and the results of the 2017 Frenchelections, it has brought new impetus to the debate on the EU’s need tounite. As a result, EU member states are engaging in wide-ranging policydiscussions on how to promote integration and improve the EuropeanUnion’s world standing.
And this all is taking place in the middle of what can only be seen as amild and somewhat precarious economic recovery. The EU has experi-enced a very deep 10-year crisis, not only because of the force and intensityof the financial shock, but because of its lack of institutional resilience.Countries that were better prepared or had the tools to react quickly anddecisively did so and recovered faster. But the EU as an institution lackedboth the tools and the governance structure to react to events at the speedat which they unfolded.
Since its inception, with the signing of the Treaty of Rome in 1957, theEuropean project of economic integration has moved in only in one direc-tion, and that is deepening. When the UK voted in the summer of 2016to leave, the EU received a very sobering message: European integration
1 I thank Justine Feliu for helping collect all the necessary data and for allowing me to shareher data on military expenditures.
2 The European Union currently consists of 28 countries (including the UK). All EU coun-tries, except Denmark and the UK, are required by the treaty to join the single currency—the euro—eventually (https://ec.europa.eu/info/business-economy-euro/euro-area/enlarge-ment-euro-area/who-can-join-and-when_en). At the moment only 19 countries haveadopted the euro to form the euro area (EA). In terms of population, the EU is 510 millionand the euro area is 340 million. The euro area economy represents about 70 percent ofEU GDP; that share will increase when the UK leaves. The numbers that I will presentwill be either for individual countries or for the EA when I report on averages, as the EA isthe relevant economic unit.
119
is neither inevitable, nor is it irreversible. This has had considerable impacton the European psyche. At the time, it was not at all clear what wouldfollow. Populist, and mostly nationalist movements, in many countrieshad been arguing for less, or even “no Europe,” for some time. Was thisthe beginning of the end, or could the Brexit juggernaut be stopped?
The possibility that European integration could be reversed struck a sen-sitive cord. many went back to rediscover the project’s raison d’être of peacefollowing World War II: democracies whose economies are fused do notgo to war with one another. At that time, it was important to promote inte-gration by providing the right conditions for it to f lourish. That processbegan when member states removed trade barriers, adopted common stan-dards and agreed to a common set of rules when interacting with each other.This was done gradually over the span of almost 40 years—an illustrationof both the enormity of the task and the strong commitment that countrieshad. In a second stage, countries that had achieved a certain level of economicconvergence3 adopted a common currency, the euro. This was seen as a wayof removing the distortions that arise from currency volatility, thus allowingcountries to reap the full benefits of free trade. Since the start of the financialcrisis in 2008, important steps were made to unite the financial system bybringing the supervision of systemically-relevant banks together at the Euro-pean level. This process is not complete, but it is very advanced.
Can the EU go an extra mile and actually build an economic federation?This would be the natural destination in this process of economic inte-gration, as it would provide the means to collect, distribute and thereforemanage the economy as one.
The EU is very far from what can be considered a single nation in orga-nizational terms.4 Despite common laws for many issues, national judiciarysystems are still prevalent. national sovereignty is ensured by the powerto tax and distribute at the country level. There is no significant federalequivalent, which implies that managing the macroeconomic systemremains very much the job of member states. There is a system of coor-dinated monitoring at the EU level,5 but it not an adequate substitute.
3 To understand how convergence is evaluated, see https://ec.europa.eu/info/business-econ-omy-euro/euro-area_en.
4 I am not referring to cultural, historical or linguistic differences, which are crucial for thedefinition of a nation.
5 macroeconomic Imbalances Procedure, and the Fiscal Compact, https://ec.europa.eu/info/business-economy-euro/economic-and-fiscal-policy-coordination/eu-economic-gov-ernance-monitoring-prevention-correction/macroeconomic-imbalance-procedure_en.
120 DomESTIC DETERmInAnTS oF FoREIGn PolICy

This was made clear in the crisis years, when real time solutions wereentirely national (e.g. saving banks). The EU, as an institution or as thecollective voice of the member states, had neither the mandate nor themeans to take over from national authorities.
Herein lie two inconsistencies.
First, as long as countries are economically interdependent, solutionsat the national level will be incomplete. And in the EU, not only are coun-tries interdependent, they also strive to develop very close links. Fromintegrated value chains to a common currency and large financial f lows,countries are part of one economic system and cannot insulate themselvesfrom developments elsewhere. Defining at least some common objectivesand harmonization of rules is becoming increasingly indispensable.
Second, while countries understand and acknowledge this incompletenature of the EU architecture, they are not necessarily at the point ofabandoning national sovereignty. This became very clear with the Brexitvote and with the surge of nationalism across the Union. The EU is there-fore not at the level of being able to counteract shocks at the pace andwith the commitment that countries at able to muster. At the same time,because integration is deep, national problems can quickly become con-tinental problems.
It is in this context, of halfway architectural design, that the EU’s econ-omy needs to be assessed. In this chapter I describe the broad economicpicture of the euro area and compare it to that of the United States. I arguethat the differences, to the extent they exist, will be a manifestation of eachentity’s relative ability to act in real time to address economic shocks, par-ticularly since 2008. That in itself is the result of the paradox explainedabove: all member states are affected by problems together, yet their powerto act is not equally centralized.
I then describe the economic challenges the EU is battling. The financialcrisis has left the EU with a number of financial and other legacy problemsthat now stand in the way of its ability to grow and prosper. In my view,the problems of indebtedness and unemployment (particularly for theyoung) are the two most important. I suggest ways to address them.
I then turn to the EU’s external challenges, which have implicationsfor its domestic and foreign economic policies. I discuss migration, the
Changing Economic Fortunes for Europeans: Implications for Foreign Policy 121

call to rethink and possibly redesign defense expenditures, the EU’s evolv-ing alliances, and its role as defender of multilateralism. I conclude withsome thoughts about going forward.
Internal Challenges
The Current State of the Euro Area Economy
The euro area economy has been through was is now known as a double-dip since the start of the financial crisis in 2008. Figure 1 showsthat while the first dip in growth in 2009 was very similar in the euro areaand in the United States, their paths diverged during the subsequent fouryears. The United States managed to recover and sustain a more or lessstable level of growth relatively early in the process. By contrast, the euroarea faced a second contraction as investment collapsed, resulting in afour-year divergence in growth. Since late 2015 growth levels are againsimilar.
This second dip came to be known as the fiscal crisis, when the euroarea faced a serious possibility of breaking up. lack of sufficient coordi-nated action during the first banking crisis was the primary cause for thesecond crisis. Countries implemented strictly national efforts to savedomestic banks, which exposed their fiscal capacity. Those that had health-ier fiscal finances were in better position to pursue bank rescues. Thepoint that was not sufficiently appreciated at the time was how weak fiscalfinances in certain countries, even if these countries were small, couldpose a serious threat to the euro area as a whole. markets took the viewthat if countries share a common currency, they de facto also share fiscalpositions. And if one country’s fiscal position is in trouble, either otherscome to rescue it or the currency fails.
Failure to recognize this point, and then respond to it convincingly,prevented the euro area from sustaining the first recovery. Euro area mem-ber states were unwilling to admit the inexorable links that bound themtogether through the single currency, while EU institutions lacked theauthority to respond.
It took three years before member states were prepared to acknowledgehow close the euro has tied their economies together, and to put mecha-nisms in place to provide adequate responses.
122 DomESTIC DETERmInAnTS oF FoREIGn PolICy

Since then, much has happened. But how convincing have such effortsbeen and are they enough? Initially, euro area growth was driven by domes-tic consumption. more recently, it has also been sparked by new invest-ments. At the same time, the inf lation rate, the main indicator of economicactivity, remains persistency below what it ought to be (around 2 percent),in particular when looking at the core rate, which excludes volatile com-ponents (Figure 2).
Changing Economic Fortunes for Europeans: Implications for Foreign Policy 123
Figure 1: Real Growth in Gross Domestic Product (%) (andgrowth contribution, percentage points for euro area only)
-6
-4
-2
0
2
4
6
Final consumption expenditure of general government Household and NPISH final consumption expenditure
Gross capital formation Net exports
EA GDP US GDP
Source: Eurostat, FRED (St. Louis Federal Reserve).
Figure 2: Inflation and Core inflation (%), Euro Area and UnitedStates
1999 Q4 1.1 1.5 1.5 1.7
2000 Q1 1.7 1.7 1.6 1.7
2000 Q2 1.9 1.8 1.7 1.8
2000 Q3 2.1 1.8 1.8 1.8 1.8
2000 Q4 2.3 2 1.8 1.8 1.8
2001 Q1 2 1.7 1.7 1.7 1.8
2001 Q2 2.3 1.8 1.8 1.8 1.8
2001 Q3 2.7 1.9 1.8 1.8 1.8 1.8
2001 Q4 2.6 1.7 1.8 1.6 1.8 1.8
2002 Q1 1.7 1.8 1.7 1.8 1.9
2002 Q2 2.1 1.9 1.9 1.9 1.9
2002 Q3 2.1 1.8 1.9 1.8 1.9 1.9
2002 Q4 2.2 1.8 1.9 1.8 1.9 1.9
2003 Q1 1.8 1.8 1.8 1.8 1.9
2003 Q2 2 1.7 1.6 1.7 1.9
2003 Q3 1.9 1.5 1.7 1.5 1.7 1.9
2003 Q4 2 1.6 1.8 1.6 1.8 1.9
-0.5
0
0.5
1
1.5
2
2.5
3
3.5
4
2010 Q1
2010 Q2
2010 Q3
2010 Q4
2011 Q1
2011 Q2
2011 Q3
2011 Q4
2012 Q1
2012 Q2
2012 Q3
2012 Q4
2013 Q1
2013 Q2
2013 Q3
2013 Q4
2014 Q1
2014 Q2
2014 Q3
2014 Q4
2015 Q1
2015 Q2
2015 Q3
2015 Q4
2016 Q1
2016 Q2
2016 Q3
2016 Q4
2017 Q1
EA Inflation EA Inflation excl. energy US Inflation
Source: European Central Bank, FRED. Note: Core inflation is actual inflation that excludes energy prices.

moreover, there is little that monetary policy can do to try and encour-age growth. The interest rate is effectively at zero (known as the zero-lower-bound), so it cannot fall any further to promote investment.6 TheUnited States, in contrast, is once again in the position to use the interestrates to manage the economy (Figure 3).
At the same time, with the exception of France, all countries in the euroarea are now net capital exporters. Figure 4 shows that the euro area itselfexports capital of over 3 percent of its own GDP. With recovery beingnascent and precarious, the fact that capital does not stay home does notref lect confidence in domestic conditions.
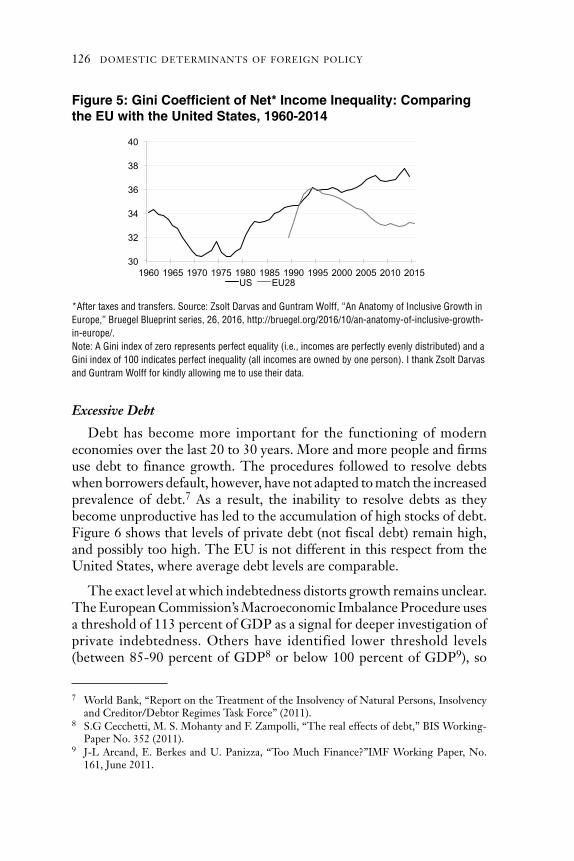
There is one area where the EU on the whole has managed to maintainconsistency, and that is with regard to income inequality. Figure 5 comparesthe EU (28 countries) to the United States. not only does the EU have a
6 Admittedly more is done in the form of “unconventional” measures. But the “conventional”part of monetary policy, i.e., the ability to use the interest rate, is effectively now incapaci-tated.
124 DomESTIC DETERmInAnTS oF FoREIGn PolICy
Figure 3: The European Central Bank Main RefinancingOperations Rate (%)
0
1
2
3
4
5
6
7
ECB Main Refinancing Operations Rate Federal Funds Target Rate (Upper) Federal Funds Target Rate (Lower)
Source: Bloomberg, European Central Bank.

much lower level of income inequality than the United States, it has alsobeen able to prevent a deterioration, despite weak economic conditionsover the past 10 years.
on the whole, the EU economy is only just beginning to enter a con-vincing recovery. This is in contrast to the United States, which recoveredmuch faster after the financial crisis. Whether Europe manages to sustainthis recovery depends crucially on how it handles important legacy prob-lems. I turn to this next.
Economic Legacy Problems
In the context of a low-growth, low inf lation environment, the mainproblems to overcome in the EU are excessive debt (both private and pub-lic) and unemployment, in particular amongst the young. Both these arethe results of a prolonged crisis period and are affecting the EU’s abilityto grow and be productive.
Changing Economic Fortunes for Europeans: Implications for Foreign Policy 125
Figure 4: Current Account as % of GDP: Euro Area (and countrycontributions) and United States
-7
-6
-5
-4
-3
-2
-1
0
1
2
3
4
1999 2000 2001 2002 2003 2004 2005 2006 2007 2008 2009 2010 2011 2012 2013 2014 2015 2016
DE FR IE IT GR PT ES NL Other EA US
Source: Ameco, European Commission and FRED.
Excessive Debt
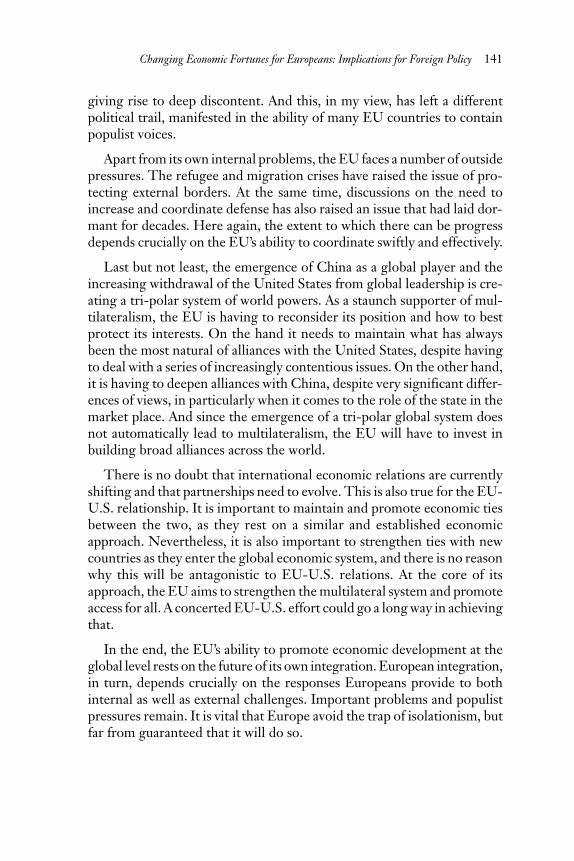
Debt has become more important for the functioning of moderneconomies over the last 20 to 30 years. more and more people and firmsuse debt to finance growth. The procedures followed to resolve debtswhen borrowers default, however, have not adapted to match the increasedprevalence of debt.7 As a result, the inability to resolve debts as theybecome unproductive has led to the accumulation of high stocks of debt.Figure 6 shows that levels of private debt (not fiscal debt) remain high,and possibly too high. The EU is not different in this respect from theUnited States, where average debt levels are comparable.
The exact level at which indebtedness distorts growth remains unclear.The European Commission’s macroeconomic Imbalance Procedure usesa threshold of 113 percent of GDP as a signal for deeper investigation ofprivate indebtedness. others have identified lower threshold levels(between 85-90 percent of GDP8 or below 100 percent of GDP9), so
7 World Bank, “Report on the Treatment of the Insolvency of natural Persons, Insolvencyand Creditor/Debtor Regimes Task Force” (2011).
8 S.G Cecchetti, m. S. mohanty and F. Zampolli, “The real effects of debt,” BIS Working-Paper no. 352 (2011).
9 J-l Arcand, E. Berkes and U. Panizza, “Too much Finance?”ImF Working Paper, no.161, June 2011.
126 DomESTIC DETERmInAnTS oF FoREIGn PolICy
Figure 5: Gini Coefficient of Net* Income Inequality: Comparingthe EU with the United States, 1960-2014
30
32
34
36
38
40
1960 1965 1970 1975 1980 1985 1990 1995 2000 2005 2010 2015 US EU28
*After taxes and transfers. Source: Zsolt Darvas and Guntram Wolff, “An Anatomy of Inclusive Growth inEurope,” Bruegel Blueprint series, 26, 2016, http://bruegel.org/2016/10/an-anatomy-of-inclusive-growth-in-europe/. Note: A Gini index of zero represents perfect equality (i.e., incomes are perfectly evenly distributed) and aGini index of 100 indicates perfect inequality (all incomes are owned by one person). I thank Zsolt Darvasand Guntram Wolff for kindly allowing me to use their data.

therefore caution is important when attempting to categorize a level ofprivate debt as excessive.
Irrespective of the exact threshold, at a level of an unweighted averageof almost 150 percent of GDP, debt in the EU is considered excessive.And we can recognize two ways in which excessive debt has detrimentaleffects on the economy.
The first affects the supply of credit. Excessive debts are typically non-performing. When creditors have a significant level of non-Performingloans (nPls) on their balance sheet, they do not issue new credit, thusputting a cap on the credit supplied to the economy. And as member statesrely heavily on banks to finance growth (by contrast to the United States,which relies more or less equally on banks and capital markets) they findthemselves in a position of insufficient credit creation. This is particularlytrue for new credit to firms (as opposed to households), therefore pre-venting new investment.
While a number of countries have made progress in removing nPlsfrom bank balance sheets, others clearly have not. Here we also see a star-tling difference with the United States, which achieved a much lower peaklevel to begin with and reduced nPl levels almost in real time. In the
Changing Economic Fortunes for Europeans: Implications for Foreign Policy 127
Figure 6: Private Sector Debt+, % of GDP
400
350
Government de 2015 Peak 2000
ebt 2015
P%
GD
300
250
200
150
100
50
UK
BE
TPS
E
DK
LNIE
*
LU Y
C
0
CZ
PO
SK
HU
SI V
LDE
BG
HR
EE
TITAGR
TMFR
ES
FI
US
**
RO
Notes: +Households and non-financial corporates. *Private debt data for Ireland are based on centralbank statistics (CCB indicators), which are based on national bank credit data, thereby excluding debt offoreign affiliates. **Private debt data for U.S. are based on World Development Indicators and GG debton Fred statistics.Sources: Eurostat, Irish National Central Bank Statistics, World Development Indicators, FRED.

euro area, by contrast, the resolution of nPls reached a much worse leveland did not begin to improve until early 2014.
Excessive debt also suppresses the demand for new credit. This secondeffect, known as the debt overhang, has been less prominent in the Euro-pean discussion. Debt overhang is a situation in which high debt levels actas a disincentive to new investment.10 This effect is difficult to measuredirectly, but can be identified in different ways. Companies that are highlyleveraged find it difficult to take advantage of an improvement in demand,and may even continue to de-lever as a recovery takes hold.11 It is estimatedthat the debt overhang in the EU explains about a third of the decline ininvestment observed during the crisis.12 It is likely that the number offirms originally affected by this distortion is significant, making it a systemicobstacle to recovery.
10 S. C. myers, “Determinants of Corporate Borrowing,” Journal of Financial Economics, 5 (2)(1977), pp 147–175.
11 International monetary Fund, “A Strategy for Europe’s nPls,” ImF Staff Discussionnote, 15/09 2015.
12 S. K. ozcan, l. laeven and D. moreno, “Debt overhang in Europe: Evidence from Firm-Bank-Sovereign linkages,” paper presented at the 21st Dubrovnik Economic Conference,2015.
128 DomESTIC DETERmInAnTS oF FoREIGn PolICy
Figure 7: Progress with Resolving Non-Performing Loans (NPLs):Bank NPLs to Total Gross Loans (%)
0
1
2
3
4
5
6
7
8
9
2000 2001 2002 2003 2004 2005 2006 2007 2008 2009 2010 2011 2012 2013 2014 2015 2016
Euro area United Kingdom United States
Source: World Development Indicators, IMF

A significant obstacle to this adjustment has been the EU’s anemicgrowth and almost zero inf lation, at least until recently. As the real valueof debt is not adjusting, it is the nominal value of debt that needs to doso. In principle, there are two alternative paths to such an adjustment andthey both need to happen.
The first is deleveraging, as debtors put aside resources to repay existingdebt. This, however, depresses growth and investment as lenders rebuildliquidity in the absence of a more comprehensive improvement in thedebt situation. European Commission estimates point to a permanentreduction in GDP of almost one percentage point for every ten-percentagepoint reduction in the private debt ratio.13 Repaying back debts in orderto reduce them to levels that are deemed sustainable is going to cost a lotin terms of growth.
The second is re-structuring and/or write-downs. This form of adjust-ment would involve wide-ranging modification of loan terms to recognizethe value loss relative to the original terms in credit contracts, and to sharethis value loss between creditors and equity holders. European countrieson the whole have much less of a culture of write-downs, and as a conse-quence have developed little skills on how to allow markets to work themthrough. The issue is slowly becoming part of the tools to be used, but itis protracted.14 Also, it is important to recognize that this process cannothappen to the detriment of the health of banks, given the efforts made inpast years to restore credibility in the sector. If restructuring were to hap-pen, it would have to follow banks’ capacity to absorb losses very closely.This inevitably adds an extra layer of complication that prevents the swiftsolution to the problem of indebtedness in the EU.
Unemployment: Divergences Among Countries and Generations
Traditionally, the level of unemployment in European countries havealways been higher than that in the United States. This discrepancy con-tinues to hold, with the exception of a few years prior to the crisis whenthe United States saw a distinct increase in the level of unemployment.
13 P. Pontuch, “Private sector deleveraging: where do we stand?” Quarterly report on theeuro area, European Commission, 2014.
14 maria Demertzis and Alexander lehmann, “Tackling Europe’s crisis legacy: a comprehensivestrategy for bad loans and debt restructuring,” Bruegel Policy Contribution no. 11, April21, 2017, http://bruegel.org/wp-content/uploads/2017/04/PC-11-2017-2004.pdf.
Changing Economic Fortunes for Europeans: Implications for Foreign Policy 129

Currently, the actual level of unemployment in the euro area as a wholeis comparable to historical levels.
Where the problem of unemployment in the euro area has deterioratedis that we now observe divergence between countries as well as in certainsegments of the population. Figure 8 shows the two-unemployment seriesfor the euro area and the United States, but also shows the range of unem-ployment levels between countries in the euro area. The main message isthat while the early years of monetary union (from 1999 to 2008) saw aslow but visible convergence, since then that process has reversed, with asustained divergence between countries now prevailing.
The problem is particularly visible when it comes to young people.one in four young people in the euro area is now unemployed; in someareas one in two are unemployed (figure 9). This is particularly true inareas that have systems that benefit incumbents over new entrants, andwhere there is no culture of vocational training to smooth integration intolabor markets.
This can lead to both important social problems in real time, but it alsoimplies that as their skills depreciate, the young will have difficulties inte-
130 DomESTIC DETERmInAnTS oF FoREIGn PolICy
Figure 8: Unemployment as Percentage of the Total ActivePopulation, Euro Area and United States
0
5
10
15
20
25
30
1998 1999 2000 2001 2002 2003 2004 2005 2006 2007 2008 2009 2010 2011 2012 2013 2014 2015 2016
Euro area United States
Source: Ameco, European Commission. Notes: dashed lines represent the minimum (best performer) andmaximum (worst performer) at any point in time, not shared by the same country across the wholeperiod.

grating in the labor market in years to come. It is difficult to predict theintergenerational effects implied, but the scale of the problem has nowmade it a number one policy priority.15
Important differences between the United States and the euro areaaccount for these differences. labor mobility has always been greater inthe United States than typically in EU member states. 30 percent of Amer-icans reside in a state other than the one they were born. This is true foronly 2.8 percent in the EU.16 language and cultural factors account forthis difference, but the fact remains that labor mobility cannot be countedupon to provide a solution when certain regions are affected by economicdisturbances. Similarly, generous welfare systems in the form of long-last-ing unemployment benefits also generate disincentives for job-seeking.
The need for labor market reforms is similar across all European coun-tries, albeit with different degrees of urgency. French President macronhas made this his top priority in the reform agenda that he has set in
15 For the European Commission’s strategy put in place to help tackle it, seehttp://ec.europa.eu/social/main.jsp?catId=1036.
16 https://www.economist.com/blogs/economist-explains/2015/08/economist-explains.
Changing Economic Fortunes for Europeans: Implications for Foreign Policy 131
Figure 9: Youth Unemployment as Percentage of the Total ActivePopulation, Euro Area and United States
0
10
20
30
40
50
60
70
2000 2002 2004 2006 2008 2010 2012 2014 2016
US EA
Source: FRED; World Bank, World Development Indicators. Note: Youth unemployment refers to theshare of the labor force ages 15-24 without work but available for and seeking employment (modeled ILOestimate). Notes: dashed lines represent the minimum (best performer) and maximum (worst performer)at any point in time, not shared by the same country across the whole period.

France. other countries need to push for ways of increasing the f lexibilityof the labor market and ensuring access for all. Countries’ ability to handlethis, in particular as it concerns the young, will determine how well theEU will provide sustainable development in the future. It remains themost urgent problem to tackle, as it has implications not only for theeconomy but also for social cohesion.
External Challenges
Beyond its own economic legacy problems, there are a number of chal-lenges that are affecting the EU’s foreign economic policy. Without claim-ing to be exclusive, I will discuss the surge of recent economic migrationwaves, the revival of the issue of the need to coordinate defense expensesand finally the EU’s economic alliances and how they might be challenged.
Economic Migration
migration waves into the EU have increased steadily and significantlyparticularly since 2012. This has raised a number of questions, includingwhether such levels of population shifts can be sustained, and whether andhow migrants can be integrated successfully. A significant number of thesepeople, particularly in 2015 and 2016, were effectively refugees from Syriaescaping war. Figure 10 shows that the bulk of people arriving into theEU in these years originated from the middle East region, and thereforewere not economic migrants.
However, the issue of economic migrants, particularly from Africa, isan older story. What has changed is the increase of irregular arrivals,mostly by boat under very life-threatening circumstances. These numbershave been increasing since 2010, as shown in Figure 11. The Europeanpolicy establishment has become more interested in Africa because of afear that ever-increasing migration inf lows are unpopular with the public.But this irregular migration is still only a fraction of total immigration,which is actually fairly stable at around 500,000 per year.
Figure 11 shows that African migrants coming to the EU are primarilyfrom sub-Saharan Africa. At the moment, annual migration from Africato the EU only represents 0.1 percent of the EU population. But the num-bers will likely increase in the future, as the population of Africa is expectedto more than double by 2050, reaching 2.5 billion. The demographicpressures are the strongest in sub-Saharan Africa, where fertility rates are
132 DomESTIC DETERmInAnTS oF FoREIGn PolICy

Changing Economic Fortunes for Europeans: Implications for Foreign Policy 133
Figure 10: Arrivals into the EU by Country Groups (persons)
120048 161196
885501
205709
0
200,000
400,000
600,000
800,000
1,000,000
2015 2016
North Africa Sub-Saharan Africa Middle East and others
Source: UNHCR.
Figure 11: Detection of Irregular Border-Crossing from Africa(persons)
0
20,000
40,000
60,000
80,000
100,000
120,000
140,000
160,000
180,000
200,000
2009 2010 2011 2012 2013 2014 2015 2016
Rest of Africa Tunisia Morocco Egypt Algeria Libya
Source: Frontex.

exceptionally high at 5 children per woman and where the average annualincome per person is below $3,500 in purchasing power parity terms. Forthese reasons, emigration from Africa will continue, and Europe willremain an attractive destination.17
naturally, income differences between Africa and the EU are an impor-tant reason behind such population movements. There is no doubt thateconomic development in sub-Saharan Africa is a critical objective in thefight against poverty. EU countries individually, collectively and throughmultilateral institutions, like the European Investment Bank, will need tostep up their involvement on the continent. But development aid can onlygo that far, as development and migration do not always go hand in hand.In fact, in very poor countries emigration often increases with rising GDPper capita. This happens because at first, development simply providesthe means to escape poverty. Empirically, studies find that starting fromlow levels of income development will not stop people leaving. only whenlevels of income rise to above $7,000-9,000 in purchasing power parityper year does emigration begin to fall.18 out of 47 sub-Saharan countries,only seven are currently above the $9,000 GDP-per-capita level, and 39have a GDP below $7,000 per capita. Under reasonable assumptions, 35countries are expected to still be below that level in 2030. meanwhile, thepopulation of these countries will have reached 1.05 billion.
low economic development in the countries of origins, combined withprojected demographics, leads us to conclude that many will seek to leavethe African continent. northern African countries that have higher levelsof income as well as lower rates of population growth can act as destinationsthemselves, and therefore buffers for the EU. The fact remains, however,that the EU will remain a popular destination. European countries willnecessarily have to find ways to help the origin countries develop, andhelp migrants integrate at home.
Defense Expenditures
Important geopolitical challenges, ranging from irregular immigrationto tensions with Russia, have prompted the EU to think harder about pro-
17 Uri Dadush, maria Demertzis and Guntram Wolff, “Europe’s role in north Africa: devel-opment, investment and migration,” Bruegel Policy Contribution no. 10, 2017,http://bruegel.org/wp-content/uploads/2017/04/PC-10-2017.pdf.
18 michael, Clemens, “Does development reduce migration?” International Handbook on Mi-gration and Economic Development, pp. 152-185 (2014), https://www.cgdev.org/sites/default/files/does-development-reduce-migration_final_0.pdf.
134 DomESTIC DETERmInAnTS oF FoREIGn PolICy

tecting its outside borders. This has given rise to discussions on coordi-nating defense and security, issues that the EU had previously left almostexclusively to member states, even though defense and security is one ofthe few issues where most European citizens agree that the EU can playa constructive role.19
In June 2017 the EU Council agreed to launch a European DefenseFund,20 the purpose of which is to “coordinate, supplement and amplifynational investments in defence research, in the development of prototypesand in the acquisition of defence equipment and technology.” The Euro-pean defense fund would aim to generate a total investment in defensecapability of €5 billion per year.
At the same time, there has been increasing criticism coming from theUnited States on inadequate defense spending. President Trump directlycriticized nATo members for not honoring their budgetary commit-ments. only 5 members (including the United States) actually meetnATo’s defense spending target of 2 percent of GDP (Figure 12).
Feliu argues that Donald Trump’s statements effectively acts as a threat(and is perceived as such) of removing the security guarantee that theUnited States had always offered European countries through nATo.21
If European countries that are nATo members wanted to meet the 2 per-cent of GDP target, they would have to collectively spend an additional$96 billion annually.
It is not at all clear that EU countries are responsive to such calls. Coor-dinating defense spending via the new fund is a way to exploit economiesof scale and reduce inefficiencies. But there is no clear appetite to expandspending, and certainly not of the scale that would be required. And thereare even arguments that challenge the appropriateness of increasing mil-itary spending at all. Andrew moravcsik, for example, argues that “demandsfor … defense spending rests on an outdated conception of world power.”22
19 In an April 2017 Eurobarometer survey, 68 percent of those polled would like the EU todo more on security and defense policy. Indicatively, 57 percent of responders thoughttheir country’s membership of the EU was a good thing. Results here:http://www.europarl.europa.eu/pdf/eurobarometre/2017/2019ee/two_years_until_ee2019_synthesis_en.pdf.
20 See communication announcement here: http://europa.eu/rapid/press-release_IP-17-1508_en.htm.
21 Justine Feliu, “Trump, nATo and European defence spending,” Bruegel Blog post, november15, 2016, http://bruegel.org/2016/11/trump-nato-and-european-defence-spending/.
22 Andrew moravcsik, “Europe pays its fair share whatever Donald Trump says,” Financial
Changing Economic Fortunes for Europeans: Implications for Foreign Policy 135

He continues by saying that Europeans have other non-military ways ofexerting global inf luence, namely by pursuing diplomatic routes andenhancing economic ties. He refers to German Chancellor Angela merkel,who believes that engaging in trade, providing developing aid and pro-moting multilateral institutions, such as development banks, are moreeffective ways of safeguarding national security.
Be that as it may, the emergence of new global powers and the clearchange in the global role that the Trump administration wants the UnitedStates to play in defense, trade and spreading of cultural values are forcingthe EU to rethink its own position.
Redefining Allies
The last issue to discuss is how a change of world powers is also affectingthe EU’s global stance. An important trend, which began a couple ofdecades ago, saw advanced economies diminishing in relative economic
Times, may 26 2017, https://www.ft.com/content/b50b456e-41ed-11e7-82b6-896b95f30f58.
136 DomESTIC DETERmInAnTS oF FoREIGn PolICy
Figure 12: Defense Expenditures as Percentage of GDP (basedon 2010 prices)
0.0%
1.0%
2.0%
3.0%
4.0%
5.0%
6.0%
2009 2015 2016 expected target
* Data do not include pensions, ** based on 2010 pricesSource: Justine Feliu, “Trump, NATO and European defence spending,” Bruegel Blog post, November 15,2016, http://bruegel.org/2016/11/trump-nato-and-european-defence-spending/. Bruegel calculationsbased on time series computed by NATO. See press release on defense expenditures:http://bru.gl/2fcxLKJ.

power. This trend became evident around 2010, when advanced countriesstarted to account for less than half of global GDP in purchasing powerterms.23 As advanced economies saw their shares in global trade andincome decline, they resorted to a more protectionist approach whenengaging with other countries.
This trend is very visible in the United States currently, but it is notnew. It emerged during the Clinton administration (1993–2001), whenthe question of “what’s in it for us?” first arose in terms of “regaining com-petitiveness.” However, the Trump administration does not just aim toreduce the U.S. role as an anchor of the global multilateral system, it hasopenly challenged it, either by threatening to withdraw from it unilaterallyor by imposing protectionist measures, such as high tariffs. The underlyingrationale of “what’s in it for us?” is well captured by President Trump’s“America first” rhetoric.
In the meantime, China’s position in the world has strengthened duringthe last quarter century. President Xi Jinping’s speech in Davos in January2017 was indeed that of the leader of a global power calling for an openglobal economic system.24
Where does that leave the EU? To answer the question, it is importantto understand the EU’s current economic ties. Figures 13 and 14 showthe bilateral trade and investment between a number of countries. For theEU27, the United States is the number one partner for both exports($495.5 billion) and imports ($463.5 billion). With regards to China, theEU27 exports $190.4 billion and imports $394.9 billion. For the EU27the UK remains a very important trading partner, even before China(exports to: $445.5 billion, imports from: $348.5 billion). For the UnitedStates, China is the number one partner, certainly with regards to itsimports ($517 billion), although the EU is the first destination for U.S.exports ($463.5 billion).
When it comes to foreign direct investments, the ties between the EUand the United States are also very strong. Figure 14 shows that 44 percentof U.S. foreign direct investment comes from the EU27 ($1.38 trillion),
23 maria Demertzis, Andre Sapir and Guntram Wolff, “Europe in a new world order,”Bruegel Policy Brief, Issue 2, February 2017, http://bruegel.org/wp-content/uploads/2017/02/Bruegel_Policy_Brief-2017_02-170217_final.pdf.
24 For the text, see https://www.weforum.org/agenda/2017/01/full-text-of-xi-jinping-keynote-at-the-world-economic-forum.
Changing Economic Fortunes for Europeans: Implications for Foreign Policy 137

and 31 percent of the EU27’s foreign direct investment comes from theUnited States ($2.16 trillion).
In short, the economic relations established between the EU and theUnited States imply a natural alliance. And if the Transatlantic Trade andInvestment Partnership (TTIP) were to be pursued, this economic alliancecould be enhanced by offering greater choices, reducing prices and gen-erating jobs and growth.25
nevertheless, despite these very clear ties with the United States, theEU has a strong economic and political interest in preserving the multi-lateral trading system. openness, measured as exports in terms of a coun-try’s GDP, is far greater in the EU (43.8 percent) than in China (22.1percent) or the United States (12.6 percent). The rules-based systemallows all players, including the weaker ones, to trade with each otherbased on high and comparable standards that have to be followed by all.Protectionism would reduce EU and global welfare, hurt global growthand could mean lower standards and unfair competition. In particular, in
25 See an independent study for the effects on the EU: http://www.trade-sia.com/ttip/.
138 DomESTIC DETERmInAnTS oF FoREIGn PolICy
Figure 13: Bilateral Imports (Goods and services) in 2015,Selected Partners ($ billions)
Into: US EU27 UK China* Japan Canada
From
US 463.5 96.6 150.5 126.3 285.2
EU27 495.5 445.5 190.4 88 35.1
UK 108.5 348.5 18.9 19.1 12.9
China 517 394.9 64.7 172.4 53.4
Japan 166 88.1 14.5 143.1 13.5
Canada 331.1 31.1 13.5 26.3 11.3 0
World 2784.3 2828.1 845.2 1681.7 817.7 529.5Source: Bruegel based on UN Comtrade data (available here: https://comtrade.un.org/data/). Note:*China numbers for goods only. Data for goods, bilateral trade on import statistics, which are consideredmore accurate given the custom system in place to collect tariff revenues. Data for services: Bruegelbased on ITC Trade Map and OECD Statistics on International Trade in Services by partner country. Bothsources follow the Extended Balance of Payments Services Classification (EBOPS 2010).
Note: data on EU27 are estimated by subtracting UK imports from all the bilateral import flows of EU28.In particular, EU27 (EU without the UK) total imports are equal to (EU28 total imports - UK total importsfrom ExtraEU28 + EU27 imports from UK).

the EU with its strong trade relationships around the world, many jobscould be at stake.
But can the EU protect the continuation of the multilateral systemalone or in coordination with China, as it had done with the United Statesin the past? This is not a trivial question because the EU and Chinese eco-nomic systems are much more dissimilar than the EU and American eco-nomic systems. nevertheless, in certain areas, such as support for theWTo, EU-China collaboration should be relatively straightforward. TheEU should also seek other partners for collaboration in support of theWTo.
overall, there is a very clear economic link between the EU and theUnited States that could come under threat if the latter were to take uni-lateral protectionist trade measures. This would be damaging to interna-tional welfare, and the EU would be pressed to react strongly and decisivelyto such measures. The underlying guiding principle needs to be to defendmultilateral trading systems that have helped increase welfare across theworld. At the same time, collaboration with others to this end is equallyimportant.
Conclusions
The financial crisis has left a different economic and political trail inthe EU and the euro area than it has in the United States. Although itsmember states are deeply integrated economically, the euro area lacks a
Changing Economic Fortunes for Europeans: Implications for Foreign Policy 139
Figure 14: FDI Stocks 2015 ($ billions)
To: US EU27 UK China* Japan Canada
From
US . 2156.3 433 116.6 51.6 280
EU27 1382.3 . 679.9 257.9 58.4 150
UK 484 1248.6 . 42.3 13.2 24.8
China* 25.9 97.1 20.6 . 8.4 26.7
Japan 411 115.3 67.7 180.7 . 15.9
Canada 269 214.3 34.4 15.8 1.2 .
World 3130 6863.6 1550 2580 171 555
Source: CDIS (Coordinated Direct Investment Survey), IMF. *(including Hong Kong)

governance set-up that would allow it to respond to problems as theyarise. In economic terms, this means that responses to the financial crisisand its aftermath late came too late and remain incomplete. Excessivedebt, and high unemployment particularly among the young, continue toprevent growth from picking up convincingly.
There are, of course, differences in economic development among euroarea countries. Arguably, such differences can be larger than among statesin the United States. This would then make it difficult to identify appro-priate economic responses at the macrolevel of the euro area itself. onesize cannot easily fit all.
While there is some truth to this argument, it should also not be over-stated. Differences in taxation and legal systems are an important sourceof heterogeneity. But there is also a very large accumulated body of Euro-pean Union law, known as the acquis communautaire, that has establishedcommon standards across all countries. This in turn has allowed the cre-ation of a Single market, a common currency, and a banking union, andwill promote a digital single market in the future.
moreover, economic heterogeneity is also substantial in the UnitedStates; indeed, there is no clear evidence that the United States is anoptimal currency area. However, where there is an important differenceis that the United States is an economic federation, which next to a singlecurrency, enables authorities to tax and redistribute at the federal leveland thus smooth economic shocks across the states. Despite also havinga single currency, the euro area does not have that power, and thus countriesare left to fend for themselves when shocks arise. Building an economicfederation would be the right step to take to strengthen the EU’s archi-tecture. This is not a short- or even medium-term possibility, however,and many doubt whether this is even a long-term possibility. In the mean-time, the euro area copes with its multi-level, half-way architecture.
Despite these challenges, most countries in the EU have one importantstrength: they have always maintained relatively low levels of incomeinequality, certainly in comparison with the United States. As the benefitsof open economies were shared more evenly, citizens found it easier toaccept and endorse the benefits of globalization. As a result, there has onthe whole been support in EU member states for closer cooperationbetween nations, neighboring as well as further afield. In contrast, in theUnited States, and to some extent also the UK, the benefits of globalizationaccrued only to a few. These societies became distinctively more polarized,
140 DomESTIC DETERmInAnTS oF FoREIGn PolICy
giving rise to deep discontent. And this, in my view, has left a differentpolitical trail, manifested in the ability of many EU countries to containpopulist voices.
Apart from its own internal problems, the EU faces a number of outsidepressures. The refugee and migration crises have raised the issue of pro-tecting external borders. At the same time, discussions on the need toincrease and coordinate defense has also raised an issue that had laid dor-mant for decades. Here again, the extent to which there can be progressdepends crucially on the EU’s ability to coordinate swiftly and effectively.
last but not least, the emergence of China as a global player and theincreasing withdrawal of the United States from global leadership is cre-ating a tri-polar system of world powers. As a staunch supporter of mul-tilateralism, the EU is having to reconsider its position and how to bestprotect its interests. on the hand it needs to maintain what has alwaysbeen the most natural of alliances with the United States, despite havingto deal with a series of increasingly contentious issues. on the other hand,it is having to deepen alliances with China, despite very significant differ-ences of views, in particularly when it comes to the role of the state in themarket place. And since the emergence of a tri-polar global system doesnot automatically lead to multilateralism, the EU will have to invest inbuilding broad alliances across the world.
There is no doubt that international economic relations are currentlyshifting and that partnerships need to evolve. This is also true for the EU-U.S. relationship. It is important to maintain and promote economic tiesbetween the two, as they rest on a similar and established economicapproach. nevertheless, it is also important to strengthen ties with newcountries as they enter the global economic system, and there is no reasonwhy this will be antagonistic to EU-U.S. relations. At the core of itsapproach, the EU aims to strengthen the multilateral system and promoteaccess for all. A concerted EU-U.S. effort could go a long way in achievingthat.
In the end, the EU’s ability to promote economic development at theglobal level rests on the future of its own integration. European integration,in turn, depends crucially on the responses Europeans provide to bothinternal as well as external challenges. Important problems and populistpressures remain. It is vital that Europe avoid the trap of isolationism, butfar from guaranteed that it will do so.
Changing Economic Fortunes for Europeans: Implications for Foreign Policy 141
