changing directions - rethinking working and commuting in the gta · changing directions rethinking...
TRANSCRIPT

Changing directionsRethinking working and commuting in the GTA

This page has been intentionally left blank.

Table of contents
Rush hour 03
Commuting by the numbers 06
All aboard 10
Rearview mirror 23

This page has been intentionally left blank.

3
Changing directions | Rush hour
Rush hourIt’s 4:45 a.m. and Kat’s alarm is ringing. To make the bus that will bring her to the Markham GO Station for her 6:15 a.m. train, she will need to leave her house within the half hour. Although Kat enjoys the comfort of the GO Train, she dislikes the long, arduous commute to the station. As she begins her walk to the bus stop to catch the York Regional Transit bus, she can’t help but think, “I wish I was still in bed.”
Meanwhile, closer to the City of Toronto, Robert is still sleeping. Despite how short his single‑line subway commute is, delays are unavoidable. Robert has learned this the hard way. Although he doesn’t need to be at work until 8:30 a.m., he rushes out the door a full hour earlier to mitigate against the risk of delays.
Robert’s colleague, Peter, lives in a central downtown condo near the financial district. On most days, it takes Peter no more than 15 minutes to get to the office—some days, even less. As Peter glides down a bike lane past an unmoving mass of cars, the din of their horns echoing through the streets,
he can’t help but appreciate how fast and efficient his commute is. This thought is cut short when, suddenly, a car quickly clips into his bike lane, stopping abruptly to let a passenger out on the sidewalk. Peter slams his brakes, narrowly avoiding the bumper of the car. “On second thought,” he thinks, “my commute could be improved.”
In the city’s West end, Lin‑He is battling an entirely different set of stresses. Between getting her twin toddlers dressed, fed, into their car seats, aligning with her husband on a daycare pickup time, and fielding an unexpected phone call from work, Lin‑He is exhausted—and she hasn’t left the house yet! As she begins to pull out of her driveway, she mentally flips through her schedule for the day—daycare, client meeting, office, gym, daycare, swimming lessons, home. She heads out of her Etobicoke neighborhood and stops at an intersection beside the Mimico GO Station. While waiting for the light to turn, she watches a string of orderly passengers boarding the train. “That looks more relaxing,” she thinks.
Only a few streets away, Carol is sitting in gridlock. Unlike most commuters, Carol is unfazed by this—she is too busy discussing important work matters with her colleagues on the phone. “The sales meeting went very well,” she says into her Bluetooth. Responses trickle in over the line. “I’m heading over to the client breakfast now—I’ll update the team on progress this afternoon,” Carol says, finally reaching her exit.
Scenarios like these play out every day in the Greater Toronto Area (GTA)—throngs of citizens navigating busy roads, clogged subway stations, and unsafe streets, all for one common purpose: to get to their place of work. The commuter stories above are a distillation of the range of experiences that millions of GTA commuters have, as they make their way in and out of the office towers, warehouses, restaurants, and retailers that comprise the hub of Ontario’s largest economy.
Changing directions | Rush hour
4
Commuting is about more than infrastructureOver the past 50 years, Toronto’s economy has grown exponentially, reaching a post‑industrial state in an extraordinarily short time frame. While cities like New York and Chicago established industrial economies by the turn of the last century, Toronto only began its transition to industrialization in the 1960s.1 In a remarkably brief period, the GTA has become the third largest industrial complex and fifth largest office market in North America.2
The pace and magnitude of the GTA’s growth has dramatically shifted the physical structure of the region—condominium towers now dominate the skyline, suburban communities have sprawled without impediment, and office buildings are scattered beyond the downtown core. Once a relatively simple region to navigate, the GTA has transformed into a wide‑reaching, diverse landscape of commercial and residential developments.3
In the 1960s, GTA residents lived and worked in a relatively uniform manner—commercial activity was concentrated to the urban core and citizens lived in close proximity to their place of work, in part, because lifelong job tenure was the norm.4 Today, commercial activity has spread throughout the GTA, with 54 percent of offices located beyond the reach of rapid transit.5 Average job tenure has decreased dramatically, with 51 percent of Canadians staying in their jobs for less than two years.6 Further, the price of housing in the GTA has skyrocketed.7 Despite a strong preference for living in walkable, transit‑friendly neighborhoods, 80 percent of GTA homebuyers select their place of residence solely on the basis of cost.8
Despite these fundamental shifts to the structure of the region, the primary conversation about transportation in the GTA has remained the same—build and maintain transportation infrastructure.
This strategy was successful at managing capacity and satisfying growth in the 1960s. Today, however, it is misaligned, failing to address the diverse needs of citizens.
However, with the onset of dramatic and exponential technological disruption, we have the opportunity to re‑frame the problem and consider alternative solutions. The pace and volume of change will only accelerate over time, creating even more diversity in the ways people live and work in the GTA. The confluence of technological advancements, globalization, and shifting demographic patterns is creating a new world of work that is more social, more flexible, more technological, and less hierarchical.9 Although it may feel imperceptible from year to year, over the past decade, a fundamental shift has occurred in how we define and access work.
There is now a significant portion of the workforce that does not have a traditional office—they work from home, at client locations, while travelling, and even in coffee shops.10 Today and in the future, employees will no longer be bound together by place. Instead, with the advent of mobile technologies and flexible working programs, people can connect from anywhere around the globe.11 In fact, the number of people working on international assignments has increased 25 percent over the past decade, and further growth of 50 percent is expected by 2020.12
The future of work cannot be defined by programs or policies. From compressed work weeks to job sharing, from telecommuting to adjustable schedules, which specific ‘future‑oriented’ work strategies are most effective at increasing employee engagement, retention, and productivity remains unproven.13 Instead, the future of work can be characterized by one core theme—tailoring. The new world of work will require businesses to abandon the traditional, one‑size‑fits‑all working model in favor of flexible operations that can be tailored to address

5
Changing directions | Rush hour
the diverse needs of individuals.14 Workers will be more individually empowered, seeking roles that facilitate mobility and flexibility.15 Deloitte’s proprietary research shows that this sentiment is already being felt in Canada, with 80 percent of the workforce saying they would change jobs in order to have a role that enables greater flexibility.16 Despite this desire, 90 percent of the workforce still prefers to work in an office environment—preferably ones that are equipped with a variety of different workspaces.17
Currently, our transportation systems are built to accommodate commuter flows that align with standard working models—increased public transit capacity during 9 a.m. and 5 p.m. rush hours, increased infrastructure in the financial core of the city, etc. While we do not know the specific implications that the future of work will have on our transportation systems, we do know that it will increase the diversity of needs in the commuting ecosystem.
Over the next thirty years, the GTA is expected to create one million new jobs—roles that will undoubtedly be different in nature than those today.18 The ways in which people live and work in the GTA is only going to become more diverse. Our commuting solutions must continue to evolve to match this diversity, to ensure that the GTA remains an innovative, vibrant, and rewarding place to live and work.
Commuting needs to be about people Commuting is one of the most widely discussed and debated topics across the province of Ontario—and rightfully so, considering the material impact that suboptimal commuting has on the economy. Metrolinx estimates that inefficiency in the GTA’s transportation systems costs the region $6 billion every year—$2.7 billion in economic impacts, including reduced employment, increased
operating expenses, and reduced industry revenues; and $3.3 billion in social impacts, including increased commuting costs, accidents, emissions, and delays.19 Every day, media outlets, businesses, and politicians alike weigh in on how to improve the GTA’s commuting experience. This conversation is guided by familiar questions: What should we build? Where should we build? How much should we spend? Where should we obtain funding?
The problem is, these questions are rather one‑dimensional. Instead of looking for a single solution, we must broaden our lens to consider the most critical component of the commuting ecosystem:
The commuters.
Very few are talking about commuters or the very broad set of decisions they make each and every time they set out on onto a road, platform, or sidewalk. What mode will allow me to be productive during my commute? Is it my turn to pick up the kids from daycare today? Is it worth paying the exorbitant price of parking in the downtown core? Does my work require that I have a vehicle? Should I move closer to my office?
The responses to these questions are vast and varied. By looking just at a small group of five—Kat, Robert, Peter, Lin‑He, and Carol—we can see great diversity in the commute experience. This diversity is not being addressed by a transportation system that focuses primarily on one‑size‑fits‑all, large scale, multi‑year capital projects.
The public discourse on commuting in the GTA has been incredibly limiting. To drive toward better commuting solutions, the discourse must be shifted to focus on understanding and fulfilling the diverse needs of commuters.
It’s time to change the conversation.

Changing directions | Commuting by the numbers
6
Commuting by the numbersIf we want to uncover the diverse needs of GTA commuters, we must first understand the current state of commuting in the region—the lived behaviors of citizens. What mode do people use to get to work? Where are they coming from? Where are they headed? How long does it take? How much does it cost? Developing a fundamental knowledge of the GTA’s commuting landscape will lead to a better understanding of the underlying preferences that inform commuter behavior. Why do people select the mode that they do? Why do they prefer one mode over another?
If we’re going to shift the conversation to place a greater emphasis on commuters, we must first understand them.
On the road
The commuting discourse focuses primarily on drivers, who make up 65 percent of all commuters in the GTA. What the narrative fails to tell us is why. Fortunately, an examination of Statistics Canada commuting data for the GTA reveals some clear patterns.
GTA commuting rhetoric often assumes that suburban dwellers comprise the majority of drivers in Toronto, and that these commuters are the primary reason roads are overburdened. Citizens from Markham, Richmond Hill, Pickering, Mississauga, and the like, filling the arteries of our transportation system, all en route to their jobs in the downtown core.
Examining departure points of Statistics Canada commuter data disproves this long‑held hypothesis, instead showing that 65 percent of GTA workers are commuting from within Toronto’s city limits.
Even more remarkably, almost half of the commuters that drive are traveling less than 10 km each day—roughly the distance between Union Station and Yonge and Lawrence. To be traveling such a short distance within the city limits suggests that the majority of drivers have a public transit option available to them but prefer to drive.
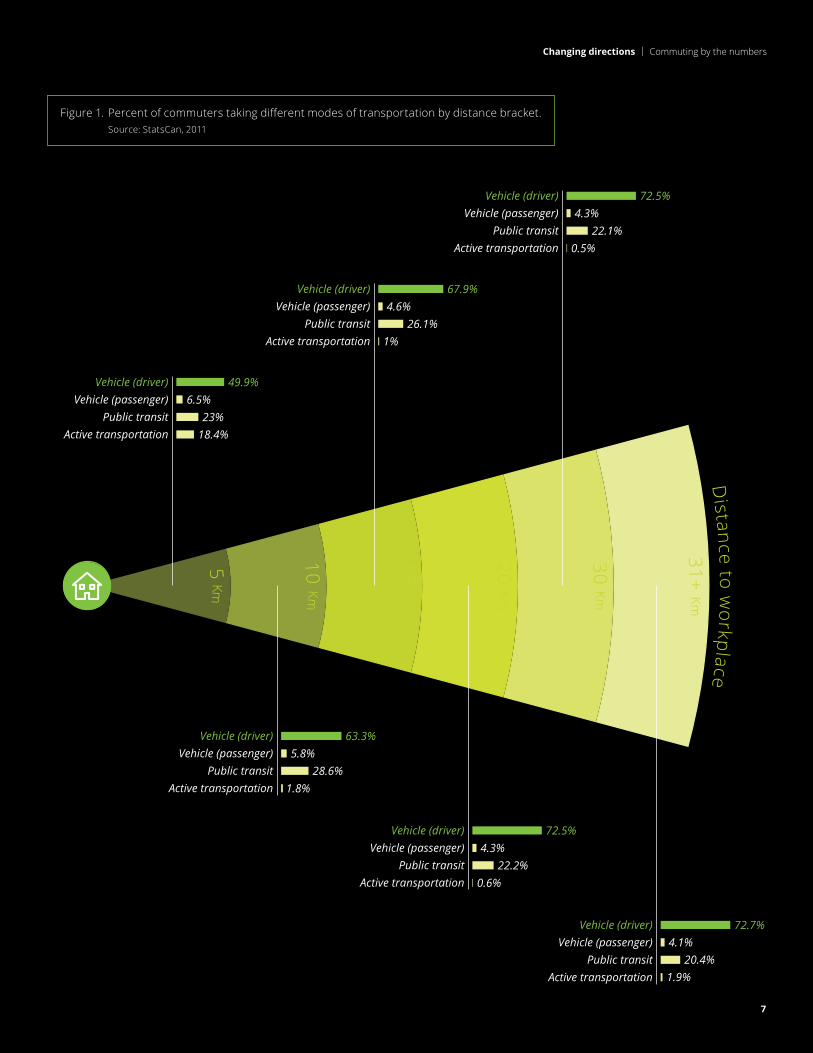
We found that distance plays a limited role in determining a commuter’s mode of transportation in the GTA. Unless a commuter is traveling less than 5 km, in which the proportion of cyclists increases significantly, commuters are almost equally likely to choose driving over public transit at any distance (Figure 1).
So if distance is not the core variable underlying the large proportion of drivers in the GTA’s commuting equation, what is? Cost? Time‑efficiency?
Unsurprisingly, the cost of driving significantly outweighs the cost of all other options—TTC, GO Transit, cycling, walking, ridesharing—regardless of where a commuter is coming from (Figure 2). In all possible cases, driving is at least two times as expensive as taking the GO Train.20 For instance, a commuter driving from Vaughan to Toronto will pay $680 per month in fuel, insurance, and maintenance fees, while a GO Train commuter travelling the same distance will pay only $230.
49.9%6.5%
23%18.4%
Vehicle (driver)Vehicle (passenger)
Public transitActive transportation
63.3%5.8%
28.6%1.8%
Vehicle (driver)Vehicle (passenger)
Public transitActive transportation
72.5%4.3%
22.2%0.6%
Vehicle (driver)Vehicle (passenger)
Public transitActive transportation
72.7%4.1%
20.4%1.9%
Vehicle (driver)Vehicle (passenger)
Public transitActive transportation
67.9%4.6%
26.1%1%
Vehicle (driver)Vehicle (passenger)
Public transitActive transportation
Vehicle (driver)Vehicle (passenger)
Public transitActive transportation
72.5%4.3%
22.1%0.5%
5 Km
10 Km
15 Km
20 Km
30 Km
31+ KmD
istance to workplace
Figure 1. Percent of commuters taking different modes of transportation by distance bracket.Source: StatsCan, 2011
7
Changing directions | Commuting by the numbers

Figure 2. Cost of commuting by place of residence.Source: StatsCan, 2011
TorontoGO Train+TTC
Driving142 $/mth
403 $/mthMississauga
GO TrainGO Train+TTC
Driving
251 $/mth367 $/mth
561 $/mth
OakvilleGO Train
GO Train+TTCDriving
274 $/mth390 $/mth
651 $/mth
WhitbyGO Train
GO Train+TTCDriving
322 $/mth438 $/mth
816 $/mth
PickeringGO Train
GO Train+TTCDriving
265 $/mth
381 $/mth
681 $/mth
Ajax288 $/mth
404 $/mth748 $/mth
GO TrainGO Train+TTC
Driving
Richmond Hill
343 $/mth662 $/mth
GO TrainGO Train+TTC
Driving
227 $/mth
Brampton269 $/mthGO Train
GO Train+TTCDriving
385 $/mth710 $/mth
Markham265 $/mth
381 $/mth590 $/mth
GO TrainGO Train+TTC
Driving
Vaughan230 $/mth
346 $/mth680 $/mth
GO TrainGO Train+TTC
Driving
8
Changing directions | Commuting by the numbers

9
Changing directions | Commuting by the numbers
Total commute duration Percentage of commuters satisfied with their commute
120+ min
90-119 min
60-89 min
30-59 min
1-29 min
GTA commuters are therefore not driving because it is cost‑effective; rather, they are electing to drive in spite of the expense. So why are they driving?
Although the public discourse on commuting centers on drivers who endure very long commutes (1 hr+), the data shows that commuters who take public transit suffer through the longest commutes in the GTA. Commuters are choosing to drive because it is the fastest option available, with public transit users experiencing a 15‑minute‑longer commute than drivers, on average.
Regardless of the distance travelled, public transit takes longer per kilometer.
Time is the vital currency for GTA commuters, who will readily exchange what’s in their pocketbooks for the chance to recapture a few minutes, or perhaps hours, of their day. The GTA is not alone in this. Many studies that have examined the relationship between commute duration and commute satisfaction have yielded the same results.21
A study by Statistics Canada confirmed the sentiment that many commuters feel every day—the longer their commute takes, the less enjoyable it is (Figure 3).22
Figure 3. Commute duration relative to satisfaction.Source: StatsCan, 2011
In this study, when duration was held constant, the level of satisfaction (or dissatisfaction) was consistent across all transportation modes, implying that time is the ultimate deciding factor in a commuters’ choice of transportation. When it is financially feasible, people will make transportation decisions on the basis of time and time‑related factors (e.g., flexibility in schedule).
The truth of the GTA’s commuting story has been lost in the tangle of commuting rhetoric. As we unweave the data, the picture becomes clear: the majority of people drive, regardless of the distance, and almost entirely because driving is the fastest option. GTA commuters so value convenience, flexibility, and above all, their time, that they’re willing to pay significantly for it.
The data, however, is only the beginning of the road. Commuting is a process fundamentally rooted in personal experience. Every commuter is an expert in commuting; someone who can lend valuable, actionable insight to the discourse. To further explain what we see in the data, and to drive toward better commuting solutions, we must bring commuters into the conversation.
56%
42%
32%
28%
19%
44%
58%
68%
72%
81%

Changing directions | All aboard
10
All aboardLin‑He is back on the road again, this time en route to her house. In the mix of the morning shuffle, she accidentally forgot her briefing notes. If she goes quickly enough, she’ll be able to make it back to the office in time for her 10:00 a.m. meeting.
Carol has already concluded one important call and is halfway into the next—hands‑free, of course—her eyes on the lookout for a good parking space.
Robert, unfortunately, has hit a major delay on the TTC. It happens once every few weeks, but seemingly only on days when he has an important meeting.
Peter made it to work unscathed, apart from the torrent of rain water churned up by a taxi that took that one corner a bit too fast—and a bit too close. Fortunately, he brought a change of clothes to the office with him.
After three transfers, Kat begins the final leg of her commute, a ten‑minute walk from the GO Station to her place of work. By the time she arrives, she is exhausted—her energy at an all‑time low. She quickly places her items in her locker, straightens her nametag, and exits the employee workroom.

11
Changing directions | All aboard
The Bustling ‘Burbanite
The Multi‑Tasking Motorist
The Single‑Line Subway‑Rider
The Environmental Evangelist
The Cost‑Conscious Commuter
Pathfinders
Lin‑He, Carol, Robert, Peter, and Kat are archetypal commuters, their experiences holding close to the realities that many commuters face every day in the GTA. When taken together, these archetypes are broadly representative of the GTA commuting story as a whole. They don’t capture every conceivable scenario, but they do allow us to get above the snarl of the congestion and gridlock rhetoric to see the situation from the perspective of commuters themselves.
Each of these commuters will allow us to uncover and understand some of the diverse experiences that exist in the GTA’s commuting ecosystem, as well as the pain points that are being overlooked. Ultimately, they’ll also help us figure out how we can change directions toward finding better commuting solutions.
Lin‑He, the Bustling ‘Burbanite. Home to daycare to the office to the gym to the grocery store to daycare and back home again! A car is a must for Lin‑He, whose daily commute is a multi‑leg journey. Flexibility is crucial.
Carol, the Multi‑Tasking Motorist. Car? Office? It’s one and the same to Carol. Be it an unexpected meeting at the client site or a conference call on the way out of town for the weekend, this commuter is all work all the time and requires a method of transportation that allows her to be maximally productive.
Robert, the Single‑Line Subway‑Rider. As a midtown dweller, Robert takes the TTC subway to avoid the overwhelming rush‑hour street traffic. His streamlined subway commute suits his needs well because it provides the most efficient, fast, and direct route to his office in the downtown core—assuming everything is running on time.
Peter, the Environmental Evangelist. Peter rents an apartment within short distance of his office so that he’s able to cycle to work. Every day, he braves the crowded city streets in pursuit of a short, active, environmentally‑friendly commute.
Kat, the Cost‑Conscious Commuter. For Kat, the affordability of public transit outweighs the time it takes to use it. With a predictable hourly work schedule and a fixed office location, Kat follows tightly to a set daily routine that revolves around transit timetables.
Let’s consider each in more detail.
The Bustling ‘Burbanite
The Multi‑Tasking Motorist
The Single‑Line Subway‑Rider
The Environmental Evangelist
The Cost‑Conscious Commuter

8:15 a.m.
15 min. 19 min.
Changing directions | All aboard
12
Lin‑He's morning commute
Meet the Bustling ‘Burbanite
Like all parents, Lin‑He makes her personal decisions—where to live, what to buy, and of course, how to commute—bearing in mind her greatest priority, her children. Lin‑He and her husband are always on the go, shuffling between daycare, the grocery store, the gym, the dry cleaners, the office, and swimming classes. Their busy schedules often change at the drop of a hat for a variety of reasons—one of their daughters is sick at daycare, for instance, or they have to make an unexpected trip to the office.
Commuting by car provides freedom, the ability to come and go as they please, and never having to plan around the imposition of a fixed transit schedule (Figure 4). Despite living just five minutes away from the Mimico GO station, Lin‑He and her husband have never taken the GO Train—it just doesn’t seem possible to accomplish their long list of daily tasks without a car.
Figure 4. Bustling out of the ‘burbsNote: This data was constructed based on findings from the StatsCan, 2011 Commuting Survey on commute duration.
What does the discourse miss? Lin‑He feels powerless to lessen the pain of her commute; being on the go all the time is the nature of parenthood. However, Lin‑He wishes she wasn’t required to make so many stops in between home and work. Even when traffic is moving well, her daily commute is prolonged due to its stop‑start nature. The city’s plans to improve the commute experience for drivers by optimizing intelligent transportation systems sounds great to Lin‑He, though it will do nothing to address her primary commute pain point.23
What can businesses do? Through embracing the future of work, Lin‑He’s employer can help reduce her commute and improve her job satisfaction.24 By introducing flexible working hours where Lin‑He can commute in off‑peak times, allowing Lin‑He to work from home, or providing integrated
3 min.
8:30 a.m.
Arrive at daycare Depart daycare Arrive atparking
8:33 a.m. 8:52 a.m.
Departparking
8:55 a.m.
5 min.
9:00 a.m.
3 min.
12 km 45 minutes

13
Changing directions | All aboard
amenities at the office (e.g., grocery pickup, daycare services, a cafeteria) her employer can reduce the daily burden of her commute.
Case Study: Tokyo Tokyo’s private rail operator, Tokyu, operates at one of the highest levels of ridership in the world, a degree of success owed greatly to Tokyu’s development of Ekinaka—mega‑malls and shopping centers built around rail lines.25, 26 These stations are not just places through which people idly pass but destinations unto themselves, including grocery stores, day cares, dry cleaners, etc.27 Without even leaving the station, Tokyo rail commuters can squeeze the most out of every minute of every day—even during their commute.
Tokyo developed a successful commute solution by understanding the value that commuters place on time.
Considerations for the GTA "Bus and rail‑integrated communities” turn riders into customers, and vice versa, at all hours of the day. In the GTA, incentives for businesses to locate near rail stations could help increase the GO system’s convenience and, ultimately, use. Would Bustling ‘Burbanites in the GTA consider losing their vehicles if they could run all of their errands in one central location?

Changing directions | All aboard
14
5 min.
7:00 a.m.
33 min. 6 min.
*Does not include the time spent at off‑site meeting
Carol's morning commute
Meet the Multi‑Tasking Motorist
Commuters often take on specific routines—sitting in the same section on the train every day, stopping at the same Starbucks in the morning, listening to a specific playlist on repeat. Taking calls is the most important part of Carol’s commute routine. As Carol’s employer allows her to work from any location, no work day looks the same for her—she is often in transit between client sites, her home office, and her employer’s downtown high‑rise. An around‑the‑clock businesswoman, Carol rarely has time to spare. She requires a mode of transportation that adapts to her variable schedule and allows her to be productive in transition. With a car, Carol is able to visit multiple client sites in a day—whether it’s for sales opportunities or meetings with existing clients, she has the flexibility to go anywhere (Figure 5).
Figure 5. A Multi‑Tasker's multi‑leg commute
Note: This data was constructed based on findings from the StatsCan, 2011 Commuting Survey on commute duration.
While Carol actually enjoys her time in transit, she despairs over her commute’s environmental impact. Carol wishes there was a mode of transportation that would combine the privacy, flexibility, and productivity of vehicular travel with the environmental friendliness of public transit.
What does the discourse miss? From Carol’s perspective, the discourse is clearly focused on the symptoms of commuting, not the causes; the conversation is often about improving capacity and flow to alleviate gridlock.28 Carol believes the conversation should be shifted, to look further at the nature of work—to understand why so many people are on the roads in the first place. If not for the nature of her job, Carol would be taking public transit to and from work—doing her part to minimize emissions.
60 min.
7:33 a.m.
Arrive at off-site meeting
Departoff-site meeting
Arrive atparking
8:33 a.m. 8:39 a.m.
Departparking
8:42 a.m.
8:47 a.m.
3 min.
41 km 47 minutes*
15
Changing directions | All aboard
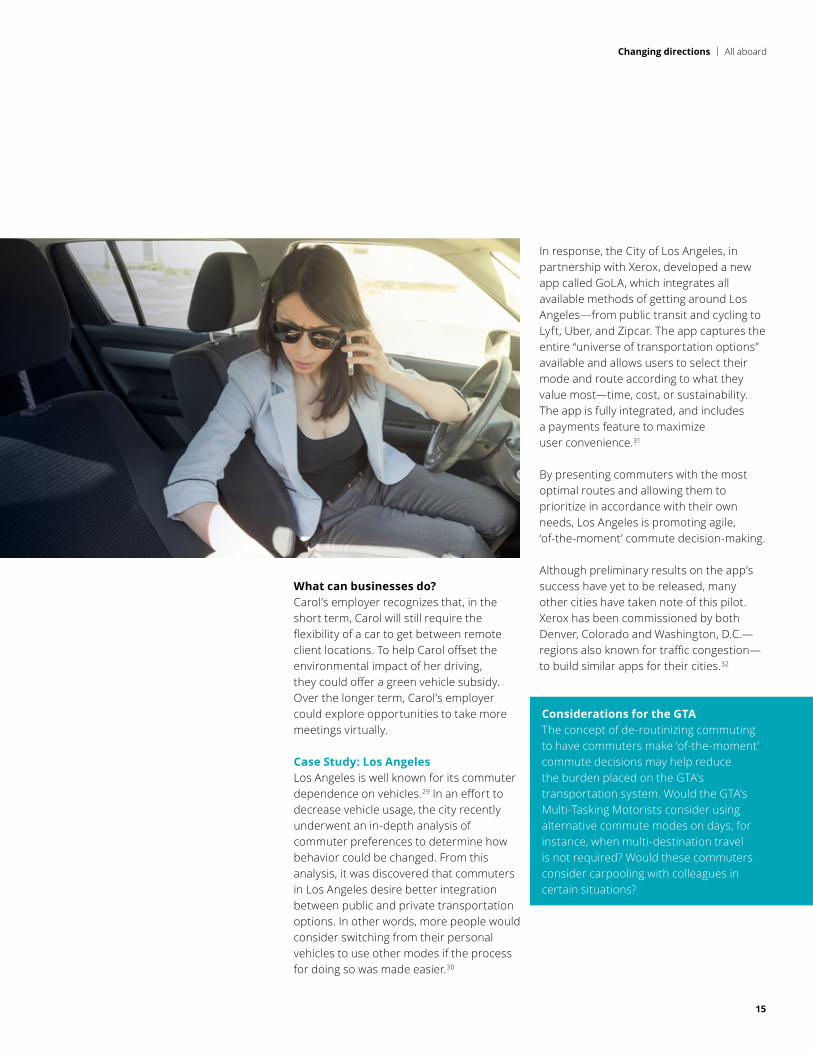
What can businesses do? Carol’s employer recognizes that, in the short term, Carol will still require the flexibility of a car to get between remote client locations. To help Carol offset the environmental impact of her driving, they could offer a green vehicle subsidy. Over the longer term, Carol’s employer could explore opportunities to take more meetings virtually.
Case Study: Los Angeles Los Angeles is well known for its commuter dependence on vehicles.29 In an effort to decrease vehicle usage, the city recently underwent an in‑depth analysis of commuter preferences to determine how behavior could be changed. From this analysis, it was discovered that commuters in Los Angeles desire better integration between public and private transportation options. In other words, more people would consider switching from their personal vehicles to use other modes if the process for doing so was made easier.30
In response, the City of Los Angeles, in partnership with Xerox, developed a new app called GoLA, which integrates all available methods of getting around Los Angeles—from public transit and cycling to Lyft, Uber, and Zipcar. The app captures the entire “universe of transportation options” available and allows users to select their mode and route according to what they value most—time, cost, or sustainability. The app is fully integrated, and includes a payments feature to maximize user convenience.31
By presenting commuters with the most optimal routes and allowing them to prioritize in accordance with their own needs, Los Angeles is promoting agile, ‘of‑the‑moment’ commute decision‑making.
Although preliminary results on the app’s success have yet to be released, many other cities have taken note of this pilot. Xerox has been commissioned by both Denver, Colorado and Washington, D.C.—regions also known for traffic congestion—to build similar apps for their cities.32
Considerations for the GTA The concept of de‑routinizing commuting to have commuters make ‘of‑the‑moment’ commute decisions may help reduce the burden placed on the GTA’s transportation system. Would the GTA’s Multi‑Tasking Motorists consider using alternative commute modes on days, for instance, when multi‑destination travel is not required? Would these commuters consider carpooling with colleagues in certain situations?

7:40 a.m.
7 min.
Changing directions | All aboard
16
Robert's morning commute
Meet the Single‑Line Subway‑Rider
Robert and his wife recently moved into a condo in the Yonge and Eglinton area of Toronto to be in closer proximity to family, friends, amenities, and of course, their downtown offices. A short, single‑line subway ride is the most convenient and efficient option for Robert. Although he and his wife could carpool downtown with their shared vehicle, the hassle of coordinating times for pickup and drop‑off, finding a parking spot between their respective offices, and navigating congestion, does not seem worthwhile for such a short and linear route. The annual cost of Robert’s 7.5 km commute is just under $1,700, which he finds more than reasonable for such a direct journey (see Figure 6).33
Figure 6. Just another quick trip for the Single‑Line Subway‑RiderNote: This data was constructed based on findings from the StatsCan, 2011 Commuting Survey on commute duration.
Robert would be the first to agree that the TTC subway experience is good but could be improved. From the careless rider who spills their morning cappuccino on other passengers to the oblivious ones taking up three seats with their bags, newspapers, and Tupperware‑sealed lunches, the TTC rush hour commute is often a slog.
However, given the short distance Robert is required to travel, the unpleasantness of the TTC’s crowds is a lesser concern to him.
Robert’s greatest frustration is the frequency of delays, and the relative lack of information made available during these situations. At least once per week, Robert’s commute is lengthened unexpectedly—delays that have, on several occasions, lasted upward of thirty minutes.
What does the discourse miss? The Toronto Transit Commission has made improvements to customer experience over recent years—most notably, by introducing Presto Pass payment terminals and by adding new subway cars to existing routes.34, 35 Despite these changes, growth in TTC ridership has been in decline, with growth rates falling from 2.2 percent in 2013 to 0.5 percent in 2016.36 On many occasions, Robert has considered switching commute modes, as the recent improvements to the TTC have not addressed his frustration with
16 min.
7:47 a.m.
Arrive at Eglinton subway station
Arrive at Kingsubway station
8:03 a.m.
8:08 a.m.
5 min.
7.5 km 28 minutes

17
Changing directions | All aboard
delays. Moreover, Robert is concerned that proposed budget cuts to the TTC may further increase the frequency of delays. Recent figures from City Council show that the TTC will require $184 million just to maintain 2016 service levels into 2017.37 Although the TTC has begun to move in a direction of changing customer experience, gross operating budget for the transportation body is in decline.38 Understanding the unique needs of commuters will help prioritize where budget should be used, in a way that will have maximal impact on experience and ridership.
What can businesses do? To help Robert get to work in an effective fashion and reduce the number of cars on the road, Robert’s employer can move in the direction of many other businesses and subsidize his transit pass. If more businesses looked at these kinds of initiatives, they could contribute to stemming decline in the growth of the TTC. Robert’s employer might also consider alternative working hours, allowing Robert to travel outside of rush hour, or offer remote working options.
Case Study: Seoul In 2004, the Seoul transit system had an exceedingly low rider satisfaction rating of 4.85 (based on a scale of 0‑10). That same year, the transit authority made a bold decision to refocus the entire transit system on addressing three important factors: convenience, safety, and punctuality—in other words, customer experience.39
Beyond timely service and vast reach, the Seoul transit authority prioritized the development of value‑added services that are important to customers, including free Wi‑Fi, cellular and mobile TV service while
underground, contactless payment, heated seats, and LCD displays with real‑time travel information to inform of delays.40
Today, the Seoul metro system ranks among the best in the world with more than 40 percent of commuters using the subway system every day (the largest share among all modes of transportation in the city).41 Furthermore, between 2004 and 2010, rider satisfaction ratings increased from 4.85 to 7.92, seeing a corresponding increase in subway ridership.42
Given the region’s high population density and mountainous terrain, a reliance on the subway is not especially surprising.43 However, the drastic improvement to rider experience is a clear indication that Seoul understands the needs of its commuters.
Considerations for the GTA Viewing subway‑users as customers is critical. As seen in Seoul, adding capacity is important, but focusing on experience can bring about smaller‑scale solutions that have major effects (e.g. adding Wi‑Fi to trains). Would having real‑time warnings of delays improve the commute experience for the GTA’s Single‑Line Subway‑Riders? Would the ability to communicate delays to people outside of the subway (e.g. Wi‑Fi‑enabled subways) reduce frustration with delays?

8:19 a.m.
Changing directions | All aboard
18
Peter's morning commute
Meet the Environmental Evangelist
Peter is passionate about making Toronto a greener and healthier place to live and work, and enjoys that his 2 km commute is quick, efficient, and environmentally‑friendly (see Figure 7).
Figure 7. Evangelizing environmentalism in commutingNote: This data was constructed based on findings from the StatsCan, 2011 Commuting Survey on commute duration.
Peter elects to ride down Bay Street because it has dedicated bicycle lanes. However, even when Peter uses the lanes, he notices that many cars do not show due respect for them, often veering too close for comfort. Peter has been “doored” on several occasions and has seen others experience worse. The frequency of these scenarios is all too high, and recent plans to expand existing cycling infrastructure in the city sound like a good idea—but something must be done to address unsafe driver behavior.
What does the discourse miss? Indeed, the conversation about cycling in Toronto is primarily focused on expanding bike lane infrastructure, under
the pretense of increasing safety. The city is currently examining the feasibility of a 10‑year, $153‑million bike lane infrastructure project to improve the connectivity of lanes on major arterial roads. Many of the lanes that are proposed would be added to existing roadways and separated by painted delineation only.44 Peter knows that better solutions could be created for cyclists to ensure their safety on all roadways.
What can businesses do? Peter’s employer could consider contributing to the growth of green commuting options in the city by sponsoring bike lanes, taking part in bike safety education campaigns, or providing alternative working hours to allow Peter to bike when there are fewer cars on the road. Many businesses also encourage bike commuting by providing showers and lockers at the worksite, simplifying some potential challenges.
8:30 a.m.
9 min. 1 min.1 min.
8:28 a.m.
Arrive atbike parking
Departbike parking
8:29 a.m.
2 km 11 minutes

19
Changing directions | All aboard
Case Study: San Jose In 2009, just over one percent of the residents of San Jose, California commuted by bike. Taking what officials described as a “user‑centric” approach, the City of San Jose developed a 10‑year cycling plan, designed to making bicycling in San Jose “safe, convenient, and commonplace.”45 Core to this program was gathering and analyzing commuter feedback. Using online forums, San Jose asked cyclists what improvements they would like to see from their transportation system—where new bike‑share stations should be located, which streets are the most stressful to navigate, etc.46, 47 They used this information directly to build a better system that considered factors beyond just infrastructure.
Although progress is still ongoing, San Jose has experienced a significant uptick in cycling ridership, as well as a decrease in cycling collisions.
Considerations for the GTA The City of Toronto has used similar online tools in the past to solicit information from citizens about infrastructure planning. Where would you like bicycle lanes to be added? Where should we focus our investment? Leveraging these existing tools to directly engage cyclists and drivers alike could help bring about user‑centric cycling solutions that address key concerns of safety. It is critical that we understand the experience of all road users who have an impact on cycling safety. How would the GTA’s Environmental Evangelists improve the structure of bike lanes in the city? Which streets are currently the least safe for cyclists and why? How can drivers be better educated on how to share roadways with cyclists?

5:20 a.m.
15 min. 18 min.
Changing directions | All aboard
20
Kat's morning commute
Meet the Cost‑Conscious Commuter
For Kat, commuting is almost a second career. By the time she has reached her final destination, she has endured so many stops, starts, waits, and transfers that the entire process gives her the feeling that rest is deserved—that a break is coming (Figure 8). But it is only the top of the morning, the beginning of the workday slope. Kat still has many productive hours ahead of her, and she must set aside her feelings of exhaustion to perform effectively in her role.
Figure 8. The Cost‑Conscious Commuter’s morning commuteNote: This data was constructed based on findings from the StatsCan, 2011 Commuting Survey on commute duration.
Kat braves the type of commute that many work hard to avoid for one principal reason: it is the least expensive. From her home in Markham to her office in the downtown Toronto core, she spends roughly $1,600 per year on commuting, which covers the cost of a Presto Pass.48 Were Kat to drive to her office daily, she would spend upward of seven times her current expense, an estimated $12,000 on commuting alone.49, 50
Although Kat would much prefer a faster commute, with a tight personal budget, this is not a reality for her and her family. So instead, Kat sacrifices her time, and to a certain extent, her flexibility, to save funds.
What does the discourse miss? The number of transfers required in Kat’s commute are substantial. Kat could theoretically shave one and a quarter hours off her daily total commute if she took a direct route to the GO Station. While York Region recognizes the need to help commuters like Kat reduce first‑ and last‑mile transit, existing and proposed solutions are divorced from Kat’s experience. Specifically, the Region is focused on increasing bicycle and car parking near transit hubs.51 As Kat lives in a very geographically sprawled area of the suburbs, cycling to the Go Station is not an option—especially during the winter months!
11 min.
5:35 a.m.
Board YRT bus Transfer YRT bus Arrive atGO station
5:46 a.m. 6:04 a.m.
DepartGO station
6:13 a.m.
52 min.8 min.
7:13 a.m.
Arrive at Union
7:05 a.m.
9 min.
37 km 1 hour and 53 minutes

21
Changing directions | All aboard
What can businesses do? To help Kat, her employer could organize carpooling between her location and the GO Station, allowing her to reduce her travel time. They could also consider subsidized Uber credits to shorten the first mile of her journey. Lastly, given the changing nature of work, it might be possible for Kat’s employer to leverage new technologies to alleviate her need to be physically in the office each day, perhaps through a compressed work week arrangement.
Case Study: Altamonte Springs Running through the heart of Altamonte Springs is the SunRail, a new, multi‑line commuter rail system that spans the entirety of Central Florida. Since its inception in 2014, SunRail ridership has been disappointingly low, especially in the Orlando suburb of Altamonte Springs. In diagnosing the issue of ridership, Altamonte Springs found that the majority
of commuters felt the process of actually getting to the SunRail station was too onerous; instead of taking a bus to the SunRail, it would be both easier and faster to skip both and drive to ones’ intended destination.52
In response to commuters, the City of Altamonte Springs began piloting an Uber subsidy program in March 2016, in which the city subsidizes 20 percent of the cost of every trip beginning and ending within city limits—25 percent if the trip begins or ends at a SunRail station.53
In the first six weeks of this program, SunRail ridership in Altamonte increased 10‑fold.54 Further, in using ride sharing to provide last‑mile transit, the City of Altamonte avoided the need to make large, capital expenditures on infrastructure. According to the mayor of Altamonte, “[the Uber subsidy program] is infinitely cheaper than the alternatives.”55
Considerations for the GTA This solution addresses a critical issue in the GTA’s transportation network—first‑ and last‑mile transit. Instead of continuing to develop major, multi‑year capital projects, such as the TTC York‑Spadina extension, the GTA could consider expanding the reach of the transit system through non‑traditional channels. Would the GTA’s Cost‑Conscious Commuters consider paying a slight premium for on‑demand transportation to the GO Station?

Changing directions | All aboard
22
As these archetypes illustrate, the commuting experience in the GTA is diverse. It is also complex: citizens make their commuting decisions by delicately balancing a variety of needs—to be productive, to maintain a budget, to be efficient, to make time for their families and friends.
This diversity and complexity is not being addressed by a transportation system that focuses primarily on ‘one‑size‑fits‑all’, large scale, multi‑year capital projects. Commuters in the GTA need comprehensive, and holistic, solutions that both start and end with them.
Figure 9. Forecast of new vehicle sales distribution Source: The Future of Mobility: What’s Next?, Deloitte, 2015
Perc
enta
ge o
f new
veh
icle
sal
es
2020 2025 2030 20402035
Personally owned autonomous
Shared autonomous
Personally owned driver-driven
Shared driver-driven

23
Changing directions | Rearview mirror
Rearview mirrorToronto is a world‑class city, but the debate on regional congestion does not consider commuters’ needs sufficiently to have the impact desired. It is no longer enough to simply build more lanes, or add more trains. Employers and transportation stakeholders in the GTA must expand their perspective to consider commuting for what it really is—an individual process of moving between home and work. Understanding this relationship is a critical first step in developing better commuting solutions that go beyond public transportation. This is true now more than ever, as the ways in which people live and work in the GTA is changing at an exponential rate.
Over the next thirty years, it is projected that the GTA will create approximately one million new jobs, the majority of which will reside in buildings that do not yet exist.56 Further, many of these jobs will not be confined to a corporate location at all, but will instead be accessed and performed remotely. This new world of work, characterized by individual empowerment, will require employers to abandon the traditional, one‑size‑fits‑all working model in favor of flexible operations that can be tailored to address the diverse needs of individuals.57
Why don’t we use a similar lens for thinking about commuting in the GTA?
The ways in which people live and work in the GTA is only going to become more diverse. From Cost‑Conscious Commuters to Environmental Evangelists, our solutions must acknowledge the diversity that exists in the GTA and place the needs of individuals at the forefront.
Many of the same macro forces that are changing how we live and work, such as technological advancements, will change how we commute. By the year 2030, it is expected that 30 percent of total vehicles sold will be autonomous. Another 40 percent will be utilized for ride‑sharing (Figure 9).58 With the advent of “connected car” technologies and the proliferation of app‑based ride‑sharing platforms, the commuting discourse in the GTA faces further complexities to an already challenging problem. However, by reorienting the discussion back to how people work and live, these impending technological disruptions pose great opportunity to engage new strategies for easing commuter woes.
Before we can begin to react to these trends and changes, we must first adapt our perspective. If we can change how we approach the commuting conversation and remember that these issues are always and only about the people, then the chances of solving the regional congestion issues and building effective solutions for the future increase dramatically.
To address commuter woes, we need to expand the conversation beyond "transportation infrastructure" to facilitate a stronger partnership between governments, employers, developers, and commuters themselves.
It’s time to change the conversation.

This page has been intentionally left blank.
24

This page has been intentionally left blank.
25

Changing directions | Endnotes
26
Endnotes
1. Dobson, Iain, Glenn Miller, Katherine Morton, Yousaf Shah, Charissa Jattan, and Kailey Lamont. "A Region in Transition." STRATEGIC REGIONAL RESEARCH (2013). CBC.ca. Canadian Broadcasting Corporation, Jan. 2013. Web. 4 Aug. 2016. <http://www.cbc.ca/toronto/features/stuckintraffic/docs/transition.pdf>.
2. Ibid.
3. Ibid.
4. Ibid.
5. Miller, Glenn R., Iain Myrans, Juan Carlos Molina, Thomas Sullivan, Danielle Berger, and Mike Dror. "The New Geography of Office Location and the Consequences of Business as Usual in the GTA." Toronto Office Coalition (2011) Toronto.ca. Canadian Urban Institute, Mar. 2011. Web. 8 Aug. 2016. <http://www.toronto.ca/legdocs/mmis/2012/pg/bgrd/backgroundfile‑43264.pdf>.
6. Ovsey, Dan. "More Canadians Likely to 'job Hop' to Find Perfect Position, Leave Jobs after Two Years: Poll." Business.financialpost.com. Financial Post, 17 Apr. 2014. Web. 10 Aug. 2016. <http://business.financialpost.com/executive/careers/more‑canadians‑likely‑to‑job‑hop‑to‑find‑perfect‑position‑leave‑jobs‑after‑two‑years‑poll>.
7. "Market Watch." 436.7047 (2005): 23. Trebhome.com. Toronto Real Estate Board, Aug. 2016. Web. 26 Aug. 2016. <http://www.trebhome.com/market_news/market_watch/2016/mw1608.pdf>.
8. Burda, Cherise. "2014 Home Location Preference Survey: Understanding Where GTA Residents Prefer to Live and Commute." (2014). RBC.com. The Royal Bank of Canada, Sept. 2014. Web. 27 July 2016. <http://www.rbc.com/community‑sustainability/_assets‑custom/pdf/RBC‑Pembina‑Home‑Location‑Preference‑Survey.pdf>.
9. Pastakia, Karen, and Stephen Harrington. "The Future of Work ‑ A Reorientation Guide." (2003): 151. Deloitte.com. Deloitte, 2015. Web. 12 July 2016. <http://www2.deloitte.com/content/dam/Deloitte/ca/Documents/human‑capital/ca‑en‑future‑of‑work.pdf>.
10. Caldow, Janet. "Working Outside the Box: A Study of the Growing Momentum in Telework." IBM.com. Institute for Electronic Government, IBM Corporation, 21 Jan. 2009. Web. 11 July 2016. <http://www‑01.ibm.com/industries/government/ieg/pdf/working_outside_the_box.pdf>.
11. Haugen, Tracy. "Workplaces of the Future: Creating an Elastic Workplace." (1998). Deloitte.com. Deloitte, 2013. Web. 13 July 2016. <http://www2.deloitte.com/content/dam/Deloitte/global/Documents/HumanCapital/dttl‑humancapital‑trends5‑workplaces‑no‑exp.pdf>.
12. Bourke, Juliet, Louise Mason, Michael Williams, Lino Caccavo, and Lynn Thompson. "It's (almost) All about Me: Workplace 2030, Built for Us." Deloitte.com. Deloitte, July 2013. Web. 22 July 2016. <http://www2.deloitte.com/content/dam/Deloitte/au/Documents/human‑capital/deloitte‑au‑hc‑diversity‑future‑work‑amp‑2013.pdf>.
13. Why Canadians Need a Workplace Strategy. Canada: Deloitte, 2015. Print.
14. Bourke, Juliet, Louise Mason, Michael Williams, Lino Caccavo, and Lynn Thompson. "It's (almost) All about Me: Workplace 2030, Built for Us." Deloitte.com. Deloitte, July 2013. Web. 22 July 2016. <http://www2.deloitte.com/content/dam/Deloitte/au/Documents/human‑capital/deloitte‑au‑hc‑diversity‑future‑work‑amp‑2013.pdf>.
15. Ibid.
16. Buelow, Darin, Thomas Hanszen, Mark Klender, Ken Meyer, Paul Gallagher, and Matt Szuhaj. "Advancing Workplace Strategies: Enabling Today's Mobile Workforce." Deloitte, 2015. Web. 12 July 2016. <http://www2.deloitte.com/content/dam/Deloitte/us/Documents/process‑and‑operations/us‑operations‑ss‑workplacestrategies‑061312.pdf>.
17. Pastakia, Karen, and Stephen Harrington. "The Future of Work ‑ A Reorientation Guide." (2003): 151. Deloitte.com. Deloitte, 2015. Web. 12 July 2016. <http://www2.deloitte.com/content/dam/Deloitte/ca/Documents/human‑capital/ca‑en‑future‑of‑work.pdf>.
18. Dobson, Iain, Glenn Miller, Katherine Morton, Yousaf Shah, Charissa Jattan, and Kailey Lamont. "A Region in Transition." STRATEGIC REGIONAL RESEARCH (2013). CBC.ca. Canadian Broadcasting Corporation, Jan. 2013. Web. 4 Aug. 2016. <http://www.cbc.ca/toronto/features/stuckintraffic/docs/transition.pdf>.
19. Greater Toronto Transportation Authority. "Costs of Road Congestion in the Greater Toronto and Hamilton Area: Impact and Cost Benefit Analysis of the Metrolinx Draft Regional Transit Plan." Metrolinx.com. Greater Toronto Transportation Authority, 2008. Web. 14th June 2016. <http://www.metrolinx.com/en/regionalplanning/costsofcongestion/ISP_08‑015_Cost_of_Congestion_report_1128081.pdf>.
20. CAA Driving Costs Calculator." CAA. N.p., n.d. Web. 10 Apr. 2016. <http://caa.ca/car_costs/>.
21. Redmond, Lothlorien S., and Patricia L. Mokhtarian. "The Positive Utility of the Commute: Modeling Ideal Commute Time and Relative Desired Commute Amount." EScholarship. University of California Transportation Center, 01 Jan. 2001. Web. 27 June 2016. <http://escholarship.org/uc/item/4mc291p2>.
22. Turcotte, Martin. "Like Commuting? Workers' Perceptions of Their Daily Commute." Statscan.gc.ca. Statistics Canada, 2011. Web. 9 June 2016. <http://www.statcan.gc.ca/pub/11‑008‑x/2006004/pdf/9516‑eng.pdf>.
23. "City of Toronto: Congestion Management Plan 2014‑2018." Toronto.ca. The City of Toronto Transportation Division, Oct. 2013. Web. 18 May 2016. <https://www1.toronto.ca/City%20Of%20Toronto/Transportation%20Services/TMC/Files/PDF/Congestion%20Management/Congestion%20Management.pdf>.
24. Turcotte, Martin. "Like Commuting? Workers' Perceptions of Their Daily Commute." Statscan.gc.ca. Statistics Canada, 2011. Web. 9 June 2016. <http://www.statcan.gc.ca/pub/11‑008‑x/2006004/pdf/9516‑eng.pdf>.
25. "Key Transport Statistics of World Cities." Journeys. Land Transport Authority. Government of Singapore, Nov. 2012. Web. 10 June 2016. <https://www.lta.gov.sg/content/ltaweb/en.html>.
26. Calimente, John. "Rail Integrated Communities in Tokyo." Journal of Transport and Land Use Spring 5.1 (2012): 19‑32. Web. 25 Aug. 2016.
27. "Japan's Platform‑Side Shopping Malls ‑ Making Japanese Stations More Than Just a Place to Catch a Train." Web Japan, Jan. 2011. Web. 17 Aug. 2016. <http://web‑japan.org/trends/09_lifestyle/lif110120.html>.
28. "City of Toronto: Congestion Management Plan 2014‑2018." Toronto.ca. The City of Toronto Transportation Division, Oct. 2013. Web. 18 May 2016. <https://www1.toronto.ca/City%20Of%20Toronto/Transportation%20Services/TMC/Files/PDF/Congestion%20Management/Congestion%20Management.pdf>.
29. "Key Findings: INRIX 2015 Traffic Scorecard." Inrix, 2015. Web. 11 July 2016. <http://inrix.com/scorecard/key‑http://inrix.com/scorecard/key‑findings‑us/‑us/>.
30. "Los Angeles Commuters to Usher in New Era of Daily Trip Planning." Xerox Newsroom. Xerox, 27 Jan. 2016. Web. 13 July 2016. <https://www.news.xerox.com/news/City‑of‑LA‑introduces‑new‑Xerox‑Go‑LA‑app>.
31. Delgadillo, Natalie. "This App Hopes to Help You Outsmart L.A. Traffic Jams." CityLab. The Atlantic, 01 Feb. 2016. Web. 18 July 2016. <http://www.citylab.com/navigator/2016/02/las‑transportation‑app‑could‑make‑a‑dent‑in‑traffic‑gola/435420/>.
32. Korosec, Kirsten. "Xerox Built the Ultimate Transportation App for Los Angeles." Fortune. 27 Jan. 2016. Web. 18 July 2016. <http://fortune.com/2016/01/28/xerox‑los‑angeles‑traffic/>.

27
Changing directions | Endnotes
33. "TTC Prices." Toronto Transit Commission. 3 Jan. 2016. Web. 29 June 2016. <https://www.ttc.ca/Fares_and_passes/Prices/index.jsp>.
34. "Toronto Transit Commission Five‑Year Corporate Plan 2013‑2017." Toronto Transit Commission, 2013. Web. 26 May 2016. <https://www.ttc.ca/PDF/TTC_Corporate‑Plan_Accessible_v2.pdf>.
35. "2016 Customer Charter." Toronto Transit Commission. Web. 26 Aug. 2016. <https://www.ttc.ca/Customer_Service/Customer_Charter/2016_Charter.jsp>.
36. "2016 Ridership Update." Toronto Transit Commission. 11 July 2016. Web. 28 July 2016. http://www.ttc.ca/About_the_TTC/Commission_reports_and_information/Commission_meetings/2016/July_11/Reports/3_2016_Ridership_Update.pdf>.
37. Spurr, Ben. "TTC Chief Won't Endorse 'unpalatable' Budget Cuts." Thestar.com. Toronto Star, 03 Aug. 2016. Web. 05 Aug. 2016. <https://www.thestar.com/news/gta/2016/08/03/ttc‑chief‑wont‑endorse‑unpalatable‑budget‑cuts.html>.
38. Block, Sheila. "TTC Needs More Revenue, Not Massive Cuts." Thestar.com. Toronto Star, 07 Aug. 2016. Web. 08 Aug. 2016. <https://www.thestar.com/opinion/commentary/2016/08/07/ttc‑needs‑more‑revenue‑not‑massive‑cuts.html>.
39. "Seoul Public Transportation." Seoul.go.kr. Seoul Metropolitan Government, 2014. Web. 12 July 2016. <http://citynet‑ap.org/wp‑content/uploads/2014/06/Seoul‑Public‑Transportation‑English.pdf>.
40. Shu, Les. "From Maglev Trains to Electric Ferries, the Best High‑tech Transit around the World." Digital Trends. Digital Trends, 26 June 2015. Web. 12 July 2016. <http://www.digitaltrends.com/cool‑tech/the‑best‑public‑transit‑around‑the‑world/>.
41. Sun‑Woong, Kim. "Seoul Subway World’s 3rd Largest in Ridership." The Korea Times. 14 May 2010. Web. 12 July 2016. <http://www.koreatimes.co.kr/www/news/biz/2010/06/291_65888.html>.
42. "Seoul Public Transportation." Seoul.go.kr. Seoul Metropolitan Government, 2014. Web. 12 July 2016. <http://citynet‑ap.org/wp‑content/uploads/2014/06/Seoul‑Public‑Transportation‑English.pdf>.
43. Sun‑Woong, Kim. "Seoul Subway World’s 3rd Largest in Ridership." The Korea Times. 14 May 2010. Web. 12 July 2016. <http://www.koreatimes.co.kr/www/news/biz/2010/06/291_65888.html>.
44. Spurr, Ben. "New Plan Would Add 525 Km of Bike Routes to Create a True Toronto Network." Thestar.com. Toronto Star, 10 May 2016. Web. 19 July 2016. <https://www.thestar.com/news/gta/
transportation/2016/05/09/new‑plan‑would‑add‑525‑km‑of‑bike‑routes‑to‑create‑a‑true‑toronto‑network.html>.
45. "San Jose Bike Plan 2020." San José Bike Plan 2020. The City of San Jose. 2009. Web. 19 July 2016. <http://www3.sanjoseca.gov/clerk/Agenda/20091117/20091117_0602att.pdf>.
46. Brewster, Steven. "Public Invited to Recommend New San Jose Bike Stations Via Online Portal." Sanjoseinfo.org. The City of San Jose Department of Trasnportation, 24 June 2015. Web. 19 July 2016. <http://www.sanjoseinfo.org/go/doc/1914/2551502/Public‑Invited‑to‑Recommend‑New‑San‑Jos‑Bike‑Share‑Stations‑Via‑Online‑Portal>.
47. Berg, Nate. "Making City Biking Less Scary." Citylab.com. The Atlantic, 10 Aug. 2012. Web. 19 July 2016. <http://www.citylab.com/commute/2012/08/making‑city‑biking‑lessscary/>.
48. "PRESTO in York Region." Yrt.ca. York Region Transit, Web. 8 Aug. 2016. <http://www.yrt.ca/en/farespasses/presto.asp>.
49. Marr, Garry. "Buying a Condo? Maybe You Should Get the Parking Spot Too." Financial Post Buying a Condo Maybe You Should Get the Parking Spottoo Comments. Financial Post, 24 June 2015. Web. 21 July 2016. <http://business.financialpost.com/personal‑finance/mortgages‑real‑estate/buying‑a‑condo‑maybe‑you‑should‑get‑the‑parking‑spot‑too>.
50. "CAA Driving Costs Calculator." CAA. Web. 10 Apr. 2016. <http://caa.ca/car_costs/>.
51. "Transportation Master Plan." York Region Transit, Dec. 2015. Web. 27 July 2016. <https://www.york.ca/wps/wcm/connect/yorkpublic/fb55b912‑7875‑4487‑896d‑b6b8eabafc24/York+Region+TMP+Boards+3+Accessible.pdf?MOD=AJPERES>.
52. Comas, Martin E. "5 Cities Team up to Help Residents Ride SunRail." OrlandoSentinel.com. 20 May 2016. Web. 02 Aug. 2016. <http://www.orlandosentinel.com/news/sunrail/os‑sunrail‑ridership‑cities‑uber‑20160520‑story.html>.
53. "Uber and Altamonte Springs Launch Pilot Program to Improve Transportation Access." Uber Newsroom. Uber, 21 Mar. 2016. Web. 04 Aug. 2016. <https://newsroom.uber.com/us‑florida/altamonte‑springs/>.
54. McDaniel, Dave. "More Cities Teaming with Uber to Get Riders to SunRail Stations." WESH Orlando, 20 May 2016. Web. 04 Aug. 2016. <http://www.wesh.com/article/more‑cities‑teaming‑with‑uber‑to‑get‑riders‑to‑sunrail‑stations‑1/4449682>.
55. Reuters. "First City In the Nation Plans to Subsidize Uber Rides." Fortune. N.p., 02 Mar. 2016. Web. 03 Aug. 2016. <http://fortune.com/2016/03/03/uber‑subsidy‑public‑transportation/>.
56. Dobson, Iain, Glenn Miller, Katherine Morton, Yousaf Shah, Charissa Jattan, and Kailey Lamont. "A Region in Transition." STRATEGIC REGIONAL RESEARCH (2013). CBC.ca. Canadian Broadcasting Corporation, Jan. 2013. Web. 4 Aug. 2016. <http://www.cbc.ca/toronto/features/stuckintraffic/docs/transition.pdf>.
57. Bourke, Juliet, Louise Mason, Michael Williams, Lino Caccavo, and Lynn Thompson. "It's (almost) All about Me: Workplace 2030, Built for Us." Deloitte.com. Deloitte, July 2013. Web. 22 July 2016. <http://www2.deloitte.com/content/dam/Deloitte/au/Documents/human‑capital/deloitte‑au‑hc‑diversity‑future‑work‑amp‑2013.pdf>.
58. Corwin, Scott, Nick Jameson, and Philipp Willingmann. "The Future of Mobility: What's Next?" Dupress.deloitte.com. Deloitte, 2016. Web. 04 Aug. 2016. <http://dupress.deloitte.com/content/dam/dup‑us‑en/articles/3367_Future‑of‑mobility‑whats‑next/DUP_Future‑of‑mobility‑whats‑next.pdf>.

Changing directions | Acknowledgements
28
Acknowledgements
The Future of Canada Centre within Deloitte Canada gratefully acknowledges the support of those who contributed to the research for this report, including Melissa Maduri, Jennifer Littleton, Nicholas Fulford, Paul Bien, Rachael DiMenna, and Matthew Schafler.

This page has been intentionally left blank

Canada at 175 refers to Deloitte’s vision for the future of our nation’s prosperity by July 1, 2042. With the 150th anniversary of confederation on the horizon, now is the time for Canada to redefine what it means to be a global leader.
Our ambition as a nation must be bolder—we must aim to not only achieve economic prosperity, but to elevate our quality of life for our vast and diverse population.
Deloitte's vision is that Canada should rank among the top three countries on the Human Development Index within the next 25 years. To do so, we must adopt an unrelenting commitment to developing courageous leaders who embody an inclusive way of being.
deloitte.ca
Deloitte, one of Canada’s leading professional services firms, provides audit, tax, consulting, and financial advisory services. Deloitte LLP, an Ontario limited liability partnership, is the Canadian member firm of Deloitte Touche Tohmatsu Limited.
Deloitte refers to one or more of Deloitte Touche Tohmatsu Limited, a UK private company limited by guarantee, and its network of member firms, each of which is a legally separate and independent entity. Please see www.deloitte.com/about for a detailed description of the legal structure of Deloitte Touche Tohmatsu Limited and its member firms.
© Deloitte LLP and affiliated entities.Designed and produced by the Deloitte Design Studio, Canada. 16‑4365T