changes of phenolic secondary metabolite profiles in the ... · original article changes of...
TRANSCRIPT
ORIGINAL ARTICLE
Changes of phenolic secondary metabolite profiles in the reactionof narrow leaf lupin (Lupinus angustifolius) plants to infectionswith Colletotrichum lupini fungus or treatment with its toxin
Anna Wojakowska • Dorota Muth •
Dorota Naro _zna • Cezary Madrzak •
Maciej Stobiecki • Piotr Kachlicki
Received: 27 July 2012 / Accepted: 15 October 2012 / Published online: 30 October 2012
� The Author(s) 2012. This article is published with open access at Springerlink.com
Abstract Plant interactions with environmental factors
cause changes in the metabolism and regulation of bio-
chemical and physiological processes. Plant defense
against pathogenic microorganisms depends on an innate
immunity system that is activated as a result of infection.
There are two mechanisms of triggering this system: basal
immunity activated as a result of a perception of microbe-
associated molecular patterns through pattern recognition
receptors situated on the cell surface and effector-triggered
immunity (ETI). An induced biosynthesis of bioactive
secondary metabolites, in particular phytoalexins, is one of
the mechanisms of plant defense to fungal infection.
Results of the study on narrow leaf lupin (Lupinus angus-
tifolius L.) plants infected with the anthracnose fungus
Colletotrichum lupini and treated with fungal phytotoxic
metabolites are described in the paper. The C. lupini phy-
totoxins were isolated from liquid cultures, purified and
partially characterized with physicochemical methods.
Accumulation of secondary metabolites on leaf surface and
within the tissues of plants either infected, treated with the
fungal phytotoxin or submitted to both treatments was
studied using GC-MS and LC-MS, respectively. Sub-
stantial differences in isoflavone aglycones and glycocon-
jugate profiles occurred in response to different ways of
plant treatment.
Keywords Colletotrichum lupini � Elicitor � Flavonoids �Infection � Liquid chromatography/Mass spectrometry �Lupinus angustifolius � Secondary metabolite profiling
1 Introduction
Flavonoids and their conjugates play an important role in
Fabaceae family plants (Gould and Lister 2006). Among
other functions, they are defense secondary metabolites
synthesized as the result of fungal infection or stresses of
other kinds (Bednarek et al. 2003; Lozovaya et al. 2004;
Farag et al. 2008, Schliemann et al. 2008; Jasinski et al.
2009). Many classes of these polyphenolic metabolites
have an antibiotic activity during plant interactions with
pathogenic microorganisms (Dixon and Paiva 1995;
Treutter 2006), and these compounds play the roles of
phytoalexins or phytoanticipins in plant tissues (van Etten
et al. 1994).
Plant defense against pathogenic microorganisms
depends on an innate immunity system that is activated as
the result of infection. There are two mechanisms of trig-
gering this system: basal immunity activated as a result of
microbe-associated molecular patterns (MAMPs) being
perceived through pattern recognition receptors (PRR)
situated on the cell surface and effector-triggered immunity
Electronic supplementary material The online version of thisarticle (doi:10.1007/s11306-012-0475-8) contains supplementarymaterial, which is available to authorized users.
A. Wojakowska � D. Muth � M. Stobiecki (&)
Institute of Bioorganic Chemistry PAS, Noskowskiego 12/14,
61-704 Poznan, Poland
e-mail: [email protected]
D. Naro _zna � C. Madrzak
Department of Biochemistry and Biotechnology, Faculty
of Agronomy, Poznan University of Life Science, ul. Wojska
Polskiego 28, 60-637 Poznan, Poland
P. Kachlicki (&)
Institute of Plant Genetics PAS, Strzeszynska 34,
60-479 Poznan, Poland
e-mail: [email protected]
123
Metabolomics (2013) 9:575–589
DOI 10.1007/s11306-012-0475-8

(Boller and Felix 2009). The effector-triggered immunity,
sometimes called gene-for-gene resistance, often leads to
hypersensitive response of plants and formation of necrotic
spots around the infection site due to the programmed cell
apoptosis. Effectors of microbial origin, that modulate the
plant response to infection, are mainly proteins or peptides,
but in some circumstances, low-molecular-weight natural
products may also play this role (Wolpert et al. 2002;
Allwood et al. 2008; Boller and He 2009; Bednarek and
Osbourn 2009; Djamei et al. 2011). Different compounds
synthesized by pathogenic microorganisms (e.g. phyto-
toxins) or being products of pathogen or plant cell degra-
dation are recognized by plant cells as signals for the onset
of infection or its danger. Such anticipation of infection is
called the defense priming (Conrath 2011) and it has been
found to be inherited in the progeny of the infected plant
(Luna et al. 2012). Plant reactions on the biochemical or
physiological level and activation of various metabolic
pathways depend on the type and origin of these signaling
natural products. Different secondary metabolites are syn-
thesized after perception and recognition of the signals
originating from plant or pathogenic microorganism elici-
tors created during the first steps of plant defense reactions
(Boller and Felix 2009; Grotewold 2005; Veitch 2009).
Biosynthesis of isoflavone and closely related pterocarpan
phytoalexins by plants from the Fabaceae family is of
interest in this respect. Medicarpin synthesized by plants
from the Medicago species, pisatin in Pisum or glyceollins
in soybean (Glycine max), and luteone and wighteone in
Lupinus are among the best characterized compounds.
Problems connected with various responses of the plant
to different elicitors were widely described in the case of
Medicago truncatula, the Fabaceae model plant. The yeast
extract elicitor and methyl jasmonate, the wound-signaling
natural product, were used to create specific responses in
the cell cultures. Quantitative and qualitative changes of
isoflavones and their glycoconjugates as well as substantial
differences at the transcriptional level were observed in the
treated cultures (Broeckling et al. 2005; Suzuki et al. 2005;
Naoumkina et al. 2007; Farag et al. 2008). It was also
demonstrated that various classes of flavonoids play dif-
ferent roles during the symbiotic interaction of M. trun-
catula plants with the nodule-forming rhizobia (Zhang
et al. 2009).
Colletotrichum is a genus of plant pathogenic fungi that
causes anthracnose disease of various plant species. The
taxonomy of this genus is still not clear and about 60
species are classified within it at present (Kirk et al. 2008);
however, the Index Fungorum (www.indexfungorum.org)
lists 711 names of its species and subspecies. C. lupini,
specific for lupin plants (Nirenberg et al. 2002), is wide-
spread on all continents and has been detected in Poland
since 1995 (Frencel 1998). Colletotrichum spp. are known
to produce phytotoxic secondary metabolites (Garcıa-Pajon
and Collado 2003; Mancilla et al. 2009) that, in many
cases, induce symptoms on plants similar to those caused
by the fungi themselves.
Profiles of isoflavone glycoconjugates, free isoflavone
aglycones and phytoalexins in leaves of lupin plants treated
with fungal phytotoxic secondary metabolites, plants
infected with C. lupini fungus, and plants submitted
successively to both treatments are compared in this study.
The C. lupini phytotoxic metabolites were isolated and
partially purified from the fungus liquid culture medium
and either sprayed on the lupin plantlets or placed on the
surface of wounded leaves with a microsyringe. Profiles of
the target flavonoids and their glycoconjugates present
inside of plant tissues or exuded to the cuticular layer were
recorded with LC-MS and GC-MS systems, respectively.
Numerous natural products were recognized unambigu-
ously after comparison of the retention times (RT) and
mass spectra of the compounds with those registered for
standards. On the other hand, some compounds were only
tentatively identified on the basis of the mass spectra recor-
ded during the performed HPLC-ESI/MS/MS analyses, in
which MS2 and pseudo-MS3 experiments were applied for
structural characterization of the natural products.
2 Materials and methods
2.1 Reagents and standards
Solvents for extraction and LC-MS analyses (methanol,
acetonitrile and deionized water) were HPLC or LC-MS
grade; derivatization reagents for GC-MS analyses
(MSTFA—N-methyl-N-(trimethylsilyl)trifluoroacetamide,
methoxylamine, pyridine) were purchased from Sigma-
Aldrich (Poznan, Poland). Standards of luteolin and iso-
flavone aglycones were obtained from Extrasynthese
(Genay, France) or were isolated from lupins and charac-
terized with different physico-chemical methods in the
Laboratory (Franski et al. 1999a, b).
2.2 Plant material
Four cultivars of narrow leaf lupin (L. angustifolius L.) were
used in experiments (sweet cultivars—Baron, Sonet, and
bitter—Karo, Mirela). The seeds were purchased from the
Plant Breeding Station Przebedowo, Poland. They were
sterilized with 1.5 % potassium hypochlorite for 20 min,
washed several times with sterile deionized water and sown
in pots with Perlite. Plants (five seedlings per pot) were
grown in a greenhouse with controlled temperature
(22/18 �C day/night) and light (16/8 h photoperiod) for
2 weeks.
576 A. Wojakowska et al.
123

2.3 Colletotrichum lupini cultures and growth
The fungus C. lupini (isolate Col2) was isolated from
anthracnose-diseased white lupin (L. albus L.) plants in
Przebedowo, Poland, in 1998 and maintained in the fungal
collection of the Institute of Plant Genetics, Polish Acad-
emy of Sciences. It has been identified according to
Nirenberg et al. (2002). Conidial spores of the fungus were
placed in a Petri dish with potato dextrose agar (PDA)
medium and incubated at 28 �C for 3 weeks. Spores were
collected by flooding the plate with sterile 0.1 % (v/v)
Tween 20 solution, followed by filtration to remove parts
of the mycelium. Spore concentrations were determined by
counting and a suspension of 2 9 106 spores per ml was
used for spraying the plants.
2.4 Isolation and purification of C. lupini phytotoxic
metabolites
Colletotrichum lupini was grown on the modified Fries
medium placed in Roux bottles (120 bottles, 200 ml of
medium in each) at room temperature for 3 weeks. The
culture was filtrated and the filtrate was vacuum-evapo-
rated to about 1.5 l. Secondary metabolites were extracted
4 times with 0.5 l portions of ethyl acetate. The combined
organic phases were evaporated to dryness and the residue
was re-dissolved in a small volume of 25 % methanol–
water solution. This solution was applied to a reversed-
phase C18 flash chromatography column 1.5 9 85 cm
(Sigma-Aldrich, Poznan, Poland). The column was eluted
with methanol–water solutions with methanol contents
increasing stepwise from 25 to 65 %. Fractions of the
eluate (25 ml) were collected and a 5 ll sample from each
fraction was spotted onto needle-punctured white and
narrow leaf lupin (L. albus cv. Wat and L. angustifolius cv.
Sonet) leaves for the phytotoxicity tests. Fractions con-
taining phytotoxic compounds (causing the development of
necrotic spots, eluted with 55 % methanol) were submitted
to HPLC-MS analysis and to the preparative HPLC in an
attempt to achieve pure phytotoxins. A solution containing
1 mg/ml of the mixture of the phytotoxic compounds in
10 % methanol was prepared and used for plant elicitation.
Attempts for the structural studies of the above natural
products with physicochemical methods (mass spectrome-
try (MS), UV spectrophotometry, 1H, 13C NMR and cor-
relation COSY, NOESY, HMBC, HSQC spectra) only
allowed partial characterization of these compounds.
2.5 Infection of lupin seedlings with C. lupini
and elicitation with fungal toxin
Lupin plants (L. angustifolius) were grown in a greenhouse
in pots with perlite, five seedlings per pot for 2 weeks.
2.5.1 Experiment 1
The plants at the two-leaf stage (2 weeks after germina-
tion) were infected with spores of C. lupini by spraying of
whole plants with the spore suspension (2 9 106 spores/ml,
approximately 5 ml/plant), control plants were sprayed
with sterile water. Seedlings were placed in hoods in order
to maintain the humidity as high as possible for 24 h to
initiate the infection process and, thereafter, the humidity
was maintained at 70 %. Leaves were collected 24, 48, 96,
168, and 264 h after the infection, immediately frozen in
liquid nitrogen, and kept at -80 �C until the analysis.
Three independent inoculation experiments have been
performed and the first symptoms of anthracnose were
visible 7 days after the inoculation.
2.5.2 Experiment 2
The plants at the two-leaf stage were also elicited with
phytotoxic secondary metabolites of C. lupini using two
different methods. In the first experiment (‘‘elicitation 1’’—
E1), 10 ll samples of the toxin solution (1 mg/ml in 10 %
methanol) were spotted on leaves of the first level of
seedlings wounded with a needle. The control plants were
wounded and similarly treated with 10 % methanol. For the
estimation of the wounding effect, untreated leaves of lupin
seedlings were sprayed with 10 % methanol and collected
at the same time points. Leaves of different ages (from two
levels) were collected separately in three repetitions at
various time points. Each repetition consisted of material
from three seedlings grown in different pots in order to
minimize the influence of the biological diversity. Leaves
were collected 12, 24, and 48 h after the treatment. The
second method of elicitation (‘‘elicitation 2’’—E2)
involved spraying of whole plants with the fungal toxin
solution (100 lg/ml solution in 10 % methanol, approxi-
mately 2 ml per plant), control plants were sprayed
with 10 % methanol. Leaves were collected after 12, 24,
and 48 h.
2.5.3 Experiment 3
The last experiment was based on plants at the two-leaf
stage sprayed with the C. lupini phytotoxic metabolites
and, after 48 h, submitted to inoculation with the fungal
spores. In this experiment, four types of samples were
analyzed: samples from the control plants (sprayed with
water or 10 % MeOH and not inoculated with fungal
spores); plants sprayed with the phytotoxins and not
infected with the spores; plants subjected to infection
without previous elicitation with the phytotoxin; plants
subjected to both elicitation and infection. Leaves were
collected from plants 216 h after the elicitation and 168 h
Secondary metabolite profiles after fungal infections 577
123

after the infection with spores. The plant material was
frozen in liquid nitrogen directly after cutting and stored at
-80 �C until the extraction.
2.6 Extraction of phenolic secondary metabolites
from plant tissues
Extractions of phenolic secondary metabolites from green
parts of the lupin plants were done in two independent
ways. For the LC-MS analysis, the frozen leaves (100 mg
fresh weight) were homogenized in 2 ml of 80 % methanol
(ball mill MM200, Retsch, Haan, Germany), and the sus-
pension was placed in an ultrasonic bath for 30 min.
Luteolin was added to the homogenates as an internal
standard. The extracts were centrifuged and the superna-
tants were transferred to new screw-cupped tubes. The
solvent was removed in a vacuum concentrator at room
temperature (Savant SPD 121P, Thermo Electron Corpo-
ration, Waltham, USA). Samples were dissolved in 300 ll
of 80 % methanol in water and centrifuged at 10,000 rpm
for 10 min, transferred to autosampler vials and immedi-
ately subjected to LC-MS analyses.
For GC-MS analysis of compounds present on lupin leaf
surface, green parts of lupin plants (five plants for each
sample) were washed with 100 ml of CH2Cl2 for 20 s. The
washing time was optimized to avoid damage of the cells,
causing a leakage of cytosolic compounds that occurred
with a prolonged action of the organic solvent. Collection
of surface compounds was done at different time points
after elicitation or infection. The obtained solutions were
evaporated, then the sample was dissolved in 2 ml of
CH2Cl2 and the volume corresponding to 2 mg of the
original dry weight from the each sample was transferred to
the Teflon-lined screw-capped vials and taken for further
GC-MS analysis. Ribitol (20 ll of methanol solution at a
concentration of 1 mg/ml) was added to each sample as an
internal standard and a two-stage chemical derivatization
procedure was performed. Forty ll of O-methylhydroxyl-
amine hydrochloride solution in pyridine (20 mg/ml) was
added to the sample and heated at 40 �C for 90 min fol-
lowed by addition of 70 ll MSTFA (N-acetyl-N-(trimeth-
ylsilyl)-trifluoroacetamide) and heating at 37 �C for
30 min. The sample was centrifuged at 10,000 rpm for
10 min, transferred to autosampler glass vials and sub-
jected to the GC-MS analyses. Two biological samples
were collected from each object and two independent
extracts were prepared and analyzed for each sample.
2.7 Gas chromatography/mass spectrometry
GC-MS analyses of leaf surface compounds were per-
formed with Agilent 6890 N gas chromatograph with a
7683 autosampler (Agilent Technologies, Stockport, UK)
equipped with a DB-5 column (30 m 9 0.25 mm i.d., film
thickness 0.25 lm) from J&W Scientific Co. (USA) and
coupled to the time-of-flight mass spectroscope (MS-ToF)
analyzer from Waters. Helium was used as the carrier gas
at a flow rate of 1 ml/min. The GC oven temperature
program was as follows: 2 min at 70 �C, raised by 10 �C/
min to 300 �C, and held for 15 min at 300 �C. The total
analysis time was 45 min. The injector temperature was
250 �C and 50 % of the recovered vapor was passed into
the chromatography column (split 50). The interface tem-
perature was 230 �C and source temperature was 250 �C.
In-source fragmentation was performed with 70 eV energy.
Mass spectra were recorded in the 50–650 m/z range and
data were analyzed using the Waters MassLynx ver. 4.1.
2.8 Liquid chromatography/mass spectrometry
Laboratory procedures for the extraction and analysis of
secondary metabolites have been well established in our
laboratory (Muth et al. 2008, 2009; Jasinski et al. 2009) and
are described in details in the Supporting Information.
2.9 PCR analysis
Total RNA was isolated from lupin leaves using SV Total
RNA Isolation System (Promega) according to the manu-
facturer recommendations. The RNA concentration in each
sample was measured using the Nanodrop 2000 spectro-
photometer at 260 nm. Reverse transcription was per-
formed with 2 lg of the total RNA used as the template
with Verte M-MLV reverse transcriptase (Novazym) in
20 ll reaction mixture with oligo-dT primers. Following
the reverse transcription, PCR amplification of cDNA was
performed with 1 ll of the above reaction mixture, which
was used as the template in the GenAmp PCR System 9700
(Applied Biosystem).
The PCR amplifications of the chalcone synthase (CHS),
chalcone isomerase (CHI), phenylalanine-ammonia lyase
(PAL), isoflavone synthase (IFS) and actin-encoding
sequences were performed with primers listed below in the
25 ll reactions carried out for 25 cycles with Allegro Taq
Polymerase DNA (Novazym). The annealing temperatures
were: 52 �C for the CHS and IFS, and 56 �C for the PAL
and actin primers. The PCR products were analyzed using
the agarose gel electrophoresis.
The sequences of the primers:
CHS F 50-ATCCTGATTTCTACTTCAGA-30
CHS R 50-GGTGCCATATAAGCACAAA-30
PAL F 50-CCAAGTCAATTGAGAGGGAG-30
PAL R 50-CATCTTGGTTGTGCTGCTC-30
actin F 50- GCATTGTTGGTCCTCCTCG-30
actin R 50-TGTGCCTCATCCCCAACATA-30
578 A. Wojakowska et al.
123
IFSR 50-CACAACAAGACCCTTGATT-30
IFSF 50-GGACCTTACTGGAAGTTCAT-30
2.10 Data analysis
The analysis was done independently for the chosen sec-
ondary metabolites and was based on differences observed
in LC-MS and/or GC-MS profiles registered between the
treated and control plants. Baseline correction and align-
ment of all extracted mass peaks across all LC-MS anal-
yses were done in MetAlign, developed by RIKILT
(Institute of Food Safety, Wageningen University and
Research Centre) and provided at www.metlign.wur.nl
(Lommen 2009). Statistical analyses were carried out using
the Microsoft Excel and MarkerLynx (Waters) was used
for the GC-MS results.
3 Results and discussion
3.1 Characterization of C. lupini phytotoxic secondary
metabolites
Colletotrichum lupini secondary metabolites extracted
from the liquid culture medium were submitted to
reversed-phase C18 flash column chromatography. In order
to monitor phytotoxic fungal metabolites, the column elu-
ate was spotted on leaves of L. angustifolius and L. albus
plants. Fractions eluted with 55 % methanol caused the
development of necrotic spots appearing on the leaf surface
several hours after the application (Figure S1). The HPLC
analysis of these fractions revealed the presence of multiple
compounds with identical UV absorbance spectra consist-
ing of a single maximum of absorbance at 270 nm.
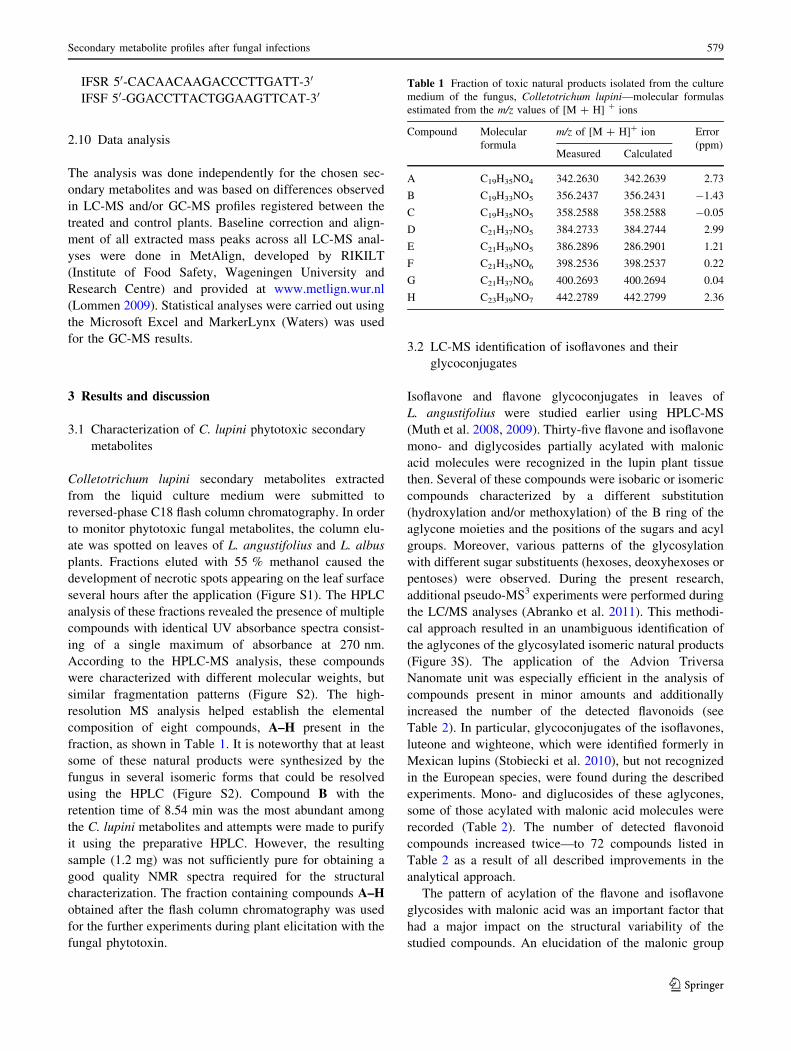
According to the HPLC-MS analysis, these compounds
were characterized with different molecular weights, but
similar fragmentation patterns (Figure S2). The high-
resolution MS analysis helped establish the elemental
composition of eight compounds, A–H present in the
fraction, as shown in Table 1. It is noteworthy that at least
some of these natural products were synthesized by the
fungus in several isomeric forms that could be resolved
using the HPLC (Figure S2). Compound B with the
retention time of 8.54 min was the most abundant among
the C. lupini metabolites and attempts were made to purify
it using the preparative HPLC. However, the resulting
sample (1.2 mg) was not sufficiently pure for obtaining a
good quality NMR spectra required for the structural
characterization. The fraction containing compounds A–H
obtained after the flash column chromatography was used
for the further experiments during plant elicitation with the
fungal phytotoxin.
3.2 LC-MS identification of isoflavones and their
glycoconjugates
Isoflavone and flavone glycoconjugates in leaves of
L. angustifolius were studied earlier using HPLC-MS
(Muth et al. 2008, 2009). Thirty-five flavone and isoflavone
mono- and diglycosides partially acylated with malonic
acid molecules were recognized in the lupin plant tissue
then. Several of these compounds were isobaric or isomeric
compounds characterized by a different substitution
(hydroxylation and/or methoxylation) of the B ring of the
aglycone moieties and the positions of the sugars and acyl
groups. Moreover, various patterns of the glycosylation
with different sugar substituents (hexoses, deoxyhexoses or
pentoses) were observed. During the present research,
additional pseudo-MS3 experiments were performed during
the LC/MS analyses (Abranko et al. 2011). This methodi-
cal approach resulted in an unambiguous identification of
the aglycones of the glycosylated isomeric natural products
(Figure 3S). The application of the Advion Triversa
Nanomate unit was especially efficient in the analysis of
compounds present in minor amounts and additionally
increased the number of the detected flavonoids (see
Table 2). In particular, glycoconjugates of the isoflavones,
luteone and wighteone, which were identified formerly in
Mexican lupins (Stobiecki et al. 2010), but not recognized
in the European species, were found during the described
experiments. Mono- and diglucosides of these aglycones,
some of those acylated with malonic acid molecules were
recorded (Table 2). The number of detected flavonoid
compounds increased twice—to 72 compounds listed in
Table 2 as a result of all described improvements in the
analytical approach.
The pattern of acylation of the flavone and isoflavone
glycosides with malonic acid was an important factor that
had a major impact on the structural variability of the
studied compounds. An elucidation of the malonic group
Table 1 Fraction of toxic natural products isolated from the culture
medium of the fungus, Colletotrichum lupini—molecular formulas
estimated from the m/z values of [M ? H] ? ions
Compound Molecular
formula
m/z of [M ? H]? ion Error
(ppm)Measured Calculated
A C19H35NO4 342.2630 342.2639 2.73
B C19H33NO5 356.2437 356.2431 -1.43
C C19H35NO5 358.2588 358.2588 -0.05
D C21H37NO5 384.2733 384.2744 2.99
E C21H39NO5 386.2896 286.2901 1.21
F C21H35NO6 398.2536 398.2537 0.22
G C21H37NO6 400.2693 400.2694 0.04
H C23H39NO7 442.2789 442.2799 2.36
Secondary metabolite profiles after fungal infections 579
123

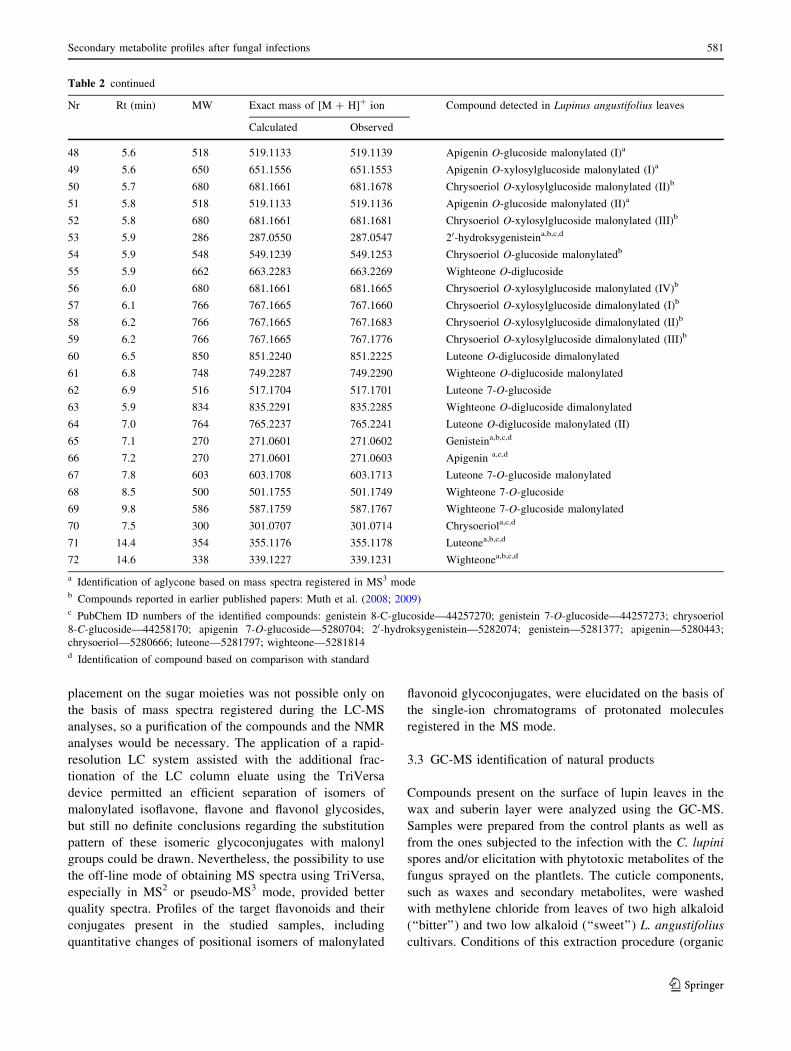
Table 2 Flavonoid glycoconjugates and free aglycones detected in leaves of narrow leaf lupin (L. angustifolius)
Nr Rt (min) MW Exact mass of [M ? H]? ion Compound detected in Lupinus angustifolius leaves
Calculated Observed
1 2.7 594 595.1657 595.1705 Genistein C-diglucoside
2 3.3 448 449.1078 449.1088 20-hydroxygenistein 7-O-glucosidea,b
3 3.4 696 697.1611 697.1605 20-hydroxygenistein diglucoside malonylated (I)a,b
4 3.5 432 433.1129 433.1122 Genistein 8-C-glucosideb,c
5 3.7 680 681.1661 681.1651 Genistein 40,7di-O-glucoside malonylated (I)a,b
6 3.8 680 681.1661 681.1669 Genistein 40,7di-O-glucoside malonylated (II)a,b
7 3.9 756 757.2186 757.2187 Chrysoeriol glucoside–xylosylglucosideb
8 3.9 782 783.1614 783.1615 20-hydroxygenistein 40,7di-O-glucoside dimalonylateda
9 4.0 610 611.1607 611.1610 Quercetin 3-O-rhamnosylglucosideb
10 4.2 518 519.1133 519.1136 Genistein 8-C-glucoside malonylated
11 4.2 464 465.1028 465.1015 Quercetin O-glucoside
12 4.3 448 449.1078 449.1061 Luteolin 7-O-glucosidea,d
13 4.3 518 519.1133 519.1138 Genistein O-glucoside malonylateda
14 4.3 680 681.1661 681.1661 Genistein O,C-diglucoside malonylateda
15 4.3 842 843.2190 843.2203 Chrysoeriol glucoside–xylosylglucoside malonylated (I)b
16 4.3 432 433.1129 433.1136 Genistein 7-O-glucosidea,b,c,d
17 4.3 534 535.1082 535.1075 20-hydroxygenistein 7-O-glucoside malonylated (I)b
18 4.4 462 463.1235 463.1230 Chrysoeriol 8-C-glucosidec
19 4.4 842 843.2190 843.2183 Chrysoeriol glucoside–xylosylglucoside malonylated (II)b
20 4.4 680 681.1661 681.1667 Genistein diglucoside malonylatedb
21 4.5 842 843.2190 843.2217 Chrysoeriol glucoside–xylosylglucoside malonylated (III)b
22 4.5 766 767.1665 767.1669 Genistein 40,7di-O-glucoside dimalonylated (I)a,b
23 4.6 766 767.1665 767.1662 Genistein 40,7di-O-glucoside dimalonylated (II)a,b
24 4.6 534 535.1082 535.1075 20-hydroxygenistein 7-O-glucoside malonylated (II)a,b
25 4.6 462 463.1235 463.1230 Chrysoeriol O-glucoside (I)b
26 4.6 448 449.1078 449.1088 Kaempferol-3-O-glucosidea,d
27 4.7 842 843.2190 843.2205 Chrysoeriol glucoside–xylosylglucoside malonylated (IV)b
28 4.8 564 565.1552 565.1551 Apigenin O-xylosylglucosidea
29 4.8 518 519.1133 519.1142 Genistein C-glucoside malonylated
30 4.8 782 783.1614 783.1618 20-hydroxygenistein 7-O-diglucoside dimalonylated
31 4.8 928 929.2194 929.2209 Chrysoeriol glucoside–xylosylglucoside dimalonylated (I)b
32 4.9 928 929.2194 929.2201 Chrysoeriol glucoside–xylosylglucoside dimalonylated (II)b
33 4.9 432 433.1129 433.1131 Apigenin 7-O-glucosidea,c,d
34 5.0 928 929.2194 929.2192 Chrysoeriol glucoside–xylosylglucoside dimalonylated (III)b
35 5.0 766 767.1665 767.1662 Apigenin 40,7di-O-glucoside dimalonylateda
36 5.0 696 697.1611 697.1615 20-hydroxygenistein 7-O-diglucoside malonylated (II)
37 5.1 666 667.1505 667.1512 Luteolin xylosylglucoside malonylateda
38 5.1 594 595.1657 595.1665 Chrysoeriol O-xylosylglucosideb
39 5.1 548 549.1239 549.1245 Chrysoeriol C-glucoside malonylated
40 5.2 534 535.1082 535.1089 Kaempferol-O-glucoside malonylateda
41 5.2 518 519.1133 519.1124 Genistein 7-O-glucoside malonylated (I)a
42 5.3 650 651.1556 651.1549 Genistein 7-O-xylosylglucoside malonylated (I)
43 5.3 462 463.1235 463.1234 Chrysoeriol O-glucoside (II)
44 5.4 518 519.1133 519.1131 Genistein 7-O-glucoside malonylated (II)a,b
45 5.4 678 679.2233 679.2215 Luteone O-diglucoside
46 5.5 650 651.1556 651.1551 Genistein 7-O-xylosylglucoside malonylated (II)b
47 5.5 680 681.1661 681.1678 Chrysoeriol O-xylosylglucoside malonylated (I)b
580 A. Wojakowska et al.
123
placement on the sugar moieties was not possible only on
the basis of mass spectra registered during the LC-MS
analyses, so a purification of the compounds and the NMR
analyses would be necessary. The application of a rapid-
resolution LC system assisted with the additional frac-
tionation of the LC column eluate using the TriVersa
device permitted an efficient separation of isomers of
malonylated isoflavone, flavone and flavonol glycosides,
but still no definite conclusions regarding the substitution
pattern of these isomeric glycoconjugates with malonyl
groups could be drawn. Nevertheless, the possibility to use
the off-line mode of obtaining MS spectra using TriVersa,
especially in MS2 or pseudo-MS3 mode, provided better
quality spectra. Profiles of the target flavonoids and their
conjugates present in the studied samples, including
quantitative changes of positional isomers of malonylated
flavonoid glycoconjugates, were elucidated on the basis of
the single-ion chromatograms of protonated molecules
registered in the MS mode.
3.3 GC-MS identification of natural products
Compounds present on the surface of lupin leaves in the
wax and suberin layer were analyzed using the GC-MS.
Samples were prepared from the control plants as well as
from the ones subjected to the infection with the C. lupini
spores and/or elicitation with phytotoxic metabolites of the
fungus sprayed on the plantlets. The cuticle components,
such as waxes and secondary metabolites, were washed
with methylene chloride from leaves of two high alkaloid
(‘‘bitter’’) and two low alkaloid (‘‘sweet’’) L. angustifolius
cultivars. Conditions of this extraction procedure (organic
Table 2 continued
Nr Rt (min) MW Exact mass of [M ? H]? ion Compound detected in Lupinus angustifolius leaves
Calculated Observed
48 5.6 518 519.1133 519.1139 Apigenin O-glucoside malonylated (I)a
49 5.6 650 651.1556 651.1553 Apigenin O-xylosylglucoside malonylated (I)a
50 5.7 680 681.1661 681.1678 Chrysoeriol O-xylosylglucoside malonylated (II)b
51 5.8 518 519.1133 519.1136 Apigenin O-glucoside malonylated (II)a
52 5.8 680 681.1661 681.1681 Chrysoeriol O-xylosylglucoside malonylated (III)b
53 5.9 286 287.0550 287.0547 20-hydroksygenisteina,b,c,d
54 5.9 548 549.1239 549.1253 Chrysoeriol O-glucoside malonylatedb
55 5.9 662 663.2283 663.2269 Wighteone O-diglucoside
56 6.0 680 681.1661 681.1665 Chrysoeriol O-xylosylglucoside malonylated (IV)b
57 6.1 766 767.1665 767.1660 Chrysoeriol O-xylosylglucoside dimalonylated (I)b
58 6.2 766 767.1665 767.1683 Chrysoeriol O-xylosylglucoside dimalonylated (II)b
59 6.2 766 767.1665 767.1776 Chrysoeriol O-xylosylglucoside dimalonylated (III)b
60 6.5 850 851.2240 851.2225 Luteone O-diglucoside dimalonylated
61 6.8 748 749.2287 749.2290 Wighteone O-diglucoside malonylated
62 6.9 516 517.1704 517.1701 Luteone 7-O-glucoside
63 5.9 834 835.2291 835.2285 Wighteone O-diglucoside dimalonylated
64 7.0 764 765.2237 765.2241 Luteone O-diglucoside malonylated (II)
65 7.1 270 271.0601 271.0602 Genisteina,b,c,d
66 7.2 270 271.0601 271.0603 Apigenin a,c,d
67 7.8 603 603.1708 603.1713 Luteone 7-O-glucoside malonylated
68 8.5 500 501.1755 501.1749 Wighteone 7-O-glucoside
69 9.8 586 587.1759 587.1767 Wighteone 7-O-glucoside malonylated
70 7.5 300 301.0707 301.0714 Chrysoeriola,c,d
71 14.4 354 355.1176 355.1178 Luteonea,b,c,d
72 14.6 338 339.1227 339.1231 Wighteonea,b,c,d
a Identification of aglycone based on mass spectra registered in MS3 modeb Compounds reported in earlier published papers: Muth et al. (2008; 2009)c PubChem ID numbers of the identified compounds: genistein 8-C-glucoside—44257270; genistein 7-O-glucoside—44257273; chrysoeriol
8-C-glucoside—44258170; apigenin 7-O-glucoside—5280704; 20-hydroksygenistein—5282074; genistein—5281377; apigenin—5280443;
chrysoeriol—5280666; luteone—5281797; wighteone—5281814d Identification of compound based on comparison with standard
Secondary metabolite profiles after fungal infections 581
123
solvent and time of washing) were optimized in order to
achieve the maximal yield and avoid a damage of cell walls
and membranes causing a leakage of cytoplasm compo-
nents. The samples were derivatized with trimethylsilyl
(TMS) groups to block the polar groups of the molecules
and increase the volatility of the studied compounds
injected on the GC column (see ‘Materials and methods’).
Different classes of primary and secondary metabolites:
alkaloids, fatty acids and their esters, sterols and isoflav-
ones were recognized in the studied samples on the basis of
comparison of the registered mass spectra with the data
bases. The most abundant and important group of natural
products detected on the lupin leaf surface were the quin-
olizidine alkaloids (QA). To no astonishment, a substantial
quantitative difference in the alkaloid contents (two orders
of magnitude) was observed between the sweet and bitter
cultivars studied. The 14 detected alkaloids were eluted
from the GC column in a wide range of RT due to the
presence of the free bases (angustifolin, lupanin and mul-
tiflorin) as well as 13-hydroxylupanin esterified with vari-
ous organic acids (see Table 1S). It is noteworthy that the
total amount of alkaloids present in the bitter lupin culti-
vars was dominated by the 13-hydroxylupanin esters,
whereas the non-esterified QA were more abundant in the
sweet cultivars. The individual QAs were identified on the
basis of their RT and the respective mass spectra in com-
parison with these obtained for the standard compounds.
There were no quantitative differences observed in abun-
dances of QAs in samples prepared from control, C. lupini
infected or phytotoxin-elicited plants (data not presented).
Among the flavonoid compounds only prenylated isoflav-
ones wighteone and luteone that are known lupin phyto-
alexins (Ingham et al. 1983) were also detected on the leaf
surface of plants infected with the C. lupini spores or
elicited with its phytotoxic metabolites (Fig. 1). Amounts
of wighteone and luteone detected on the leaf surface were
much smaller than these of QAs, especially in the case of
the bitter cultivars (Mirela and Karo). There was a notable
difference between the prenylated isoflavone aglycones
found on leaf surface of the infected and elicited plants.
While luteone and wighteone were recognized in the for-
mer group, only wighteone could be detected on the latter
plants. A large increase of the amount of free wighteone
was observed on the leaf surface of the phytotoxin-elicited
plants in relation to the control as early as 12 h after the
treatment (Fig. 2) when it was 7 times higher and it
remained at the elevated level (400 % of the control) after
48 h. It should be noted that neither infection with the
fungal spores nor phytotoxin treatment caused any change
in presence of flavonoid aglycones other than the preny-
lated isoflavones on the surface of L. angustifolius leaves.
Similarly, no changes in fatty acid and sterols were
observed as a result of the plant treatment.
3.4 PCR analysis of phenylpropanoid pathway genes
Changes in transcription of genes responsible for the key
enzymes participating in the isoflavone biosynthesis path-
way (PAL, CHS, CHI and IFS) in response to infection
with C. lupini and treatment with the phytotoxic metabo-
lites of the fungus were studied at different time points.
The transcription of the studied genes was monitored after
24 and 48 h in the case of spraying plants with the phy-
totoxin solution and, additionally, 96 and 168 h after
infection with the C. lupini spores. The level of transcrip-
tion of three genes (CHS, CHI and IFS) under study
increased in the treated plants above the level in the control
as a result of both types of plant treatment (Figure 4S),
whereas the expression of PAL as well as the positive
control actin genes remained on the same level. Addi-
tionally, it was found that the transcription of the moni-
tored enzymes was higher in the leaves submitted to the
phytotoxin deposition than in the untreated leaves collected
from the treated plants (data not presented). On the basis of
these data, we can conclude that the regulatory mecha-
nisms of the lupin plant response activated during their
interaction with spores and fungal toxin involve induction
of the isoflavone biosynthesis pathway.
3.5 Comparison of profiles of isoflavone
glycoconjugates and free aglycones in tissues
of lupin plants elicited with toxin or infected
with spores
As it was mentioned previously, different mass spectro-
metric methods were elaborated for the structural charac-
terization of the studied flavonoid glycoconjugates and for
their quantitative analysis. These methods differed in set-
tings of the ISCID (in source collision-induced dissocia-
tion) parameters that influenced the relative intensity of the
[M ? H]? ions and the fragment ions. While the structural
elucidation was based mainly on MS2 and pseudo-MS3
experiments, the quantitative analysis was performed in
conditions, in which intense [M ? H]? ions were regis-
tered. Anyway, a discussion of a biological role of the
natural products present in the analyzed samples demands
their proper identification. For example, two isomers of
malonylated glucosides of 20-hydroxygenistein (com-
pounds 17 and 24 with RT of 4.3 and 4.6 min, Table 2;
Fig. 3) and malonylated kaempferol glucoside (compound
40, RT of 5.2 min) were isobaric compounds with a
molecular weight of 534 Da as identified in the analyzed
samples. The abundance of only one 20-hydroxygenistein
derivative (compound 24) was changed substantially as a
result of infection or elicitation of lupin plants (Fig. 3).
Three different types of plant treatment were applied
during our experiments, in which changes to the contents of
582 A. Wojakowska et al.
123

isoflavones and their glycoconjugates in tissues of
L. angustifolius leaves were studied. Plants were (1)
sprayed with the C. lupini spore suspension, (2) elicited
with the fungus phytotoxic compounds applied either on
wounded leaves or sprayed on plants and (3) sprayed with the
phytotoxins and with spores 48 h later. Changes of the
studied isoflavonoid profiles were detected as a result of all
the treatments applied; however, the plant responses were
different and occurred after different times depending on the
way of their treatment. Amount of each compound in the
studied tissue was calculated using the total intensity of the
respective [M ? H]? ion in relation to that of the internal
standard (luteolin) and the mass of the sample. The mean
values obtained from three biological repetitions, each
measured in two chromatographic runs are presented in the
Supplementary Materials (Figures 5S–8S). Figures 2, 4, 5
and 6 show the same data as the measured amount of the
studied compound in leaves of plants treated with fungal
compounds or infected with the C. lupini spores in relation to
that detected in the control plants.
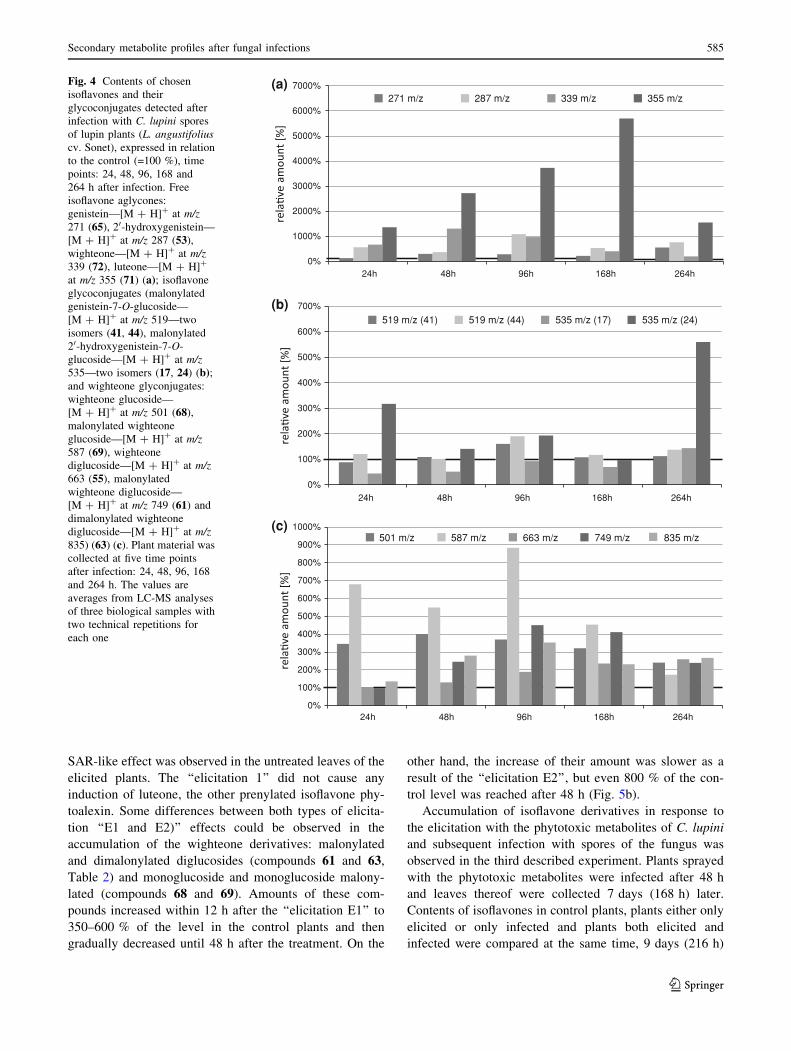
In the case of infection with spores of C. lupini, a
maximum response directed to the synthesis of phenolic
secondary metabolites was recorded after 7 days (168 h),
but the onset of the increased accumulation of these com-
pounds was observed after 24 h (Fig. 4). Three free iso-
flavone aglycones (20-hydroxygenistein and two known
phytoalexins, wighteone and luteone) were found in tissues
in much increased amounts at all studied time points in
comparison to these observed in the control plants. In
contrast, the amount of genistein was elevated substantially
at the last time point of the experiment. In particular, the
levels of free luteone observed in leaves of the infected
plants after 7 days were more than 50 times higher than
these in the control plants. It should be noted that the
contents of some isoflavonoid glycoconjugates also
Time
%
0
100
2.00 4.00 6.00 8.00 10.00 12.00 14.00 16.00 18.00 20.00 22.00 24.00 26.00 28.00 30.00 32.00 34.00 36.00 38.00
2.00 4.00 6.00 8.00 10.00 12.00 14.00 16.00 18.00 20.00 22.00 24.00 26.00 28.00 30.00 32.00 34.00 36.00 38.00
%
0
100 29.00
25.06
14.95
7.41 13.0823.9920.3917.5218.29
22.5321.69
28.03
26.6025.33 26.90
33.27
29.93 30.7731.90
28.99
25.05
14.94
13.087.4123.99
23.6917.5118.28
26.59
28.3226.89
33.30
30.7630.26
infection
control
luteone
wighteone
QA
QAQA
QA
QA
Fig. 1 GC-MS total ion chromatogram registered for cuticle and wax
washings of the lupin plantlets (cv. Mirela–bitter) after infection with
C. lupini spores (top) and control plants (bottom). Analyses were
performed for two biological samples at two technical repetitions for
each sample. The identified QA are listed in Table 1S
0%
100%
200%
300%
400%
500%
600%
700%
800%
12h 24h 48h
Fig. 2 Contents of wighteone detected in the samples obtained by
washing of lupin leaves with CH2Cl2, obtained at three time points
after elicitation (12, 24, and 48 h) of lupin plants (L. angustifolius cv.
Sonet) with phytotoxin obtained from cultures of fungus C. lupini.The GC-MS measured amounts of wighteone are expressed in relation
to that in the control plants (= 100 %). Analyses were performed for
two biological samples at two technical repetitions for each sample
Secondary metabolite profiles after fungal infections 583
123
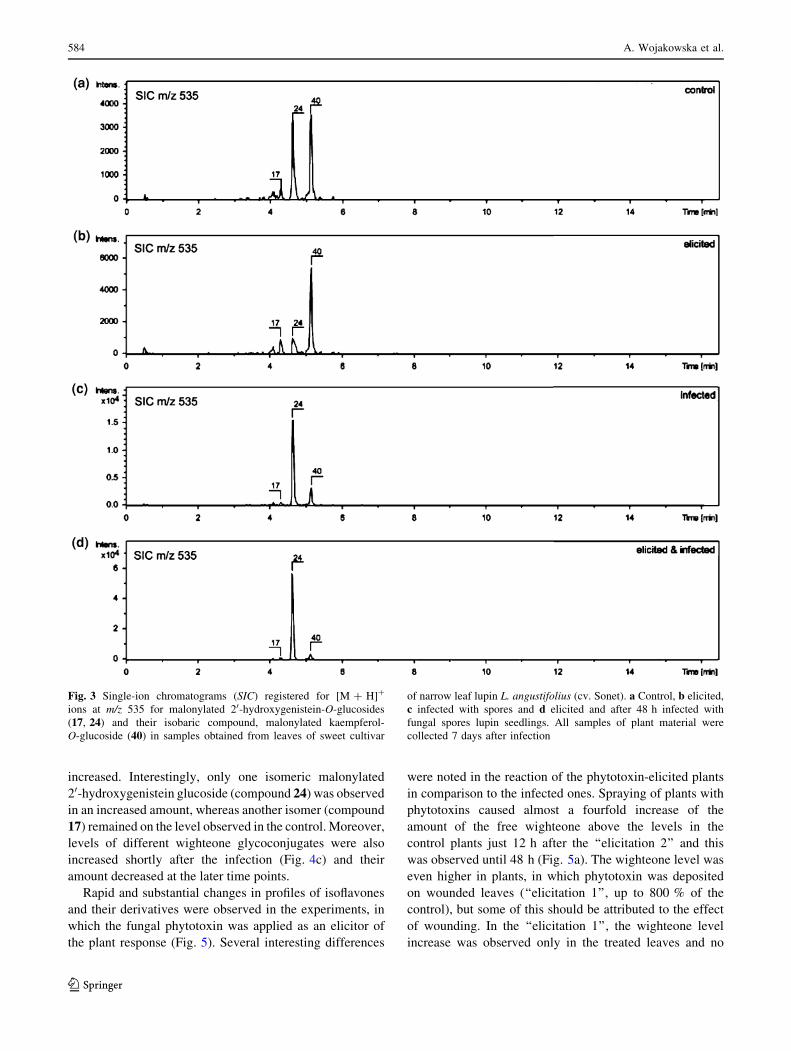
increased. Interestingly, only one isomeric malonylated
20-hydroxygenistein glucoside (compound 24) was observed
in an increased amount, whereas another isomer (compound
17) remained on the level observed in the control. Moreover,
levels of different wighteone glycoconjugates were also
increased shortly after the infection (Fig. 4c) and their
amount decreased at the later time points.
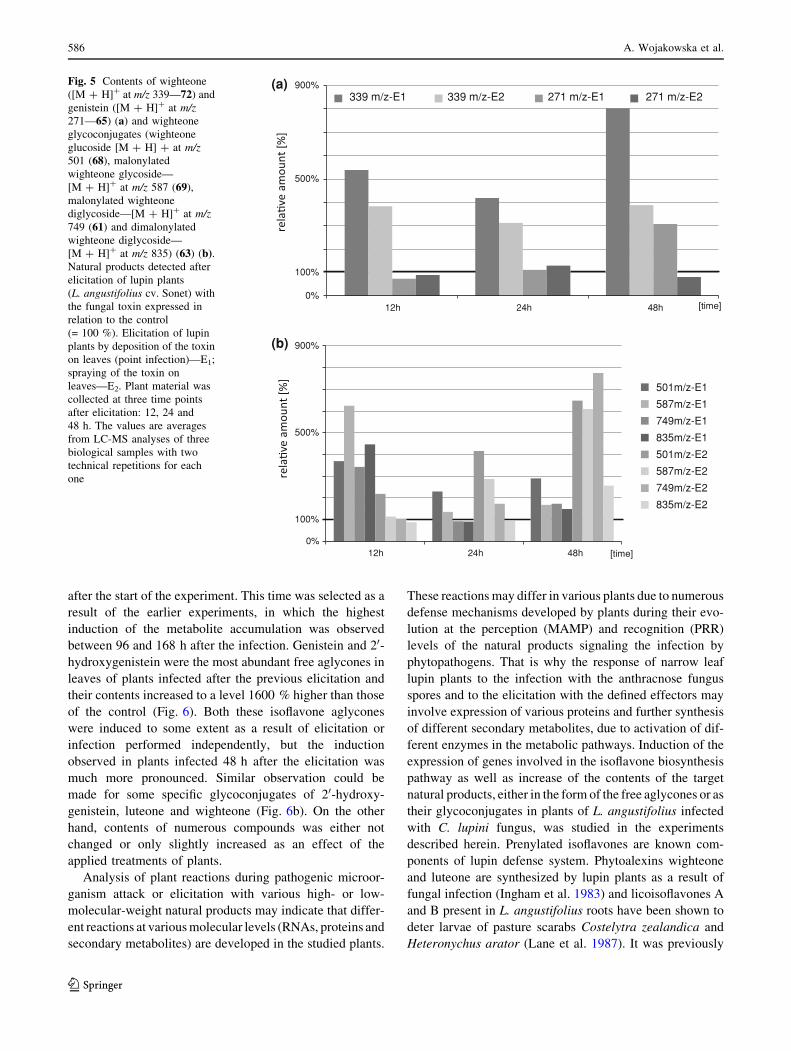
Rapid and substantial changes in profiles of isoflavones
and their derivatives were observed in the experiments, in
which the fungal phytotoxin was applied as an elicitor of
the plant response (Fig. 5). Several interesting differences
were noted in the reaction of the phytotoxin-elicited plants
in comparison to the infected ones. Spraying of plants with
phytotoxins caused almost a fourfold increase of the
amount of the free wighteone above the levels in the
control plants just 12 h after the ‘‘elicitation 2’’ and this
was observed until 48 h (Fig. 5a). The wighteone level was
even higher in plants, in which phytotoxin was deposited
on wounded leaves (‘‘elicitation 1’’, up to 800 % of the
control), but some of this should be attributed to the effect
of wounding. In the ‘‘elicitation 1’’, the wighteone level
increase was observed only in the treated leaves and no
Fig. 3 Single-ion chromatograms (SIC) registered for [M ? H]?
ions at m/z 535 for malonylated 20-hydroxygenistein-O-glucosides
(17, 24) and their isobaric compound, malonylated kaempferol-
O-glucoside (40) in samples obtained from leaves of sweet cultivar
of narrow leaf lupin L. angustifolius (cv. Sonet). a Control, b elicited,
c infected with spores and d elicited and after 48 h infected with
fungal spores lupin seedlings. All samples of plant material were
collected 7 days after infection
584 A. Wojakowska et al.
123
SAR-like effect was observed in the untreated leaves of the
elicited plants. The ‘‘elicitation 1’’ did not cause any
induction of luteone, the other prenylated isoflavone phy-
toalexin. Some differences between both types of elicita-
tion ‘‘E1 and E2)’’ effects could be observed in the
accumulation of the wighteone derivatives: malonylated
and dimalonylated diglucosides (compounds 61 and 63,
Table 2) and monoglucoside and monoglucoside malony-
lated (compounds 68 and 69). Amounts of these com-
pounds increased within 12 h after the ‘‘elicitation E1’’ to
350–600 % of the level in the control plants and then
gradually decreased until 48 h after the treatment. On the
other hand, the increase of their amount was slower as a
result of the ‘‘elicitation E2’’, but even 800 % of the con-
trol level was reached after 48 h (Fig. 5b).
Accumulation of isoflavone derivatives in response to
the elicitation with the phytotoxic metabolites of C. lupini
and subsequent infection with spores of the fungus was
observed in the third described experiment. Plants sprayed
with the phytotoxic metabolites were infected after 48 h
and leaves thereof were collected 7 days (168 h) later.
Contents of isoflavones in control plants, plants either only
elicited or only infected and plants both elicited and
infected were compared at the same time, 9 days (216 h)
0%
1000%
2000%
3000%
4000%
5000%
6000%
7000%
24h 48h 96h 168h 264h
24h 48h 96h 168h 264h
24h 48h 96h 168h 264h
271 m/z 287 m/z 339 m/z 355 m/z
0%
100%
200%
300%
400%
500%
600%
700%
519 m/z (41) 519 m/z (44) 535 m/z (17) 535 m/z (24)
0%
100%
200%
300%
400%
500%
600%
700%
800%
900%
1000%501 m/z 587 m/z 663 m/z 749 m/z 835 m/z
(a)
(b)
(c)
Fig. 4 Contents of chosen
isoflavones and their
glycoconjugates detected after
infection with C. lupini spores
of lupin plants (L. angustifoliuscv. Sonet), expressed in relation
to the control (=100 %), time
points: 24, 48, 96, 168 and
264 h after infection. Free
isoflavone aglycones:
genistein—[M ? H]? at m/z271 (65), 20-hydroxygenistein—
[M ? H]? at m/z 287 (53),
wighteone—[M ? H]? at m/z339 (72), luteone—[M ? H]?
at m/z 355 (71) (a); isoflavone
glycoconjugates (malonylated
genistein-7-O-glucoside—
[M ? H]? at m/z 519—two
isomers (41, 44), malonylated
20-hydroxygenistein-7-O-
glucoside—[M ? H]? at m/z535—two isomers (17, 24) (b);and wighteone glyconjugates:
wighteone glucoside—
[M ? H]? at m/z 501 (68),
malonylated wighteone
glucoside—[M ? H]? at m/z587 (69), wighteone
diglucoside—[M ? H]? at m/z663 (55), malonylated
wighteone diglucoside—
[M ? H]? at m/z 749 (61) and
dimalonylated wighteone
diglucoside—[M ? H]? at m/z835) (63) (c). Plant material was
collected at five time points
after infection: 24, 48, 96, 168
and 264 h. The values are
averages from LC-MS analyses
of three biological samples with
two technical repetitions for
each one
Secondary metabolite profiles after fungal infections 585
123
after the start of the experiment. This time was selected as a
result of the earlier experiments, in which the highest
induction of the metabolite accumulation was observed
between 96 and 168 h after the infection. Genistein and 20-hydroxygenistein were the most abundant free aglycones in
leaves of plants infected after the previous elicitation and
their contents increased to a level 1600 % higher than those
of the control (Fig. 6). Both these isoflavone aglycones
were induced to some extent as a result of elicitation or
infection performed independently, but the induction
observed in plants infected 48 h after the elicitation was
much more pronounced. Similar observation could be
made for some specific glycoconjugates of 20-hydroxy-
genistein, luteone and wighteone (Fig. 6b). On the other
hand, contents of numerous compounds was either not
changed or only slightly increased as an effect of the
applied treatments of plants.
Analysis of plant reactions during pathogenic microor-
ganism attack or elicitation with various high- or low-
molecular-weight natural products may indicate that differ-
ent reactions at various molecular levels (RNAs, proteins and
secondary metabolites) are developed in the studied plants.
These reactions may differ in various plants due to numerous
defense mechanisms developed by plants during their evo-
lution at the perception (MAMP) and recognition (PRR)
levels of the natural products signaling the infection by
phytopathogens. That is why the response of narrow leaf
lupin plants to the infection with the anthracnose fungus
spores and to the elicitation with the defined effectors may
involve expression of various proteins and further synthesis
of different secondary metabolites, due to activation of dif-
ferent enzymes in the metabolic pathways. Induction of the
expression of genes involved in the isoflavone biosynthesis
pathway as well as increase of the contents of the target
natural products, either in the form of the free aglycones or as
their glycoconjugates in plants of L. angustifolius infected
with C. lupini fungus, was studied in the experiments
described herein. Prenylated isoflavones are known com-
ponents of lupin defense system. Phytoalexins wighteone
and luteone are synthesized by lupin plants as a result of
fungal infection (Ingham et al. 1983) and licoisoflavones A
and B present in L. angustifolius roots have been shown to
deter larvae of pasture scarabs Costelytra zealandica and
Heteronychus arator (Lane et al. 1987). It was previously
0%
100%
500%
900%
12h 24h 48h
339 m/z-E1 339 m/z-E2 271 m/z-E1 271 m/z-E2
0%
100%
500%
900%
12h 24h 48h
[time]
[time]
501m/z-E1
587m/z-E1
749m/z-E1
835m/z-E1
501m/z-E2
587m/z-E2
749m/z-E2
835m/z-E2
(a)
(b)
Fig. 5 Contents of wighteone
([M ? H]? at m/z 339—72) and
genistein ([M ? H]? at m/z271—65) (a) and wighteone
glycoconjugates (wighteone
glucoside [M ? H] ? at m/z501 (68), malonylated
wighteone glycoside—
[M ? H]? at m/z 587 (69),
malonylated wighteone
diglycoside—[M ? H]? at m/z749 (61) and dimalonylated
wighteone diglycoside—
[M ? H]? at m/z 835) (63) (b).Natural products detected after
elicitation of lupin plants
(L. angustifolius cv. Sonet) with
the fungal toxin expressed in
relation to the control
(= 100 %). Elicitation of lupin
plants by deposition of the toxin
on leaves (point infection)—E1;
spraying of the toxin on
leaves—E2. Plant material was
collected at three time points
after elicitation: 12, 24 and
48 h. The values are averages
from LC-MS analyses of three
biological samples with two
technical repetitions for each
one
586 A. Wojakowska et al.
123

found (Muth et al. 2009) that wighteone and luteone were
accumulated differently in leaves of plants infected with the
C. lupini fungus. This observation has been currently sup-
ported by finding that only wighteone was found in increased
amounts on the surface as well as within leaf tissues of plants
that were treated with phytotoxins of the fungus, whereas
both wighteone and luteone were induced by the infection.
Treatment of some plant species with low-molecular-
weight signaling compounds, like salicylic acid or methyl
jasmonate (the well-known elicitors of response to biotic
stresses), may induce systemic acquired resistance (SAR),
as it was observed in the case of M. truncatula (Naoumkina
et al. 2007; Farag et al. 2008, 2009). However, SAR was
not observed in the case of the presently studied deposi-
tion of the C. lupini phytotoxic compounds on leaves of
L. angustifolius plantlets. On the other hand, the elicitation
of lupin plants with these compounds prior to the appli-
cation of fungal spores caused a much faster and more
intense answer of such treated plants than it was observed
after only the infection with the spores. An increased
synthesis of certain malonylated forms of the isoflavone
glycosides was one of the effects observed in the lupin
plant response to fungal infection or treatment with fungal
phytotoxic compounds. Similar effects were also observed
for other plant species from the Fabaceae family that are
subjected to biotic or abiotic stress (Lozovaya et al. 2004;
Farag et al. 2008, 2009; Jasinski et al. 2009). Isoflavone O-
malonyltransferases were recently characterized in Medi-
cago truncatula and it was observed that the expression of
these genes was stress-inducible (Zhao et al. 2011). How-
ever, these genes present in different legume plants do not
exhibit sequence similiarities (Yu et al. 2008), and moni-
toring of malonyltransferases in lupin was not yet realized.
It would be interesting to define the role of the acylation of
the studied isoflavones in the stress conditions. At present,
it is suggested that the malonylation of flavonoid glyco-
sides plays an important role in intracellular transport of
these compounds and the malonylated entities are recog-
nized by MATE transporters and transferred to proper
locations (vacuoles) in plant cells (Zhao et al. 2011).
4 Concluding remarks
Many of the isoflavone glycoconjugates occur in the
L. angustifolius leaves in several isomeric forms. These
0%
200%
400%
600%
800%
1000%
1200%
1400%
1600%
1800%
E_IIE
271 m/z 287 m/z 339 m/z 355 m/z
0%
200%
400%
600%
800%
1000%
1200%
519 m/z (41) 519 m/z (44) 535 m/z (17) 535 m/z (24)
0%
100%
200%
300%
400%
500%
600%517 m/z 603 m/z 679 m/z 851 m/z
0%
100%
200%
300%
400%
500%
600%501 m/z 587 m/z 663 m/z 749 m/z 835 m/z
E_IIE
E_IIE
E_IIE
(a)
(b)
(c)
(d)
Fig. 6 Contents of chosen isoflavones and their glycoconjugates
detected in lupin seedlings of 2 weeks old after elicitation (E),
infection with C. lupini spores (I) or elicitation followed with
infection 48 h after elicitation of lupin plants (E ? I) (L. angustifoliuscv. Sonet), expressed in relation to the control (= 100 %). On the
graphs are presented: relative amounts of free aglycones—genistein—
[M ? H]? at m/z 271 (65), 20-hydroxygenistein—[M ? H]? at m/z287 (53), wighteone—[M ? H]? at m/z 339 (72), luteone—
[M ? H]? at m/z 355 (71) (a); isomers of malonylated glycosides
of genistein and 20-hydroxygenistein: (malonylated genistein-7-O-
glycoside—[M ? H]? at m/z 519—two isomers (41, 44), malonylat-
ed 20-hydroxygenistein-7-O-glycoside—[M ? H]? at m/z 535—two
isomers (17, 24) (b); luteone glucoside—[M ? H]? at m/z 517 (62),
malonylated luteone glucoside—[M ? H]? at m/z 603 (67), luteone
diglucoside—[M ? H]? at m/z 679 (45) and dimalonylated luteone
diglucoside—[M ? H]? at m/z 851 (60) (c) and wighteone glycon-
jugates: wighteone glucoside—[M ? H]? at m/z 501 (68), malony-
lated wighteone glycoside—[M ? H]? at m/z 587 (69), and
wighteone diglycoside—[M ? H]? at m/z 663 (55), malonylated
wighteone diglycoside—[M ? H]? at m/z 749 (61) and dimalonylat-
ed wighteone diglycoside—[M ? H]? at m/z 835) (63) (d). Control
and treated plants were collected at the same time (9 days from the
start of elicitation)
c
Secondary metabolite profiles after fungal infections 587
123
forms differ in the prenylation, glycosylation and/or mal-
onylation pattern and contents of only some of them are
changed as a result of infection. From the registered results,
we can conclude that especially the malonylation of the
glycosylated precursor of antibiotic natural products may
play an important role. This may be exemplified by the
registration of the increase of contents of only one out of
two isomeric malonylated 20hydroxygenistein glucosides.
Generally, it is likely that the changes of only certain
isoflavonoids contents and not the overall amount of these
compounds are relevant in the plant response to fungal
infection. There are major differences in the synthesis of
secondary metabolites by lupin plants in response to fungal
infection and to treatment with fungal phytotoxic com-
pounds. Spraying lupin plants with toxins accelerates and
strengthens their response at the level of synthesis of iso-
flavone phytoalexins or their precursors. While the first
changes in the isoflavone profiles may be observed as early
as 12 h after the phytotoxin deposition on the leaf surface,
the altered composition of this pool of secondary metabolites
persists in the infected plants for at least several days. In this
situation, we can conclude that the perception of MAMPs at
the level of low-molecular-weight natural products through
the PRRs situated on the cell surface causes changes in the
synthesis of plant secondary metabolites that play a role in
the protection against fungal infection.
Acknowledgments This study was supported by the Polish Ministry
of Science (grant No 7216/BP01/2011/40 and grant UMO-2011/01/N/
NZ2/00025). We are particularly grateful to B. Kalemba and E.
Lewartowska (IPG PAS) for maintaining the fungal culture and their
skillful help in the infection of lupin plants and purification of phy-
totoxic compounds. AW is grateful for the scholarship founded within
the project from Sub-measure 8.2.2 Human Capital Operational
Program, co-financed by European Union Fund.
Open Access This article is distributed under the terms of the
Creative Commons Attribution License which permits any use, dis-
tribution, and reproduction in any medium, provided the original
author(s) and the source are credited.
References
Abranko, L., Garcia-Reyes, J. F., & Molina-Diaz, A. (2011).
In-source fragmentation and accurate mass analysis of multiclass
flavonoid conjugates be electrospray ionization time of flight
mass spectrometry. Journal of Mass Spectrometry, 46, 478–488.
Allwood, J. W., Ellis, D. I., & Goodacre, R. (2008). Metabolomic
technologies and their application to the study of plants and
plant–host interactions. Physiologia Plantarum, 132, 117–135.
Bednarek, P., Kerhoas, L., Einhorn, J., et al. (2003). Profiling of
flavonoid conjugates in Lupinus albus and Lupinus angustifoliusresponding to biotic and abiotic stimuli. Journal of ChemicalEcology, 29, 1127–1142.
Bednarek, P., & Osbourn, A. (2009). Plant-Microbe interactions:
chemical diversity in plant defense. Science, 324, 746–748.
Boller, T., & Felix, G. (2009). A renaissance of elicitors: perception
of microbe-associated molecular patterns and danger signals by
pattern-recognition receptors. Annual Review of Plant Biology,60, 379–406.
Boller, T., & He, S. Y. (2009). Innate immunity in plants: an arms
race between pattern recognition receptors in plants and effectors
in microbial pathogens. Science, 324, 742–744.
Broeckling, C. D., Huhman, D. V., Farag, M. A., et al. (2005).
Metabolic profiling of Medicago truncatula cell cultures reveals
the effects of biotic and abiotic elicitors on metabolism. Journalof Experimental Botany, 56, 323–336.
Conrath, U. (2011). Molecular aspects of defence priming. Trends inPlant Science, 16, 524–531.
Dixon, R. A., & Paiva, N. L. (1995). Stress-induced phenylpropanoid
metabolism. Plant Cell, 7, 1085–1097.
Djamei, A., Schipper, K., Rabe, F., et al. (2011). Metabolic priming
by a secreted fungal effector. Nature, 478, 395–398.
Farag, M. A., Deavours, B. E., de Fatima, A., Naoumkina, M., Dixon,
R. A., & Sumner, L. W. (2009). Integrated metabolite and
transcript profiling identify a biosynthetic mechanism for
hispidol in Medicago truncatula cell cultures. Plant Physiology,151, 1096–1113.
Farag, M. A., Huhman, D. V., Dixon, R. A., & Sumner, L. W. (2008).
Metabolomics reveals novel pathways and differential mecha-
nistic and elicitor-specific responses in phenylpropanoid and
isoflavonoid biosynthesis in Medicago truncatula cell cultures.
Plant Physiology, 146, 387–402.
Franski, R., Bednarek, P., Siatkowska, D., Wojtaszek, P., & Stobiecki,
M. (1999a). Application of mass spectrometry to structural
identification of flavonoid monoglycosides isolated from shoot
of lupin (Lupinus luteus L.). Acta Biochimica Polonica, 46,
459–473.
Franski, R., Bednarek, P., Wojtaszek, P., & Stobiecki, M. (1999b).
Identification of flavonoid diglycosides in yellow lupin (Lupinusluteus L.) with mass spectrometric techniques. Journal of MassSpectrometry, 34, 486–495.
Frencel, I. M. (1998). Report on first detection of anthracnose
(Colletotrichum gloeosporioides) on lupins in Poland. PlantDisease, 82, 350.
Garcıa-Pajon, C. M., & Collado, I. G. (2003). Secondary metabolites
isolated from Colletotrichum species. Natural Product Reports,20, 426–431.
Gould, K.S. & Lister, C. (2006). Flavonoid functions in plants. In:
Andersen, Ø.M. and Markham, K.R (Eds), Flavonoids chemistry,biochemistry and applications (pp. 397–442). Boca Raton: CRC.
Grotewold, E. (2005). Plant metabolic diversity: a regulatory
perspective. Trends in Plant Science, 10, 57–62.
Ingham, J. L., Tahara, S., & Harborne, J. B. (1983). Fungitoxic
isoflavones from Lupinus albus and other Lupinus species.
Zeitschrift fur Naturforschung A, 38c, 194–200.
Jasinski, M., Kachlicki, P., Rodziewicz, P., Figlerowicz, M., &
Stobiecki, M. (2009). Changes in the profile of flavonoid
accumulation in Medicago truncatula leaves during infection
with fungal pathogen Phoma medicaginis. Plant Physiology andBiochemistry, 47, 847–853.
Kirk, P. M., Cannon, P. F., Minter, D. W., & Stalpers, J. A. (2008).
The Dictionary of the fungi (10th ed.). Egham: CABI Bioscience.
Lane, G. A., Sutherland, O. R. W., & Skipp, R. A. (1987).
Isoflavonoids as insect feeding deterrents and antifungal com-
ponents from root of Lupinus angustifolius. Journal of ChemicalEcology, 13, 771–783.
Lommen, A. (2009). MetAlign: interface-driven, versatile metabolo-
mics tool for hyphenated full-scan mass spectrometry data
preprocessing. Analytical Chemistry, 81, 3079–3086.
Lozovaya, V. V., Lygin, A. V., Zernova, O. V., Li, S. X., Hartman, G. L.,
& Widholm, J. M. (2004). Isoflavonoid accumulation in soybean
588 A. Wojakowska et al.
123
hairy roots upon treatment with Fusarium solani. Plant Physiologyand Biochemistry, 42, 671–679.
Luna, E., Bruce, T. J. A., Roberts, M. R., Flors, V., & Ton, J. (2012).
Next-generation systemic acquired resistance. Plant Physiology,158, 844–853.
Mancilla, G., Jimenez-Teja, D., Femenıa-Rıos, M., Macıas-Sanchez,
A. J., Collado, I. G., & Hernandez-Galan, R. (2009). Novel
macrolide from wild strains of the phytopathogen fungus
Colletotrichum acutatum. Natural Product Reports, 4, 395–398.
Muth, D., Kachlicki, P., Krajewski, P., Przystalski, M., & Stobiecki,
M. (2009). Differential metabolic response of narrow leafed
lupin (Lupinus angustifolius) leaves to infection with Colleto-trichum lupini. Metabolomics, 5, 354–362.
Muth, D., Marsden-Edwards, E., Kachlicki, P., & Stobiecki, M.
(2008). Differentiation of isomeric malonylated flavonoid gly-
conjugates in plant extracts with UPLC-ESI/MS/MS. Phyto-chemical Analysis, 19, 444–452.
Naoumkina, M., Farag, M. A., Sumner, L. W., Tang, Y., Liu, Ch-J, &
Dixon, R. A. (2007). Different mechanisms for phytoalexin
induction by pathogen and wound signals in Medicago trunca-tula. Proceedings of the National Academy Sciences USA, 104,
17909–17915.
Nirenberg, H. I., Feiler, U., & Hagedorn, G. (2002). Description of
Colletotrichum lupini comb. nov. in modern terms. Mycologia,94, 307–320.
Schliemann, W., Ammer, C., & Strack, D. (2008). Metabolite
profiling of mycorrhizal roots of Medicago truncatula. Phyto-chemistry, 69, 112–146.
Stobiecki, M., Staszkow, A., Piasecka, A., Garcia-Lopez, P. M.,
Zamora-Natera, F., & Kachlicki, P. (2010). LC-MSMS Profiling
of flavonoid conjugates in wild Mexican lupine Lupinus reflexus.
Journal of Natural Products, 73, 1254–1260.
Suzuki, H., Srinivasa Reddy, M. S., Naoumkina, M., et al. (2005).
Methyl jasmonate and yeast elicitor induce differential transcrip-
tional and metabolic re-programming in cell suspension cultures
of the model legume Medicago truncatula. Planta, 220, 696–707.
Treutter, D. (2006). Significance of flavonoids in plant resistance: a
review. Environmental Chemistry Letters, 4, 147–157.
van Etten, H. D., Mansfield, J. W., Bailey, J. A., & Farmer, E. E.
(1994). Two classes of plant antibiotics: phytoalexins versus
phytoanticipines. Plant Cell, 6, 1191–1192.
Veitch, N. C. (2009). Isoflavonoids of the Leguminosae. NaturalProducts Reports, 26, 776–802.
Wolpert, T. J., Dunkle, L. D., & Ciuffetti, L. M. (2002). Host-
selective toxins and avirulence determinants. What’s in a name?
Annual Review of Phytopathology, 40, 251–285.
Yu, R. X., Liu, J., True, N., & Wang, W. (2008). Identification ofdirect target genes using joint sequence and expression likeli-
hood with application to DAF-16. PLoS ONE, 3(3), e1821.
Zhang, J., Subramanian, S., Stacey, G., & Yu, O. (2009). Flavons and
flavonols play distinct critical roles during nodulation of
Medicago truncatula by Sinorhizobium meliloti. Plant Journal,57, 171–183.
Zhao, J., Huhman, D., Shadle, G., et al. (2011). MATE2 mediates
vacuolar sequestration of flavonoid glycosides and glycoside
malonates in Medicago truncatula. Plant Cell, 23, 1536–1555.
Secondary metabolite profiles after fungal infections 589
123