changes in money fund investments & regulations cpiwg meeting dtcc, jersey city, nj february 6,...
TRANSCRIPT

Changes in Money Fund Investments & Regulations
Changes in Money Fund Investments & Regulations
CPIWG MeetingDTCC, Jersey City, NJ
February 6, 2014
Peter Crane President & PublisherCrane Data LLC

2
Current State, Assets, Yields, Expenses
Portfolio Holdings Trends & Data
Regulatory Issues & Update
Miscellaneous, News
Questions & Discussion
Changes in Money Fund Investments & Regulations
Changes in Money Fund Investments & Regulations

Current State of Money Fund IndustryCurrent State of Money Fund Industry
MMF Assets $2.7 Trillion (Record was $3.9T)
– Bank Savings Over $6.5 Trillion
Approx. 27 Million Shareholders
$5 Billion in Annual Revenue (down from $11B)
Approx. 1/4 Share of “Cash” Markets
“Breaking the Buck,” Near-Death Experience
Shifting Regulatory & Competitive Landscape
Zero Yields, Attrition & Consolidation
Record Levels of Cash
3

4
History of Money Fund Assets History of Money Fund Assets
4
Money Funds Are Down $1.2 Trillion Over 5 Years (-31%), But Still at mid-’07 Levels.

Assets by Type: Prime Bottom & ReboundAssets by Type: Prime Bottom & Rebound
5

Banks Take $1+ Trillion From MMFsBanks Take $1+ Trillion From MMFs
6
Money Funds Are Down $.965T (-28.4%) Over 5 Yrs.; MMDAs Are Up $3.121T (+77.5%)

Rock Bottom Yields (Crane MFA 7-Day)Rock Bottom Yields (Crane MFA 7-Day)
7

Fund Expenses & Fee WaiversFund Expenses & Fee Waivers
8
Money Fund Revenue Estimates: $2.6 Trillion x 0.15% = $3.8 Billion (12/13); $3.1 Trillion x 0.35% = $8.4 Bil. (12/09)

Money Fund Market Share
(12/31/13)
Money Fund Market Share
(12/31/13)
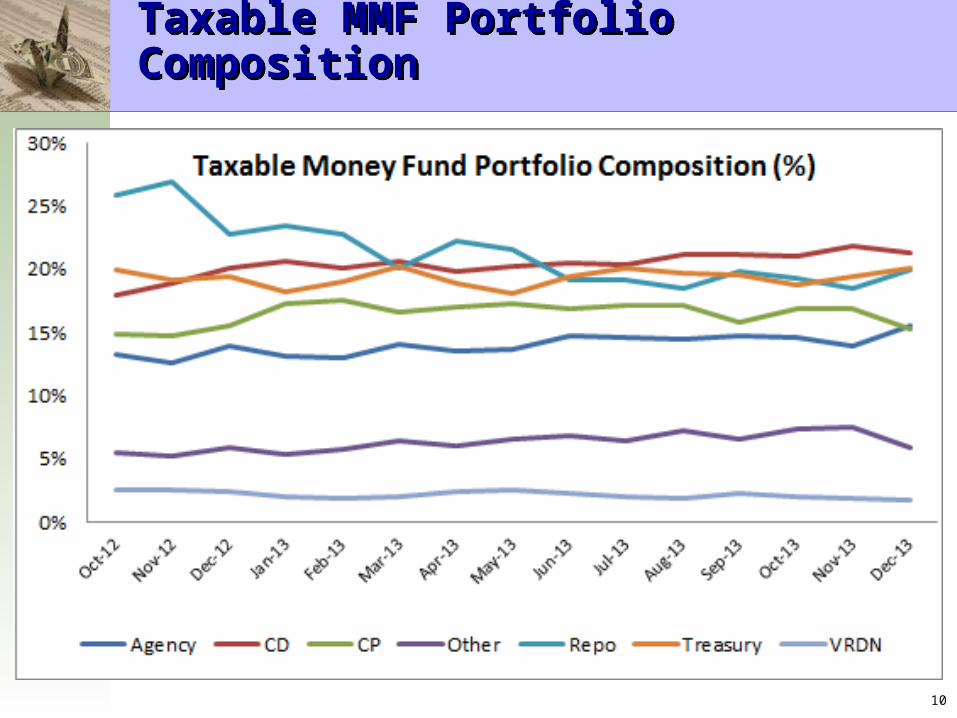
Taxable MMF Portfolio CompositionTaxable MMF Portfolio Composition
10

Securities, Supply & TransparencySecurities, Supply & Transparency
11

12
Largest Issuers & Largest CD & CPLargest Issuers & Largest CD & CP

13
Regulatory: SEC MMF Reform ProposalRegulatory: SEC MMF Reform Proposal
Rule 2a-7 Amendments (2/10)
President’s Working Grp (10/10)
SEC Cancels Vote (8/12)
FSOC Issues Draft (11/12)
SEC Reform Proposal (6/13)
Comment Letters Due (9/13)
Timeline of EventsTimeline of Events
Current ProposalsCurrent Proposals
Floating NAV (Prime Inst) or
Liquidity Fees/Gates (Prime)
2a-7 Tweaks, Buffer Gone
Final Rule March-June ‘14
Floating NAV & Gates Combo
Letters to Date
Predictions?Predictions?
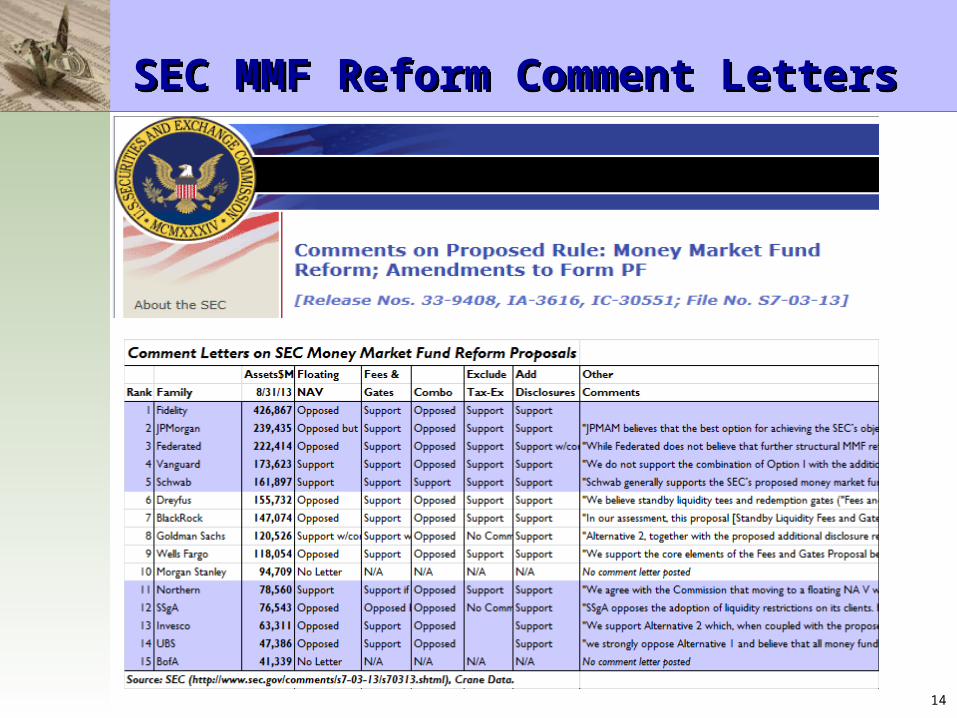
SEC MMF Reform Comment LettersSEC MMF Reform Comment Letters
14

15
Worldwide & Intl MF Markets ($4.7T)Worldwide & Intl MF Markets ($4.7T)
Dublin & Luxemburg (IMMFA) Domiciles
Source: ICI, Crane Data.

Online Money Fund Trading PortalsOnline Money Fund Trading Portals
Approx. $438 Billion in Assets
– 25% of Institutional MMFs’ $1.75T
AFP ‘13 Liquidity Survey
– 34% of Corps. Use Portals (46% of large cos.)
– 73% of Trades Via Portal? (old data)
Enhancements
– Adding MM Securities, TDs, Tools
– Transparency: Weekly, SMAs
New Entrants, Exits
17
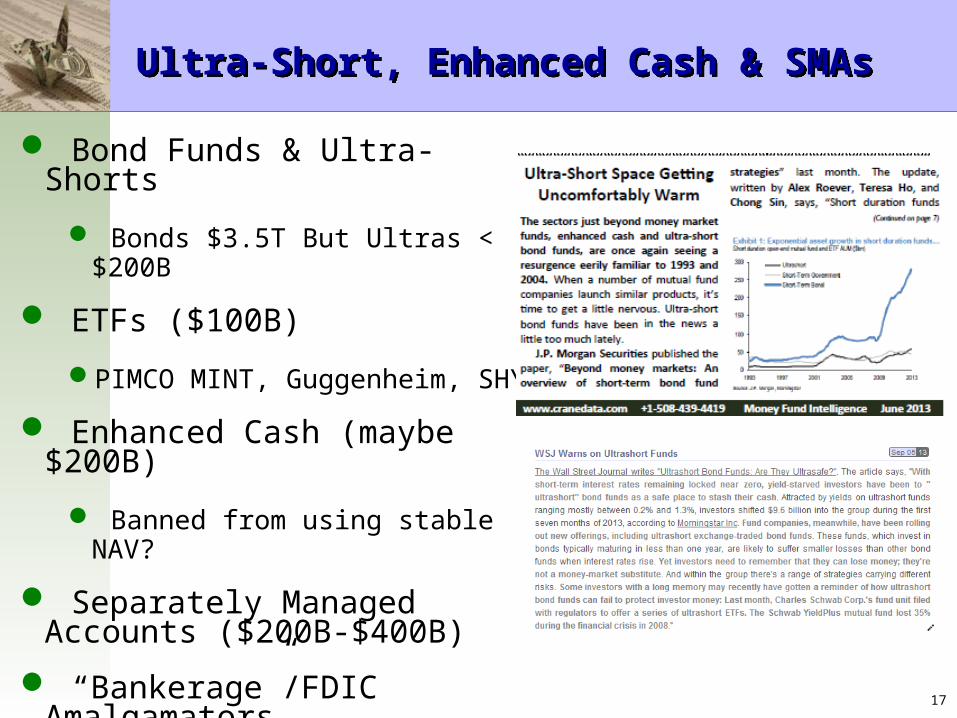
Ultra-Short, Enhanced Cash & SMAsUltra-Short, Enhanced Cash & SMAs
Bond Funds & Ultra-Shorts
Bonds $3.5T But Ultras < $200B
ETFs ($100B)
PIMCO MINT, Guggenheim, SHY
Enhanced Cash (maybe $200B)
Banned from using stable NAV?
Separately Managed Accounts ($200B-$400B)
“Bankerage”/FDIC Amalgamators
$400B + $200B?

18
Money Fund News; Q&AMoney Fund News; Q&A

19

20
Contact InfoContact Info