changes in frequency of precipitation types associated
TRANSCRIPT
Changes in Frequency of Precipitation Types Associated with Surface Air Temperatureover Northern Eurasia during 1936–90
HENGCHUN YE
Department of Geography and Urban Analysis, California State University, Los Angeles, Los Angeles, California
(Manuscript received 8 August 2007, in final form 28 April 2008)
ABSTRACT
Potential benefits or disadvantages of increasing precipitation in high-latitude regions under a warmingclimate are dependent on how and in what form the precipitation occurs. Precipitation frequency and typeare equally as important as quantity and intensity to understanding the seasonality of hydrological cyclesand the health of the ecosystem in high-latitude regions. This study uses daily historical synoptic observationrecords during 1936–90 over the former USSR to reveal associations between the frequency of precipitationtypes (rainfall, snowfall, mixed solid and liquid, and wet days of all types) and surface air temperatures todetermine potential changes in precipitation characteristics under a warming climate. Results from thisparticular study show that the frequency of precipitation of all types generally increases with air tempera-ture during winter. However, both solid and liquid precipitation days predominantly decrease with airtemperature during spring with a reduction in snowfall days being most significant. During autumn, snowfalldays decrease while rainfall days increase resulting in overall decreases in wet days as air temperatureincreases. The data also reveal that, as snowfall days increase in relationship to increasing air temperatures,this increase may level out or even decrease as mean surface air temperature exceeds �8°C in winter. Inspring and autumn, increasing rainfall days switch to decreasing when the mean surface air temperaturegoes above 6°C. The conclusion of this study is that changes in the frequency of precipitation types arehighly dependent on the location’s air temperature and that threshold temperatures exist beyond whichchanges in an opposite direction occur.
1. Introduction
Common sense seems to tell us that, when air tem-perature increases, more snow will become rain andthus snowfall days will decrease and rainfall days willincrease. Owing to the complexity of the climate systemand its feedback processes, the relationship betweenprecipitation types and frequency may not be as simplepreviously thought, especially in high-latitude regionswhere air temperatures frequently stay below the freez-ing point during the cold season. Studies of wintersnowfall amount in high-latitude regions suggest thatsnowfall increases with air temperature as long as airtemperature stays below a certain point depending onthe geographical location (Davies et al. 1999; Ye andMather 1997). Studies have also found that snow hasprovided a declining proportion of total annual precipi-
tation in southern Canada, western Siberia, and En-gland, but no changes have been found in regions northof 55°N under a warming climate (Huntington et al.2004; Trenberth et al. 2007). Furthermore, changes inprecipitation amount do not necessarily go in the samedirection as changes in frequency of wet days since thefrequency and intensity of heavy precipitation accountfor a larger share of change as air temperature in-creases.
Studies of precipitation change under a warming cli-mate over the Arctic region have mostly consisted oftrend analyses of total precipitation (Groisman et al.1999; Serreze et al. 2000; Ye 2001a), snow accumulation(Brown and Braaten 1998; Ye 2001b; Ye et al. 1998),and high-intensity rainfall days (Groisman et al. 2005;Khon et al. 2007; Semenov and Bengtsson 2002). Mostof these trend studies assumed that air temperature hasincreased significantly and thus trends are likely to beassociated with a warming climate during the study pe-riod of their research. A recent study by Groisman et al.(2006) indicated that the outcome of their trend analy-sis was really dependent on the time period they stud-
Corresponding author address: Hengchun Ye, Department ofGeography and Urban Analysis, California State University, LosAngeles, Los Angeles, CA 90032-8222.E-mail: [email protected]
15 NOVEMBER 2008 Y E 5807
DOI: 10.1175/2008JCLI2181.1
© 2008 American Meteorological Society
JCLI2181
Unauthenticated | Downloaded 03/16/22 01:50 AM UTC
ied over northern Eurasia during which warming didnot materialize until recent decades. For example, if westudy trends over northern Eurasia for the time periodfrom 1951 to 1995, increases in air temperature are sig-nificant; however, warming is not evident if we examinethem for the time period of 1936–95. With the dramaticreduction in weather stations starting in the early 1990swhen the former USSR disintegrated (Groisman et al.2006), a threat was posed to trend analyses due to prob-lems in spatial coverage and thus the continuity of thetime series.
Confidence in the validity of the warming trend overthe Arctic in recent decades and the future has becomevery high in the scientific community based on over-whelming observational evidence and the projections ofclimate models (Alley et al. 2007). An alternative wayto examine potential changes in certain environmentalparameters is to examine their relationships with airtemperature, especially in regions where there areproblems with data continuity during recent decadeswhen significant warming has occurred. Of course, thismethod is based on an assumption that the relationshipbetween these parameters and air temperatures willstay the same in the future and that relationships de-rived from studies in one location will be applicable inanother. Although this is not a perfect scientific as-sumption, past relationships do provide valuable infor-mation about the future and can be used to provideinsights into potential changes in the future. This isespecially true if large geographical regions are exam-ined and the relationships between different localitieswith different climate conditions are compared.
Some studies have used the outputs of climate modelsimulations to describe potential changes under awarming climate. For example, the global climatemodel output under anthropogenic forcing scenariossuggests increases in precipitation frequency, amount,and intensity during winter over four major river basinsin northern Eurasia (Khon et al. 2007). Increases inprecipitation and precipitation intensity during winterin Europe are predicted during the years of 2071–2100based on the Intergovernmental Panel on ClimateChange (IPCC) A2 and B2 emissions scenarios (Giorgiet al. 2004) and disproportional increases in heavy pre-cipitation events for 2000–99 using the ECHAM4/Ocean Isopycnal Model (OPYC3) (Semenov andBengtsson 2002). But models are still not ideal for pre-dicting realistic snow conditions and thus are not satis-factory for separating solid from liquid precipitationtypes accurately (Frei et al. 2003; Roesch and Roechner2006). Given the significance of snow to regulating theenergy budget and hydrological cycles over Arctic land
surfaces, changes in the frequency of solid precipitationunder a warming climate require special attention.
This study uses historical synoptic observationrecords over the former Soviet Union to examinechanges in snowfall days, rainfall days, mixed-phaseprecipitation days, and wet days (including all forms ofprecipitation) associated with surface air temperaturesduring 1936–90.
2. Data and methodology
The synoptic weather data are from the 6- and3-hourly meteorological observations from 223 USSRstations available at the Carbon Dioxide InformationAnalysis Center (CDIAC), Oak Ridge National Labo-ratory, Oak Ridge, Tennessee (ORNL/CDIAC-180,NDP-048/R1; http://cdiac.esd.ornl.gov). Each stationrecord consists of 6- (1936–65) and 3-hourly (1966–90)observations of 24 meteorological variables includingair temperature, past and present weather type, pre-cipitation amount, cloud amount and type, sea levelpressure, relative humidity, and wind speed and di-rection. The data have undergone extensive quality as-surance by the All-Russian Research Institute of Hy-drometeorological Information–World Data Centre(RIHMI-WDC), the National Climatic Data Center(NCDC), and the CDIAC (Razuvaev et al. 1995). Thechanges in observation times through the two differenttime periods (before and after 1966) have been ad-justed based on station time zone.
Snowfall, rainfall, mixed-phase precipitation, and wetdays are extracted based on weather codes recorded forthe observation time and during the preceding hour.Using weather codes based on visual observationsavoids precipitation data problems associated with wet-ting losses, changes in the definition of trace precipita-tion, and instrumentation changes over the study re-gion. Snowfall days include any day on which any formof solid precipitation including snow, ice pellets (orsleet), snow showers, and diamond dust, but not hail,has fallen. Rainfall days include any day on which anyform of liquid precipitation falls, including drizzle, rain,showers, freezing rain, and thunderstorms associatedwith liquid products. Any types of mixed solid and liq-uid precipitation are not included in either the rain orsnow category; instead, they are grouped into a mixed-phase precipitation category that also includes days onwhich both solid and liquid precipitation were observedduring different observation hours in the study. For wetdays, all forms of precipitation are included.
To stay consistent with the number of observationsper day, only four observations per day are usedthroughout the study time period. Thus, for the later
5808 J O U R N A L O F C L I M A T E VOLUME 21
Unauthenticated | Downloaded 03/16/22 01:50 AM UTC
period starting in 1966, only the four observations thatoccurred closest to the observation times in previousyears are used. If there is one observation showingsnow or rain, the day is considered as a snow or rainday. There are a very small number of days duringwhich both snow and rain occurred at different obser-vation times; these days are counted as both snowfalland rainfall days and also counted as mixed-phase pre-cipitation days. Wet days are defined as any day duringwhich any form of precipitation was recorded for atleast one of the four observations. Each category ofprecipitation type is extracted from the original datasetindependently.
The number of days falling into each category ofsnow, rain, mixed phase, and wet are totaled for eachmonth and then grouped into three seasons: winter[December–February (DJF)], spring [March–June(MAMJ) to include all snowfall events in late spring],and fall [September–November (SON)]. If there is oneday that has missing weather records, that season isconsidered missing. Among these 223 original stations,80 stations are retained for analyses based on the cri-teria that they have quality data starting no later than1940–41. The number of missing years for snowfall daysranges from 1–14 for winter, 2–16 for spring, and 2–14for fall. The number of missing years for rainfall daysranges from 2–15 for winter and spring and 2–16 for fallduring the 55 years of the study period.
Daily air temperature—measured at 2 m AGL—isaveraged from the same four observation times. If thereis one observation missing, the day is considered asmissing and, if more than 10% of observations are miss-ing, the monthly and, thus, seasonal mean temperatureis considered as missing.
Correlation analysis is applied to each station be-tween each category of precipitation days and air tem-perature for each season and the statistical significancelevel is determined based on sample size. The rate ofchange is determined based on simple linear regressionanalysis (von Storch and Zwiers 1999) with precipita-tion days as a dependent variable and air temperaturean independent variable. The coefficient of the sloperepresents the rate of precipitation day change per eachdegree of air temperature increase for the study timeperiod. A scatterplot of correlation coefficients/rates ofchange versus seasonal air temperature is produced forall stations to reveal changes in the relationships basedon air temperature conditions across the study region.
To further examine the possible shift from solid toliquid precipitation associated with air temperaturechange during spring and fall, days are classified intotwo groups based on the daily mean air temperature foreach season. Since the critical temperature range for a
possible switch from solid to liquid form is from �5°Cto �5°C, group 1 only includes days in which meandaily air temperature falls within that range in order tostudy the relationships between both snowfall and rain-fall days and air temperature. Group 2 only includesdays on which mean daily air temperature is higherthan 5°C to study the relationship between changes inrainfall days and air temperature. Since the total num-ber of days for each group in each season varies fromone year to the next, the extracted number of snowfall/rainfall days from each group is divided by the totaldays in the group of the corresponding season and mul-tiplied by 100 to standardize the data. Therefore, thesnowfall/rainfall days derived for each group is actuallythe percentage of days on which snowfall/rainfall oc-curred for each group in each season. Then the snow-fall/rainfall days are correlated with mean seasonal airtemperatures averaged from the corresponding group.In addition, analyses are applied to combined springand fall seasons for each group to test if results aresensitive to the sample sizes and further confirm thefindings.
3. Results
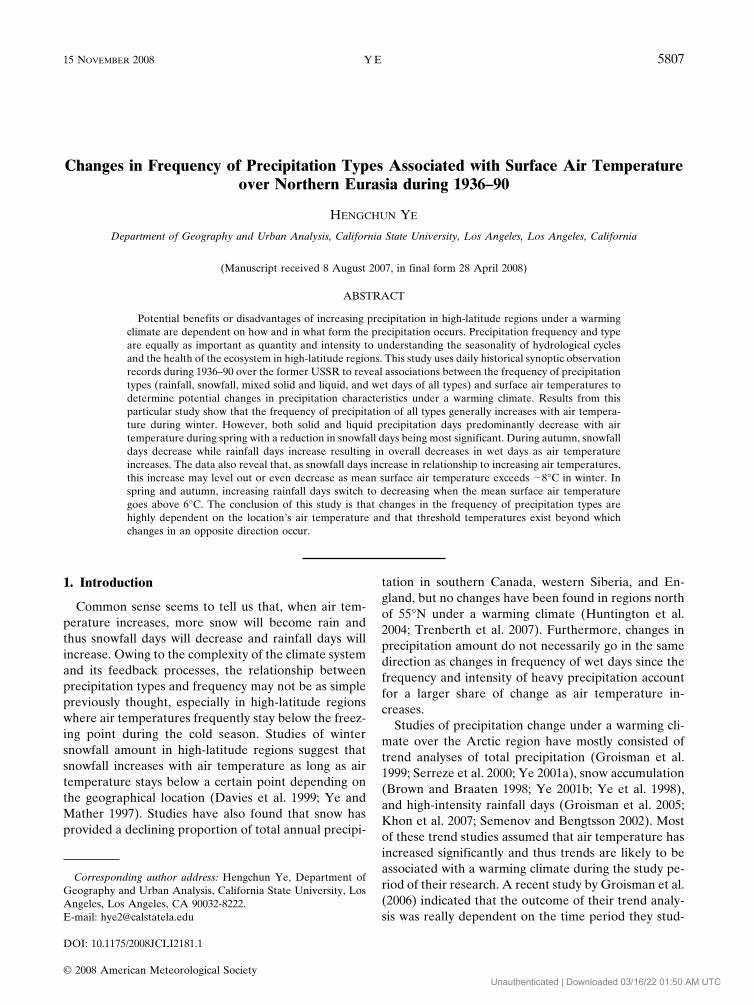
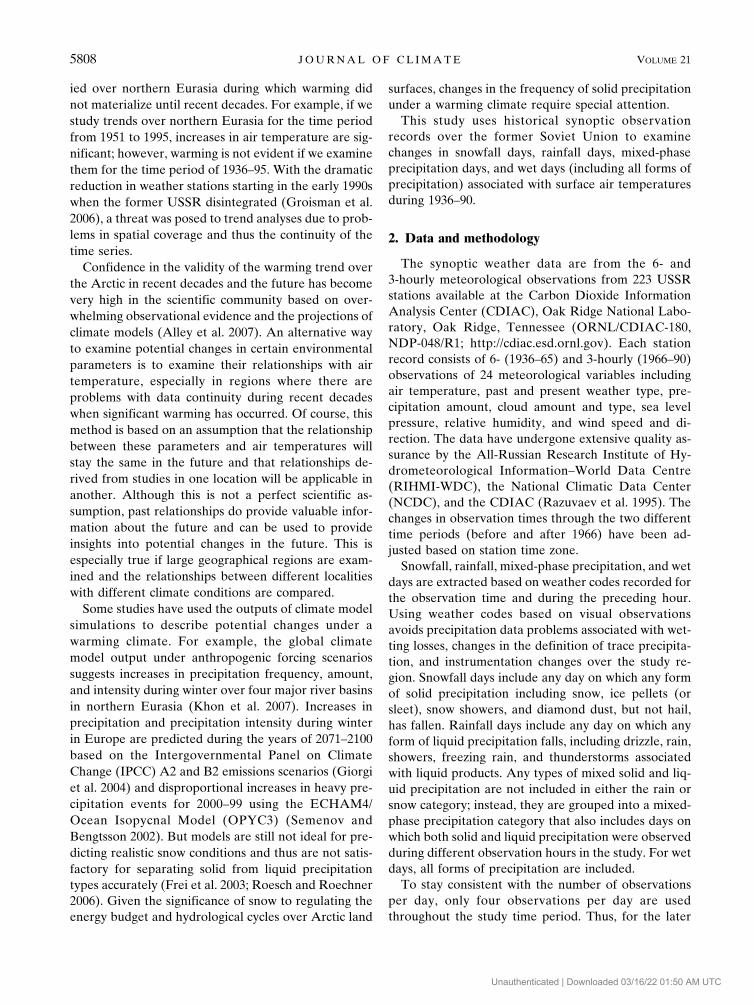
Seasonal mean total snowfall and rainfall days areshown in Fig. 1. Snowfall days increase from south tonorth in accordance with decreasing distance to theArctic Ocean in combination with air temperature dis-tributions. Snowfall days range from 20 to 65 days forthe winter three months (Fig. 1a), 10 to 70 days for thefour spring months (Fig. 1b), and 10 to 55 days for thethree autumn months (Fig. 1c). The number of rainfalldays increases toward the west with the largest numberoccurring over European Russia. During winter, thereare very few rainfall days—fewer than 2 days over Si-beria and 2–6 over European Russia. Rainfall increasesquickly toward the westernmost stations in the studyregion (Fig. 1d). During spring, rainfall days range from12 to 28 days, the highest number occurring over Eu-ropean Russia (Fig. 1e). During autumn, rainfall daysrange from 6 to 36 days (Fig. 1f). Mixed-phase precipi-tation days range from 1 to 3 days in Siberia and aremostly 6–9 days over European Russia during winter(Fig. 2a). During spring, the mixed-phase days increaseto 3–11 days in Siberia and 4–13 days over EuropeanRussia (Fig. 2b). There were 3–9 mixed-phase days overSiberia and 3–12 over European Russia during autumn(Fig. 2c). Wet day distributions generally follow that ofsnowfall days. In winter, the number of wet days is verysimilar to that of snow days over Siberia, but it reaches70 over northern European Russia (Fig. 2d). Duringspring, wet days range from 20 to 80 days (Fig. 2e) and,during autumn, 20 to 70 wet days (Fig. 2f).
15 NOVEMBER 2008 Y E 5809
Unauthenticated | Downloaded 03/16/22 01:50 AM UTC
FIG. 1. Mean snowfall and rainfall day distribution over the study region for winter (DJF), spring (MAMJ), and autumn (SON)during the time period 1936–90. Circles indicate weather station locations.
FIG. 2. As in Fig. 2 but for mixed-phase days and wet days.
5810 J O U R N A L O F C L I M A T E VOLUME 21
Unauthenticated | Downloaded 03/16/22 01:50 AM UTC
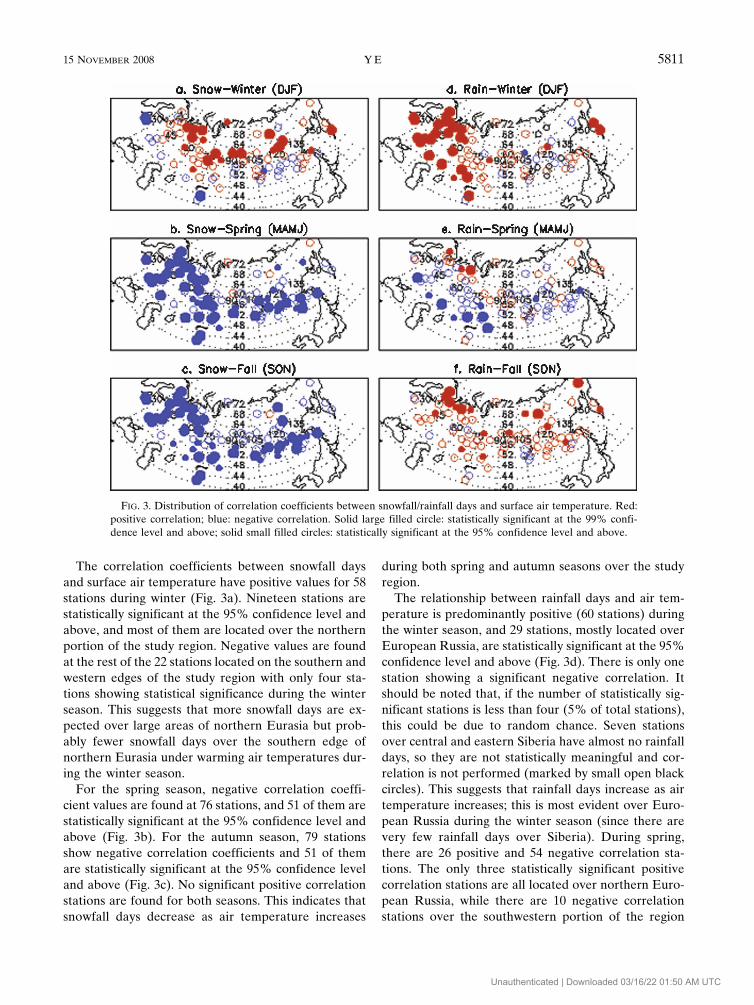
The correlation coefficients between snowfall daysand surface air temperature have positive values for 58stations during winter (Fig. 3a). Nineteen stations arestatistically significant at the 95% confidence level andabove, and most of them are located over the northernportion of the study region. Negative values are foundat the rest of the 22 stations located on the southern andwestern edges of the study region with only four sta-tions showing statistical significance during the winterseason. This suggests that more snowfall days are ex-pected over large areas of northern Eurasia but prob-ably fewer snowfall days over the southern edge ofnorthern Eurasia under warming air temperatures dur-ing the winter season.
For the spring season, negative correlation coeffi-cient values are found at 76 stations, and 51 of them arestatistically significant at the 95% confidence level andabove (Fig. 3b). For the autumn season, 79 stationsshow negative correlation coefficients and 51 of themare statistically significant at the 95% confidence leveland above (Fig. 3c). No significant positive correlationstations are found for both seasons. This indicates thatsnowfall days decrease as air temperature increases
during both spring and autumn seasons over the studyregion.
The relationship between rainfall days and air tem-perature is predominantly positive (60 stations) duringthe winter season, and 29 stations, mostly located overEuropean Russia, are statistically significant at the 95%confidence level and above (Fig. 3d). There is only onestation showing a significant negative correlation. Itshould be noted that, if the number of statistically sig-nificant stations is less than four (5% of total stations),this could be due to random chance. Seven stationsover central and eastern Siberia have almost no rainfalldays, so they are not statistically meaningful and cor-relation is not performed (marked by small open blackcircles). This suggests that rainfall days increase as airtemperature increases; this is most evident over Euro-pean Russia during the winter season (since there arevery few rainfall days over Siberia). During spring,there are 26 positive and 54 negative correlation sta-tions. The only three statistically significant positivecorrelation stations are all located over northern Euro-pean Russia, while there are 10 negative correlationstations over the southwestern portion of the region
FIG. 3. Distribution of correlation coefficients between snowfall/rainfall days and surface air temperature. Red:positive correlation; blue: negative correlation. Solid large filled circle: statistically significant at the 99% confi-dence level and above; solid small filled circles: statistically significant at the 95% confidence level and above.
15 NOVEMBER 2008 Y E 5811
Fig 3 live 4/C
Unauthenticated | Downloaded 03/16/22 01:50 AM UTC
(Fig. 3e). For the autumn season, correlation is positiveat most stations (70 stations), although only 17 are sta-tistically significant and are located mostly over thehigher-latitude regions of the region (Fig. 3f).
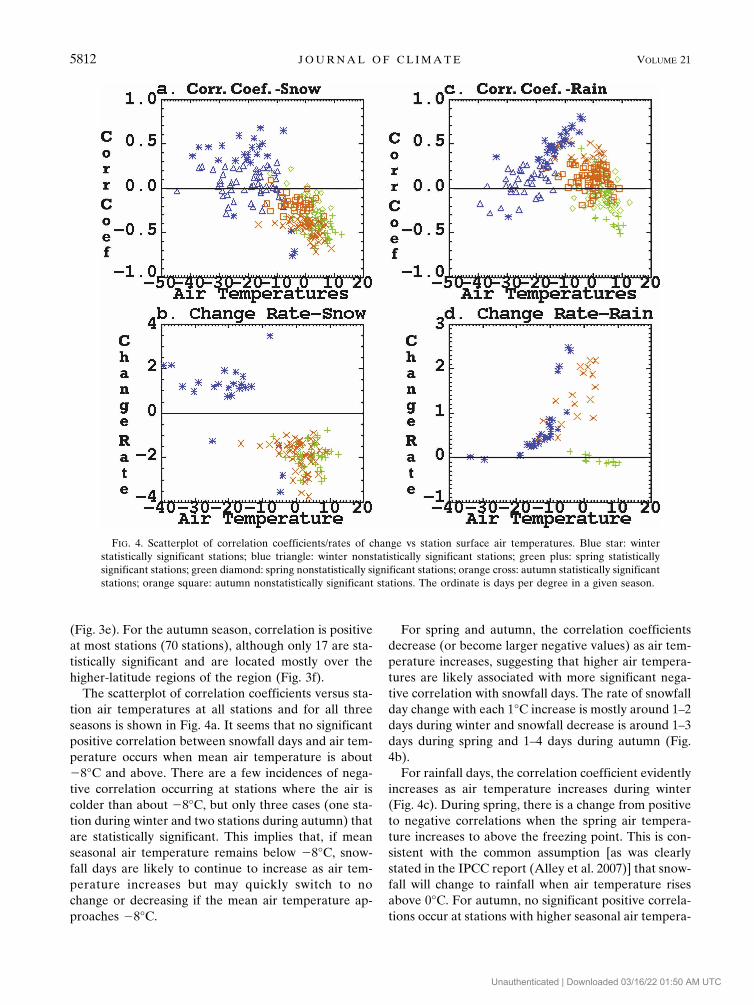
The scatterplot of correlation coefficients versus sta-tion air temperatures at all stations and for all threeseasons is shown in Fig. 4a. It seems that no significantpositive correlation between snowfall days and air tem-perature occurs when mean air temperature is about�8°C and above. There are a few incidences of nega-tive correlation occurring at stations where the air iscolder than about �8°C, but only three cases (one sta-tion during winter and two stations during autumn) thatare statistically significant. This implies that, if meanseasonal air temperature remains below �8°C, snow-fall days are likely to continue to increase as air tem-perature increases but may quickly switch to nochange or decreasing if the mean air temperature ap-proaches �8°C.
For spring and autumn, the correlation coefficientsdecrease (or become larger negative values) as air tem-perature increases, suggesting that higher air tempera-tures are likely associated with more significant nega-tive correlation with snowfall days. The rate of snowfallday change with each 1°C increase is mostly around 1–2days during winter and snowfall decrease is around 1–3days during spring and 1–4 days during autumn (Fig.4b).
For rainfall days, the correlation coefficient evidentlyincreases as air temperature increases during winter(Fig. 4c). During spring, there is a change from positiveto negative correlations when the spring air tempera-ture increases to above the freezing point. This is con-sistent with the common assumption [as was clearlystated in the IPCC report (Alley et al. 2007)] that snow-fall will change to rainfall when air temperature risesabove 0°C. For autumn, no significant positive correla-tions occur at stations with higher seasonal air tempera-
FIG. 4. Scatterplot of correlation coefficients/rates of change vs station surface air temperatures. Blue star: winterstatistically significant stations; blue triangle: winter nonstatistically significant stations; green plus: spring statisticallysignificant stations; green diamond: spring nonstatistically significant stations; orange cross: autumn statistically significantstations; orange square: autumn nonstatistically significant stations. The ordinate is days per degree in a given season.
5812 J O U R N A L O F C L I M A T E VOLUME 21
Fig 4 live 4/C
Unauthenticated | Downloaded 03/16/22 01:50 AM UTC
tures of about 8°C or above. All of these positive andnegative signs are consistent with the geographical dis-tribution of the stations shown in Fig. 3.
The rate of rainfall day change increases quickly asair temperature increases during winter from near 0 to2.5 days per 1°C temperature increase (Fig. 4d). Forautumn, it increases from 0.5 to 2.5 days per 1°C tem-perature increase. For spring, the rate of rainfall daydecrease is very small, less than 0.5 days per 1°C tem-perature increase, but the magnitude seems to increaseslightly as air temperature increases. Once the rate ofchange is divided by the mean number of rainfall days,the trend disappears (not shown).
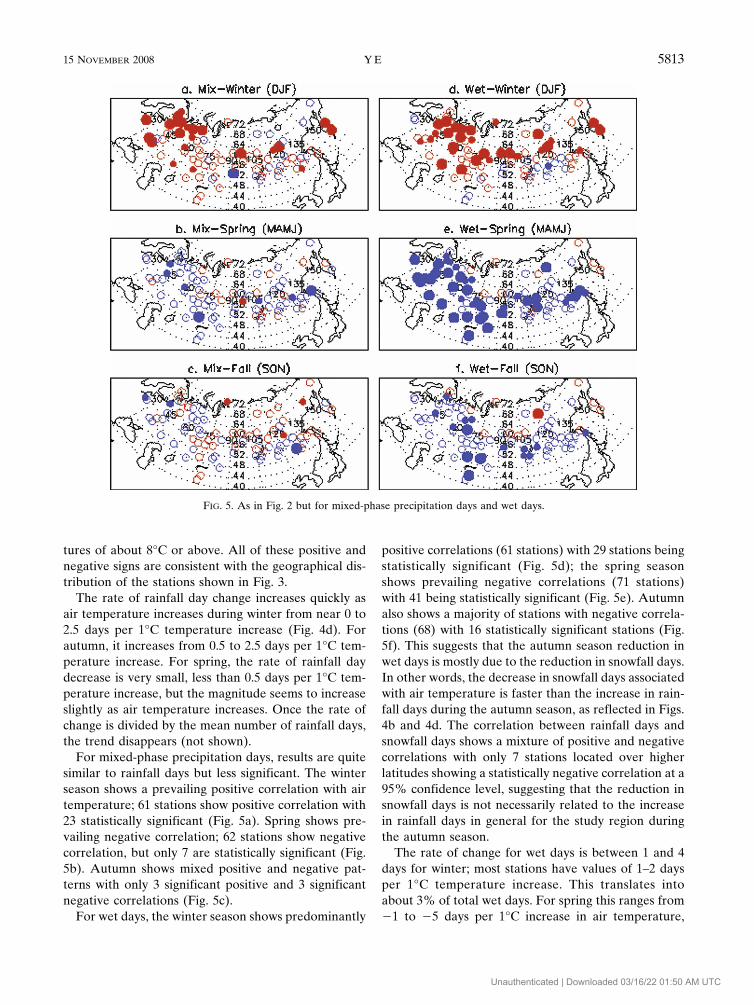
For mixed-phase precipitation days, results are quitesimilar to rainfall days but less significant. The winterseason shows a prevailing positive correlation with airtemperature; 61 stations show positive correlation with23 statistically significant (Fig. 5a). Spring shows pre-vailing negative correlation; 62 stations show negativecorrelation, but only 7 are statistically significant (Fig.5b). Autumn shows mixed positive and negative pat-terns with only 3 significant positive and 3 significantnegative correlations (Fig. 5c).
For wet days, the winter season shows predominantly
positive correlations (61 stations) with 29 stations beingstatistically significant (Fig. 5d); the spring seasonshows prevailing negative correlations (71 stations)with 41 being statistically significant (Fig. 5e). Autumnalso shows a majority of stations with negative correla-tions (68) with 16 statistically significant stations (Fig.5f). This suggests that the autumn season reduction inwet days is mostly due to the reduction in snowfall days.In other words, the decrease in snowfall days associatedwith air temperature is faster than the increase in rain-fall days during the autumn season, as reflected in Figs.4b and 4d. The correlation between rainfall days andsnowfall days shows a mixture of positive and negativecorrelations with only 7 stations located over higherlatitudes showing a statistically negative correlation at a95% confidence level, suggesting that the reduction insnowfall days is not necessarily related to the increasein rainfall days in general for the study region duringthe autumn season.
The rate of change for wet days is between 1 and 4days for winter; most stations have values of 1–2 daysper 1°C temperature increase. This translates intoabout 3% of total wet days. For spring this ranges from�1 to �5 days per 1°C increase in air temperature,
FIG. 5. As in Fig. 2 but for mixed-phase precipitation days and wet days.
15 NOVEMBER 2008 Y E 5813
Fig 5 live 4/C
Unauthenticated | Downloaded 03/16/22 01:50 AM UTC
translating to about �7% wet days. For the autumn therate ranges from �1 to �3 days with most stations hav-ing between �1 and �2 days corresponding to about�5% of wet days per 1°C increase in air temperature.
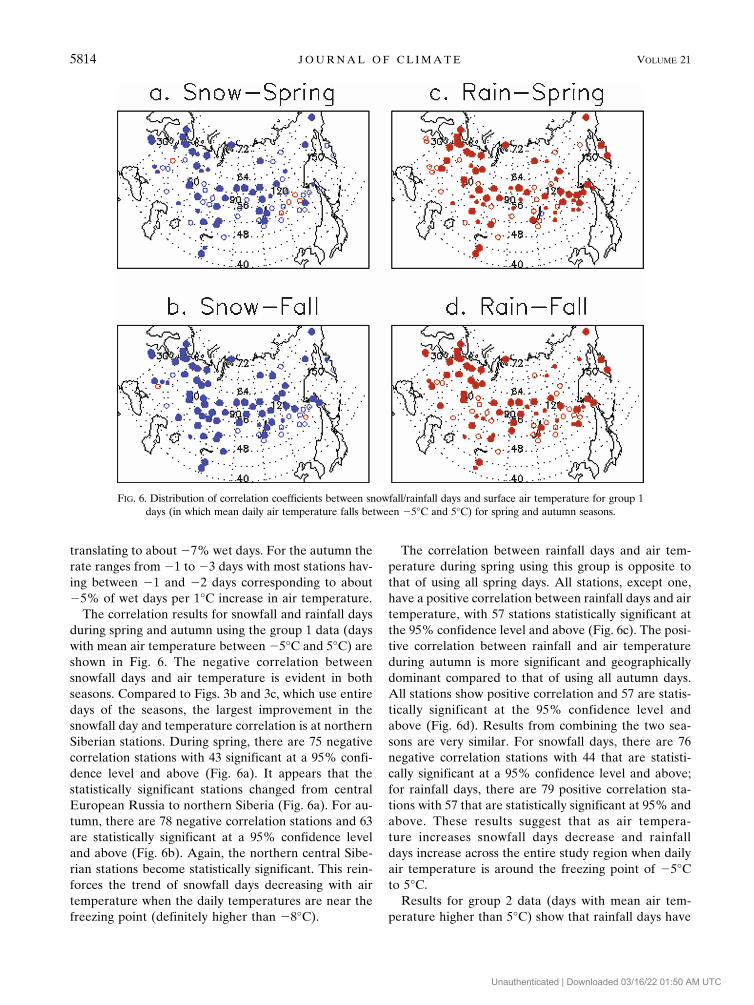
The correlation results for snowfall and rainfall daysduring spring and autumn using the group 1 data (dayswith mean air temperature between �5°C and 5°C) areshown in Fig. 6. The negative correlation betweensnowfall days and air temperature is evident in bothseasons. Compared to Figs. 3b and 3c, which use entiredays of the seasons, the largest improvement in thesnowfall day and temperature correlation is at northernSiberian stations. During spring, there are 75 negativecorrelation stations with 43 significant at a 95% confi-dence level and above (Fig. 6a). It appears that thestatistically significant stations changed from centralEuropean Russia to northern Siberia (Fig. 6a). For au-tumn, there are 78 negative correlation stations and 63are statistically significant at a 95% confidence leveland above (Fig. 6b). Again, the northern central Sibe-rian stations become statistically significant. This rein-forces the trend of snowfall days decreasing with airtemperature when the daily temperatures are near thefreezing point (definitely higher than �8°C).
The correlation between rainfall days and air tem-perature during spring using this group is opposite tothat of using all spring days. All stations, except one,have a positive correlation between rainfall days and airtemperature, with 57 stations statistically significant atthe 95% confidence level and above (Fig. 6c). The posi-tive correlation between rainfall and air temperatureduring autumn is more significant and geographicallydominant compared to that of using all autumn days.All stations show positive correlation and 57 are statis-tically significant at the 95% confidence level andabove (Fig. 6d). Results from combining the two sea-sons are very similar. For snowfall days, there are 76negative correlation stations with 44 that are statisti-cally significant at a 95% confidence level and above;for rainfall days, there are 79 positive correlation sta-tions with 57 that are statistically significant at 95% andabove. These results suggest that as air tempera-ture increases snowfall days decrease and rainfalldays increase across the entire study region when dailyair temperature is around the freezing point of �5°Cto 5°C.
Results for group 2 data (days with mean air tem-perature higher than 5°C) show that rainfall days have
FIG. 6. Distribution of correlation coefficients between snowfall/rainfall days and surface air temperature for group 1days (in which mean daily air temperature falls between �5°C and 5°C) for spring and autumn seasons.
5814 J O U R N A L O F C L I M A T E VOLUME 21
Fig 6 live 4/C
Unauthenticated | Downloaded 03/16/22 01:50 AM UTC
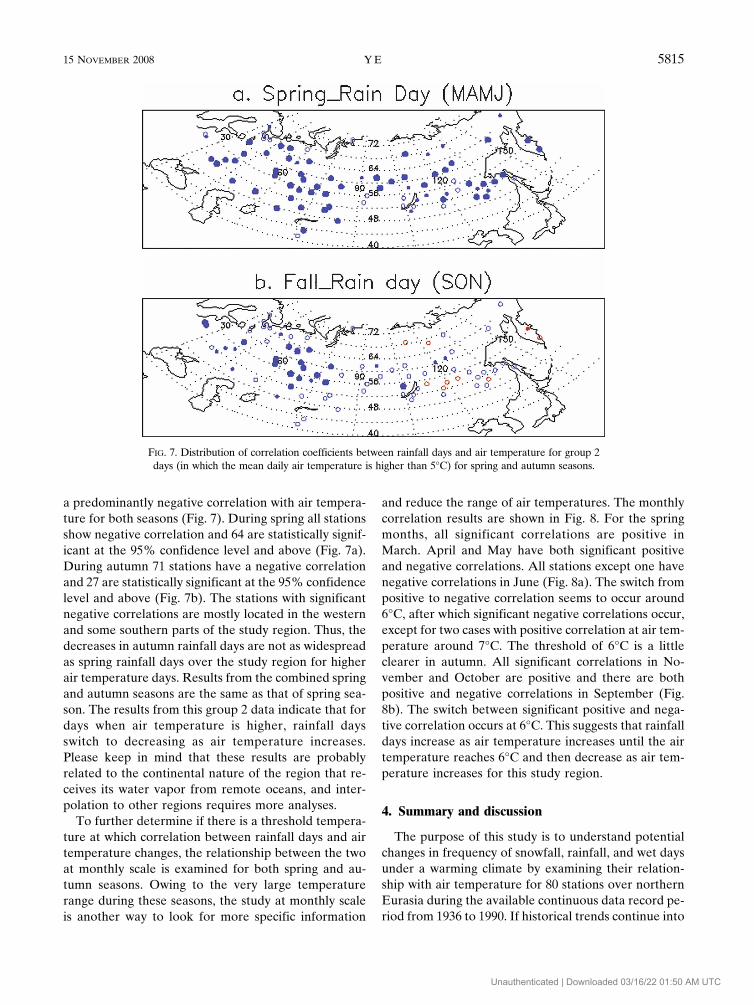
a predominantly negative correlation with air tempera-ture for both seasons (Fig. 7). During spring all stationsshow negative correlation and 64 are statistically signif-icant at the 95% confidence level and above (Fig. 7a).During autumn 71 stations have a negative correlationand 27 are statistically significant at the 95% confidencelevel and above (Fig. 7b). The stations with significantnegative correlations are mostly located in the westernand some southern parts of the study region. Thus, thedecreases in autumn rainfall days are not as widespreadas spring rainfall days over the study region for higherair temperature days. Results from the combined springand autumn seasons are the same as that of spring sea-son. The results from this group 2 data indicate that fordays when air temperature is higher, rainfall daysswitch to decreasing as air temperature increases.Please keep in mind that these results are probablyrelated to the continental nature of the region that re-ceives its water vapor from remote oceans, and inter-polation to other regions requires more analyses.
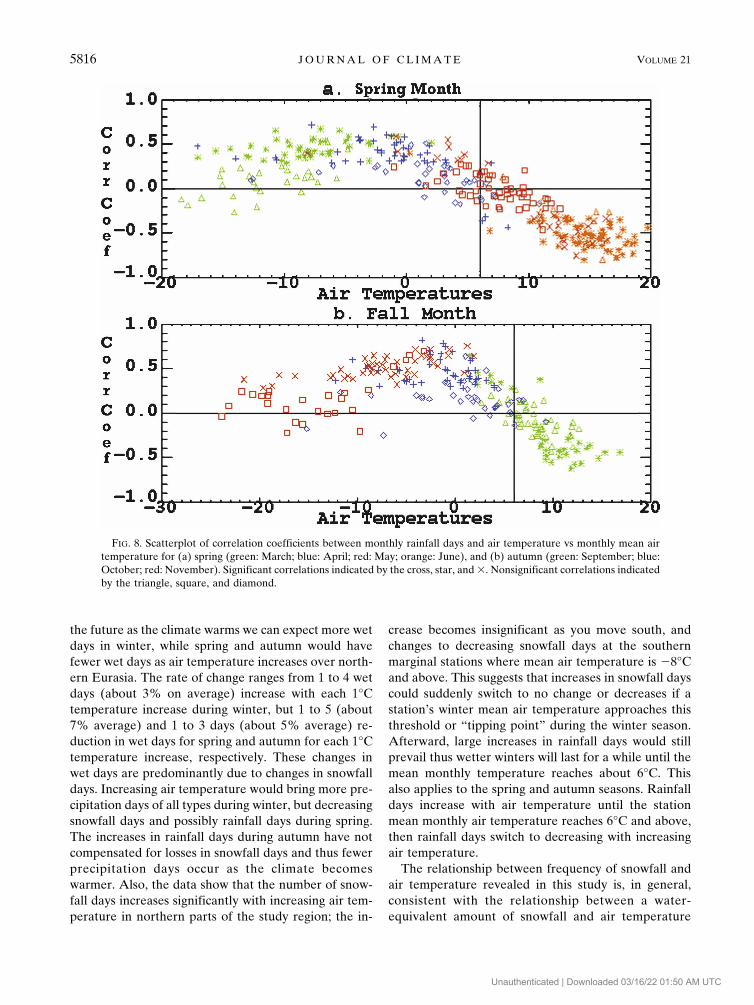
To further determine if there is a threshold tempera-ture at which correlation between rainfall days and airtemperature changes, the relationship between the twoat monthly scale is examined for both spring and au-tumn seasons. Owing to the very large temperaturerange during these seasons, the study at monthly scaleis another way to look for more specific information
and reduce the range of air temperatures. The monthlycorrelation results are shown in Fig. 8. For the springmonths, all significant correlations are positive inMarch. April and May have both significant positiveand negative correlations. All stations except one havenegative correlations in June (Fig. 8a). The switch frompositive to negative correlation seems to occur around6°C, after which significant negative correlations occur,except for two cases with positive correlation at air tem-perature around 7°C. The threshold of 6°C is a littleclearer in autumn. All significant correlations in No-vember and October are positive and there are bothpositive and negative correlations in September (Fig.8b). The switch between significant positive and nega-tive correlation occurs at 6°C. This suggests that rainfalldays increase as air temperature increases until the airtemperature reaches 6°C and then decrease as air tem-perature increases for this study region.
4. Summary and discussion
The purpose of this study is to understand potentialchanges in frequency of snowfall, rainfall, and wet daysunder a warming climate by examining their relation-ship with air temperature for 80 stations over northernEurasia during the available continuous data record pe-riod from 1936 to 1990. If historical trends continue into
FIG. 7. Distribution of correlation coefficients between rainfall days and air temperature for group 2days (in which the mean daily air temperature is higher than 5°C) for spring and autumn seasons.
15 NOVEMBER 2008 Y E 5815
Fig 7 live 4/C
Unauthenticated | Downloaded 03/16/22 01:50 AM UTC
the future as the climate warms we can expect more wetdays in winter, while spring and autumn would havefewer wet days as air temperature increases over north-ern Eurasia. The rate of change ranges from 1 to 4 wetdays (about 3% on average) increase with each 1°Ctemperature increase during winter, but 1 to 5 (about7% average) and 1 to 3 days (about 5% average) re-duction in wet days for spring and autumn for each 1°Ctemperature increase, respectively. These changes inwet days are predominantly due to changes in snowfalldays. Increasing air temperature would bring more pre-cipitation days of all types during winter, but decreasingsnowfall days and possibly rainfall days during spring.The increases in rainfall days during autumn have notcompensated for losses in snowfall days and thus fewerprecipitation days occur as the climate becomeswarmer. Also, the data show that the number of snow-fall days increases significantly with increasing air tem-perature in northern parts of the study region; the in-
crease becomes insignificant as you move south, andchanges to decreasing snowfall days at the southernmarginal stations where mean air temperature is �8°Cand above. This suggests that increases in snowfall dayscould suddenly switch to no change or decreases if astation’s winter mean air temperature approaches thisthreshold or “tipping point” during the winter season.Afterward, large increases in rainfall days would stillprevail thus wetter winters will last for a while until themean monthly temperature reaches about 6°C. Thisalso applies to the spring and autumn seasons. Rainfalldays increase with air temperature until the stationmean monthly air temperature reaches 6°C and above,then rainfall days switch to decreasing with increasingair temperature.
The relationship between frequency of snowfall andair temperature revealed in this study is, in general,consistent with the relationship between a water-equivalent amount of snowfall and air temperature
FIG. 8. Scatterplot of correlation coefficients between monthly rainfall days and air temperature vs monthly mean airtemperature for (a) spring (green: March; blue: April; red: May; orange: June), and (b) autumn (green: September; blue:October; red: November). Significant correlations indicated by the cross, star, and �. Nonsignificant correlations indicatedby the triangle, square, and diamond.
5816 J O U R N A L O F C L I M A T E VOLUME 21
Fig 8 live 4/C
Unauthenticated | Downloaded 03/16/22 01:50 AM UTC
found in Canada (Davis et al. 1999). Davis et al. re-vealed that increasing snowfall amounts with increasingair temperature switches to decreasing when the meanJanuary air temperature goes above about �7°C at sta-tions over eastern Canada and the west coast, but therelationships are more complex at stations located inthe lee of the Rockies (where threshold temperaturesare lower). In this study, over northern Eurasia, thehighest winter-mean air temperature at stations with asignificant positive correlation is �7.8°C and the lowestwinter mean at stations with a significant negative cor-relation is �5.1°C. The cutoff at �8°C is based more onwhere the positive correlation ends than where thenegative correlation starts. Thus the threshold tempera-ture of transition could be in a range between �8°C and�6°C and could be defined more precisely if there weremore statistically significant stations falling into thisrange. The shift in direction of relationship betweensnowfall days and air temperature also explains the ob-served differences between rainfall days and rain-on-snow days over European Russia during the same studytime period (Ye et al. 2008). They found that the num-ber of rain-on-snow days is very close to the rainfalldays for stations where mean air temperature is below�8°C but rain-on-snow days dropped to about half ofthe rainfall days at stations where the air temperature ishigher. This is apparently related to decreasing snowfalldays—thus fewer snow cover days for locations wheremean winter air temperature is �8°C and higher.
The opposite relationship between rainfall days andair temperature during spring and autumn is likely dueto the different proportion of days that have a daily airtemperature below 6°C versus above 6°C. Based ongroup 1 and group 2 data, the majority of spring daysfall into group 2 (60%–90% of all spring days) exceptfor a few stations over northern European Russia.Thus, the overall relationship with air temperature ispredominantly negative and only a few stations overnorthern European Russia have positive correlations asshown in Fig. 3e. For autumn, there are about an equal
number of days in these two groups except for a few ofthe southernmost stations, thus the positive relation-ship prevails in autumn. This is also reflected in the factthat mean seasonal air temperatures during spring arewarmer than in autumn at a majority of stations overthe study region.
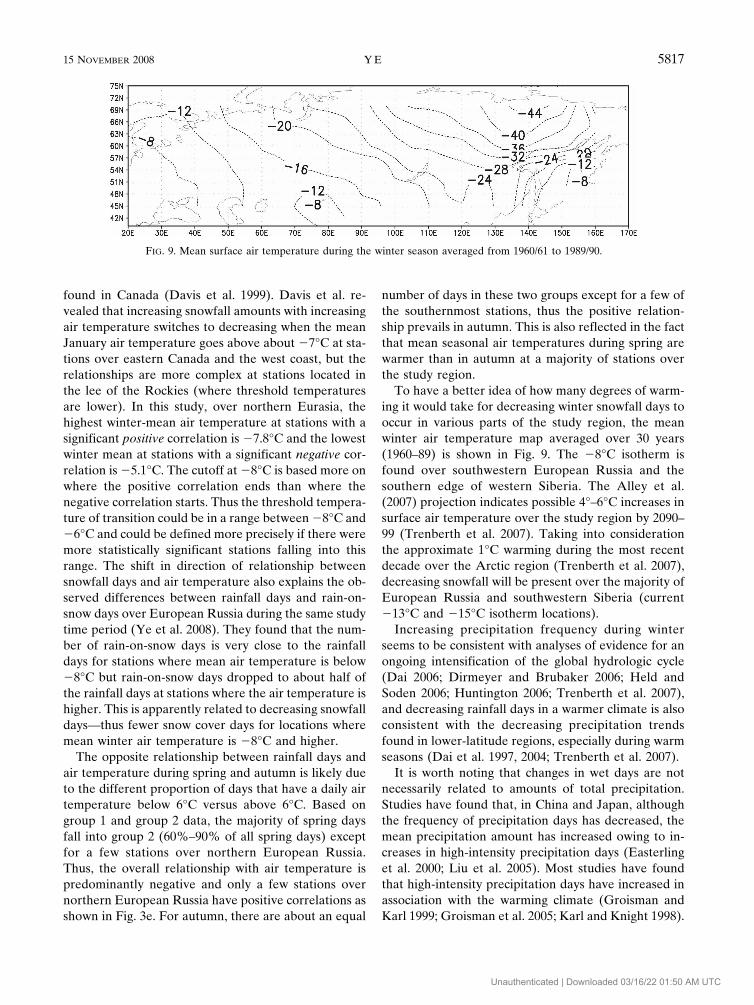
To have a better idea of how many degrees of warm-ing it would take for decreasing winter snowfall days tooccur in various parts of the study region, the meanwinter air temperature map averaged over 30 years(1960–89) is shown in Fig. 9. The �8°C isotherm isfound over southwestern European Russia and thesouthern edge of western Siberia. The Alley et al.(2007) projection indicates possible 4°–6°C increases insurface air temperature over the study region by 2090–99 (Trenberth et al. 2007). Taking into considerationthe approximate 1°C warming during the most recentdecade over the Arctic region (Trenberth et al. 2007),decreasing snowfall will be present over the majority ofEuropean Russia and southwestern Siberia (current�13°C and �15°C isotherm locations).
Increasing precipitation frequency during winterseems to be consistent with analyses of evidence for anongoing intensification of the global hydrologic cycle(Dai 2006; Dirmeyer and Brubaker 2006; Held andSoden 2006; Huntington 2006; Trenberth et al. 2007),and decreasing rainfall days in a warmer climate is alsoconsistent with the decreasing precipitation trendsfound in lower-latitude regions, especially during warmseasons (Dai et al. 1997, 2004; Trenberth et al. 2007).
It is worth noting that changes in wet days are notnecessarily related to amounts of total precipitation.Studies have found that, in China and Japan, althoughthe frequency of precipitation days has decreased, themean precipitation amount has increased owing to in-creases in high-intensity precipitation days (Easterlinget al. 2000; Liu et al. 2005). Most studies have foundthat high-intensity precipitation days have increased inassociation with the warming climate (Groisman andKarl 1999; Groisman et al. 2005; Karl and Knight 1998).
FIG. 9. Mean surface air temperature during the winter season averaged from 1960/61 to 1989/90.
15 NOVEMBER 2008 Y E 5817
Unauthenticated | Downloaded 03/16/22 01:50 AM UTC
A study over Switzerland found that winter precipita-tion frequency and strength increased during 1901–2000with the strongest signal over northern and westernSwitzerland (Schmidli and Frei 2005). However, a studyof precipitation in Italy found general decreases in wetdays even during winter but more frequent heavy pre-cipitation days (Brunetti et al. 2004). The results fromthis study show that the differences in the trends of theSwiss and Italian studies are very likely due to the factthat Italy has a warmer climate than Switzerland. Arecent study based on global climate model output un-der anthropogenic forcing scenarios suggests increasesin precipitation frequency, amount, and intensity dur-ing winter seasons over four major river basins: theVolga, Ob, Yenisei, and Lena (Khon et al. 2007). Thisis consistent with the idea that the frequency of all typesof precipitation might be expected to increase with in-creasing air temperatures in cold regions.
The threshold of �8°C for a switch in the changedirection of snowfall days and �6°C for a switch in thechange direction of rainfall days is based on the north-ern Eurasian station data during the study period 1936–89. Future study is needed to confirm the findings andprovide more robust statistics about these relationshipsby using updated data sources and expanded study intoother geographical regions. This knowledge will help usto better understand the nature of precipitation char-acteristics and to predict future changes in hydrologicalcycles under a warming climate in many regions of theworld.
Acknowledgments. This research is supported by theNOAA Data and Climate Change Detection ProgramGrant NA05OAR4311112. The author would like ex-press her appreciation to the CDIAC for providingRussian synoptic station data, Argyl Houser for proof-reading the manuscript, and the two anonymous re-viewers for their insightful comments that significantlyenhanced the quality of this manuscript.
REFERENCES
Alley, R. B., and Coauthors, 2007: Summary for policymakers.Climate Change 2007: The Physical Science Basis, S. Solo-mon et al., Eds., Cambridge University Press, 1–18.
Brown, R. D., and R. O. Braaten, 1998: Spatial and temporalvariability of Canadian monthly snow depths, 1946–1995.Atmos.–Ocean, 36, 37–54.
Brunetti, M., M. Maugeri, and F. Monti, 2004: Changes in dailyprecipitation frequency and distribution in Italy over the last120 years. J. Geophys. Res., 109, D05102, doi:10.1029/2003JD004296.
Dai, A., 2006: Recent climatology, variability, and trends in globalsurface humidity. J. Climate, 19, 3589–3606.
——, I. Y. Fung, and A. D. Delgenio, 1997: Surface observed
global land precipitation variations during 1900–1988. J. Cli-mate, 10, 2943–2962.
——, P. J. Lamb, K. E. Trenberth, M. Hulme, P. D. Jones, and P.Xie, 2004: The recent Sahel drought is real. Int. J. Climatol.,24, 1323–1331.
Davis, R. E., M. B. Lowit, P. C. Knappenberger, and D. R.Legates, 1999: A climatology of snowfall-temperature rela-tionships in Canada. J. Geophys. Res., 104 (D10), 11 985–11 994.
Dirmeyer, P. A., and K. L. Brubaker, 2006: Evidence for trends inthe Northern Hemisphere water cycle. Geophys. Res. Lett.,33, L14712, doi:10.1029/2006GL026359.
Easterling, D. R., J. L. Evans, P. Ya Groisman, T. R. Karl, K. E.Kunkel, and P. Amebenje, 2000: Observed variability andtrends in extreme climate events: A brief review. Bull. Amer.Meteor. Soc., 81, 417–425.
Frei, A., J. Miller, and D. Robinson, 2003: Improved simulationsof snow extent in the second phase of the AtmosphericModel Intercomparison Project (AMIP-2). J. Geophys. Res.,108, 4369, doi:10.1029/2002JD003030.
Giorgi, F., X. Bi, and J. Pal, 2004: Mean, interannual variabilityand trends in a regional climate change experiment over Eu-rope. II: Climate change scenarios (2071–2100). ClimateDyn., 23, 839–858.
Groisman, P. Ya., and T. R. Karl, 1999: Changes in the probabilityof heavy precipitation: important indicators of climaticchange. Climatic Change, 42, 243–283.
——, R. W. Knight, D. R. Easterling, T. R. Karl, G. C. Hegerl,and V. N. Razuvaev, 2005: Trends in intense precipitation inthe climate record. J. Climate, 18, 1236–1251.
——, ——, V. N. Razuvaev, and O. N. Bulygina, 2006: State of theground: Climatology and changes during the past 69 yearsover northern Eurasia for a rarely used measure of snowcover and frozen land. J. Climate, 19, 4933–4955.
Held, I. M., and B. J. Soden, 2006: Robust responses of the hy-drological cycle to global warming. J. Climate, 19, 5686–5699.
Huntington, T. G., 2006: Evidence for intensification of globalwater cycle: Review and synthesis. J. Hydrol., 319, 83–95.
——, G. A. Hodgkins, B. D. Keim, and R. W. Dudley, 2004:Changes in the proportion of precipitation occurring as snowin New England (1949–2000). J. Climate, 17, 2626–2636.
Karl, T. R., and R. W. Knight, 1998: Secular trends of precipita-tion, frequency, and intensity in the United States. Bull.Amer. Meteor. Soc., 79, 231–241.
Khon, V. C., I. I. Mokhov, E. Roeckner, and V. A. Semenov,2007: Regional changes of precipitation characteristics innorthern Eurasia from simulations with global climate model.Global Planet. Change, 57, 118–123.
Liu, B., M. Xu, M. Henderson, and Q. Ye, 2005: Observed trendsof precipitation amount, frequency, and intensity in China,1960-2000. J. Geophys. Res., 110, D08103, doi:10.1029/2004JD004864.
Razuvaev, V. N., E. B. Apasova, and R. A. Martuganov, 1995:Six- and three-hourly meteorological observations from 223U.S.S.R. stations. Carbon Dioxide Information AnalysisCenter Rep. NDP-048/R1, Oak Ridge National Laboratory,Oak Ridge, Tennessee, 124 pp.
Roesch, A., and E. Roechner, 2006: Assessment of snow coverand surface albedo in the ECHAM5 general circulationmodel. J. Climate, 19, 3828–3843.
Schmidli, J., and C. Frei, 2005: Trends of heavy precipitation andwet and dry spells in Switzerland during the 20th century. Int.J. Climatol., 25, 753–771.
5818 J O U R N A L O F C L I M A T E VOLUME 21
Unauthenticated | Downloaded 03/16/22 01:50 AM UTC
Semenov, V. A., and L. Bengtsson, 2002: Secular trends in dailyprecipitation characteristics: Greenhouse gas simulation witha coupled AOGCM. Climate Dyn., 19, 123–140.
Serreze, M. C., and Coauthors, 2000: Observational evidence ofrecent change in the northern high-latitude environment. Cli-matic Change, 6, 159–208.
Trenberth, K. E., and Coauthors, 2007: Observations: Surface andatmospheric climate change. Climate Change 2007: ThePhysical Science Basis, S. Solomon et al., Eds., CambridgeUniversity Press, 235–336.
Von Storch, H., and F. W. Zwiers, 1999: Statistical Analysis inClimate Research. Cambridge University Press, 484 pp.
Ye, H., 2001a: Characteristics of winter precipitation variationover northern Eurasia and their connections to sea surface
temperatures over the Atlantic and Pacific Oceans. J. Cli-mate, 14, 3140–3155.
——, 2001b: Quasi-biennial and quasi-decadal variations in snowaccumulation over northern central Eurasia and their con-nections to Atlantic and Pacific Oceans and Atmosphericcirculation. J. Climate, 14, 4573–4584.
——, and J. R. Mather, 1997: Polar snow cover changes and globalwarming. Int. J. Climatol., 17, 155–162.
——, H. Cho, and P. Gustafson, 1998: The changes of Russianwinter snow accumulation during 1936-1983 and its spatialpatterns. J. Climate, 11, 856–863.
——, D. Yang, and D. Robinson, 2008: Winter rain-on-snow andits association with air temperature in Northern Eurasia. Hy-drol. Process., 22, 2728–2736.
15 NOVEMBER 2008 Y E 5819
Unauthenticated | Downloaded 03/16/22 01:50 AM UTC