change in milk and other beverage intake among preteens in
TRANSCRIPT

CHANGE IN MILK AND OTHER BEVERAGE INTAKE AMONG
PRETEENS IN AN INTERVENTION AIMED AT INCREASING
CALCIUM
_______________
A Thesis
Presented to the
Faculty of
San Diego State University
_______________
In Partial Fulfillment
of the Requirements for the Degree
Master
in
Public Health
_______________
by
Disly Mariela Juarez Munoz
Spring 2011


iii
Copyright © 2011
by
Disly Mariela Juarez Munoz
All Rights Reserved

iv
DEDICATION
I want to thank God who gives me the strength, endurance, knowledge and guidance
every day to go on. I want to thank my beloved family who supported me through every step
of this process. No matter how far I was from them, no matter in what continent, they always
remain so close to me. I will always and forever appreciate your patience, advice, guidance,
prayers and love. This is for you, I love you.

v
ABSTRACT OF THE THESIS
Milk and Beverage Consumption Patterns Among Preteens in an Intervention Aimed at Increasing Calcium Intake
by Disly Mariela Juarez Munoz
Masters in Public Health San Diego State University, 2011
Children’s replacement of milk with sugar-sweetened beverages (SSB) is associated with lower intake of calcium, vitamin D, vitamin A, folate, vitamin B-12, and magnesium. Research indicates a relationship between this consumption pattern and obesity, osteoporosis, nutrient deficiency and dental caries. This study is a secondary analysis of the cross-sectional dietary data from the Healthy Youth and Parent Program (HYPP). HYPP, a family behavioral intervention produced significant increases in calcium intake among the experimental group as compared to controls (N = 124). This secondary analysis analyzed beverage consumption, calcium-rich beverages and sugar sweet beverages, to test if the experimental intervention resulted in differential change from baseline to 3-months. Beverages included milk (whole, reduced and fat free), 100% juices, SSB (juice and soda) and calcium-fortified juices (calcium-100% juices and calcium-not 100% juices). This study evaluated if the increase in calcium intake in HYPP participants was due to an increase intake of milk and explored the type of milk that caused significant differences. Results indicate that total milk consumption increased in the experimental group relative to controls (p = .004). Consumption of whole milk decreased (p = .019) with a corresponding increase in reduced (p = .002) and fat-free milk (p = .036). No effect was observed for juices or SSB. This analysis supports parent-child interventions as a means of increasing the consumption of calcium rich beverages including reduced and fat-free milk in children. Dietary modification through such interventions should be considered as a means to successfully decrease the childhood obesity epidemic and potential osteoporosis rise among children in the United States.

vi
TABLE OF CONTENTS
PAGE
ABSTRACT ...............................................................................................................................v
LIST OF TABLES ................................................................................................................. viii
ACKNOWLEDGEMENTS ..................................................................................................... ix
CHAPTER
1 INTRODUCTION .........................................................................................................1
Theoretical Background ...........................................................................................4
Purpose of the Study ................................................................................................4
Research Questions ..................................................................................................5
2 METHODS ....................................................................................................................6
HYPP Participants and Recruitment ........................................................................6
HYPP Parent Training .......................................................................................6
HYPP Child Training .........................................................................................7
HYPP Control Group .........................................................................................7
HYPP IRB and Incentives .......................................................................................7
HYPP Data Analyses/ Results .................................................................................7
Present Data: Variables ............................................................................................8
Present Study: Analyses ...........................................................................................9
3 RESULTS ....................................................................................................................10
Baseline Beverage Consumption by Gender, Ethnicity and Group .......................10
Baseline and 3-Months Consumption of at Least One Beverage on an Average Day ..........................................................................................................11
Group Differences at 3-Months .............................................................................13
Change in Beverage Gram Consumption from Baseline to 3-Months in Control and Experimental Groups .........................................................................13
Change in Beverage Gram Consumption Regressed on Age, Group, Ethnicity and Gender .............................................................................................13
4 DISCUSSION ..............................................................................................................16
Milk ........................................................................................................................16

vii
SSB & Sodas ..........................................................................................................17
Juices ......................................................................................................................17
Ethnicity and Beverage Consumption ...................................................................18
Family-Based Interventions ...................................................................................19
Limitations .............................................................................................................20
Implications............................................................................................................20
REFERENCES ........................................................................................................................23

viii
LIST OF TABLES
PAGE
Table 1. Participant Demographics (N = 124) .........................................................................10
Table 2. Baseline Beverage Grams Consumption by Gender and Ethnicity (Geometric Mean and 25th and 75th quartiles) .................................................................................11
Table 3. Percentages of Participants in Control and Experimental Groups at Baseline and 3-Months that Consumed at Least One Beverage on an Average Daya ................11
Table 4. Grams of Beverage Consumed per Group at Baseline, 3-Month Measures and Change Scores (Baseline& 3- Month Geometric Means/Change Score Raw Value a) (25th& 75th Interquartiles) ......................................................................14
Table 5. Multiple Linear Regression of the Raw Change of Beverage Grams Consumed and Regressed on Group Assignment a ......................................................15

ix
ACKNOWLEDGEMENTS
I would like to thank my advisor and my mentors, Dr. Hovell and Veronica Irvin for
their support, patience and guidance through the completion of this process. I would like to
thank my committee members, Dr. Madanat and Dr. Nichols for their advice and
contribution. I would also like to thank the staff at the Center for Behavioral Epidemiological
and Community Health (CBEACH) for allowing my endless visits to the center. Finally, I
would like to thank my friends and family who where the foundation of my endurance.
Thank you.

1
CHAPTER 1
INTRODUCTION
Change in nutrient intake and increase in consumption of foods high in fat and sugars
have become a familiar pattern in schools and homes for children nation-wide (French, Lin,
& Guthrie, 2003; Marshall, Eichenberger Gilmore, Broffitt, Stumbo, & Levy, 2005; Nielsen
& Popkin, 2004; Rampersaud, Bailey, & Kauwell, 2003). Due to the increased availability
and options of sugar-sweetened beverages (SSB), including sodas, juices, energy drinks and
coffee, an over consumption of these unhealthy beverages is feasible (Bray, Nielsen, &
Popkin, 2004; James & Kerr, 2005; Swinburn, Caterson, Seidell, & James, 2004). With so
many unhealthy options, consumption of traditionally healthy beverages like milk has
decreased over the last 20 years (Nielsen & Popkin, 2004; Troiano, Breifel, Carroll, &
Bailostosky, 2000). This is not surprising considering that 34% of high school students drink
at least one soda every day (Centers for Disease Control and Prevention [CDC], 2007). In
fact, access to soda is so high that soda contributes 55% of all calories from SSB among
children 2-19 years old (Wang, Bleich, & Gortmaker, 2008). Those who consume one or
more sodas or other SSB every day have a higher prevalence of obesity than those who do
not (Babey, Jones, Yu, & Goldstein, 2009).
While juice may seem to be a healthy alternative to soda, juice drinks contribute to
energy imbalance, diarrhea, overnutrition or undernutrition, and development of dental caries
in children (American Academy of Pediatrics [AAP], 2004; French et al., 2003; Harnack,
Stang, & Story, 1999; Harrington, 2008; James & Kerr, 2005; Marshall et al., 2005; Saelens,
Couch, Wosje, Stark, & Daniels, 2006). Analyses of the National Health and Nutrition
Examination Survey III (1988-1994 and 1999-2004) showed that fruit drinks were 37% of
total SSB calories for children 2-19 years old (Wang et al., 2008). On average, children aged
2-5 years consume 148 kcal/day, 6-11 years old consume 136 kcal/day and 12-19 years old
consume 184 kcal/day of juices that are not 100% juice (Wang et al., 2008).
Studies suggest that the reduction of SSB consumption, including sodas and juice
drinks, could decrease and even prevent childhood obesity (Harrington, 2008; James,

2
Thomas, Cavan, & Kerr, 2004). Sugar-Sweetened beverages constitute the highest source of
sugar intake in adolescents (Harrington, 2008). The odds-ratio for becoming obese among
children is 1.6 times higher, per additional beverage, for those who consume more than one
SSB than those who do not (Harrington, 2008). Milk, recognized as the main source of
calcium, has been found to be potentially associated with better weight control (Saelens, et
al., 2006). Thus, methods to reduce SSB through diet modification are considered important
to combat obesity and reduce calcium insufficiency and other diet-related problems in
children (French & Story, 2004; Heaney, Davies, & Barger-Lux, 2002; Teegarden, 2003).
With the popularity of SSB and juice drinks, milk displacement is prevalent and the
diet quality of children is poorer (Marshall et al., 2005). Children are not able to consume the
recommended amount of calcium or other nutrients from sodas and juices, as they would be
if they drank more milk. Replacement of milk with SSB is associated with lower intake of
calcium, vitamin D, vitamin A, folate, vitamin B-12, and magnesium (Marshall et al., 2005).
Calcium fortified juices have attempted to fill that gap, however they do not compensate for
other nutrients found in milk.
One of the major effects of insufficient consumption of nutrients is an increase in the
risk of bone problems, such as osteoporosis and osteoarthritis in children (National Institute
of Health: Osteoporosis and Related Bone Diseases National Resource Center [NIH], 2009;
Marshall et al., 2005). Over 45% of bone mass is developed during childhood and adolescent
years (NIH, 2009). Bone accretion is crucial during these years, yet most children do not
meet the recommended dietary calcium intake of 1,300 mg/day (recommended for 9-13 years
old). According to the National Institutes of Health Osteoporosis and Related Bone Disease,
only one in ten girls and one in four boys (aged 9-13 years) meet the recommended intake of
calcium (NIH, 2009). The positive correlation between calcium, dairy, energy balance and
healthy body weight has been strongly suggested by a number of studies (Heaney et al.,
2002; Teegarden, 2003; Zemel et al., 2008).
Dietary modification interventions can impact children’s diet quality by either
decreasing the consumption of a harmful food or increasing the consumption of a nutrient.
French & Story (2004) pioneered the promotion of bone health through food intake in
children. Before 2004, the primary method of exploring the relationship among calcium and
bone health was by increasing calcium through supplements and or fortified foods (Bonjour

3
et al., 1997; Johnston et al., 1992; Lloyd et al., 1993). The intervention conducted by French
& Story (2004) focused on increasing bone health through both physical activity and diet
behavioral modification. Bone health was measured by bone mineral content, density/area,
dietary calcium intake and weight bearing physical activity (WBPA). The intervention
consisted of eight 90- minute activity courses to increase WBPA (120 minutes/week).
Calcium intake was measured by a 24-hour dietary recall provided by each participant and
measurements were taken at baseline, one year and two years follow up. In order to increase
the intake of calcium (1300 mg/day), Girl Scout troop leaders in the intervention group
advised troops to eat calcium rich foods outside of the classes. Parents were also targeted
through a web-based program as a means of support. The intake of calcium through dietary
foods was significantly greater among the intervention group (baseline mean = 1199 mg,
two-year mean = 1394 mg) than the control group (baseline mean = 1274 mg, two-year mean
= 1310 mg). This intervention proved effective in raising calcium intake in pre-adolescent
girls though calcium- rich foods.
Analyses of national dietary surveys support the need of intervention programs to
improve diet quality in children. The National Health and Nutrition Examination Surveys
(1999-2004) found that the largest increase of consumption of SSB and 100% juices occurred
among children aged 6-11 years with an increase of approximately 20% (Wang et al., 2008).
In this sample population (children ages 2-19), sodas contributed 55% of all beverages
(calories) consumed. Teenagers 12-19 years old consumed the most soda (50% of all calories
consumed). Juice drinks contributed 37% of SSB calories for children 2-19 years old (Wang
et al., 2008). Due to these harmful dietary patterns in children and adolescents nationwide,
there is a need to look at effective interventions.
Healthy People 2010 aims to reduce the prevalence of children and adolescents who
are obese by five percent (objectives 19-3) (United States Department of Health and Human
Services [USDHHS], 2000). Obesity, a growing pediatric epidemic, is a concern in the U.S.
(CDC, 2010). Literature supports the relationship between the beverage patterns in children
and health status. Furthermore, health effects of SSB include, teeth decay, osteoporosis,
increase in weight, and nutrient deficiency such as calcium and vitamin D (AAP, 2004). Milk
consumption is inversely associated with the consumption of SSB. As SSB increases, milk
consumption is decreasing, resulting in calcium deficiency in children (AAP, 2004; Marshall

4
et al., 2005; Wang et al., 2008). Results of food diaries and dietary survey analyses show that
the consumption of milk and other dairy foods are the main sources of adequate intake of
multiple nutrients, including calcium and vitamin D (Marshall et al., 2005; Wang et al.,
2008). Calcium plays an important role in adolescents’ development. However, pre-teens do
not consume the daily-recommended calcium (NIH, 2009). Data demonstrate higher
consumption of sodas and juices than in calcium-fortified beverages, in children, specifically
in teenagers (Ballew, Kuester, & Gillespie, 2000; James et al., 2004; Marshall et al., 2005;
CDC, 2007). The intakes of 100% juices and sugar-added beverages have been found to be
negatively associated with adequate intakes of calcium and other nutrients (Marshall et al.,
2005; Wang et al., 2008). Thus, it is crucial to understand how the patterns displayed in
beverage consumption affect diet quality.
THEORETICAL BACKGROUND
Multiple factors play a role in a child’s choice of food and beverage such as social
relationships and cultural factors. Interventions to treat obesity and modify diet are complex
and have usually taken a comprehensive approach to be successful (Harrington, 2008;
Stokols, 1996). The Behavioral Ecological Model (BEM) is used in public health to target the
myriad of levels influencing behavior. The BEM suggests that health is affected by behavior
that is determined by environmental subsystems such as, individual, interpersonal,
organizational, community and public policy. Thus, comprehensive interventions are more
efficacious in modifying diet than interventions focused only in one behavior or
environmental factor.
PURPOSE OF THE STUDY
The purpose of this study is to analyze calcium rich beverage consumption and SSB
consumption in the experimental condition versus the control condition in the HYPP study.
The HYPP study aimed to increase bone health (density) in 10-13 year old pre-teens through
physical activity and dietary increase of calcium intake. The HYPP study resulted in the
increase in calcium consumption from baseline to post measurements among participants in
the experimental group as compared to the control group. The present study analyzed

5
changes in beverage consumption at baseline and 3-months among participants.
Experimental effects will be controlled for demographic characteristics.
RESEARCH QUESTIONS
The following questions are explored:
1. Did the experimental group increase consumption of milk and calcium-fortified juices related to the control group?
2. Is the increase in milk consumption related to a reciprocal decrease in the consumption of Sugar Sweetened Beverages (sodas and non-100% juices)?

6
CHAPTER 2
METHODS
The HYPP intervention used a randomized clinical trial study design. Groups
consisted of a control group assigned to an injury prevention program and an experimental
group assigned to a nutrition and physical activity program.
HYPP PARTICIPANTS AND RECRUITMENT
Families from San Diego, California were recruited for the 8-week intervention.
Participants consisted of 10-13 year old children with at least one English or Spanish-
speaking parent. Nine total cohorts were recruited over a period of three years. New sessions
began every three to five months from the initial date, April 2000 to February 2003. The first
cohort (April 2000) consisted of nine families. Cohorts’ size varied (9-21 families).
Recruitment took place in community settings such as, community fairs, advertisement in
local newspaper, participating pediatric clinics, and flyers placed throughout the community
(Hovell et al., 2008). A total of 124 participants completed the baseline and follow up
measurements and will be used in the present analysis.
HYPP Parent Training
Parent and child had separate 90-minute trainings once a week for 8-weeks. Each
session consisted of a 30-minute discussion, interactive activities and questions and answer
portion that focused on osteoporosis, physical activity and diet and bone health. The goals set
forth in the parent group were to help their child perform 30 minutes of moderate to vigorous
physical activity 5 or more days a week and to help their child achieve 1,300 mg of dietary
calcium intake a day. The remaining 60 minutes of each session consisted of behavior
management techniques. Parents were taught skills on how to increase their child’s physical
activity and increase dietary calcium intake. The skills taught included reinforcement
(praising), shaping, modeling, monitoring, goal setting, and behavior contracts. Coaching
calls administered by trained research assistants were given as additional parental support.
All sessions were provided in English or Spanish.

7
HYPP Child Training
Children in the intervention group received 60 minutes of supervised physical activity
and 30 minutes of discussion. Each session began with a brief discussion on bone health,
physical activity and exercise safety. This was followed by a warm-up physical activity that
incorporated “bone-loading” exercises. Fitness games were created so that participants can
perform them in their homes, community or school settings. Each session concluded with
education on calcium-rich foods, calcium-rich sources, and importance of calcium on bone
health. Participants were provided with calcium rich meals at every session. The intervention
took place at a research center.
HYPP Control Group
Parent session included behavior management skills on injury prevention in lieu of
diet and physical activity. Bone health was not discussed during the sessions. Similarly, child
session focused on injury prevention and incorporated activities related to injury prevention
rather than bone health, diet and physical activity. Coaching phone calls, and incentives
procedures were similar to the intervention group.
HYPP IRB AND INCENTIVES
Approval for a secondary analysis was obtained from San Diego State University
Institutional Review Board. Approval for HYPP was approved by San Diego State
University and the University of California, San Diego Institutional Review Boards. All
participants reviewed and consented procedures as mandated by the Institutional Review
Boards.
HYPP DATA ANALYSES/ RESULTS
Data for Calcium intake were collected through phone. Participants reported 24-hour
diet recalls for three days. The participants (child and parent) were asked to recall and report
two meals during the weekday and one during the weekend. Parents assisted and confirmed
the child’s recall. Participants were given measuring tools such as cups and spoons to
measure their intake of foods. All recall data were collected using the Nutrition Data System
(NDS) software version 4.03, developed by the Nutrition Coordination Center, University of
Minnesota, Minneapolis, MN, Food and Nutrient Database 31, released in November 2000.

8
Cross sectional analyses, log transformation, geometric means, and interquartiles for
calcium intakes were computed. Separate analysis for males and females were computed due
to gender differences in baseline levels of calcium. Both males and females in the
experimental group increased their calcium consumption, approximately 25%, from baseline
to posttest. For boys, cross-sectional differences between experimental and control groups
were achieved for 3- and 9-month calcium intake (1352 vs. 1052 mg/day, 1298 vs. 970
mg/day, p < .05). A significant group by time interaction was observed from pretest to
posttest for the full sample (p = .008) and for girls (p = .006) but not for boys (Hovell et al.,
2008).
PRESENT DATA: VARIABLES
Data for the secondary analyses were available from the HYPP’s NDS database.
SPSS version 16.0, and later the upgraded version 18.0 were used. Inclusion criteria for data
in this analysis included only beverage entries for all types of milk, juices, sodas and SSB
(non-diet sodas and non-100% juices) consumed by participants in both experimental and
control group. Other beverages were excluded for analyses due to low reporting of
consumption (less than 50 entries). Beverages excluded were cocoa, frozen treats, coffee, tea,
supplemental beverages, soy and water.
A database was constructed to include beverages to be considered in analyses.
Beverages were categorized and subcategorized. For example, a total milk variable was
created along with variables for the subcategories of total milk including whole milk,
reduced-fat milk and fat-free milk. A variable for SSB was created by adding juice drinks
and non-diet sodas. Calcium-fortified juices variable was created by identifying juice
beverages that contained added calcium. Food identifications were changed from string to
numerical variables in the SPSS data set. A total of eight beverages were used for final
analyses: total milk, whole milk, fat-free milk, reduced- fat milk, sodas, 100% juices,
calcium-fortified juices (all juices with added calcium) and SSB (non-diet & non-100%
juices).
Variables were created for frequencies and grams consumed on an average of 3 days.
Analyzing consumption of beverages in grams is commonly used in research (Watt, Dykes,
& Sheiham, 2000; Dubois, Farmer, Girard, & Peterson, 2007; Keller, Kirzner, Pietrobelli, St-

9
Onge, & Faith, 2009). The 3-day average variables for baseline and 3-month data underwent
logarithm transformation to normalize all skewed data. Log transformed variables were used
in bivariate analyses for all baseline and 3-month data. Geometric means and the 25th and
75th quartile range were reported. Three-month data were categorized using the same
procedures used in the baseline data set. The raw values (total grams consumed on an
average day) were used for change scores (3-months minus baseline) because the data were
normally distributed.
PRESENT STUDY: ANALYSES
Descriptive statistics were used to report demographics and percentages of the sample
that consumed at least one beverage on an average day. Percentage of the sample that
consumed at least one beverage on an average day is defined as reporting to have drunk at
least one beverage on an average of 3 days (frequency), regardless of quantity. Pearson’s chi
square analyses were used to look at significant differences between control and
experimental groups at baseline and three-months, and significant differences between
baseline and 3-months in each respective group, experimental and control. Fischer’s exact
test was reported for cells with expected count less than five. Geometric means and the 25th
and 75th interquartiles are reported for all measurements.
Independent sample t-tests were conducted to obtain significant differences in
consumption by ethnicity and gender at baseline measurements. Independent sample t-tests
were conducted to obtain differences of beverage consumption by group at baseline, 3-
months and change score (3-months minus baseline). Multiple linear regressions were
computed to predict change in the raw amount of beverage consumed regressed on age,
group, ethnicity, and gender for each beverage.

10
CHAPTER 3
RESULTS
A total of 124 participants completed baseline and 3-month measures used in the
present study. Of the 124 participants, 58% were female, 42% males, 38 % White, and 62%
were of other ethnicities (Table 1). Of the 124 participants at baseline, 54 were in the control
group and 70 in the experimental group. The mean age of participants was 11 years old.
Table 1. Participant Demographics (N = 124)
Gender
Male 52 42%
Female 72 58%
Ethnicity
White 47 38 %
Other 77 62 %
Group
Experimental 70 56%
Control 54 44%
BASELINE BEVERAGE CONSUMPTION BY GENDER, ETHNICITY AND GROUP
Frequencies were calculated to look at the geometric means, 25th and 75th percent
interquartiles (Table 2). Independent sample t-tests showed no significant difference in
beverage consumption between males and females at baseline. There were no significant
differences between control and experimental groups.
11
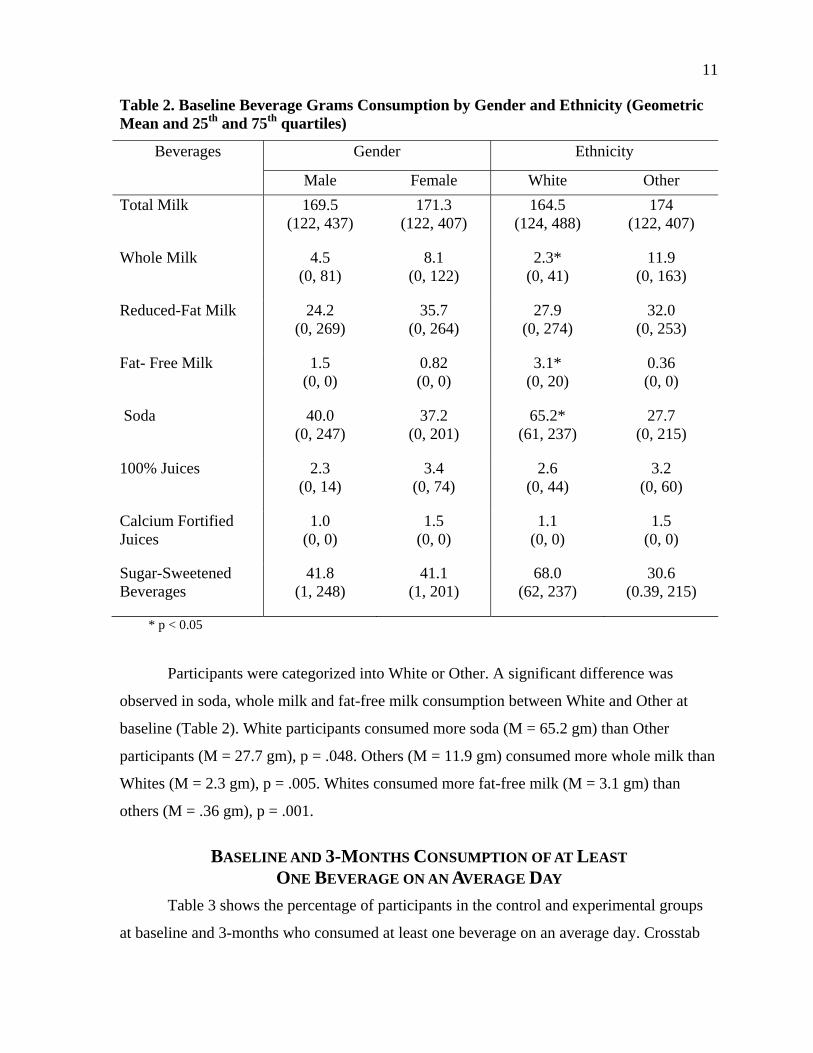
Table 2. Baseline Beverage Grams Consumption by Gender and Ethnicity (Geometric Mean and 25th and 75th quartiles)
Beverages Gender Ethnicity
Male Female White Other
Total Milk 169.5 (122, 437)
171.3 (122, 407)
164.5 (124, 488)
174 (122, 407)
Whole Milk 4.5 (0, 81)
8.1 (0, 122)
2.3* (0, 41)
11.9 (0, 163)
Reduced-Fat Milk 24.2 (0, 269)
35.7 (0, 264)
27.9 (0, 274)
32.0 (0, 253)
Fat- Free Milk 1.5 (0, 0)
0.82 (0, 0)
3.1* (0, 20)
0.36 (0, 0)
Soda 40.0 (0, 247)
37.2 (0, 201)
65.2* (61, 237)
27.7 (0, 215)
100% Juices 2.3 (0, 14)
3.4 (0, 74)
2.6 (0, 44)
3.2 (0, 60)
Calcium Fortified Juices
1.0 (0, 0)
1.5 (0, 0)
1.1 (0, 0)
1.5 (0, 0)
Sugar-Sweetened Beverages
41.8 (1, 248)
41.1 (1, 201)
68.0 (62, 237)
30.6 (0.39, 215)
* p < 0.05
Participants were categorized into White or Other. A significant difference was
observed in soda, whole milk and fat-free milk consumption between White and Other at
baseline (Table 2). White participants consumed more soda (M = 65.2 gm) than Other
participants (M = 27.7 gm), p = .048. Others (M = 11.9 gm) consumed more whole milk than
Whites (M = 2.3 gm), p = .005. Whites consumed more fat-free milk (M = 3.1 gm) than
others (M = .36 gm), p = .001.
BASELINE AND 3-MONTHS CONSUMPTION OF AT LEAST
ONE BEVERAGE ON AN AVERAGE DAY
Table 3 shows the percentage of participants in the control and experimental groups
at baseline and 3-months who consumed at least one beverage on an average day. Crosstab

12
and chi-square analysis do not show significant differences between baseline values in the
control and experimental groups. At 3-months, the chi-square analysis showed a significant
difference between control group and experimental group for the consumption of whole milk
(df = 1, p = .025). The experimental group drank significantly less whole milk than the
control group at 3-months. Inversely, the consumption of total reduced-fat milk was
significantly higher in the experimental group than in the control group (df = 1, p = .008).
Table 3. Percentages of Participants in Control and Experimental Groups at Baseline and 3-Months that Consumed at Least One Beverage on an Average Daya
Beverages Control Group Experimental Group
Baseline 3-Months Baseline 3-Months
Total Milk 70% 59% 60% 71%
Whole Milk 11% 19% + 16% 6% * +
Reduced-Fat Milk 39% 33% + 36% 57% * +
Fat-Free Milk 13% 6% + 6% 7% +
Soda 24% 24% 24% 16%
100% Juices 2% 9% 6% 14%
Calcium Fortified Juices 4% 26% 7% 33%
Sugar-Sweetened Beverages 39% 46% 42% 40% a Percentage of the sample that consumed at least one beverage on an average day is defined as reporting consumption of at least one beverage on an average of three days.
* Significant difference between control and experimental in 3- months (p < .05).
+ Significant difference between baseline and 3- months in respective control and experimental group. Fischer’s exact tests were reported for cells that had expected counts less than five (p < .05).
There was a significant difference within groups in the consumption of whole milk.
The control group (p = .008) increased its consumption of whole milk over time, as the
experimental group (p = .001) decreased its consumption. There was a significant difference
over time in the consumption of reduced-fat milk in the control (p = .003) and experimental
groups (p < .000). The control group decreased its consumption of reduced-fat milk and the
experimental group increased its consumption of reduced-fat milk over time. There was a
significant difference over time in the consumption of fat-free-milk in the control group (p =
.041) and in the experimental group (p = .001). The control group reduced its fat-free milk

13
consumption over time and the experimental group increased its fat-free milk consumption
over time.
GROUP DIFFERENCES AT 3-MONTHS
Table 4 shows a significant difference in the consumption of whole milk between the
control group (M = 0.13 gm) and the experimental group (M = 1.0 gm) at 3-months. The
experimental group consuming more whole milk than the control group, p = .049. A marginal
difference was observed in 100% juice consumption between the control group (M = 3.0 gm)
and the experimental group (M = 8.5 gm), the experimental group consuming more 100%
juices than the control group, p = .055 (Table 4).
CHANGE IN BEVERAGE GRAM CONSUMPTION FROM
BASELINE TO 3-MONTHS IN CONTROL AND
EXPERIMENTAL GROUPS
Changes in beverage consumption were considered both in the control group and the
experimental group. It was hypothesized that participants in the experimental group will
increase their milk consumption significantly. Independent sample t-test showed a significant
increase, from baseline to 3-months, in the experimental group’s consumption in total milk
(M = 77.1 gm), p = .004, reduced-fat milk (M = 119 gm), p = .002, and fat-free milk
(M = 10.6 gm), p =. 036 while showing a reciprocal decrease in whole milk (M = -58 gm),
p = .019. A non-significant increase in 100% juice and calcium-fortified juice and a
reciprocal decrease in soda and SSB were observed.
No significant differences were observed in the change scores of the control group,
even though there was an increase in soda, 100% juices, calcium fortified juices and SSB
(Table 4).
CHANGE IN BEVERAGE GRAM CONSUMPTION
REGRESSED ON AGE, GROUP, ETHNICITY AND GENDER
Table 5 shows multiple linear regressions controlling for age, ethnicity and gender.
Each row in Table 5 represents a separate multiple linear regression. All beverages were
regressed for age, sex, ethnicity and group assignment. However, linear regressions in this
table report the betas and standard error for group assignment only. Group assignment was

14
Table 4. Grams of Beverage Consumed per Group at Baseline, 3-Month Measures and Change Scores (Baseline& 3- Month Geometric Means/Change Score Raw Value a) (25th& 75th Interquartiles)
Beverages
Control Group Experimental Group
Baseline 3 Month Change (Raw Value)
Baseline 3 Month Change (Raw Value)
Total Milk 175.9 (127, 487)
144.3 (122, 343)
-43.8 (188, 90)
166.5 (122, 407)
152.2 (143, 529)
77.1* (-61,222)
Whole Milk 5.6 (0, 81)
0.13 (0,0)
-8.30 (-28, 0))
7.0 (0, 122)
1.0 + (0,0)
-58* (-181,0)
Reduced-Fat Milk
37.3 (0, 282)
27.5 (0,244)
-12.7 (-81, 41)
25.9 (0, 258)
61.3 (0, 483)
119* (-3, 251)
Fat- Free Milk
1.7 (0, 0)
1.5 (0,0)
-9.4 (0,0)
0.69 (0,0)
1.6 (0,0)
10.6* (0,0)
Soda 39.0 (39, 238)
32.5 (0, 247)
14.4 (-121, 158)
37.8 (0, 218)
20.1 (0, 186)
-28.3 (-149, 103)
100% Juices 3.5 (0, 51)
3.0 (0, 44)
14.4 (-36, 44)
2.5 (0, 39)
8.5 (0, 165)
66.1 (0, 132)
Calcium Fortified Juices
1.1 (0,0)
26.3 (0, 237)
147 (0, 186)
1.5 (0,0)
47.2 (0, 337)
182.5 (0, 313)
Sugar-Sweetened Beverages
42.3 (2, 239)
35.6 (1, 247)
15 (-121,157)
40.8 (0.53, 218)
32.8 (1, 186)
-28.3 (-149, 103)
a This table reports baseline, 3-months and change scores beverage consumption by group assignment. The geometric means and 25th, 75th interquartiles are reported for baseline and 3-month data due to skewness. Change scores were calculated by using the raw numbers (total grams consumed on an average day at 3 months minus total grams consumed on an average day at baseline). The geometric means of the change scores resulted in skewed data. The raw numbers for the change scores were normally distributed and are reported here.
* Change Score significance: p < 0.05
+ 3-Months Control and Experimental group significance: p < 0.05

15
Table 5. Multiple Linear Regressions of the Raw Change of Beverage Grams Consumed and Regressed on Group Assignment a
Beverages GroupUnstandardized
Coefficients B SE
GroupStandardized Coefficient
Beta
GroupCoefficient
p-value
Model R2 ANOVAp-value
Total Milk 132.6 41.8 .278 .002* .107 .009* Whole Milk -47.9 21.2 -.204 .026* .058 .125 Reduced-Fat Milk 143.4 41.7 .300 .001* .116 .005* Fat-Free Milk 18.4 9.60 .173 .058* .052 .173 Soda .017 .254 .006 .948 .031 .445 100% Juices .525 .267 .178 .052 .016 .211 Calcium Fortified Juices
.121 .250 .045 .628 .023 .599
Sugar-Sweetened Beverages
.020 .241 .008 .933 .032 .417
a Numbers in cells represent the Unstandardized Coefficient B , Unstandardized Standard Error, Standardized Coefficient Beta, P-value, Model R^2 and Model ANOVA P-value of the raw change score. Each row represents a separate linear regression. All beverages were regressed for Age, Sex, Ethnicity and Group assignment. However, linear regressions in this table report the betas and standard error for group assignment only. Group assignment was the only variable that showed significance. Groups were coded Control = 0 and Experimental = 1. Significance: p < 0.05
the only variable that showed significance. Participants assigned to the experimental group
significantly increased their consumption of total milk (p = .002) and significantly increased
their consumption of reduced-fat milk (p = .001) as compared to participants in the control
group. Model variables for both total milk (F = 3.56, p = .009) and reduced-fat milk
(F = 3.90, p = .005) also increased significantly. A similar significant increase was found for
fat-free milk (p = .058) however; the overall model did not reach significance. Participants in
the experimental group significantly decreased their consumption of whole milk (p = .026)
but the overall model did not reach significance.

16
CHAPTER 4
DISCUSSION
The HYPP study aimed to increase bone density through physical activity and
calcium-rich diet in pre-teens. The HYPP study found a significant increase in calcium
among participant in the experimental group from baseline, 3-month and 9-month measures.
In this secondary analysis, we hypothesized that the experimental group in the HYPP
increased their milk consumption from baseline to 3 months relative to controls. We explored
what type of beverages resulted in the increase of calcium consumption among participants
of the HYPP study.
MILK
Milk is the main source of calcium, vitamin D, magnesium, vitamin A, phosphorus,
zinc and many others for children and adolescents in the US (Johnson, Frary, & Wang,
2002). Studies suggest that 100% fruit juice and milk consumption decreases from early
childhood into adolescence, as SSB consumption increases. In the HYPP study, calcium
increased and a change of milk consumption was observed among participants in the
experimental group. We explored the type of milk that was mainly responsible for this
calcium increase. The HYPP study encouraged the consumption of reduced-fat or fat-free
milk. Bivariate and multilinear regressions showed that there was a significant increase of
77.1 grams, more than 1/4 of a cup of total milk, in the experimental group compared to the
control group from baseline to 3-months. Furthermore, the experimental group significantly
decreased their consumption of whole milk by 58 grams, approximately less than 1/4 of a
cup. The experimental group also increased their consumption of reduced-fat milk by 119
grams, more than 1/2 a cup, and fat-free milk increased by 10.6 grams, less than 1/5 of a cup.
These changes in milk consumption concur with HYPP’s goal of encouraging the
consumption of less fattening milk types.
17
Even after controlling for age, gender and ethnicity, group significance was observed
for all categories of milk, suggesting that the target diet change was achieved by the HYPP
intervention compared to controls.
SSB & SODAS
Research indicates that 32% of adolescents who consume at least one soda per day
are overweight or obese and 27% who do not consume any soda per day are overweight or
obese (Babey et al., 2009). The national trend shows the consumption of SSB has increased
in adolescents. Participants in the control group followed this trend. The control group
increases their consumption of SSB, sodas, 100% juices, and calcium-fortified juices as
consumption of milk beverages decreased. We observed, however, that the participants in the
experimental group consumed less sodas and SSB. Even though there were no significant
group differences at 3-months in these beverage categories, the control group followed the
national trend in consuming more SSB over time.
Many factors can contribute to the increase of SSB over time, regardless of
interventions. The availability of SSB, product innovation, promotion of unhealthy
beverages, overall marketing of these beverages and the food industry’s influence has
impacted the availability and the attractiveness of SSB in the US. This results in an increase
of childhood obesity and lack of nutrient intake in children. Interventions like HYPP may be
promising in reversing beverage consumption patterns that exist today.
JUICES
Juices are a good source of vitamin C and other nutrients. Approximately, 6 ounces of
100% juice is considered one serving of fruit for children (USDHHS, 2000). Studies have
showed that the consumption of 100% juices decrease as the consumption of juice drinks and
SSB increase in children over time (Rampersaud et al., 2003). Due to the growing popularity
of all juices, 100% juices and calcium-fortified juices are recommended. We analyzed these
healthier juice choices, 100% juices and calcium fortified juice consumption. In participants
we did not see a significant change in children’s consumption of any type of juices over time;
however, both the control and experimental group increased their consumption of both 100%
and calcium- fortified juices (Table 3). When looking at consumption of at least one

18
beverage on an average day, calcium-fortified juices had an increase from baseline to 3-
months, regardless of group placement. That is, participants increased their consumption of
calcium-fortified juice from baseline to 3-months in both control and experimental group
(Table 3). This may have been due to participants knowing that dietary recalls were going to
be collected. Furthermore, participants were told that bone density was going to be measured.
Participants could have been more conscious about their food and beverage consumption in
relation to calcium and bone health. Participants could have made an effort to consume more
calcium through juices rather than milk due to it’s rewarding sugar flavors. Even though the
consumption of juices was not proven to be significant, the increasing consumption patterns
shown here hopes to reveal significance in future studies.
Juices, regardless of the nutrient content, contain more sugars than milk. The flavors
of sugars in juices may contribute to the increase of juice consumption. In addition, flavored
milk has been explored as a healthier-sweetened beverage alternative. More children
consumed flavored milk at schools when available. Even though flavored milk has sugars, it
has been found to be significantly associated with higher consumption of calcium and
phosphorus (Johnson et al., 2002). It is significantly associated with nutrient intake and not
weight gain in children (Murphy, Douglass, Johnson, & Spence, 2008). More studies should
look at the patterns of juice consumption over time, sugar content of different types of juices
and milk and how these factors contribute to nutrient intake in children and its effect on the
consumption of other beverages.
ETHNICITY AND BEVERAGE CONSUMPTION
Cultural influence might be a factor in what beverages children consume. A
significant difference was observed in soda, whole milk and fat-free milk consumption in
ethnicity at baseline. White children consumed more soda than other ethnicities. Others
(majority Latinos) consumed more whole milk than White children, while White children
consumed more fat-free milk than Others. This trend aligns with a study by Reedy & Krebs-
Smith (2010), exploring dietary sources of energy among children and adolescents in the US.
In Reedy and Krebs-Smith’s study, White children, aged 2-19, consumed more energy from
sodas and fruit drink than any other ethnicity. They also found that Mexican Americans
consumed more whole milk than Whites. Other studies have shown that minority young

19
adults significantly consume sugared beverages more than white participants (Huffman &
West, 2007). The relationship between ethnicity and beverage consumption is not clear.
Looking at the context for potential moderator is recommended. Research can include
mother, father and siblings, in a diet modification program to look at how family contributes
to a child’s consumption of beverage. For example, a mother’s choice of beverage for her
children is different than the child’s actual preference of beverage. A diet modification
program can target different ethnicities and compare the effect across ethnic groups.
Additional research is also recommended, not only to explore how ethnicity affects beverage
consumption, but focus on the relationship between milk types and ethnicity.
FAMILY-BASED INTERVENTIONS
Health education given to both parents and children is fundamental to decrease SSB
consumption in children and increase calcium rich beverages. We suggest that research look
at social and physical environmental factors when considering changing a dietary behavior of
a child. The HYPP study targeted both parent and child acknowledging that parents are a big
influence to the child’s environment. In a study by (Harel, Riggs, Vaz, White, & Menzies,
1998) adolescents reported receiving information regarding calcium sources from health
classes (55%) and parents (46%). The strong relationship between parent and child, including
monitoring and communication, reinforces a child’s health behavior (Crouter & Head, 2002).
Evidence-supported, family- based interventions are popularly used in literature due
to its effectiveness in improving dietary behaviors. In a study by Kalarchian et al. (2009) a
randomized control trial was implemented to manage weight in 192, 8-12 year old severely
obese children. A family based intervention was conducted for the experimental group. The
6-month intervention consisted of 20 sessions were child and adult met separately for 60
minutes. Sessions consisted of dietary and physical activity behavioral modification
techniques. Self-monitoring, attainable goal setting, skills training, positive reinforcement
and role modeling were all incorporated into the intervention. Three follow-up supportive
phone calls and three sessions were conducted after the 6-month and 18-month period. The
primary outcome measure was child percent weight (BMI). Results indicated significant
decrease of BMI at 6-month period for the intervention.

20
Family-based interventions like HYPP have been proven to be effective in modifying
diet in children. In the HYPP study, parent and children were given independent training in a
classroom setting as well as telephone coaching. In both, HYPP and Kalarchian’s study,
parent and child were given separate, intensive educational training.
LIMITATIONS
These analyses demonstrated a significant relationship in calcium increase from a
parent-child training and its effects on beverage choice among participants. However,
limitations need to be noted. Limitations include reporting baseline and 3-month data in
geometric means and reported change scores in raw variables. This inconsistent reporting
was due to some participants consuming very little of overall beverages and few participants
consuming a lot of one beverage. This made it difficult to obtain data with a normalized
distribution. The log was taken to normalize the data. The antilog was taken to convert data
to their natural value. However, the change score were normally distributed and did not need
to be log transformed. Values were skewed in baseline and 3-month data but were normally
distributed in the change score. In order to avoiding confusion, we decided to report data that
are normally distributed at baseline, 3 months, and change scores.
Other limitations include reporting bias. Participants may have been too young to
accurately complete self-reported questionnaires or phone questionnaires. Even though
parents helped children with recall and were provided measuring tools (cups, spoons and
food pictures), they might not have been with the child at all times to know what they
consumed, resulting in under-reporting or over- reporting. Further, the validity of the self-
reported data of only three days is a limitation. Three days is a short period to truly capture
the normal consumption pattern of a child, however all recalls were averaged. The exclusion
of other beverages such as diet sodas, water, tea and multivitamin supplemental beverages is
a limitation. Due to a low number of participants consuming these beverages, analyses of
these beverages were not feasible.
IMPLICATIONS
Even though beverage trends among U.S. children are of great concern, literature
supports the relationship between food consumption, behavior modification and

21
improvement of health. This secondary analysis aimed to support interventions targeting
children’s health through the modification of diet, in particularly beverage consumption.
Interventions such as the HYPP study prove, to not only increase calcium through milk, but
also improve the choice of milk a child consumes. A shift from whole milk to less fat milk
can be promoted in more diet modification programs. There is a need for more focus on
shifting beverage trends from high-calorie beverages (SSB) to healthier beverages (reduced-
fat milk, fat-free milk and 100% juices). Furthermore, if certain beverages, such as milk,
show to be affected by the increase or decrease of another, such as SSB, researchers can
focus on these patterns and plan interventions accordingly.
Policy and environment may also play a role in the effectiveness of beverage
modification programs. In 2005, the New York City Department of Education implemented
the reduction of whole milk in schools and switched to reduced and fat free milk in order to
decrease the prevalence of childhood obesity. Children consumed 25% less calories and 81%
less fat from milk due to this change (CDC, 2010). The substitution of nutrient-dense
beverages over high calorie- sugar beverages needs to be supported through policy change.
There are various factors contributing to lack of calcium intake and over-consumption
of SSB in children. Research and interventions need to consider the child’s environment,
ethnicity and beverage content, like sugars. A comprehensive approach intervening with
various determinants are popularly used and are conceptually recommendable (Harrington,
2008). Family based interventions and cross- sectional measurements are a recommended
approach proven to be effective in various behavior modification interventions such as, diet
(Kalarchian et al., 2009; Wilfley et al., 2007). Researchers need to consider high fidelity of
interventions, that is, the extent to which the intervention was consistent with behavioral
theory. Health behaviors with high fidelity have been proven to be effective (Keller et al.,
2009). High fidelity is recommended to obtain the best replicable interventions that will have
an effect on healthier beverage consumption in children. The HYPP, based on learning
theory, proved to have high fidelity, thus obtained significant results that matched the
intervention’s purpose.
These analyses reinforce national trends of beverage consumption in children proven
by various studies. The study increased reduced and fat-free milk while decreasing whole

22
milk. This pioneers research in randomized control family-based intervention to increase
calcium through healthier choices of beverages, in particularly reduced and fat-free milk.

23
REFERENCES
American Academy of Pediatrics. (2004). Soft drinks in schools. Pediatrics, 113(1 Pt 1), 152.
Babey, S. H., Jones, M., Yu, H., & Goldstein, H. (2009). Bubbling over: Soda consumption and its link to obesity in California. Policy Brief (UCLA Center For Health Policy Research) (PB2009-5), 1-8.
Ballew C., Kuester S., Gillespie C. (2000). Beverage choices affect adequacy of children’s nutrient intakes. Archives of Pediatrics & Adolescent Medicine, 154(11). 1148-1152.
Bonjour, J. P., Carrie, A. L., Ferrari, S., Clavien, H., Slosman, D., Theintz, G., et al. (1997). Calcium-enriched foods and bone mass growth in prepubertal girls: A randomized, double-blind, placebo-controlled trial. The Journal Of Clinical Investigation, 99(6), 1287-1294.
Bray, G. A., Nielsen, S. J., & Popkin, B. M. (2004). Consumption of high-fructose corn syrup in beverages may play a role in the epidemic of obesity. The American Journal of Clinical Nutrition, 79(4), 537.
Centers for Disease Control and Prevention. (2007). Youth risk behavior surveillance system- United States, 2007. MMWR: Morbidity & Mortality Weekly Report, 57(SS04), 1-131.
Centers for Disease Control and Prevention. (2010). Effects of switching from whole to low-fat/fat-free milk in public schools -- New York City, 2004-2009. MMWR: Morbidity & Mortality Weekly Report, 59(3), 70-73.
Crouter, A. C., & Head, M. R. (2002). Parental monitoring and knowledge of children. In M. Bornstein, (Ed.), Handbook of Parenting (pp. 461-483). Mahwah, NJ: Erlbaum.
Dubois, L., Farmer, A., Girard, M., & Peterson, K. (2007). Regular sugar-sweetened beverage consumption between meals increases risk of overweight among preschool-aged children. Journal of the American Dietetic Association, 107(6), 924. doi: 10.1016/j.jada.2007.03.004
French, S. A., Lin, B. H., & Guthrie, J. F. (2003). National trends in soft drink consumption among children and adolescents age 6 to 17 years: Prevalence, amounts, and sources, 1977/1978 to 1994/1998. Journal of the American Dietetic Association, 103(10), 1326.
French, S. A., & Story, M. (2004). Soda isn't only low in calcium. Journal of Bone and Mineral Research: The Official Journal of the American Society for Bone and Mineral Research, 19(5), 870-872.
Harel, Z., Riggs, S., Vaz, R., White, L., & Menzies, G. (1998). Adolescents and calcium: What they do and do not know and how much they consume. Journal of Adolescent Health, 22(3), 225-228. doi: 10.1016/s1054-139x(97)00174-2

24
Harnack, L., Stang, J., & Story, M. (1999). Soft drink consumption among US children and adolescents: Nutritional consequences. Journal of the American Dietetic Association, 99(4), 436-441.
Harrington, S. (2008). The role of sugar-sweetened beverage consumption in adolescent obesity: A review of the literature. The Journal of School Nursing: The Official Publication of the National Association of School Nurses, 24(1), 3.
Heaney, R. P., Davies, K. M., & Barger-Lux, M. J. (2002). Calcium and weight: Clinical studies. Journal Of The American College Of Nutrition, 21(2), 152S-155S.
Hovell, M. F., Nichols, J. F., Irvin, V. L., Schmitz, K. E., Rock, C. L., Hofstetter, C. R., et al. (2008). Parent/Child training to increase preteens' calcium, physical activity, and bone density: A controlled trial. American Journal of Health Promotion, 24(2), 118.
Huffman, L., & West, D. S. (2007). Readiness to change sugar sweetened beverage intake among college students. Eating Behaviors, 8(1), 10-14.
James, J., & Kerr, D. (2005). Prevention of childhood obesity by reducing soft drinks. International Journal of Obesity, 29, S54-S57.
James, J., Thomas, P., Cavan, D., & Kerr, D. (2004). Preventing childhood obesity by reducing consumption of carbonated drinks: Cluster randomised controlled trial. British Medical Journal, 328(7450), 1237. doi: 10.1136/bmj.38077.458438.EE
Johnson, R. K., Frary, C., & Wang, M. Q. (2002). The nutritional consequences of flavored-milk consumption by school-aged children and adolescents in the United States. Journal Of The American Dietetic Association, 102(6), 853-856.
Johnston, C. C., Miller, J. Z., Slemenda, C. W., Reister, T. K., Hui, S., Christian, J. C., et al. (1992). Calcium supplementation and increases in bone mineral density in children. The New England Journal Of Medicine, 327(2), 82-87.
Kalarchian, M. A., Levine, M. D., Arslanian, S. A., Ewing, L. J., Houck, P. R., Cheng, Y., et al. (2009). Family-based treatment of severe pediatric obesity: Randomized, controlled trial. Pediatrics, 124(4), 1060. doi: 10.1542/peds.2008-3727
Keller, K. L., Kirzner, J., Pietrobelli, A., St-Onge, M. P., & Faith, M. S. (2009). Increased sweetened beverage intake is associated with reduced milk and calcium intake in 3- to 7-year-old children at multi-item laboratory lunches. Journal of the American Dietetic Association, 109(3), 497. doi: 10.1016/j.jada.2008.11.030
Lloyd, T., Andon, M. B., Rollings, N., Martel, J. K., Landis, J. R., Demers, L. M., et al. (1993). Calcium supplementation and bone mineral density in adolescent girls. The Journal of the American Medical Association, 270(7), 841-844.
Marshall, T. A., Eichenberger Gilmore, J. M., Broffitt, B., Stumbo, P. J., & Levy, S. M. (2005). Diet quality in young children is influenced by beverage consumption. Journal of the American College of Nutrition, 24(1), 65.
Murphy, M., Douglass, J., Johnson, R., & Spence, L. (2008). Drinking flavored or plain milk is positively associated with nutrient intake and is not associated with adverse effects on weight status in US children and adolescents. Journal of the American Dietetic

25
Association, 108(4), 631-639. doi: S0002-8223(08)00005-9 [pii] 10.1016/j.jada.2008.01.004
National Institute of Health: Osteoporosis and Related Bone Diseases National Resource Center. (2009). Kids and their bones: A guide for parents. Retrieved from http://www.niams.nih.gov/Health_Info/Bone/Bone_Health/Juvenile/default.asp
Nielsen, S. J., & Popkin, B. M. (2004). Changes in beverage intake between 1977 and 2001. American Journal of Preventive Medicine, 27(3), 205. doi: 10.1016/j.amepre.2004.05.005
Rampersaud, G. C., Bailey, L. B., & Kauwell, G. P. (2003). National survey beverage consumption data for children and adolescents indicate the need to encourage a shift toward more nutritive beverages. Journal of the American Dietetic Association, 103(1), 97. doi: 10.1053/jada.2003.50006
Reedy, J., & Krebs-Smith, S. M. (2010). Dietary sources of energy, solid fats, and added sugars among children and adolescents in the United States. Journal Of The American Dietetic Association, 110(10), 1477-1484.
Saelens, B. E., Couch, S. C., Wosje, K. S., Stark, L. J., & Daniels, S. R. (2006). Relations among milk and non-milk beverage consumption, calcium, and relative weight in high-weight status children. Journal of Clinical Psychology in Medical Settings, 13(2), 121-130. doi: 10.1007/s10880-006-9017-8
Stokols, D. (1996). Translating social ecological theory into guidelines for community health promotion. American Journal of Health Promotion, 10(4), 282-298.
Swinburn, B. A., Caterson, I., Seidell, J. C., & James, W. P. (2004). Diet, nutrition and the prevention of excess weight gain and obesity. Public Health Nutrition, 7(1A), 123.
Teegarden, D. (2003). Calcium intake and reduction in weight or fat mass. The Journal of Nutrition, 133(1), 249S-251S.
Troiano, R. P., Briefel, R. R., Carroll, M. D., & Bailostosky, K. (2000). Energy and fat intakes of children and adolescents in the United States: Data from the national health and nutrition examination surveys. American Journal of Clinical Nutrition, 72(5), 1343S-1353S.
United States Department of Health and Human Services. (2000). Nutrition and overweight. Retrieved from http://www.hhs.gov/opa/pubs/hp2010/hp2010rh_sec2_nao.pdf
Wang, Y. C., Bleich, S. N., & Gortmaker, S. L. (2008). Increasing caloric contribution from sugar-sweetened beverages and 100% fruit juices among US children and adolescents, 1988-2004. Pediatrics, 121(6), e1604. doi: 10.1542/peds.2007-2834
Watt, R. G., Dykes, J., & Sheiham, A. (2000). Drink consumption in British preschool children: Relation to vitamin c, iron and calcium intakes. Journal of Human Nutrition and Dietetics, 13(1), 13-19. doi: 10.1046/j.1365-277x.2000.00212.x
Wilfley, D. E., Tibbs, T. L., Van Buren, D. J., Reach, K. P., Walker, M. S., & Epstein, L. H. (2007). Lifestyle interventions in the treatment of childhood overweight: A meta-analytic review of randomized controlled trials. Health psychology: Official Journal

26
of the Division of Health Psychology, American Psychological Association, 26(5), 521. doi: 10.1037/0278-6133.26.5.521
Zemel, M. B., Donnelly, J. E., Smith, B. K., Sullivan, D. K., Richards, J., Morgan-Hanusa, D., et al. (2008). Effects of dairy intake on weight maintenance. Nutrition & Metabolism, 5, 28-28.