change in dominance determines herbivore effects on plant
TRANSCRIPT
A B
DispatchDate: 28.09.2018 · ProofNo: 696, p.1
123456789101112131415161718192021222324252627282930313233343536373839404142434445464748495051525354555657585960616263
Articleshttps://doi.org/10.1038/s41559-018-0696-y
Consumers play a critical role in determining the structure and functioning of most ecosystems1. However, human activities have greatly altered top-down control by consumers with
consequences for biodiversity and other ecosystem services not yet fully understood1. In part, this uncertainty arises because the effects of consumers on biodiversity are highly variable in both aquatic and terrestrial ecosystems2–7. One theory predicts that the effects of herbivores on biodiversity (species richness, the number of species)
vary with ecosystem productivity2,4,5,7–10. In more productive systems, herbivory is expected to reduce the abundance of dominant species and increase biodiversity7. Dominant species often impact com-munity structure11, including species biodiversity, by monopolizing resources. Decreased dominance can be directly linked to increased availability of resources, including light, nutrients and water, lead-ing to increased abundance of less common species, colonization by new species and/or a decrease in local species extinctions7. In
Change in dominance determines herbivore effects on plant biodiversitySally E. Koerner 1,76*, Melinda D. Smith 2,76, Deron E. Burkepile 3,76, Niall P. Hanan4,76, Meghan L. Avolio5,76, Scott L. Collins 6,76, Alan K. Knapp2,76, Nathan P. Lemoine2,76, Elisabeth J. Forrestel7,76, Stephanie Eby8,76, Dave I. Thompson 9,10,76, Gerardo Aguado-Santacruz11, John P. Anderson12, Michael Anderson13, Ayana Angassa 14, Sumanta Bagchi15, Elisabeth S. Bakker 16, Gary Bastin17, Lauren E. Baur6, Karen H. Beard 18, Erik A. Beever 19, Patrick J. Bohlen20, Elizabeth H. Boughton 21, Don Canestro22, Ariela Cesa23, Enrique Chaneton24, Jimin Cheng25, Carla M. D’Antonio26, Claire Deleglise 27, Fadiala Dembélé28, Josh Dorrough29, David Eldridge30, Barbara Fernandez-Going31, Silvia Fernández-Lugo32, Lauchlan H. Fraser33, Bill Freedman34, Gonzalo Garcia-Salgado35, Jacob R. Goheen36, Liang Guo25, Sean Husheer37, Moussa Karembé38, Johannes M. H. Knops39, Tineke Kraaij 40, Andrew Kulmatiski18, Minna-Maarit Kytöviita 41, Felipe Lezama42, Gregory Loucougaray27, Alejandro Loydi 43, Dan G. Milchunas44,75, Sue Milton 45, John W. Morgan46, Claire Moxham47, Kyle C. Nehring48, Han Olff49, Todd M. Palmer 50, Salvador Rebollo 51, Corinna Riginos 52, Anita C. Risch 53, Marta Rueda54, Mahesh Sankaran55,56, Takehiro Sasaki57, Kathryn Schoenecker 58, Nick L. Schultz 59, Martin Schütz53, Angelika Schwabe60, Frances Siebert 61, Christian Smit62, Karen A. Stahlheber 63, Christian Storm60, Dustin J. Strong64, Jishuai Su65, Yadugiri V. Tiruvaimozhi56, Claudia Tyler66, James Val67, Martijn L. Vandegehuchte 53,68, Kari E. Veblen18, Lance T. Vermeire64, David Ward69, Jianshuang Wu 70, Truman P. Young 71,72, Qiang Yu73 and Tamara Jane Zelikova74
Herbivores alter plant biodiversity (species richness) in many of the world’s ecosystems, but the magnitude and the direction of herbivore effects on biodiversity vary widely within and among ecosystems. One current theory predicts that herbivores enhance plant biodiversity at high productivity but have the opposite effect at low productivity. Yet, empirical support for the importance of site productivity as a mediator of these herbivore impacts is equivocal. Here, we synthesize data from 252 large-herbivore exclusion studies, spanning a 20-fold range in site productivity, to test an alternative hypothesis—that herbi-vore-induced changes in the competitive environment determine the response of plant biodiversity to herbivory irrespective of productivity. Under this hypothesis, when herbivores reduce the abundance (biomass, cover) of dominant species (for example, because the dominant plant is palatable), additional resources become available to support new species, thereby increasing biodiversity. By contrast, if herbivores promote high dominance by increasing the abundance of herbivory-resistant, unpalat-able species, then resource availability for other species decreases reducing biodiversity. We show that herbivore-induced change in dominance, independent of site productivity or precipitation (a proxy for productivity), is the best predictor of herbivore effects on biodiversity in grassland and savannah sites. Given that most herbaceous ecosystems are dominated by one or a few species, altering the competitive environment via herbivores or by other means may be an effective strategy for conserving biodiversity in grasslands and savannahs globally.
Q5
A full list of affiliations appears at the end of the paper.
NATuRE ECOLOGY & EVOLuTION | www.nature.com/natecolevol
A B
DispatchDate: 28.09.2018 · ProofNo: 696, p.2
646566676869707172737475767778798081828384858687888990919293949596979899100101102103104105106107108109110111112113114115116117118119120121122123124125126127128129
Articles Nature ecology & evolutioN
contrast, at low productivity, herbivores are predicted to decrease biodiversity by either (1) increasing dominance by grazing-tolerant species, which may reduce colonization rates or enhance extinctions of other species, or (2) not affecting dominance if species are unpal-atable, but instead increasing extinctions of rare palatable species via consumption7. Collectively, these processes may result in a positive relationship between biodiversity and productivity with herbivory. However, deviations from this pattern are common, particularly in herbaceous plant communities (for example, see Olff and Ritchie7, Koerner et al.12, Milchunas and Lauenroth13 and Eldridge et al.14). These discrepancies call into question the generality of productivity as a mediator of herbivore effects on biodiversity via the dominance mechanism. Indeed, high levels of plant community dominance are found in both high-15 and low-productivity16 systems, which sug-gests that changes in dominance may impact biodiversity directly and irrespective of productivity.
Here, we test how changes in dominance determine biodiversity responses to herbivory, and whether this dominance mechanism is mediated by site productivity. We synthesized data from 252 grass-land and savannah sites (Fig. 1; Supplementary Table 1–3) that includes 1,212 plots sampled inside and outside of large-herbivore exclosures. These sites encompassed a broad range of environ-mental conditions across six biogeographic realms17. This data set included measures of plant community composition from all sites and aboveground net primary productivity (ANPP) from half the sites, as well as a number of herbivore community and site char-acteristics (see Methods). To quantify herbivore-induced changes in biodiversity, we calculated the log response ratio (ln(G/UG)) of plant species richness (average number of species per plot) outside (grazed, G) versus inside (ungrazed, UG) exclosures. We used two common dominance
metrics—the Berger–Parker and Simpson’s
Dominance Indexes18—to evaluate changes in dominance with her-bivory. Change of both metrics was calculated using log response ratios. We picked these two measures of dominance because both are robust to changes in richness at levels encompassed by our data sets (> 5; refs.18,19) and thus can vary independently of richness. The Berger–Parker Dominance Index is a measure of the relative cover of the most abundant species agnostic of species identity,
while
Simpson’s Dominance Index is a measure of diversity that is highly sensitive to abundant species20. We chose to focus on the Berger–Parker Dominance Index metric because of its simplicity and its mathematical independence from richness. However, Simpson’s Dominance Index, while more complicated, is a metric that can capture co-dominance by two or more species18. The inclusion of the Simpson’s Dominance Index metric in our analyses
Q7Q8Q9Q10
Q11
Q12
(see Supplementary Information) allowed us to examine the robust-ness of the patterns observed with the Berger–Parker Dominance Index metric.
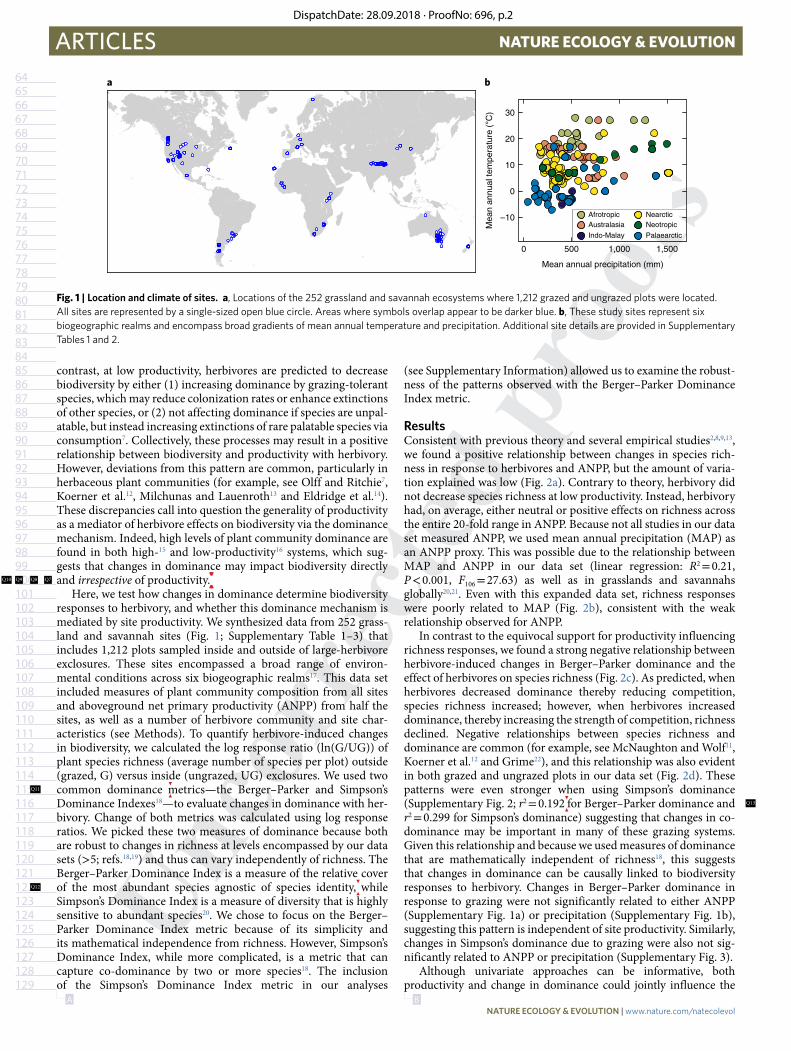
ResultsConsistent with previous theory and several empirical studies2,8,9,13, we found a positive relationship between changes in species rich-ness in response to herbivores and ANPP, but the amount of varia-tion explained was low (Fig. 2a). Contrary to theory, herbivory did not decrease species richness at low productivity. Instead, herbivory had, on average, either neutral or positive effects on richness across the entire 20-fold range in ANPP. Because not all studies in our data set measured ANPP, we used mean annual precipitation (MAP) as an ANPP proxy. This was possible due to the relationship between MAP and ANPP in our data set (linear regression: R2 = 0.21, P < 0.001, F106 = 27.63) as well as in grasslands and savannahs globally20,21. Even with this expanded data set, richness responses were poorly related to MAP (Fig. 2b), consistent with the weak relationship observed for ANPP.
In contrast to the equivocal support for productivity influencing richness responses, we found a strong negative relationship between herbivore-induced changes in Berger–Parker dominance and the effect of herbivores on species richness (Fig. 2c). As predicted, when herbivores decreased dominance thereby reducing competition, species richness increased; however, when herbivores increased dominance, thereby increasing the strength of competition, richness declined. Negative relationships between species richness and dominance are common (for example, see McNaughton and Wolf11, Koerner et al.12 and Grime22), and this relationship was also evident in both grazed and ungrazed plots in our data set (Fig. 2d). These patterns were even stronger when using Simpson’s dominance (Supplementary Fig. 2; r2 = 0.192
for Berger–Parker dominance and
r2 = 0.299 for Simpson’s dominance) suggesting that changes in co-dominance may be important in many of these grazing systems. Given this relationship and because we used measures of dominance that are mathematically independent of richness18, this suggests that changes in dominance can be causally linked to biodiversity responses to herbivory. Changes in Berger–Parker dominance in response to grazing were not significantly related to either ANPP (Supplementary Fig. 1a) or precipitation (Supplementary Fig. 1b), suggesting this pattern is independent of site productivity. Similarly, changes in Simpson’s dominance due to grazing were also not sig-nificantly related to ANPP or precipitation (Supplementary Fig. 3).
Although univariate approaches can be informative, both productivity and change in dominance could jointly influence the
Q13
30
a b
20
10
0
0
AfrotropicAustralasia
Indo-Malay
NearcticNeotropic
Palaearctic
Mea
n an
nual
tem
pera
ture
(°C
)
Mean annual precipitation (mm)
500 1,000 1,500
–10
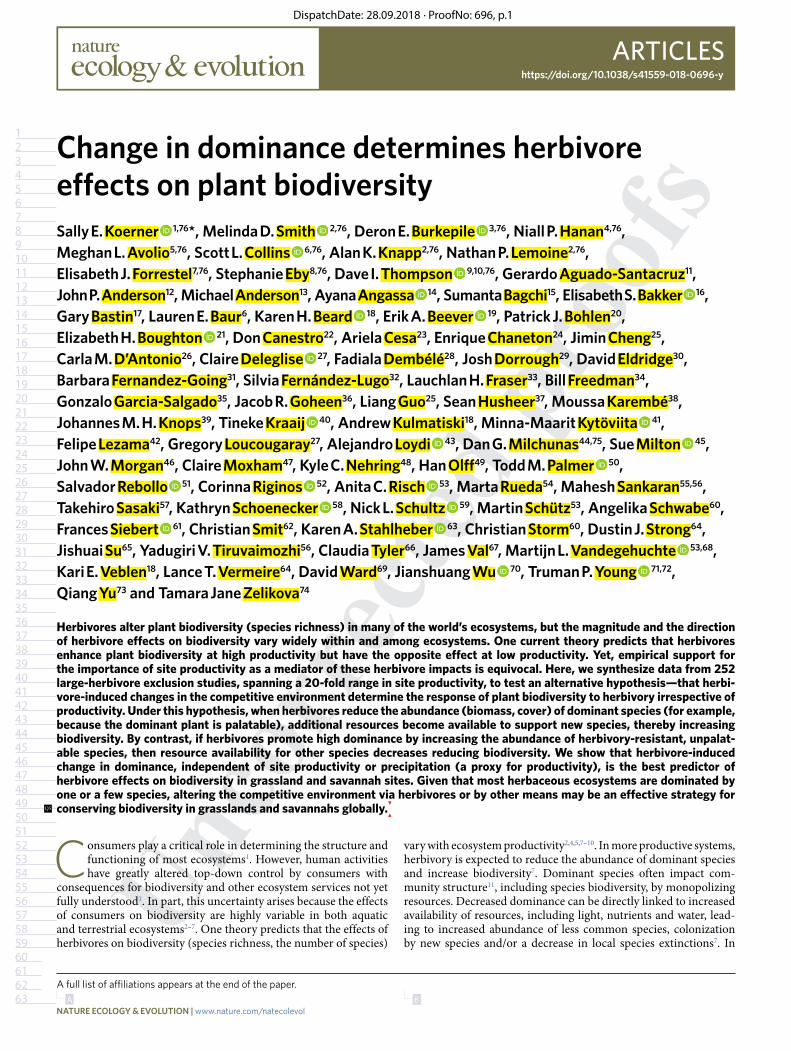
Fig. 1 | Location and climate of sites. a, Locations of the 252 grassland and savannah ecosystems where 1,212 grazed and ungrazed plots were located. All sites are represented by a single-sized open blue circle. Areas where symbols overlap appear to be darker blue. b, These study sites represent six biogeographic realms and encompass broad gradients of mean annual temperature and precipitation. Additional site details are provided in Supplementary Tables 1 and 2.
NATuRE ECOLOGY & EVOLuTION | www.nature.com/natecolevol
A B
DispatchDate: 28.09.2018 · ProofNo: 696, p.3
130131132133134135136137138139140141142143144145146147148149150151152153154155156157158159160161162163164165166167168169170171172173174175176177178179180181182183184185186187188189190191192193194195
ArticlesNature ecology & evolutioN
biodiversity response to herbivory. Therefore, we used path analysis23 to assess whether productivity mediates the effect of change in domi-nance on the richness responses to herbivory. Our a priori model included additional non-mutually exclusive factors that could influ-ence the relationship between herbivory and species richness7, such as characteristics of the herbivore community (estimates of herbivore pressure; herbivore species richness; if herbivores were domesticated or not; and if browsers/mixed feeders were present in addition to grazers), the plant community (size of the species pool) and the dura-tion of herbivore exclusion. See Methods for further details. These metrics allowed us to explicitly contrast the effects of site-level pro-ductivity versus change in dominance on the richness response to herbivory and include other factors that may affect both dominance and richness responses. We examined six alternative models (Fig. 3 and Supplementary Fig. 4) to explicitly contrast the effects of changes in ANPP versus dominance on the biodiversity response to grazing.
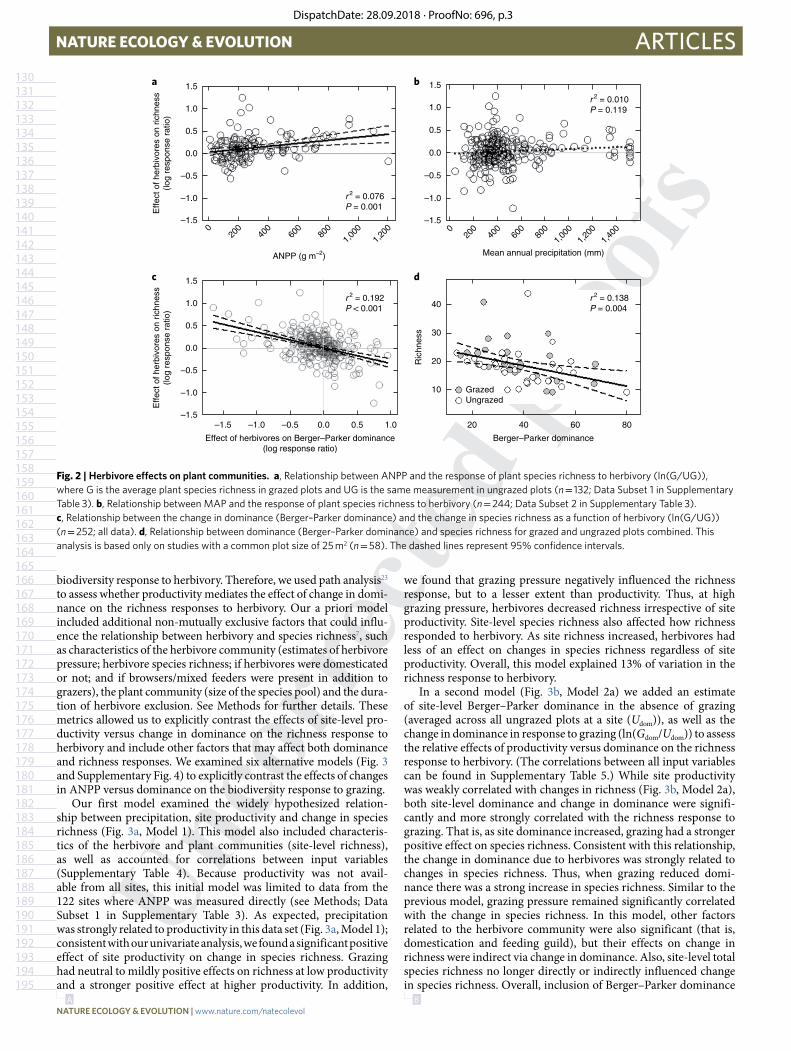
Our first model examined the widely hypothesized relation-ship between precipitation, site productivity and change in species richness (Fig. 3a, Model 1). This model also included characteris-tics of the herbivore and plant communities (site-level richness), as well as accounted for correlations between input variables (Supplementary Table 4). Because productivity was not avail-able from all sites, this initial model was limited to data from the 122 sites where ANPP was measured directly (see Methods; Data Subset 1 in Supplementary Table 3). As expected, precipitation was strongly related to productivity in this data set (Fig. 3a, Model 1); consistent with our univariate analysis, we found a significant positive effect of site productivity on change in species richness. Grazing had neutral to mildly positive effects on richness at low productivity and a stronger positive effect at higher productivity. In addition,
we found that grazing pressure negatively influenced the richness response, but to a lesser extent than productivity. Thus, at high grazing pressure, herbivores decreased richness irrespective of site productivity. Site-level species richness also affected how richness responded to herbivory. As site richness increased, herbivores had less of an effect on changes in species richness regardless of site productivity. Overall, this model explained 13% of variation in the richness response to herbivory.
In a second model (Fig. 3b, Model 2a) we added an estimate of site-level Berger–Parker dominance in the absence of grazing (averaged across all ungrazed plots at a site (Udom)), as well as the change in dominance in response to grazing (ln(Gdom/Udom)) to assess the relative effects of productivity versus dominance on the richness response to herbivory. (The correlations between all input variables can be found in Supplementary Table 5.) While site productivity was weakly correlated with changes in richness (Fig. 3b, Model 2a), both site-level dominance and change in dominance were signifi-cantly and more strongly correlated with the richness response to grazing. That is, as site dominance increased, grazing had a stronger positive effect on species richness. Consistent with this relationship, the change in dominance due to herbivores was strongly related to changes in species richness. Thus, when grazing reduced domi-nance there was a strong increase in species richness. Similar to the previous model, grazing pressure remained significantly correlated with the change in species richness. In this model, other factors related to the herbivore community were also significant (that is, domestication and feeding guild), but their effects on change in richness were indirect via change in dominance. Also, site-level total species richness no longer directly or indirectly influenced change in species richness. Overall, inclusion of Berger–Parker dominance
1.5a b
c d
1.0
0.5
0.0
020
040
060
0
ANPP (g m–2)
800
Mean annual precipitation (mm)
r 2 = 0.076P = 0.001
r 2 = 0.192P < 0.001
r 2 = 0.138P = 0.004
r 2 = 0.010P = 0.119
1,20
0 020
040
060
080
01,
000
1,00
01,
200
1,40
0
–0.5
–1.0
–1.5
1.5
1.0
1.0 20
GrazedUngrazed
40 60 80
0.5
0.5
0.0
0.0
10
20
30
40
–0.5
–0.5
–1.0
–1.0–1.5
–1.5
Effe
ct o
f her
bivo
res
on r
ichn
ess
(log
resp
onse
rat
io)
Effe
ct o
f her
bivo
res
on r
ichn
ess
(log
resp
onse
rat
io)
Effect of herbivores on Berger–Parker dominance(log response ratio)
Berger–Parker dominance
Ric
hnes
s
1.5
1.0
0.5
0.0
–0.5
–1.0
–1.5
Fig. 2 | Herbivore effects on plant communities. a, Relationship between ANPP and the response of plant species richness to herbivory (ln(G/UG)), where G is the average plant species richness in grazed plots and UG is the same measurement in ungrazed plots (n = 132; Data Subset 1 in Supplementary Table 3). b, Relationship between MAP and the response of plant species richness to herbivory (n = 244; Data Subset 2 in Supplementary Table 3). c, Relationship between the change in dominance (Berger–Parker dominance) and the change in species richness as a function of herbivory (ln(G/UG)) (n = 252; all data). d, Relationship between dominance (Berger–Parker dominance) and species richness for grazed and ungrazed plots combined. This analysis is based only on studies with a common plot size of 25 m2 (n = 58). The dashed lines represent 95% confidence intervals.
NATuRE ECOLOGY & EVOLuTION | www.nature.com/natecolevol
A B
DispatchDate: 28.09.2018 · ProofNo: 696, p.4
196197198199200201202203204205206207208209210211212213214215216217218219220221222223224225226227228229230231232233234235236237238239240241242243244245246247248249250251252253254255256257258259260261
Articles Nature ecology & evolutioN
doubled the explanatory power of the change in species richness when compared to the model that only included productivity (R2 = 0.31 versus 0.13). When this second model included Simpson’s instead of Berger–Parker dominance (Supplementary Fig. 4a, Model 2b; Supplementary Table 6), the explanatory power of the change in species richness increased (R2 = 0.39), providing robust support for change in dominance as key to explaining changes in richness with herbivory. Additionally, ANPP no longer has any effect on change in
richness from herbivory when Simpson’s dominance was included in the model.
Models 1, 2a and 2b (Supplementary Information) were limited to the 122 sites that had productivity measurements. Because pro-ductivity is strongly correlated with MAP in our data set (Fig. 3a,b, Models 1 and 2a)
as well as more broadly20, we used precipitation
as a proxy for productivity in Models 3, 4a and 4b (Supplementary Information). This allowed us to include 244 sites in the analysis
Q15
Model 1
Model 3
Model 2a—Berger–Parker dominance
Model 4a—Berger–Parker dominance
χ 2 = 11.829d.f. = 8
P = 0.159
χ 2 = 2.93d.f. = 2P = 0.23
χ 2 = 14.072d.f. = 11P = 0.229
χ 2 = 4.33d.f. = 5P = 0.50
–0.36**
0.23
**
0.18
*
0.19* –0.37**
–0.26**
Precipitation
Precipitation
Her
bivo
re r
ichn
ess
Her
bivo
re r
ichn
ess
Dom
estic
atio
n
Dom
estic
atio
n
Gra
zing
pre
ssur
e
Gra
zing
pre
ssur
e
Fee
ding
gui
ld
Fee
ding
gui
ld
Site
-leve
lB
erge
r–P
arke
rdo
min
ance
Site
-leve
lB
erge
r–P
arke
rdo
min
ance
Site
-leve
l spe
cies
richn
ess
Her
bivo
re r
ichn
ess
Dom
estic
atio
n
Gra
zing
pre
ssur
e
Fee
ding
gui
ld
Site
-leve
l spe
cies
richn
ess
Site
-leve
l spe
cies
richn
ess
Her
bivo
re r
ichn
ess
Dom
estic
atio
n
Gra
zing
pre
ssur
e
Fee
ding
gui
ld
Site
-leve
l spe
cies
richn
ess
Precipitation
Precipitation
R 2 = 0.24
R 2 = 0.11
R 2 = 0.24
R 2 = 0.27
R 2 = 0.26 R 2 = 0.28
R 2 = 0.13 R 2 = 0.31
0.49** 0.49**
0.27*
–0.32*
0.18*
0.26*–0.21*
–0.15†
–0.11†
0.11†
0.23*–0.18*
–0.47**
ANPP ANPP
Change in richness
Change in richness
Change in richness
Change in richness
Change inBerger–Parker
dominance
Change inBerger–Parker
dominance
–0.20*
–0.54**
a b
dc
Fig. 3 | Drivers of plant richness response to herbivory. a,b, Path analyses testing the importance of ANPP (Model 1) and Berger–Parker dominance (Model 2a) on the change in species richness in response to herbivory. These models are restricted to sites where both ANPP and precipitation data were available (n = 122; Data Subset 3 in Supplementary Table 3). See Supplementary Tables 4 and 5 for bivariate correlations between input variables that were included in these models to improve model fit. c,d, Path analyses testing the importance of productivity using precipitation as a proxy (Model 3) for productivity and Berger–Parker dominance (Model 4a) on the change in species richness in response to herbivory. These models use precipitation as a surrogate for ANPP allowing the use of more data (n = 244; Data Subset 2 in Supplementary Table 3). See Supplementary Tables 7 and 8 for bivariate correlations between the input variables that were included in these models to improve model fit. All models also test for the effects of site and herbivore characteristics (see Methods). **P < 0.001, *P < 0.05, †P <
0.10. Non-significant relationships are shown in light grey dashed arrows; solid black arrows
represent positive relationships and dashed black arrows represent negative relationships. The standardized effect sizes are shown, with arrow thickness proportional to the strength of the relationship. All models were a good fit to the data based on the chi-squared statistic (P > 0.05 goodness of fit). See Supplementary Table 10 for additional model fit parameters for all four models.
Q14
NATuRE ECOLOGY & EVOLuTION | www.nature.com/natecolevol

A B
DispatchDate: 28.09.2018 · ProofNo: 696, p.5
262263264265266267268269270271272273274275276277278279280281282283284285286287288289290291292293294295296297298299300301302303304305306307308309310311312313314315316317318319320321322323324325326327
ArticlesNature ecology & evolutioN
(Data Subset 3 in Supplementary Table 3). In Model 3, we examined the relationship between precipitation and change in species rich-ness without dominance (similar to Model 1 but using a larger data set) as well as accounted for correlations between input variables (Supplementary Table 7). As with the ANPP data set, Model 3 could only explain 11% of the variation in change in richness and there was no effect of precipitation in this model. When Berger–Parker dominance was included in the model (Model 4a; Supplementary Table 8), our explanatory power of change in richness more than doubled (R2 = 0.11 versus 0.26); when Simpson’s dominance was included (Supplementary Fig. 4b: Model 4b; Supplementary Table 9) our explanatory power of change in richness more than tripled (R2 = 0.11 versus 0.36). Similar to Model 2, we again found that site-level Berger–Parker dominance and change in Berger–Parker dominance with herbivores were the main drivers of her-bivory-induced changes in species richness (R2 = 0.26). However, precipitation, as a surrogate for productivity, had no significant effect in the model. Importantly, incorporating the larger data set in Models 4a and 4b demonstrated that herbivore-driven changes in dominance exert stronger effects on richness change than site-level dominance per se (standardized partial effect sizes of − 0.35 versus ns, respectively). These models also identified a strong, negative relationship between site-level dominance and change in dominance (standardized partial effect size of − 0.54 and − 0.58). This occurred because change in dominance is expressed as a ratio of grazed to ungrazed dominance and indicates that grazers reduce dominance more in sites with higher dominance. With this more comprehensive data set, we identified additional factors with direct and indirect effects on richness response to herbivory. For example, grazers alone had a stronger impact on changes in species rich-ness than when grazers and browsers were both present (standard-ized partial effect size for herbivore guild of − 0.26 and − 0.023).
This pattern suggests that grazers target dominant grasses that then outcompete subordinate species when released from herbivory. However, grazers and browsers may have less of a net effect on spe-cies richness due to compensatory feeding, supporting the theory7 and patterns from previous studies12,24,25. Overall, the more data-rich models confirm the role of dominance in controlling the richness response to herbivory rather than productivity.
To further explore the relationship between community domi-nance and herbivory, we focused on the palatability of the domi-nant species. Palatability strongly influences how a plant species responds to herbivory. Previous research has shown that herbivores reduce the dominance of palatable tall grasses in the productive mesic grasslands of North America, resulting in increased biodi-versity12,26. Alternatively, large herbivores in a mesic South African savannah dominated by an unpalatable grass had only minor impacts on dominance and diversity12. Dominant species can also be palatable but grazing-tolerant so that dominance increases with herbivory. This is the case in East African mesic grasslands where large herbivores generate extensive grazing lawns in which a few grazing-tolerant grasses withstand high densities of large herbivores and high rates of consumption27,28. Such grazing lawns exhibit both high dominance and low biodiversity27. Finally, high dominance and low biodiversity also could occur if there is another species in the community capable of compensating for reduced abundance of the dominant species. Thus, including traits that confer palatability of dominant species into analyses may be key to a more detailed mechanistic understanding of herbivore effects on biodiversity.
Assessing the role of palatability in determining dominance responses to herbivory was not possible with our empirical analysis due to a lack of trait data for the whole suite of plant species. However, we incorporated palatability into a stochastic com-munity assembly model to simulate the effect of herbivory on Berger–Parker dominance and richness independent of pro-ductivity. This model considered community assembly, as well
Q16
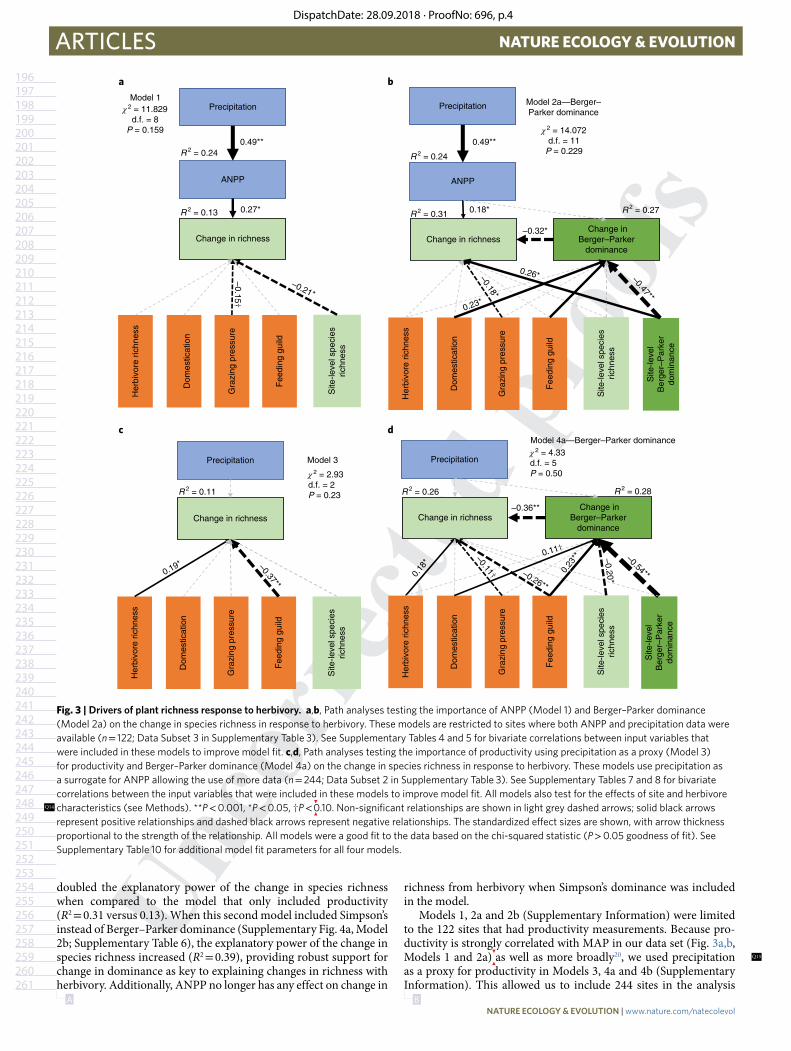
as dominance and richness responses following grazing, as ran-dom processes (see Methods for details). Change in dominance was calculated using the relative cover of the dominant spe-cies. In the model, changes in dominance and species richness can occur via competitor release, local extinction and new spe-cies arrivals. We assessed three scenarios with the model: (1) all dominant species are palatable, that is, grazed (Fig. 4a); (2) all dominant species are unpalatable (Fig. 4b); and (3) communities have a random chance of being dominated by either a palatable or unpalatable species (Fig. 4c). We found that when all simu-lated communities were dominated by palatable species (Fig. 4a) or when communities were dominated by either a palatable or unpalatable species (Fig. 4c), the resulting ensembles of 1,000 simulations generated richness and dominance responses to her-bivory that were remarkably similar to empirical observations (Fig. 2c). In contrast, if the dominant species was unpalatable (leaving only less common species to be grazed), there were few instances where richness increased while dominance decreased (that is, few points in the upper left-hand quadrant of Fig. 4b). These simulations are consistent with the biodiversity response to herbivory depending primarily on the palatability and subsequent response of the dominant species, irrespective of productivity.
DiscussionOur findings extend theory2,5,7,22,29 by identifying change in commu-nity dominance, and thus the competitive landscape, as the primary and generalizable mechanism underlying biodiversity response to herbivory. Change in dominance explains herbivore impacts on bio-diversity—both positive and negative—globally across grasslands and savannahs with 20-fold differences in productivity and vastly different biogeographic and evolutionary histories. This dominance mechanism is consistent with the light availability mechanism iden-tified by Borer et al.5 because increases in dominance can increase light limitation30. But dominance also changes with herbivory in sites where light is not limiting27. Thus, the dominance mecha-nism applies to a wider range of ecosystems, reflecting competitive interactions for the availability of either above- or below-ground resources7. This dominance mechanism is also consistent with the evolutionary history mechanism identified by Milchunas and col-leagues13,31 as dominance and the traits of the dominant species, particularly those related to palatability, are determined by a site’s evolutionary history. Strong community dominance by just a few species is a nearly universal feature of ecosystems15,22,29, and domi-nant species are known to control most ecosystem processes22,32. As a consequence, our results point to ‘dominance management’ as an effective strategy for conserving species biodiversity and ecosystem functioning in grasslands and savannahs globally.
MethodsData. We compiled a database, the Grazing Exclosure Database, consisting of plant community composition data from 252 large vertebrate herbivore exclosure sites (Supplementary Tables 1 and 2). To be included in the Grazing Exclosure Database, sites had to meet five criteria: (1) exclosures had to be located in herbaceous-dominated communities—sites ranged from tallgrass prairie to alpine meadows to desert, but all are dominated or co-dominated by herbaceous species; (2) large vertebrate herbivores (adult body mass > 45 kg) had to be excluded from plots using fencing with adjacent plots exposed to herbivores; herbivore type and number varies among the sites, including domesticated cattle, sheep, goats, burros and horses, as well as native wildlife such as caribou, kangaroo and the full complement of large African herbivores, and the inside of the exclosure could not be manipulated or managed other than the removal of herbivores (that is, no mowing or burning that did not also occur outside the exclosure); (3) data had to be collected after at least three years of exclusion of large herbivores; this was to ensure sufficient time for the plant community to respond to the absence of herbivores; (4) paired plots inside and outside the exclosure had to be sampled at the same time and sampling intensity; (5) community data had to be available at the species level; data types include cover, line intercept, biomass and pin hits (but not frequency or density), all of which were converted to relative abundance values.
NATuRE ECOLOGY & EVOLuTION | www.nature.com/natecolevol

A B
DispatchDate: 28.09.2018 · ProofNo: 696, p.6
328329330331332333334335336337338339340341342343344345346347348349350351352353354355356357358359360361362363364365366367368369370371372373374375376377378379380381382383384385386387388389390391392393
Articles Nature ecology & evolutioN
Explanatory variables. Several covariates were used in the analyses that described plant, experiment and herbivore community characteristics. Site primary productivity was based on ungrazed vegetation, as reported by individual investigators for a subset of the sites (n = 132). Individual investigators supplied precipitation data, while mean annual temperature was based on WorldClim33. Site-level richness and dominance were calculated using the species composition data. Site richness was calculated as the total number of plant species found across all plots. Site dominance was calculated as the mean dominance across all ungrazed plots using the Berger–Parker Dominance Index, which is the relative abundance of the most abundant species in the plot. Four variables were used to describe the herbivore community. Investigators provided an assessment of herbivory pressure (low, moderate, high) and species of large herbivores excluded. We converted herbivore species information into three variables: herbivore richness; feeding guild; and domestication. Herbivore richness is the number of large-herbivore species excluded by the fences. Predominantly, these exclosures excluded grazers (feeding guild = 0); when browsers or mixed feeders were present either in combination with grazers or alone (feeding guild = 1), we hypothesized this would have different effects on the herbaceous community. Domestication refers to human involvement with herbivore species presence and abundance. Native herbivores (wildlife) were coded as domestication = 0, while domesticated herbivores (for example, cattle) or the combination of the two were coded as domestication = 1 since they were hypothesized to have different effects than native herbivores alone. Experiment length was the number of years post exclosure construction; this variable was included in many exploratory analyses but was never significant and often led to poor model fit to the data. Exclosure age was not significantly correlated with either change in richness or change in dominance. Therefore, exclosure age was dropped from all path analyses.
Although many sites provided multiple years of data, here we present only the most recent year of data collected from each site. For analyses involving ANPP, a subset of sites was used (n = 132; Data Subset 1 in Supplementary Table 3), while nearly all sites were included in analyses using only precipitation (n = 244; 8 sites were strategically placed in topographic locations that were either wetter or drier than expected based on precipitation and were, therefore, only used in the ANPP analysis but not the precipitation analyses; Data Subset 2 in Supplementary Table 3). Likewise, when models included both ANPP and precipitation, a subset was used (n = 122; Data Subset 3 in Supplementary Table 3). When models did not include either ANPP or precipitation as predictors, we used all sites in the database (n = 252).
Response variables. The majority of sites had a single exclosure (n = 132). When more than one exclosure was built in the same year, each exclosure and corresponding paired plot was considered a block. When multiple subplots were sampled within each exclosure or paired plot, species abundance was summed for each species across the subplots to obtain species data at the plot level (that is, one plot per block). Plant community richness and dominance were calculated at the plot level for inside and outside the exclosure. Plant community richness was calculated as the number of species in the plot in that year. Dominance was quantified in two ways. The Berger–Parker Dominance Index was calculated as the maximum relative abundance of the most abundant species in each plot. The Simpson’s Dominance Index was calculated as
∑==
D ps
S
sSimp1
2
where S is the number of species in the sample and ps is the proportional abundance of the sth species. To quantify herbivore-induced changes in biodiversity, we calculated the log response ratio (ln(G/UG)) of plant species richness outside (grazed, G) versus inside (ungrazed, UG) each exclosure. Change in community dominance with herbivory (both Berger–Parker and Simpson’s) was also estimated by using this log response ratio. The log response ratios were then averaged across blocks to obtain a single value for each site.
Analyses. We developed linear models using R version 3.1 (R Foundation for Statistical Computing). We used the lm() R function to analyse the relationships between the effect of herbivores on richness (log response ratio) and ANPP (Fig. 2a), MAP (Fig. 2b), and the effect of herbivores on dominance (log response ratio; Fig. 2c), and for the relationship between dominance and richness (Fig. 2d).
To determine the relative importance of various proposed explanatory variables on the richness response to herbivory (log response ratio), we used path analysis conducted in AMOS version 7 (SPSS). We contrasted the effects of site-level productivity versus dominance on species richness response to herbivory using two alternative models. All models also included hypothesized influential covariates, such as the characteristics of the herbivore community, the plant community and experimental duration. Data were screened for distributional properties and nonlinear relations. Site-level plant richness and herbivore richness were log-transformed as a result of these evaluations. While site-level dominance and richness theoretically could be driven by precipitation, the correlations between site-level richness and precipitation (Pearson’s correlation coefficient = 0.357; linear regression R2 = 0.126) and between site-level Berger–Parker dominance and precipitation (Pearson’s correlation coefficient = − 0.246; linear regression R2 = 0.06) within our data set were low. Therefore, these relationships were dropped from the path analysis due to replication constraints. Model 1 examined the widely hypothesized relationship between precipitation, ANPP and change in species richness (Fig. 3a). Because ANPP was not available from all sites, this model used data from 122 of the 252 sites where ANPP was measured and precipitation was a good proxy for ANPP. Model 2a (Fig. 3b) used the same data as Model 1 but included an estimate of site-level Berger–Parker dominance in the absence of grazing (Udom), as well as the change in Berger–Parker dominance in response to grazing (ln(Gdom/Udom)) to assess the relative effects of ANPP versus Berger–Parker dominance on richness response to herbivory. Model 2b—Simpson’s dominance (Supplementary Fig. 4a)—was the same as Model 2a but included an estimate of site-level Simpson’s dominance in the absence of grazing (USimpDom), as well as the change in Simpson’s dominance in response to grazing (ln(GSimpDom/USimpDom)) to assess the relative effects of ANPP versus Simpson’s dominance on richness response to herbivory. Because ANPP is strongly correlated with MAP, in our data set (Fig. 3a,b) and more broadly20, we used precipitation as a proxy for ANPP, allowing us to run similar models again but including 244 sites in the analysis (Model 3 and Models 4a and 4b). Several input variables were correlated (based on AMOS recommendations for correlated variables that improve model fit); therefore, they were included as such in the models (Supplementary Tables 4–9). All models were a good fit to the data, according the chi-squared statistic with P > 0.05 as well as other measures of goodness of fit (see Supplementary Table 10).
Null model simulation. To explore possible mechanisms for observed herbaceous community responses to herbivory, we created a simple community assembly
1.0
0.5
0.0
–0.5
–1.0
–1.5 –1.0 –0.5 0.0 0.5 1.0
Log dominance response ratio Log dominance response ratio Log dominance response ratio
Log
richn
ess
resp
onse
rat
io
Log
richn
ess
resp
onse
rat
io
Log
richn
ess
resp
onse
rat
io
–1.5 –1.0 –0.5 0.0 0.5 1.0 –1.5 –1.0 –0.5 0.0 0.5 1.0
1.0
0.5
0.0
–0.5
–1.0
1.0
0.5
0.0
–0.5
–1.0
a b c
Fig. 4 | Simulation of plant community assembly in response to herbivory with three scenarios of palatability of the dominant species. a, In the first scenario, each assembled community has a dominant species that is grazed (blue) and all subordinate species have a 50% probability of being a grazed species. b, In the second scenario, each assembled community has a dominant species that is not grazed (red) and all subordinate species have a 50% probability of being a grazed species. c, In the third scenario, in each assembled community all plant species have a 50% probability of being a grazed species including the dominant species. The blue dots represent communities that have a dominant species that is grazed. The red dots represent assembled communities in which the dominant species was ungrazed. All scenarios treat community assembly and dominance, and richness responses following grazing, as random processes (see details in Methods).
NATuRE ECOLOGY & EVOLuTION | www.nature.com/natecolevol
A B
DispatchDate: 28.09.2018 · ProofNo: 696, p.7
394395396397398399400401402403404405406407408409410411412413414415416417418419420421422423424425426427428429430431432433434435436437438439440441442443444445446447448449450451452453454455456457458459
ArticlesNature ecology & evolutioN
and grazing response model in which idealized plant communities first assemble stochastically, with each new species assigned a canopy cover drawn from a negative binomial distribution (mean cover, μ = 15%; dispersion = 1.0) until the collective canopy cover = 100% of available space, after which time no further species can be added. The grazing process is then simulated with (1) species in the community assigned as ‘palatable’ or ‘unpalatable’ using a random binomial process (P = 0.5), and (2) reduction in cover of palatable species simulated as a random uniform process where ~50% of palatable species are excluded by grazing (that is, cover is reduced to 0%), and the cover of the remaining palatable species is reduced by 50–99% of their original extent. The community response to the resources made available through grazing-induced loss in plant cover is then simulated via the effect of two mechanisms: (1) competitive release of ungrazed species (‘growth response’); and (2) establishment of novel species (that is, species assumed to have been absent in the ungrazed community, but available in the regional species pool; ‘immigration response’). The growth and immigration responses are simulated alternately until the resulting community again occupies all available space, with each ungrazed species increasing its cover in proportion to the grazing-induced loss in total cover in the plot, and new immigrants arriving via the negative binomial stochastic process used in the original community assembly.
Data availabilityWhile raw species abundances are not publicly available because of lack of permission from data owners (contact individual data set owners listed in Supplementary Table 1), all data generated and analysed during the current study (site-level richness response to herbivory, site-level Berger–Parker and Simpson’s dominance response to herbivory, site ANPP, and site MAP) are provided in Supplementary Table 2.
Received: 31 January 2017; Accepted: 13 September 2018; Published: xx xx xxxx
References 1. Estes, J. A. et al.Trophic downgrading of planet Earth. Science 333, 301–306
(2011). 2. Bakker, E. S., Ritchie, M. E., Olff, H., Milchunas, D. G. & Knops, J. M.
H.Herbivore impact on grassland plant diversity depends on habitat productivity and herbivore size. Ecol. Lett. 9, 780–788 (2006).
3. Proulx, M. & Mazumder, A.Reversal of grazing impact on plant species richness in nutrient-poor vs. nutrient-rich ecosystems. Ecology 79, 2581–2592 (1998).
4. Worm, B., Lotze, H. K., Hillebrand, H. & Sommer, U. Consumer versus resource control of species diversity and ecosystem functioning. Nature 417, 848–851 (2002).
5. Borer, E. T. et al.Herbivores and nutrients control grassland plant diversity via light limitation. Nature 508, 517–520 (2014).
6. Hillebrand, H. et al. Consumer versus resource control of producer diversity depends on ecosystem type and producer community structure. Proc. Natl Acad. Sci. USA 104, 10904–10909 (2007).
7. Olff, H. & Ritchie, M. E. Effects of herbivores on grassland plant diversity. Trends Ecol. Evol. 13, 261–265 (1998).
8. Osem, Y., Perevolotsky, A. & Kigel, J.Grazing effect on diversity of annual plant communities in a semi-arid rangeland: interactions with small-scale spatial and temporal variation in primary productivity. J. Ecol. 90, 936–946 (2002).
9. Lezama, F. et al. Variation of grazing-induced vegetation changes across a large-scale productivity gradient. J. Veg. Sci. 25, 8–21 (2014).
10. Frank, D. A., McNaughton, S. J. & Tracy, B. F. The ecology of the Earth’s grazing ecosystems. BioScience 48, 513–521 (1998).
11. McNaughton, S. J. & Wolf, L. L.Dominance and the niche in ecological systems. Science 167, 131–139 (1970).
12. Koerner, S. E. et al.Plant community response to loss of large herbivores differs between North American and South African savanna grasslands. Ecology 95, 808–816 (2014).
13. Milchunas, D. G. & Lauenroth, W. K.Quantitative effects of grazing on vegetation and soils over a global range of environments. Ecol. Monogr. 63, 327–366 (1993).
14. Eldridge, D. J., Poore, A. G. B., Ruiz-Colmenero, M., Letnic, M. & Soliveres, S.Ecosystem structure, function, and composition in rangelands are negatively affected by livestock grazing. Ecol. Appl. 26, 1273–1283 (2016).
15. Smith, M. D. & Knapp, A. K.Dominant species maintain ecosystem function with non-random species loss. Ecol. Lett. 6, 509–517 (2003).
16. Collins, S. L. & Xia, Y.Long-term dynamics and hotspots of change in a desert grassland plant community. Am. Nat. 185, E30–E43 (2015).
17. Olson, D. M. et al. Terrestrial ecoregions of the world: a new map of life on earth. BioScience 51, 933–938 (2001).
18. Magguran, A. E. Measuring Biological Diversity (Wiley-Blackwell, New York, 2013).
19. Smith, B. & Wilson, J B. A consumer’s guide to evenness indices. Oikos 76, 70–82 (1996).
20. Sala, O. E., Gherardi, L. A., Reichmann, L., Jobbágy, E. & Peters, D. Legacies of precipitation fluctuations on primary production: theory and data synthesis. Philos. Trans. R. Soc. Lond., B, Biol. Sci. 367, 3135–3144 (2012).
21. Forrestel, E. J. et al. Different clades and traits yield similar grassland functional responses. Proc. Natl Acad. Sci. USA 114, 705–710 (2017).
22. Grime, J. P.Benefits of plant diversity to ecosystems: immediate, filter and founder effects. J. Ecol. 86, 902–910 (1998).
23. Grace, J. B. et al.Integrative modelling reveals mechanisms linking productivity and plant species richness. Nature 529, 390–393 (2016).
24. Eby, S. et al. Loss of a large grazer impacts savanna grassland plant communities similarly in North America
and South Africa. Oecologia. 175,
293–303 (2014). 25. Burkepile, D. E. et al. Fire frequency drives habitat selection by a diverse
herbivore guild impacting top-down control of plant communities in an African savanna. Oikos 125, 1636–1646 (2016).
26. Collins, S. L., Knapp, A. K., Briggs, J. M., Blair, J. M. & Steinauer, E. M.Modulation of diversity by grazing and mowing in native tallgrass prairie. Science 280, 745–747 (1998).
27. McNaughton, S. J. Serengeti grassland ecology: the role of composite environmental factors and contingency in community organization. Ecol. Monogr. 53, 291–320 (1983).
28. Plas, F., Howison, R. A., Mpanza, N., Cromsigt, J. P. G. M. & Olff, H. Different‐sized grazers have distinctive effects on plant functional composition of an African savannah. J. Ecol. 104, 864–875 (2016).
29. Whittaker, R. H. Dominance and diversity in land plant communities: numerical relations of species express the importance of competition in community function and evolution. Science 147, 250–260 (1965).
30. Smith, M. D., Wilcox, J. C., Kelly, T. & Knapp, A. K. Dominance not richness determines invasibility of tallgrass prairie. Oikos 106, 253–262 (2004).
31. Milchunas, D. G., Sala, O. E. & Lauenroth, W. K.A generalized model of the effects of grazing by large herbivores on grassland community structure. Am. Nat. 132, 87–106 (1988).
32. Yang, Z. et al. Daytime warming lowers community temporal stability by reducing the abundance of dominant, stable species. Glob. Chang. Biol. 23, 154–163 (2017).
33. Hijmans, R. J., Cameron, S. E., Parra, J. L., Jones, P. G. & Jarvis, A. Very high resolution interpolated climate surfaces for global land areas. Int. J. Climatol. 25, 1965–1978 (2005).
Acknowledgements
Funding for this synthesis was provided for by USDA AFRI Foundational Conference Grant (award no. 2018-67013-27400). We would like to thank the National Evolutionary Synthesis Center (Grasslands Working Group), the School of Global Environmental Sustainability at Colorado State University and the National Center for Ecological Analysis and Synthesis for hosting working meetings that led to these analyses. We also thank Mark Ritchie, David Augustine and Rob Pringle for helpful comments on an earlier version of the manuscript. Any use of trade, firm or product names is for descriptive purposes only and does not imply endorsement by the U.S. Government. Individual sites acknowledge funding support: Kenya Long-term Exclosure Experiment—NFS DEB 12-56004; Jornada—NSF DEB-0618210; Konza Prairie and Kruger National Park—NSF DEB 0841917.
Author contributionsS.E.K. managed the project including conceptualizing the questions, collecting and analysing the data, developing the figures and writing the manuscript. M.D.S. conceptualized the questions and wrote the manuscript. D.E.B. conceptualized the questions, collected the data and wrote the manuscript. N.P.H. performed simulations and wrote the manuscript. M.L.A. and N.P.L. executed the path analyses and developed the figures. S.L.C. and A.K.K. wrote the manuscript. S.E., E.J.F. and D.I.T. contributed to data collection and management. All authors who were not members of the Grazing Exclosure Working Group contributed data to the synthesis; all authors (both members of the working group and not) edited the manuscript. See the author contribution table (Supplementary Table 11) for a complete list of contributions.
Competing interests
The authors declare no competing interests.
Additional informationSupplementary information is available for this paper at https://doi.org/10.1038/s41559-018-0696-y.
Reprints and permissions information is available at www.nature.com/reprints.
Correspondence and requests for materials should be addressed to S.E.K.
Publisher’s note: Springer Nature remains neutral with regard to jurisdictional claims in published maps and institutional affiliations.
© The Author(s), under exclusive licence to Springer Nature Limited 2018
Q19
Q17
Q18
NATuRE ECOLOGY & EVOLuTION | www.nature.com/natecolevol
A B
DispatchDate: 28.09.2018 · ProofNo: 696, p.8
460461462463464465466467468469470471
Articles Nature ecology & evolutioN
1Department of Biology, University of North Carolina at Greensboro, Greensboro, NC, USA. 2Department of Biology and Graduate Degree Program in Ecology, Colorado State University, Fort Collins, CO, USA. 3Department of Ecology, Evolution, and Marine Biology, University of California, Santa Barbara, Santa Barbara, CA, USA. 4Jornada LTER Program & Plant and Environmental Sciences Department, New Mexico State University, Las Cruces, NM, USA. 5Department of Earth and Planetary Sciences, Johns Hopkins University, Baltimore, MD, USA. 6Department of Biology, University of New Mexico, Albuquerque, NM, USA. 7Department of Viticulture and Enology, University of California, Davis, Davis, CA, USA. 8Department of Marine and Environmental Sciences, Northeastern University, Boston, MA, USA. 9South African Environmental Observation Network, Ndlovu Node, Scientific Services, Kruger National Park, Phalaborwa, South Africa. 10School of Geography, Archaeology, and Environmental Studies, University of the Witwatersrand, Johannesburg, South Africa. 11Tecnológico Nacional de México/I.T. Roque, Celaya, Mexico. 12Jornada Basin LTER Program, New Mexico State University, Las Cruces, NM, USA. 13Department of Biology, Wake Forest University, Winston-Salem, NC, USA. 14Hawassa University, School of Animal and Range Sciences, Hawassa, Ethiopia and Botswana University of Agriculture and Natural Resources, Gaborone, Botswana
. 15Centre for Ecological Sciences, Indian
Institute of Science, Bangalore, India. 16Department of Aquatic Ecology, Netherlands Institute of Ecology (NIOO-KNAW), Wageningen, The Netherlands. 17PO Box 2886, Alice Springs, Northern Territories, Australia
. 18Department of Wildland Resources and Ecology Center, Utah State University, Logan, UT,
USA. 19U.S. Geological Survey, Northern Rocky Mountain Science Center & Department of Ecology, Montana State University, Bozeman, MT, USA. 20Department of Biology, University of Central Florida, Orlando, FL, USA. 21Archbold Biological Station, MacArthur Agro-ecology Research Center, Venus, FL, USA. 22UCSB Kenneth S. Norris Rancho Marino Reserve, Cambria, CA, USA. 23INTA Cuenca del Salado, Grupo de Producción Vegetal, Rauch, Buenos Aires, Argentina. 24IFEVA-CONICET, Facultad de Agronomía, Universidad de Buenos Aires, Buenos Aires, Argentina. 25State Key Laboratory of Soil Erosion and Dryland Farming on the Loess Plateau, Northwest A&F University, Yangling, China. 26Environmental Studies, University of California, Santa Barbara, CA, USA. 27Université Grenoble Alpes, Irstea, UR LESSEM, Saint-Martin-d’Hères, France. 28Institut Polytechnique Rural/Institut de Formation et de Recherche Appliquee, Katibougou, Mali. 29Ecosystem Mangement Science, Science Division, NSW Office of Environment and Heritage, Merimbula, New South Wales, Australia. 30Centre for Ecosystem Studies, School of Biological, Earth and Environmental Sciences, University of New South Wales, Sydney, New South Wales, Australia. 31Brackenridge Field Laboratory, University of Texas, Austin, TX, USA. 32Island Ecology and Biogeography Group, Instituto Universitario de Enfermedades Tropicales y Salud Pública de Canarias, Universidad de La Laguna, La Laguna, Canary Islands, Spain. 33Department of Natural Resource Sciences, Thompson Rivers University, Kamloops, British Columbia, Canada. 34Department of Biology, Dalhousie University, Halifax, Nova Scotia, Canada. 35Department of Life Sciences, Alcalá University, Alcalá de Henares, Spain. 36Department of Zoology and Physiology, University of Wyoming, Laramie, WY, USA. 37New Zealand Forest Surveys, Napier, New Zealand. 38Université des Sciences, des Techniques et des Technologies (USTTB), Bamako, Mali. 39School of Biological Sciences, University of Nebraska, Lincoln, NE, USA. 40School of Natural Resource Management, Nelson Mandela University (, George Campus), Port Elizabeth, South Africa. 41Department of Biological and Environmental Sciences, University of Jyväskylä, Jyväskylä, Finland. 42Facultad de Agronomía, Universidad de la República, Montevideo, Uruguay. 43CERZOS-CONICET and Departamento de Biología, Bioquímica y Farmacia, UNS, Bahía Blanca
, Argentina. 44Natural Resource Ecology Laboratory, Colorado State University, Fort Collins, CO, USA.
45South African Environmental Observation Network (SAEON): Arid Lands Node, Prince Albert, South Africa. 46Department of Ecology, Environment and Evolution, La Trobe University, Bundoora, Victoria, Australia. 47Arthur Rylah Institute, Department of Environment, Land, Water and Planning, Heidelberg, Victoria, Australia. 48Department of Wildland Resources and Ecology Center, Utah State University, Logan, UT, USA. 49Groningen Institute for Evolutionary Life Sciences, University of Groningen, Groningen, The Netherlands. 50Department of Biology, University of Florida, Gainesville, FL, USA. 51Deparment of Life Sciences, University of Alcalá, Alcalá de Henares, Spain. 52The Nature Conservancy, Lander, WY, USA. 53Research Unit Community Ecology, Swiss Federal Institute for Forest, Snow and Landscape Research, Birmensdorf, Switzerland. 54Department of Conservation Biology, Estación Biológica de Doñana CSIC, Sevilla, Spain. 55School of Biology, University of Leeds, Leeds, UK. 56National Centre for Biological Sciences, Tata Institute of Fundamental Research, GKVK Campus, Bangalore, India. 57Graduate School of Environment and Information Sciences, Yokohama National University, Yokohama, Japan. 58U.S. Geological Survey, Fort Collins Science Center and Colorado State University, Fort Collins, CO, USA. 59School of Applied and Biomedical Science, Federation University, Ballarat, Victoria, Australia. 60Department of Biology, Technische Universität Darmstadt, Darmstadt, Germany. 61Unit for Environmental Sciences and Management, North-West University, Potchefstroom, South Africa. 62Groningen Institute for Evolutionary
Life Sciences,
University of Groningen, Groningen, the Netherlands. 63University of Wisconsin Green Bay, Natural and Applied Sciences, Green Bay, WI, USA. 64USDA-ARS, Fort Keogh Livstock and Range Research Laboratory, Miles City, MT, USA. 65College of Animal Science and Technology, Northwest A&F University, Yangling, China. 66Earth Research Institute, University of California, Santa Barbara, CA, USA. 67Office of Environment and Heritage, Buronga, New South Wales, Australia. 68Terrestrial Ecology Unit, Department of Biology, Ghent University, Ghent, Belgium. 69Department of Biological Sciences, Kent State University, Kent, OH, USA. 70Lhasa National Ecological Research Station, Key Laboratory of Ecosystem Network Observation and Modelling, Institute of Geographic Sciences and Natural Resources Research, Chinese Academy of Sciences, Beijing, China. 71Department of Plant Sciences, University of California, Davis, Davis, CA, USA. 72Mpala Research Centre, Nanyuki, Kenya. 73National Hulunber Grassland Ecosystem Observation and Research Station/Institute of Agricultural Resources and Regional Planning, Chinese Academy of Agricultural Sciences, Beijing, China. 74Department of Botany, University of Wyoming, Laramie, WY, USA. 75Present address: PO Box 943, LaPorte, CO, USA. 76Grazing
Exclosure working group member
*e-mail: [email protected]
Q1
Q2
Q3
Q4
Q6
NATuRE ECOLOGY & EVOLuTION | www.nature.com/natecolevol

QUERY FORM
Query No. Nature of Query
AUTHOR:
The following queries have arisen during the editing of your manuscript. Please answer by making the requisite corrections directly in the e.proofing tool rather than marking them up on the PDF. This will ensure that your corrections are incorporated accurately and that your paper is published as quickly as possible.
Springer Nature
Manuscript ID
Author
[Art. Id: 696]
Sally E. Koerner
Nature Ecology & Evolution
Q1: Should affiliation 14 in fact be two different affiliations since it spans two different institutions, in Ethiopia and Botswana, respectively??
Q2: In affiliation 17, please confirm that this was the author's address when the work for the article was done. If not, please provide the address he was at for the duration of the project. If this is a private address, please confirm that you are OK with it being made public.
Q3: Are CERZOS-CONICET and Departamento de Biología, Bioquímica y Farmacia, UNS two separate institutions or the same one?
Q4: Affiliations 49 and 62 are the same. OK to delete one and renumber the affiliations accordingly?
Q5: Your paper has been copy-edited. Please review every sentence to ensure that it conveys your intended meaning; if changes are required, please provide further clarification rather than reverting to the original text. Please note that formatting (including hyphenation and reference citations) has been made consistent with our house style.
Q6: Please provide an address to keep the notation in the authors' list; otherwise, please move the information and set of initials to the Acknowledgements.
Q7: Please check your article carefully, coordinate with any co-authors and enter all final edits clearly in the eproof, remembering to save frequently. Once corrections are submitted, we cannot routinely make further changes to the article.
Q8: Note that the eproof should be amended in only one browser window at any one time; otherwise changes will be overwritten.
Q9: Author surnames have been highlighted. Please check these carefully and adjust if the first name or surname is marked up incorrectly. Note that changes here will affect indexing of your article in public repositories such as PubMed. Also, carefully check the spelling and numbering of all author names and affiliations, and the corre-sponding email address(es).
Q10: Please note that after the paper has been formally accepted you can only provide amended Supplementary Infor-mation files for critical changes to the scientific content, not for style. You should clearly explain what changes have been made if you do resupply any such files.
Q11: In the sentence starting with 'We used two common dominance metrics ...', is Berger–Parker and Simpson’s Dominance Indexes, as edited, acceptable?
QUERY FORM
Query No. Nature of Query
AUTHOR:
The following queries have arisen during the editing of your manuscript. Please answer by making the requisite corrections directly in the e.proofing tool rather than marking them up on the PDF. This will ensure that your corrections are incorporated accurately and that your paper is published as quickly as possible.
Springer Nature
Manuscript ID
Author
[Art. Id: 696]
Sally E. Koerner
Nature Ecology & Evolution
Q12: In the sentence 'The Berger–Parker Dominance Index is a measure of the relative cover of the most abundant species agnostic of species identity', kindly clarify the meaning of agnostic in this context.
Q13: Please confirm that r2 is correct rather than R2 as elsewhere.
Q14: The statistical convention for symbols associated with P values is *P ≤ 0.05, **P ≤ 0.01, ***P ≤ 0.001 and ****P ≤ 0.0001, so should **P < 0.001 be ***P ≤ 0.001 in Figure 3?
Q15: In the sentence starting with 'Because productivity is strongly correlated with MAP in our data set ...', please confirm that (Fig. 3a,b, Models 1 and 2a), as edited, is correct.
Q16: In the sentence 'For example, grazers alone had a stronger impact on changes in species richness than when graz-ers and browsers were both present (standardized partial effect size for herbivore guild of − 0.26 and − 0.023)', is − 0.023 correct?
Q17: Please check that all funders have been appropriately acknowledged and that all grant numbers are correct.
Q18: Please check that the Competing interests declaration is correct as stated. If you declare competing interests, please check the full text of the declaration for accuracy and completeness.
Q19: The Oikos journal details you provided retrieved an article by Eby et al. with a different title from the one you provided. I have changed the title accordingly, but kindly confirm that all the details are correct now.

1
nature research | reporting summ
aryApril 2018
Corresponding author(s): Sally Koerner
Reporting SummaryNature Research wishes to improve the reproducibility of the work that we publish. This form provides structure for consistency and transparency in reporting. For further information on Nature Research policies, see Authors & Referees and the Editorial Policy Checklist.
Statistical parametersWhen statistical analyses are reported, confirm that the following items are present in the relevant location (e.g. figure legend, table legend, main text, or Methods section).
n/a Confirmed
The exact sample size (n) for each experimental group/condition, given as a discrete number and unit of measurement
An indication of whether measurements were taken from distinct samples or whether the same sample was measured repeatedly
The statistical test(s) used AND whether they are one- or two-sided Only common tests should be described solely by name; describe more complex techniques in the Methods section.
A description of all covariates tested
A description of any assumptions or corrections, such as tests of normality and adjustment for multiple comparisons
A full description of the statistics including central tendency (e.g. means) or other basic estimates (e.g. regression coefficient) AND variation (e.g. standard deviation) or associated estimates of uncertainty (e.g. confidence intervals)
For null hypothesis testing, the test statistic (e.g. F, t, r) with confidence intervals, effect sizes, degrees of freedom and P value noted Give P values as exact values whenever suitable.
For Bayesian analysis, information on the choice of priors and Markov chain Monte Carlo settings
For hierarchical and complex designs, identification of the appropriate level for tests and full reporting of outcomes
Estimates of effect sizes (e.g. Cohen's d, Pearson's r), indicating how they were calculated
Clearly defined error bars State explicitly what error bars represent (e.g. SD, SE, CI)
Our web collection on statistics for biologists may be useful.
Software and codePolicy information about availability of computer code
Data collection No software was used
Data analysis R
For manuscripts utilizing custom algorithms or software that are central to the research but not yet described in published literature, software must be made available to editors/reviewers upon request. We strongly encourage code deposition in a community repository (e.g. GitHub). See the Nature Research guidelines for submitting code & software for further information.
DataPolicy information about availability of data
All manuscripts must include a data availability statement. This statement should provide the following information, where applicable: - Accession codes, unique identifiers, or web links for publicly available datasets - A list of figures that have associated raw data - A description of any restrictions on data availability
Online Content Additional Methods, Extended Data display items and Source Data are available in the online version of the paper
2
nature research | reporting summ
aryApril 2018
Field-specific reportingPlease select the best fit for your research. If you are not sure, read the appropriate sections before making your selection.
Life sciences Behavioural & social sciences Ecological, evolutionary & environmental sciences
For a reference copy of the document with all sections, see nature.com/authors/policies/ReportingSummary-flat.pdf
Ecological, evolutionary & environmental sciences study designAll studies must disclose on these points even when the disclosure is negative.
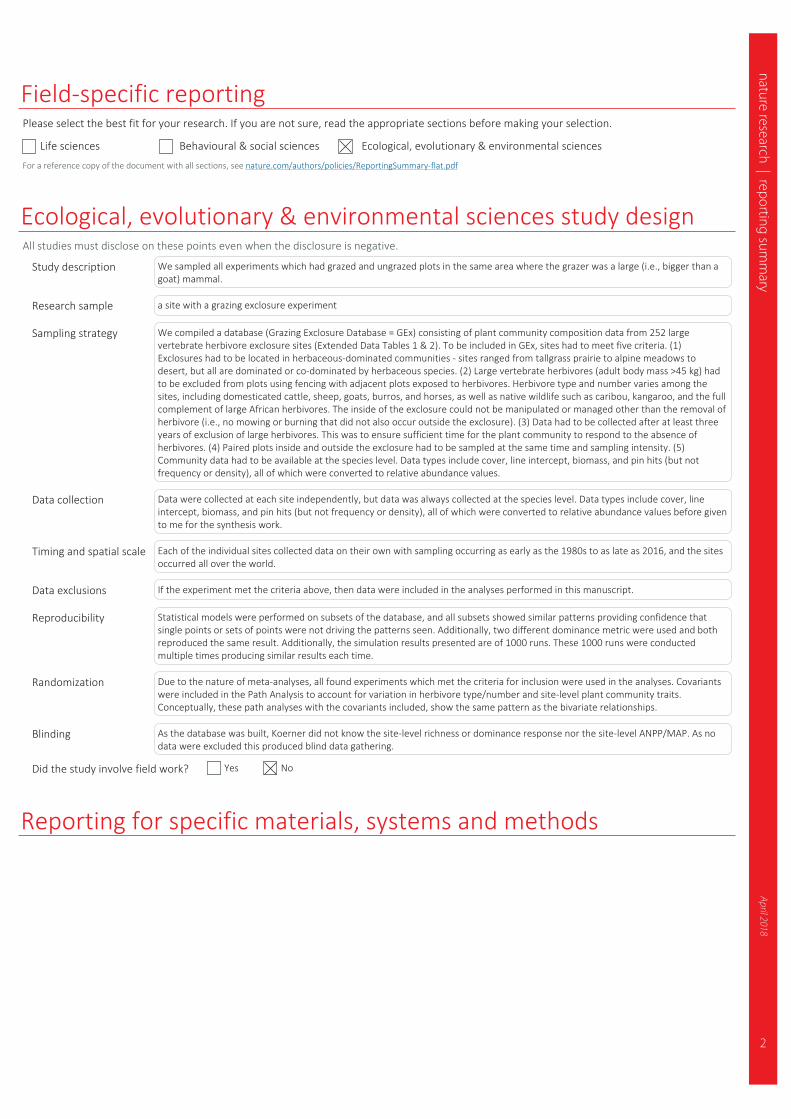
Study description We sampled all experiments which had grazed and ungrazed plots in the same area where the grazer was a large (i.e., bigger than a goat) mammal.
Research sample a site with a grazing exclosure experiment
Sampling strategy We compiled a database (Grazing Exclosure Database = GEx) consisting of plant community composition data from 252 large vertebrate herbivore exclosure sites (Extended Data Tables 1 & 2). To be included in GEx, sites had to meet five criteria. (1) Exclosures had to be located in herbaceous-dominated communities - sites ranged from tallgrass prairie to alpine meadows to desert, but all are dominated or co-dominated by herbaceous species. (2) Large vertebrate herbivores (adult body mass >45 kg) had to be excluded from plots using fencing with adjacent plots exposed to herbivores. Herbivore type and number varies among the sites, including domesticated cattle, sheep, goats, burros, and horses, as well as native wildlife such as caribou, kangaroo, and the full complement of large African herbivores. The inside of the exclosure could not be manipulated or managed other than the removal of herbivore (i.e., no mowing or burning that did not also occur outside the exclosure). (3) Data had to be collected after at least three years of exclusion of large herbivores. This was to ensure sufficient time for the plant community to respond to the absence of herbivores. (4) Paired plots inside and outside the exclosure had to be sampled at the same time and sampling intensity. (5) Community data had to be available at the species level. Data types include cover, line intercept, biomass, and pin hits (but not frequency or density), all of which were converted to relative abundance values.
Data collection Data were collected at each site independently, but data was always collected at the species level. Data types include cover, line intercept, biomass, and pin hits (but not frequency or density), all of which were converted to relative abundance values before given to me for the synthesis work.
Timing and spatial scale Each of the individual sites collected data on their own with sampling occurring as early as the 1980s to as late as 2016, and the sites occurred all over the world.
Data exclusions If the experiment met the criteria above, then data were included in the analyses performed in this manuscript.
Reproducibility Statistical models were performed on subsets of the database, and all subsets showed similar patterns providing confidence that single points or sets of points were not driving the patterns seen. Additionally, two different dominance metric were used and both reproduced the same result. Additionally, the simulation results presented are of 1000 runs. These 1000 runs were conducted multiple times producing similar results each time.
Randomization Due to the nature of meta-analyses, all found experiments which met the criteria for inclusion were used in the analyses. Covariants were included in the Path Analysis to account for variation in herbivore type/number and site-level plant community traits. Conceptually, these path analyses with the covariants included, show the same pattern as the bivariate relationships.
Blinding As the database was built, Koerner did not know the site-level richness or dominance response nor the site-level ANPP/MAP. As no data were excluded this produced blind data gathering.
Did the study involve field work? Yes No
Reporting for specific materials, systems and methods

3
nature research | reporting summ
aryApril 2018
Materials & experimental systemsn/a Involved in the study
Unique biological materials
Antibodies
Eukaryotic cell lines
Palaeontology
Animals and other organisms
Human research participants
Methodsn/a Involved in the study
ChIP-seq
Flow cytometry
MRI-based neuroimaging