champlain lhin 2016/2017 qip snapshot report - … · health quality ontario the provincial advisor...
TRANSCRIPT
Health Quality OntarioThe provincial advisor on the quality of health care in Ontario
Champlain LHIN 2016/2017 QIP Snapshot
Report

INTRODUCTION
2
Purpose
• To give each Local Health Integration Network (LHIN)
a snapshot of its quality improvement efforts as
reflected in the 2016/17 Quality Improvement Plans
(QIPs) submitted to Health Quality Ontario by
hospitals, interdisciplinary primary care organizations,
community care access centres and long-term care
homes
• To identify general observations, highlight areas that
have shown improvement, and identify potential areas
for improvement (focusing on a few indicators)

3
How This Report Should Be Used
• We intend for this report to:
– Be used for discussion between the LHIN and its health
service providers on successes and areas for improvement as
reflected in the QIPs
– Stimulate collaboration within and among organizations across
the LHIN who may be working on similar change ideas or
areas for improvement
– Be used as a discussion point with the Regional Quality
Tables
– Be shared with the LHIN board and/or health service provider
boards in the LHIN
• This report has been produced in an editable
PowerPoint format to support the above uses

4
Report Structure
For a select number of 2016/17 QIP indicators, this report will
summarize:
1. Quantitative data, including:
• Current performance and indicator selection
• Progress made on 2015/16 QIPs
2. Qualitative data, including:
• Change ideas and partnerships
• Barriers and challenges
• Success stories
For more information about these and other indicators, please visit
the Health Quality Ontario website to access the publicly posted
QIPs (Sector QIP) or search the QIP database (QIP Query)
5
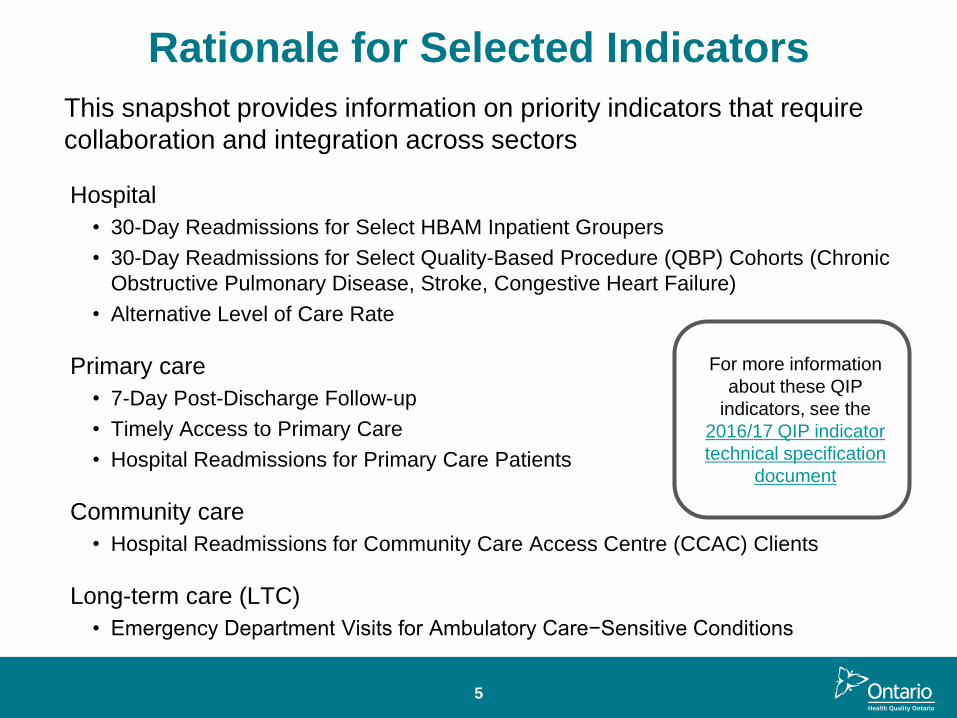
Rationale for Selected Indicators
This snapshot provides information on priority indicators that require
collaboration and integration across sectors
Hospital
• 30-Day Readmissions for Select HBAM Inpatient Groupers
• 30-Day Readmissions for Select Quality-Based Procedure (QBP) Cohorts (Chronic
Obstructive Pulmonary Disease, Stroke, Congestive Heart Failure)
• Alternative Level of Care Rate
Primary care
• 7-Day Post-Discharge Follow-up
• Timely Access to Primary Care
• Hospital Readmissions for Primary Care Patients
Community care
• Hospital Readmissions for Community Care Access Centre (CCAC) Clients
Long-term care (LTC)
• Emergency Department Visits for Ambulatory Care−Sensitive Conditions
For more information
about these QIP
indicators, see the
2016/17 QIP indicator
technical specification
document
6
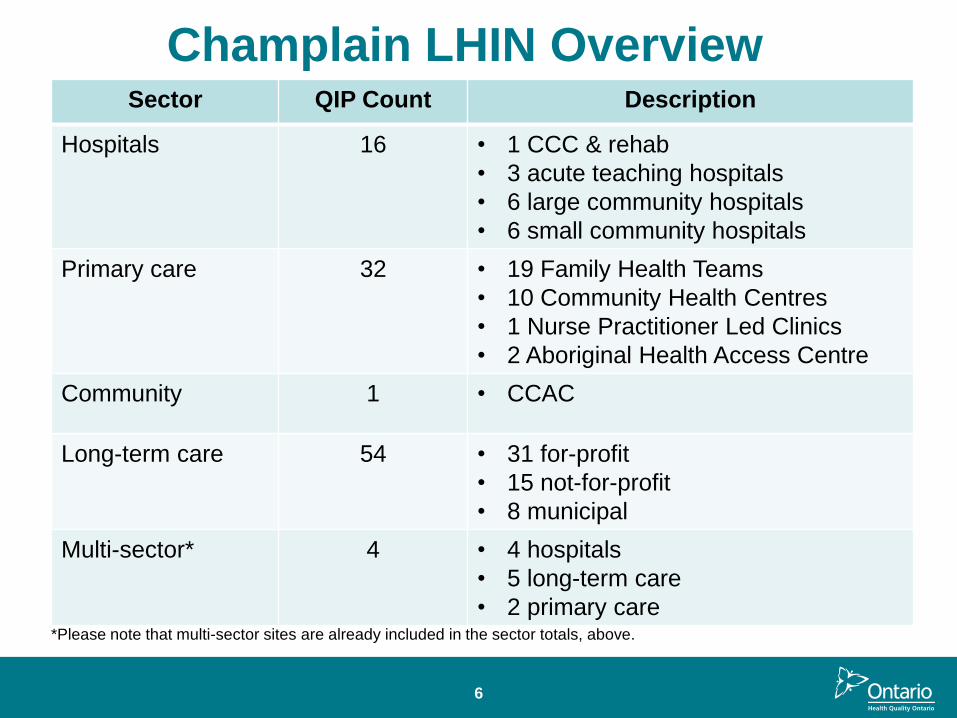
Sector QIP Count Description
Hospitals 16 • 1 CCC & rehab
• 3 acute teaching hospitals
• 6 large community hospitals
• 6 small community hospitals
Primary care 32 • 19 Family Health Teams
• 10 Community Health Centres
• 1 Nurse Practitioner Led Clinics
• 2 Aboriginal Health Access Centre
Community 1 • CCAC
Long-term care 54 • 31 for-profit
• 15 not-for-profit
• 8 municipal
Multi-sector* 4 • 4 hospitals
• 5 long-term care
• 2 primary care
Champlain LHIN Overview
*Please note that multi-sector sites are already included in the sector totals, above.
7
Key Observations – Overarching• Reflecting back on their 2015/16 QIPs, more than 85% of
organizations reported progress on at least one priority or
additional indicator, and more than half reported progress on
three or more.
• There was a high uptake of priority issues in the 2016/17 QIPs,
particularly patient experience and integration.
– More than three-quarters (78%) of organizations described working
on at least one of the indicators related to integration.
– More than 80% of organizations described working on at least one of
the indicators related to patient experience.
• Most organizations set targets to improve, but many of these
targets are modest – typically within 1–5% of their current
performance.
– While this may be appropriate for some indicators, organizations are
encouraged to reflect on their current performance and consider
whether a stretch target might be appropriate.
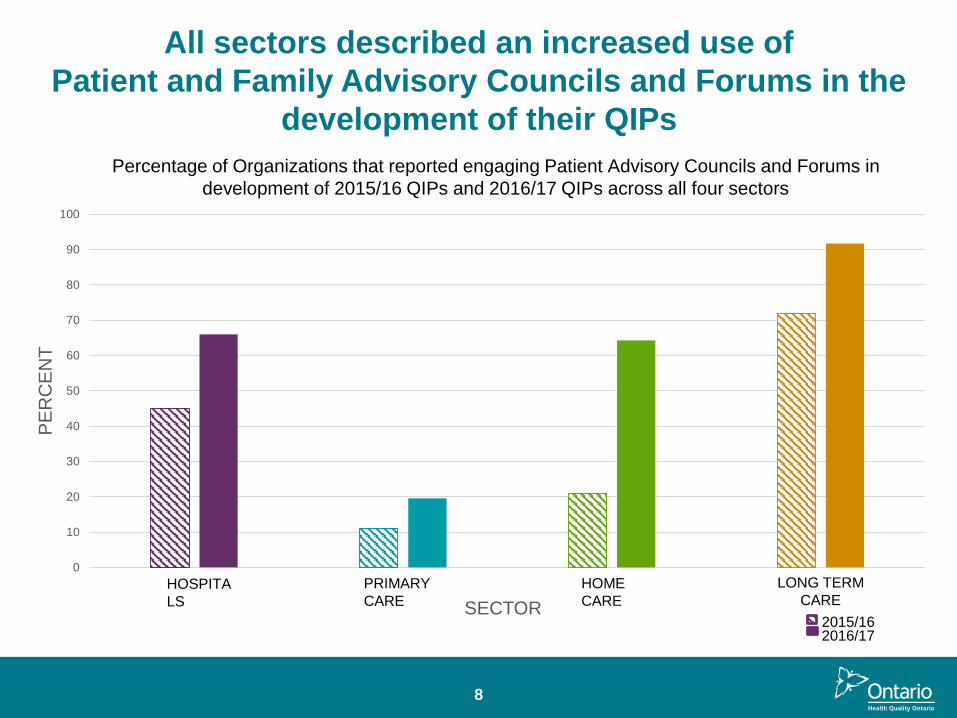
All sectors described an increased use of
Patient and Family Advisory Councils and Forums in the
development of their QIPs
0
10
20
30
40
50
60
70
80
90
100
PE
RC
EN
T
SECTOR
Percentage of Organizations that reported engaging Patient Advisory Councils and Forums in
development of 2015/16 QIPs and 2016/17 QIPs across all four sectors
HOSPITA
LS
HOME
CARE
PRIMARY
CARE
LONG TERM
CARE
2015/162016/17
8
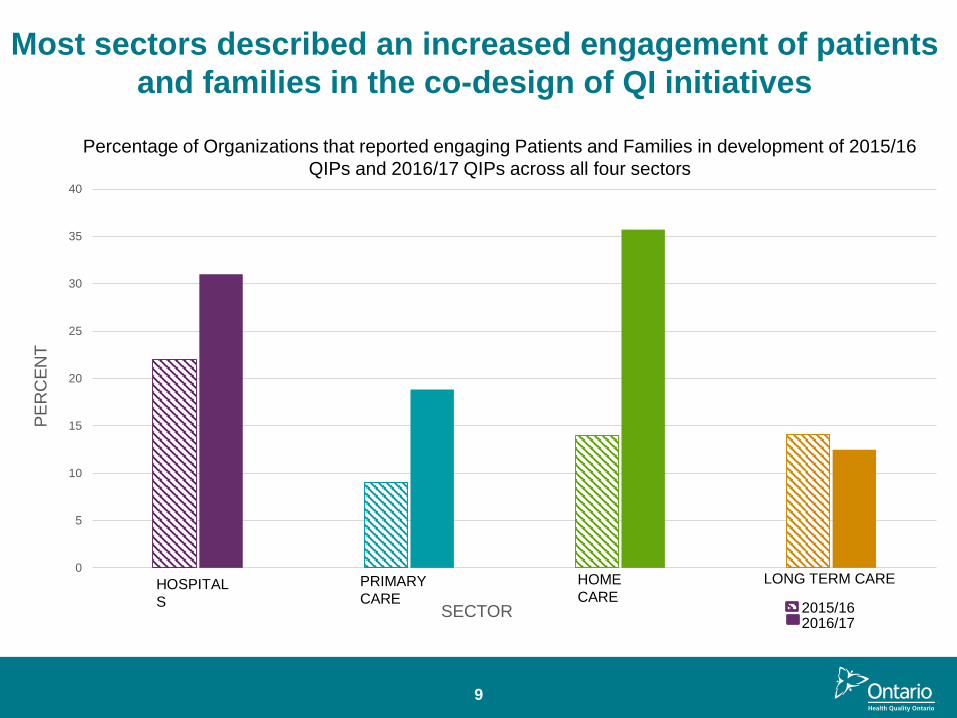
Most sectors described an increased engagement of patients
and families in the co-design of QI initiatives
0
5
10
15
20
25
30
35
40
PE
RC
EN
T
SECTOR
HOSPITAL
S
HOME
CAREPRIMARY
CARE
LONG TERM CARE
Percentage of Organizations that reported engaging Patients and Families in development of 2015/16
QIPs and 2016/17 QIPs across all four sectors
2015/162016/17
9

Key Observations – Per Sector• Hospitals: The area where the most hospitals reported progress was
emergency department length of stay (61% of hospitals reporting progress),
followed by positive patient experience (recommend hospital; 60% of
hospitals reporting progress).
• Primary care: The area where the most primary care organizations
reported progress was cancer screening (65% reporting progress in
colorectal cancer screening and 55% reporting progress in cervical cancer
screening).
• Home care: The area where the most CCACs saw progress was related to
integration issues (77% of CCACs reported progress on unplanned
emergency visits and 75% of CCACs reported progress on hospital
readmissions).
• Long-term care: The area where the most homes reported progress was
appropriate prescribing of antipsychotics (78% of homes reporting
progress).
10

QUALITY IMPROVEMENT
PLAN DATA

12
Provincial Averages
23.824.6
22.0
19.618.2
17.2
14.3
16.816.2
13.8
8.7
5.0
10.0
15.0
20.0
25.0
30.0
2014/15 2015/16 2016/17
Per
cen
t/ R
ate
per
10
0
Fiscal Year
Ontario provincial averages (%) for selected integration indicators across sectors*, QIP 2014/15−QIP 2016/17
Potentially Avoidable EmergencyDepartment Visits for Long-TermCare Residents
Risk-Adjusted 30-Day All-CauseReadmission Rate for Patients withCongestive Heart Failure
Risk-Adjusted 30-Day All-CauseReadmission Rate for Patients withChronic Obstructive PulmonaryDiseaseHospital Readmissions for CCACs
Readmission Within 30 Days forSelected HBAM Inpatient Grouper
Alternative Level of Care Rate—Acute
Risk-Adjusted 30-Day All-CauseReadmission Rate for Patients withStroke
Better performance
*Data were obtained from external sources, and indicators presented in the graph are risk-unadjusted unless specified otherwise. Potentially avoidable ED visits for long-term care residents has a unit of rate per 100 long-term care residents; all other indicators have a unit of percent. Provincial average data were not available for primary care organization indicators from external data sources and are not presented in this graph.Data sourcesPotentially Avoidable Emergency Department Visits for Long-term Care Residents: Canadian Institute for Health Information. Risk-Adjusted 30-Day All-Cause Readmission Rate for Patients with Congestive Heart Failure; Risk-Adjusted 30-Day All-Cause Readmission Rate for Patients with Chronic Obstructive Pulmonary Disease, Readmission Within 30 Days for Selected HBAM Inpatient Groupers, Risk-Adjusted 30-Day All-Cause Readmission Rate for Patients with Stroke: Canadian Institute for Health Information, Discharge Abstract Database.Hospital Readmissions for CCAC: Home Care Database, Canadian Institute for Health Information, Discharge Abstract Database, National Ambulatory Care Reporting System.Alternative Level of Care Rate−Acute: Cancer Care Ontario, Wait Time Information System.
13
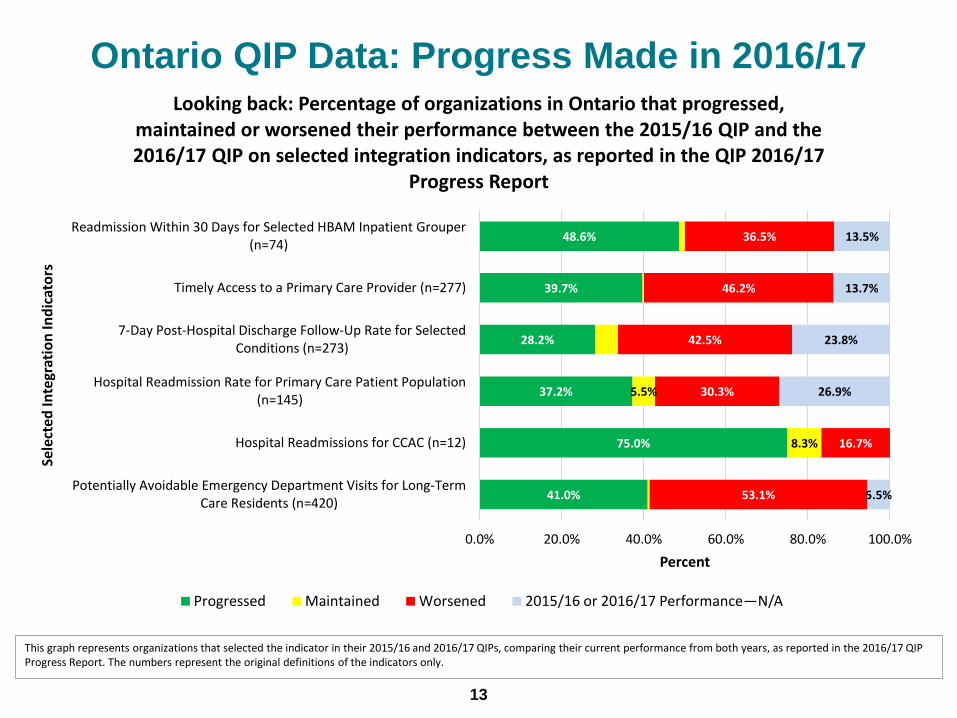
Ontario QIP Data: Progress Made in 2016/17
This graph represents organizations that selected the indicator in their 2015/16 and 2016/17 QIPs, comparing their current performance from both years, as reported in the 2016/17 QIP Progress Report. The numbers represent the original definitions of the indicators only.
41.0%
75.0%
37.2%
28.2%
39.7%
48.6%
8.3%
5.5%
53.1%
16.7%
30.3%
42.5%
46.2%
36.5%
5.5%
26.9%
23.8%
13.7%
13.5%
0.0% 20.0% 40.0% 60.0% 80.0% 100.0%
Potentially Avoidable Emergency Department Visits for Long-TermCare Residents (n=420)
Hospital Readmissions for CCAC (n=12)
Hospital Readmission Rate for Primary Care Patient Population(n=145)
7-Day Post-Hospital Discharge Follow-Up Rate for SelectedConditions (n=273)
Timely Access to a Primary Care Provider (n=277)
Readmission Within 30 Days for Selected HBAM Inpatient Grouper(n=74)
Percent
Sele
cted
Inte
grat
ion
Ind
icat
ors
Looking back: Percentage of organizations in Ontario that progressed, maintained or worsened their performance between the 2015/16 QIP and the 2016/17 QIP on selected integration indicators, as reported in the QIP 2016/17
Progress Report
Progressed Maintained Worsened 2015/16 or 2016/17 Performance—N/A
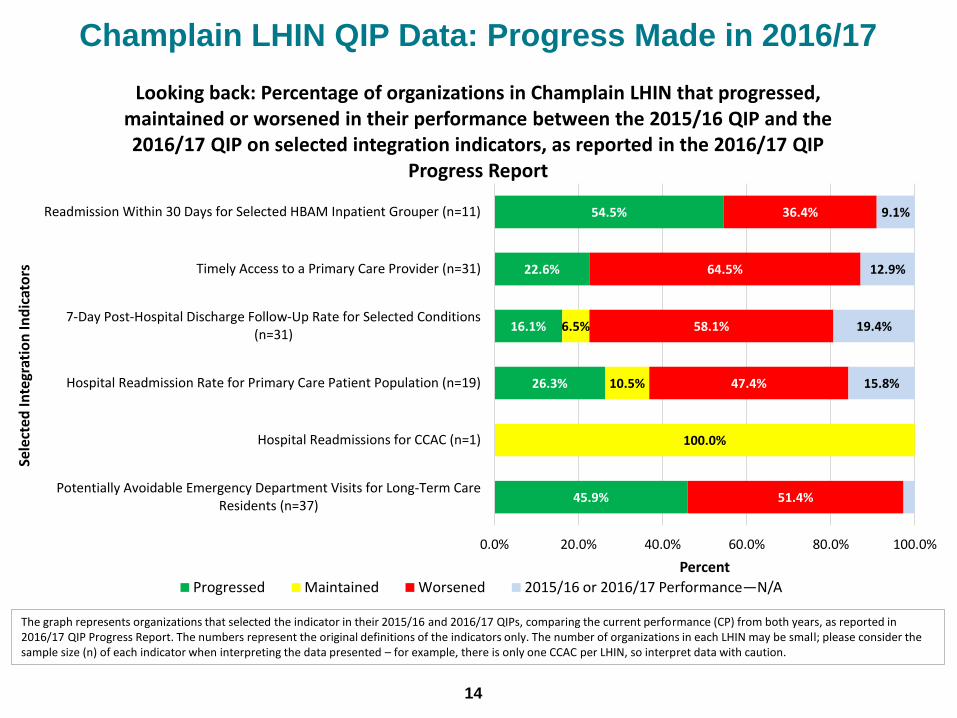
Champlain LHIN QIP Data: Progress Made in 2016/17
The graph represents organizations that selected the indicator in their 2015/16 and 2016/17 QIPs, comparing the current performance (CP) from both years, as reported in 2016/17 QIP Progress Report. The numbers represent the original definitions of the indicators only. The number of organizations in each LHIN may be small; please consider the sample size (n) of each indicator when interpreting the data presented – for example, there is only one CCAC per LHIN, so interpret data with caution.
14
45.9%
26.3%
16.1%
22.6%
54.5%
100.0%
10.5%
6.5%
51.4%
47.4%
58.1%
64.5%
36.4%
15.8%
19.4%
12.9%
9.1%
0.0% 20.0% 40.0% 60.0% 80.0% 100.0%
Potentially Avoidable Emergency Department Visits for Long-Term CareResidents (n=37)
Hospital Readmissions for CCAC (n=1)
Hospital Readmission Rate for Primary Care Patient Population (n=19)
7-Day Post-Hospital Discharge Follow-Up Rate for Selected Conditions(n=31)
Timely Access to a Primary Care Provider (n=31)
Readmission Within 30 Days for Selected HBAM Inpatient Grouper (n=11)
Percent
Sele
cted
Inte
grat
ion
Ind
icat
ors
Looking back: Percentage of organizations in Champlain LHIN that progressed, maintained or worsened in their performance between the 2015/16 QIP and the 2016/17 QIP on selected integration indicators, as reported in the 2016/17 QIP
Progress Report
Progressed Maintained Worsened 2015/16 or 2016/17 Performance—N/A

Champlain LHIN QIP Data: Target Setting in 2016/17
15
The graph represents organizations that selected the indicator in their 2016/17 QIPs, comparing the Current Performance (CP) from 2016/17 to Target Performance (TP) in 2016/17, as reported in 2016/17 QIP Workplan. The numbers represent the original definitions of the indicators only. The number of organizations in each LHIN may be small; please consider the sample size (n) of each indicator when interpreting the data presented – for example, there is only one CCAC per LHIN, so interpret data with caution.
90.9%
100.0%
82.4%
88.5%
93.1%
100.0%
100.0%
62.5%
100.0%
55.6%
6.8%
11.8%
11.5%
6.9%
25.0%
11.1%
5.9%
22.2%
12.5%
11.1%
0.0% 20.0% 40.0% 60.0% 80.0% 100.0%
Potentially Avoidable ED Visits for Long-Term Care Residents (n=44)
Hospital Readmissions for CCAC (n=1)
Hospital Readmission Rate for Primary Care Patient Population (n=17)
7-Day Post-Hospital Discharge Follow-Up Rate for Selected Conditions…
Timely Access to a Primary Care Provider (n=29)
30-Day All-Cause Readmission Rate for Patients with CHF (n=5)
30-Day All-Cause Readmission Rate for Patients with COPD (n=3)
Readmission Within 30 Days for Selected HBAM Inpatient Grouper (n=8)
30-Day All-Cause Readmission Rate for Patients with Stroke (n=1)
Alternative Level of Care Rate—Acute (n=9)
Percent
Sele
cted
Inte
grat
ion
Ind
icat
ors
Looking forward: Percentage of organizations in Champlain LHIN that set a target to improve, maintain or worsen performance in the 2016/17 QIP on selected
integration indicators, as reported in the 2016/17 QIP Workplan
Improvement Maintainance Retrograde Target 2016/17 Target— N/A
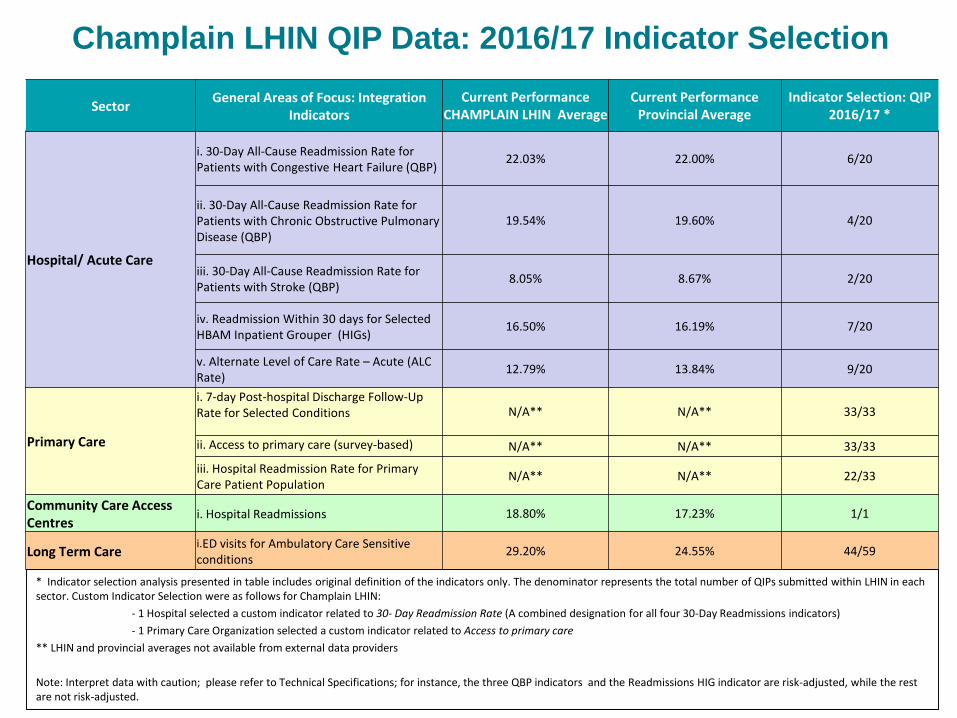
Champlain LHIN QIP Data: 2016/17 Indicator Selection
SectorGeneral Areas of Focus: Integration
IndicatorsCurrent Performance
CHAMPLAIN LHIN AverageCurrent Performance
Provincial AverageIndicator Selection: QIP
2016/17 *
Hospital/ Acute Care
i. 30-Day All-Cause Readmission Rate for Patients with Congestive Heart Failure (QBP)
22.03% 22.00% 6/20
ii. 30-Day All-Cause Readmission Rate for Patients with Chronic Obstructive Pulmonary Disease (QBP)
19.54% 19.60% 4/20
iii. 30-Day All-Cause Readmission Rate for Patients with Stroke (QBP)
8.05% 8.67% 2/20
iv. Readmission Within 30 days for Selected HBAM Inpatient Grouper (HIGs)
16.50% 16.19% 7/20
v. Alternate Level of Care Rate – Acute (ALC Rate)
12.79% 13.84% 9/20
Primary Care
i. 7-day Post-hospital Discharge Follow-Up Rate for Selected Conditions N/A** N/A** 33/33
ii. Access to primary care (survey-based) N/A** N/A** 33/33
iii. Hospital Readmission Rate for Primary Care Patient Population
N/A** N/A** 22/33
Community Care Access Centres
i. Hospital Readmissions 18.80% 17.23% 1/1
Long Term Carei.ED visits for Ambulatory Care Sensitive conditions
29.20% 24.55% 44/59
* Indicator selection analysis presented in table includes original definition of the indicators only. The denominator represents the total number of QIPs submitted within LHIN in each sector. Custom Indicator Selection were as follows for Champlain LHIN:
- 1 Hospital selected a custom indicator related to 30- Day Readmission Rate (A combined designation for all four 30-Day Readmissions indicators)
- 1 Primary Care Organization selected a custom indicator related to Access to primary care
** LHIN and provincial averages not available from external data providers
Note: Interpret data with caution; please refer to Technical Specifications; for instance, the three QBP indicators and the Readmissions HIG indicator are risk-adjusted, while the rest are not risk-adjusted.

MOST COMMON CHANGE IDEAS
FROM 2015/16 AND 2016/17
18
Common Change Ideas
• The following slides show common change ideas at the
provincial level; ideas have been categorized by theme
• Graphs display change ideas by indicator and show:
– The most common change ideas included in the 2016/17 QIPs
(Progress Report), and a look back at progress made in implementing
change ideas
– The extent to which these change ideas were also included in QIP
Workplans
– LHIN-specific notes to capture regional change ideas or unique ideas
in Workplans

19
* The information presented combines data submitted by organizations on the following four 30-day readmission indicators: 30-Day All-Cause Readmission Rate for Patients with Congestive Heart Failure, 30-Day All-Cause Readmission Rate for Patients with Chronic Obstructive Pulmonary Disease, 30-Day All-Cause Readmission Rate for Patients with Stroke and Readmission Within 30 Days for Selected HBAM Inpatient Groupers.
12
14
15
24
29
1
3
1
4
21
29
33
34
36
0 10 20 30 40
Primary Care follow up within 7 days of discharge
Patient education
Audit and feedback
Individualized coordinated care and discharge planning
Create partnerships with other sectors to follow complexpatients
Patient education
Primary Care follow-up within 7 days of discharge
Readmission risk assessment linked to post-dischargefollow-up
Individualized coordinated care and discharge planning
Create partnerships with other sectors to follow complexpatients
Number of Hospitals
Ch
ange
Idea
sMost common change ideas in Ontario from 2015/16 and 2016/17 hospital QIPs for
30-Day Readmission Rate,* as reported in the 2016/17 QIPs
QIP 2016/17 Progress Report — Implemented Ideas QIP 2016/17 Progress Report — Unimplemented Ideas
QIP 2016/17 Workplan — Proposed Ideas
In Champlain LHINorganizations are working on change ideas such as audit and feedback,patient education, individualized coordinated care and discharge planning, and createpartnerships to follow complex patients (based on QIP 2016/17 Workplans).
Additionally organizations proposed change ideas relating to post-dischargesupport including team huddles and patient education programs.

20
* The information presented combines data submitted by organizations on the following Alternative Level of Care indicators: Alternative Level of Care Rate— Acute, and Percent Alternative Level of Care Days.
18
24
31
31
32
1
1
1
17
18
18
29
32
0 5 10 15 20 25 30 35
Health Links, or partnerships with primary care
Bed utilization management to reduce length of stay andimprove capacity
Audit and feedback
CCAC "Home First" philosophy and programs
Optimal discharge—use of predictive models
Staff education
"Assess and restore" philosophy and function
CCAC "Home First" philosophy and programs
Bed utilization management to reduce length of stay andimprove capacity
Optimal discharge—use of predictive models
Number of Hospitals
Ch
ange
Idea
sMost common change ideas in Ontario from 2015/16 and 2016/17 hospital QIPs
for Alternative Level of Care,* as reported in the 2016/17 QIPs
QIP 2016/17 Progress Report — Implemented Ideas QIP 2016/17 Progress Report — Unimplemented Ideas
QIP 2016/17 Workplan — Proposed Ideas
In Champlain LHIN, organizations are working on change ideas such as Health Links or partnerships with primary care, CCAC "Home First" philosophy and programs, and optimaldischarge- use of predictive models (based on QIP 2016/17 Workplans).
Additionally organizations proposed change ideas relating to “assess and restore" philosophy and function, senior-friendlyhospital principles and staffeducation.
21
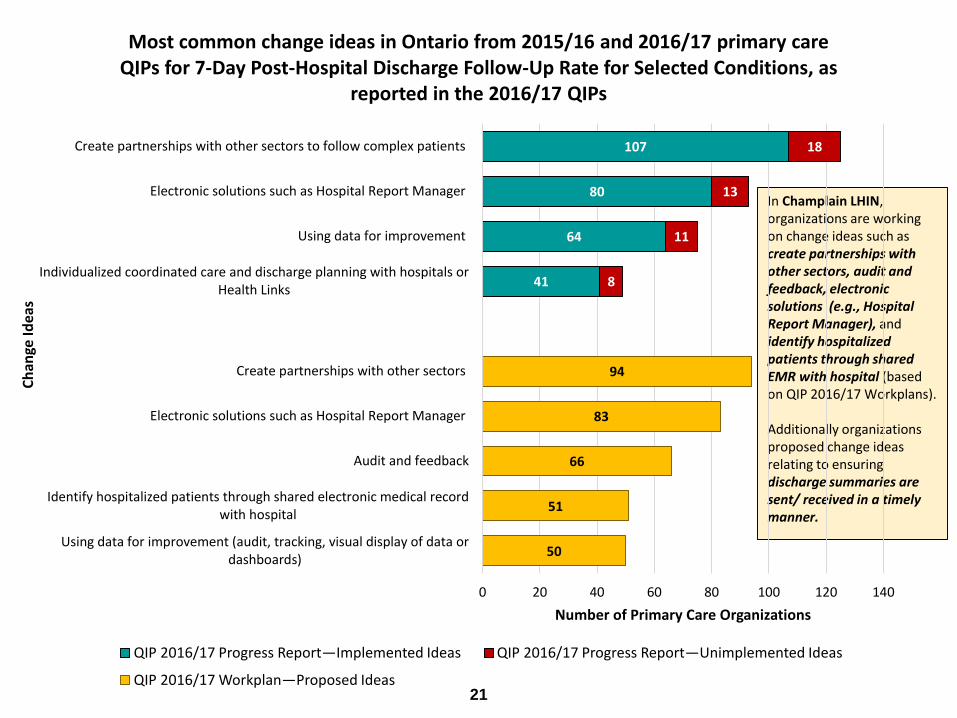
In Champlain LHIN, organizations are working on change ideas such as create partnerships with other sectors, audit and feedback, electronic solutions (e.g., Hospital Report Manager), and identify hospitalized patients through shared EMR with hospital (based on QIP 2016/17 Workplans).
Additionally organizations proposed change ideas relating to ensuringdischarge summaries are sent/ received in a timely manner.
41
64
80
107
8
11
13
18
50
51
66
83
94
0 20 40 60 80 100 120 140
Using data for improvement (audit, tracking, visual display of data ordashboards)
Identify hospitalized patients through shared electronic medical recordwith hospital
Audit and feedback
Electronic solutions such as Hospital Report Manager
Create partnerships with other sectors
Individualized coordinated care and discharge planning with hospitals orHealth Links
Using data for improvement
Electronic solutions such as Hospital Report Manager
Create partnerships with other sectors to follow complex patients
Number of Primary Care Organizations
Ch
ange
Idea
s Most common change ideas in Ontario from 2015/16 and 2016/17 primary care
QIPs for 7-Day Post-Hospital Discharge Follow-Up Rate for Selected Conditions, as reported in the 2016/17 QIPs
QIP 2016/17 Progress Report—Implemented Ideas QIP 2016/17 Progress Report—Unimplemented Ideas
QIP 2016/17 Workplan—Proposed Ideas

22
55
72
104
105
3
8
8
74
83
90
94
0 20 40 60 80 100 120
Increase supply of visits
Understand supply and demand
Survey sample and/or methodology
Audit and feedback
Survey methodology
Audit and feedback
Understand supply and demand
Increase supply of visits
Number of Primary Care Organizations
Ch
ange
Idea
s Most common change ideas in Ontario from 2015/16 and 2016/17 primary care
QIPs for Timely Access to a Primary Care Provider, as reported in the 2016/17 QIPs
QIP 2016/17 Progress Report—Implemented Ideas QIP 2016/17 Progress Report—Unimplemented Ideas
QIP 2016/17 Workplan—Proposed Ideas
23
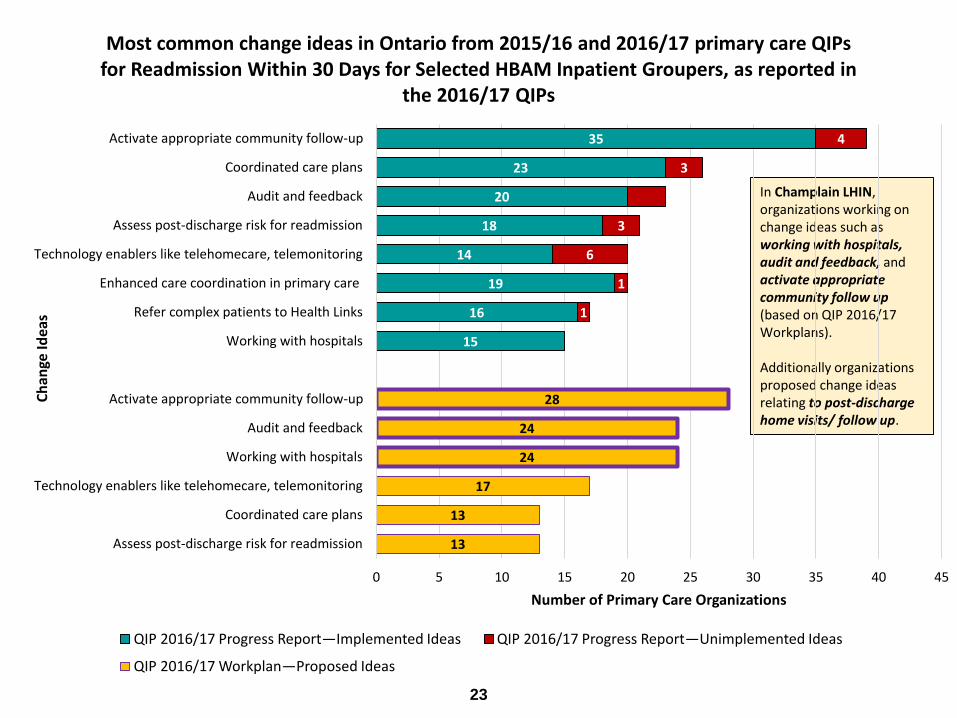
In Champlain LHIN, organizations working on change ideas such as working with hospitals, audit and feedback, andactivate appropriate community follow up (based on QIP 2016/17 Workplans).
Additionally organizations proposed change ideas relating to post-discharge home visits/ follow up.
15
16
19
14
18
20
23
35
1
1
6
3
3
4
13
13
17
24
24
28
0 5 10 15 20 25 30 35 40 45
Assess post-discharge risk for readmission
Coordinated care plans
Technology enablers like telehomecare, telemonitoring
Working with hospitals
Audit and feedback
Activate appropriate community follow-up
Working with hospitals
Refer complex patients to Health Links
Enhanced care coordination in primary care
Technology enablers like telehomecare, telemonitoring
Assess post-discharge risk for readmission
Audit and feedback
Coordinated care plans
Activate appropriate community follow-up
Number of Primary Care Organizations
Ch
ange
Idea
s Most common change ideas in Ontario from 2015/16 and 2016/17 primary care QIPs
for Readmission Within 30 Days for Selected HBAM Inpatient Groupers, as reported in the 2016/17 QIPs
QIP 2016/17 Progress Report—Implemented Ideas QIP 2016/17 Progress Report—Unimplemented Ideas
QIP 2016/17 Workplan—Proposed Ideas
24
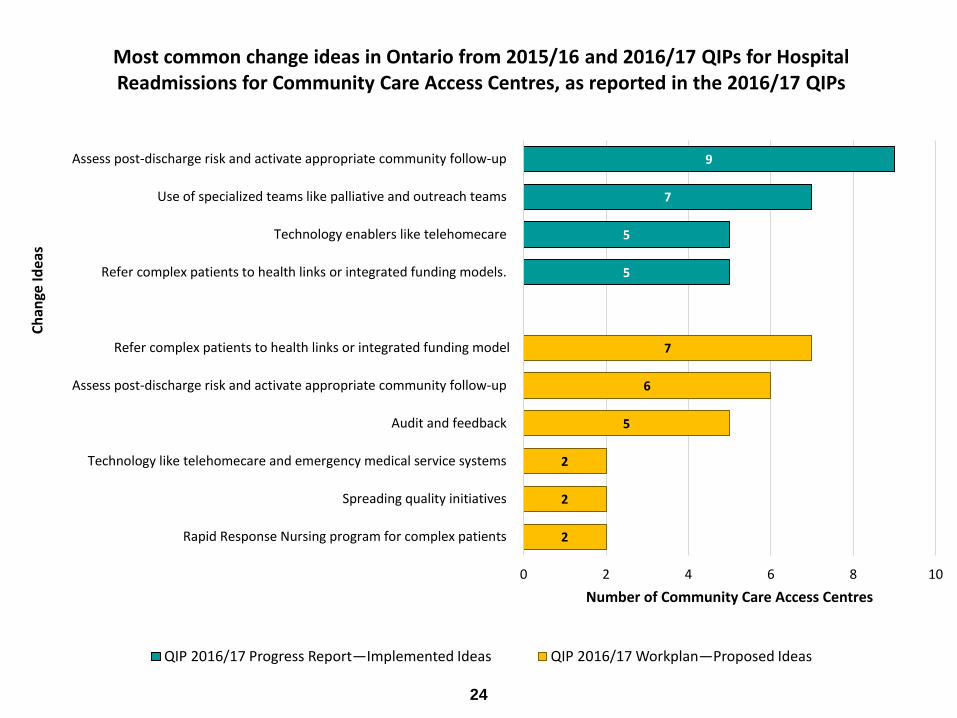
5
5
7
9
2
2
2
5
6
7
0 2 4 6 8 10
Rapid Response Nursing program for complex patients
Spreading quality initiatives
Technology like telehomecare and emergency medical service systems
Audit and feedback
Assess post-discharge risk and activate appropriate community follow-up
Refer complex patients to health links or integrated funding model
Refer complex patients to health links or integrated funding models.
Technology enablers like telehomecare
Use of specialized teams like palliative and outreach teams
Assess post-discharge risk and activate appropriate community follow-up
Number of Community Care Access Centres
Ch
ange
Idea
s
Most common change ideas in Ontario from 2015/16 and 2016/17 QIPs for Hospital Readmissions for Community Care Access Centres, as reported in the 2016/17 QIPs
QIP 2016/17 Progress Report—Implemented Ideas QIP 2016/17 Workplan—Proposed Ideas

25
66
73
95
127
142
4
7
9
13
17
65
109
111
208
221
0 50 100 150 200 250
Protocol for clinical feedback
Early recognition of “at-risk” residents
Resident/patient education
Audit and feedback
Staff education
Early treatment for common conditions
Resident/patient education
Early recognition of “at-risk” residents
Audit and feedback
Staff education
Number of Long-Term Care Homes
Ch
ange
Idea
s Most Common Change Ideas in Ontario from 2015/16 and 2016/17 Long-Term Care QIP for Potentially Avoidable Emergency Department Visits for Long-Term
Care Residents, as reported in 2016/17 QIP
QIP 2016/17 Progress Report—Implemented Ideas QIP 2016/17 Progress Report—Unimplemented Ideas
QIP 2016/17 Workplan—Proposed Ideas
In Champlain LHIN, organizations are working on change ideas such as audit and feedback, staff education, resident/patient education, early recognition of “at-risk” residents and protocol for clinical feedback (based on QIP 2016/17 Workplans).

SPOTLIGHTS
27
Reducing Readmissions
Champlain LHIN, Regional Geriatric Program of Eastern
Ontario (RGPEO), Carefor, The Mills, Almonte General
Hospital, Carleton Place and District Memorial Hospital,
and Champlain CCAC
• Partnering to implement the Assess and Restore pilot program to support
frail seniors in the rural community
• The program has introduced a position combining the roles of a Geriatric
Emergency Management (GEM) nurse and a community assessor to help
link frail seniors with community services, and is evaluating whether this is
the best model to improve the patient’s quality of life
• The program has been very successful in reducing emergency department
readmissions, keeping seniors in their home and community longer, and
has had positive effect in reducing our ALC rate
• The early successes of this program speak to the value integration,
collaboration and innovation has had on the continuum and quality of care
in our community
28
Reducing Length of Stay
Pembroke Regional Hospital Inc.
• Notable reduction in the Acute Length of Stay for medical patients
resulted in improved Emergency Department (ED) wait time for
admitted patients target (target 20 hours)
• Originally planned to increase discharge planning resources for
complex patients to help reduce Acute Length of Stay; however,
due to a bed reduction in the medical program resulting in fewer
admissions, it was decided that increased resources were not
necessary
• The latest Quality Improvement Plan (QIP) reported ED wait time
at 14.8 hours, compared to over 21.67 hours last year
• Average Length Of Stay (ALOS) is currently around 5.6 days, down
from 7.4 days in 2014/15
29
Improving Access to Care
West Carleton Family Health Team
• Created a Nurse Clinic, where nurses treat common
conditions and deliver routine treatments, including:
– 15 month childhood checkups; actinic keratosis; allergy shots; blood
pressure checks; conjunctivitis; diabetic management visits; ear
syringes; immunizations; oral contraceptive management; tick bites;
travel medicine; urinary tract infections; warts
• In-person visits are also reduced by having the Desk Nurse
relay medical results to patients who call (when an
appointment is not necessary)
• This initiative has improved timely access to effective care
for its patients
30
Reducing Readmissions
Champlain CCAC, The Ottawa Hospital, Renfrew
County Paramedics, Service Provider Organizations,
and Primary Care Practitioners
• The Champlain CCAC engaged a number of care
providers and organizations with the aim of reducing
hospital admissions for Home Care Clients
• One result of this collaboration was the Community
Health Evaluation using Paramedicine Services
(CHECUPS) Program who can refer directly when in
the home to CCAC services
• While referral volume from this source is low, the types
of patients being referred are more complex

31
Reducing Emergency Department
(ED) Visits
Pinecrest Nursing Home (Plantagenet, Ontario)
• Review the following for each long-term care resident
to determine changing conditions and to initiate
discussions with residents and family regarding wishes
for palliative care in the home prior to acute changes in
condition:
– Palliative Score Index (PSI) and Changes in Health
– End-Stage Disease
– Signs, and Symptoms Scale (CHESS) scores (from RAI MDS
assessment each quarter)

DISCUSSION

33
Discussion Points
Based on the LHIN 2016/17 QIP Snapshot Report:
• What are your overall impressions about the quality
initiatives underway in your LHIN as reflected in the
QIPs?
• Were there any “Aha” moments (positive or negative)?
• Did you observe any gaps or areas for improvement
across the LHIN?
• How might this information be useful for your LHIN?
• How does this information tie into the LHIN’s
Integrated Health Services Plan and the Regional
Quality Table?
www.HQOntario.ca
FOLLOW@HQOntario