champaign city fact sheet
Upload: social-impact-research-center-at-heartland-alliance-for-human-needs-and-human-rights
Post on 07-Apr-2018
220 views
TRANSCRIPT
8/4/2019 Champaign City Fact Sheet
http://slidepdf.com/reader/full/champaign-city-fact-sheet 1/4
Champaign:Snapshot of Poverty, Income,
and Health Insurance Coverage
33 West Grand Avenue, Sui te 500 | Chicago, I l l inois 60654 | 312.870.4949 | research@heart lan dal l iance.org
The newly released data from the U.S. Census Bureau’s American Community Surveyprovide a glimpse of the ongoing impacts of the Great Recession for millions of indi-viduals and families. This snapshot of your community’s data includes a comparisonof 2010 data to 2009 and 1999, illustrating trends over time. Fact sheets for addition-
al geographies are available at http://www.heartlandalliance.org/research/current-and-local-data/local-fact-sheets.html.
The effects of the Great Recession on unemployment, poverty, and income are still being felt by millions of individuals and families, and the eroding safety net means that while there are more people in need, there arefewer resources to help them. Preserving, extending, and strengthening these solutions can help keep morepeople from falling into poverty and help those struggling to meet their basic needs:
• Fundsafetynetandbeneitprograms such as SNAP (food stamps), TANF, Medicaid, and the EarnedIncome Tax Credit, which help poor and near-poor individuals and families bridge the gap between lowincomes and meeting their most basic needs. These programs not only help reduce poverty, but alsogenerate additional economic activity in local communities.
• Continue Unemployment Insurance for those seeking employment, which will help protect people whoare out of work and keep families out of poverty.
• Invest in subsidized and transitional employment programs to help disadvantaged workers and
struggling businesses weather the stalled economy and create jobs that will put people back to work andthat pay living wages.
2010 data from the U.S. Census Bureau’s American Community Survey
Social IMPACT Research Center, a program of Heartland Alliance
September 22, 2011 (version 1)
poverty
overview
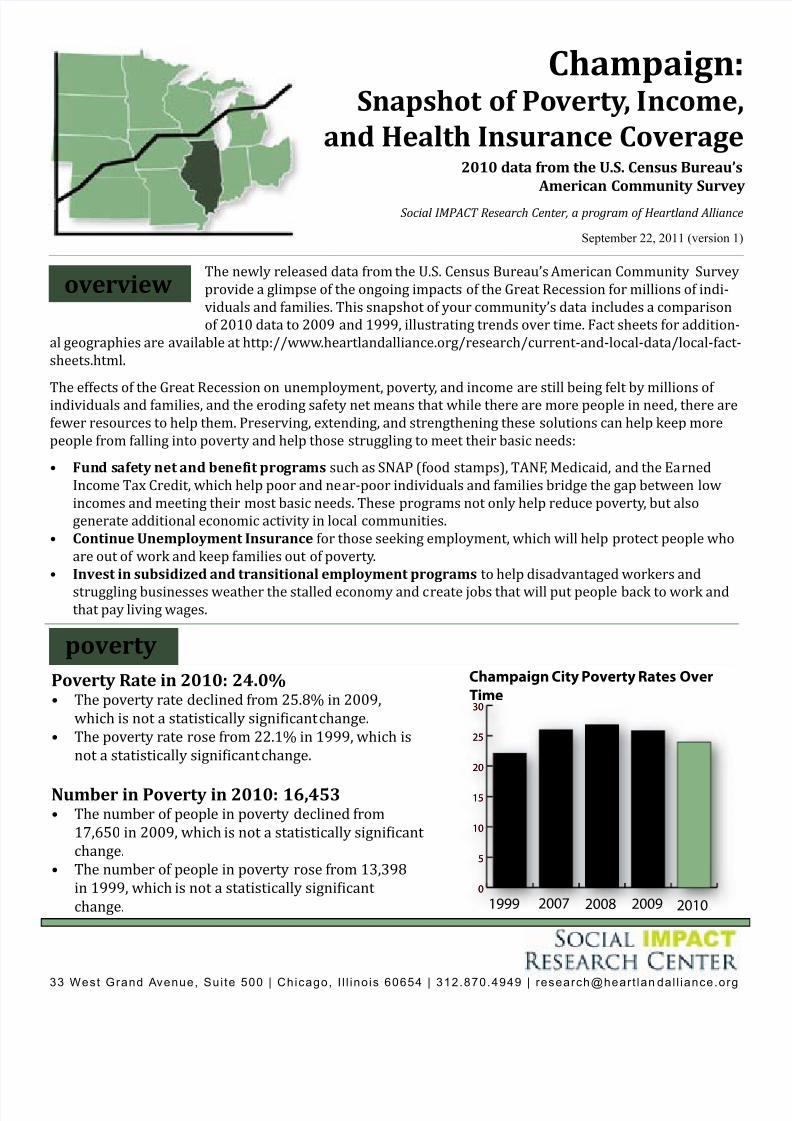
Poverty Rate in 2010: 24.0%• The poverty rate declined from 25.8% in 2009,whichisnotastatisticallysigniicant change.
• The poverty rate rose from 22.1% in 1999, which isnotastatisticallysigniicant change.
Number in Poverty in 2010: 16,453• The number of people in poverty declined from17,650in2009,whichisnotastatisticallysigniicant
change.• The number of people in poverty rose from 13,398 in1999,whichisnotastatisticallysigniicant
change.
0
5
10
15
20
25
30
0
5
10
15
20
25
30
Champaign City Poverty Rates Over
Time
1999 2007 2008 2009 2010
8/4/2019 Champaign City Fact Sheet
http://slidepdf.com/reader/full/champaign-city-fact-sheet 2/4
extreme poverty
child povertyincome
Median Household Income in 2010:$40,277• Median household income rose by 3.8% from
$38,806 in 2009, which is not a statisticallysigniicant change.
• Median household income declined by6.1% from $42,914 in 1999, which is not astatisticallysigniicant change.
Childpovertyrelectschildrenwhoarerelatedtotheirhouseholdhead.
2 of 4
Extremepovertyisdeinedashalfthepovertylineor50%FPL.
All prior year’s income data have been updated to 2010 dollars.
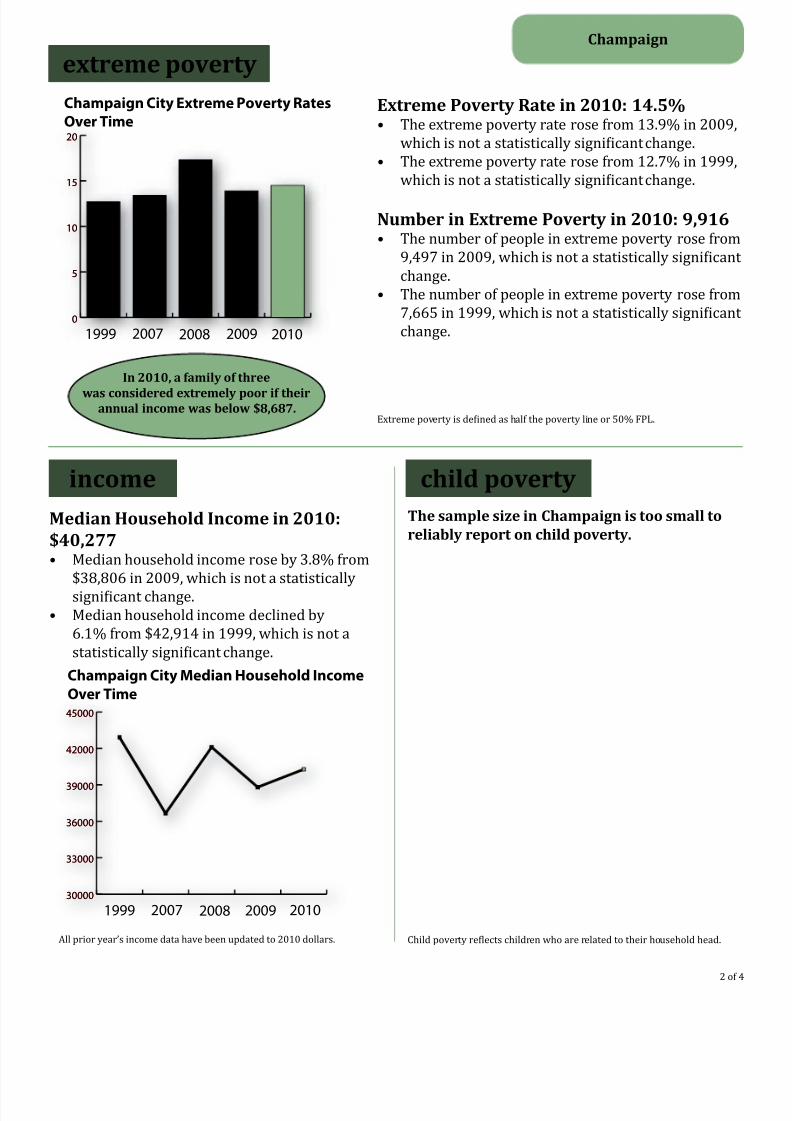
Extreme Poverty Rate in 2010: 14.5%• The extreme poverty rate rose from 13.9% in 2009,whichisnotastatisticallysigniicant change.
• The extreme poverty rate rose from 12.7% in 1999,whichisnotastatisticallysigniicant change.
Number in Extreme Poverty in 2010: 9,916• The number of people in extreme poverty rose from9,497in2009,whichisnotastatisticallysigniicant
change.• The number of people in extreme poverty rose from7,665in1999,whichisnotastatisticallysigniicant
change.
The sample size in Champaign is too small toreliably report on child poverty.
In 2010, a family of three
was considered extremely poor if theirannual income was below $8,687.
Champaign
0
5
10
15
20
0
5
10
15
20
Champaign City Extreme Poverty Rates
Over Time
1999 2007 2008 2009 2010
30000
33000
36000
39000
42000
45000
30000
33000
36000
39000
42000
45000
Champaign City Median Household Income
Over Time
1999 2007 2008 2009 2010

8/4/2019 Champaign City Fact Sheet
http://slidepdf.com/reader/full/champaign-city-fact-sheet 3/4
low income
health insurance coverage
Healthinsurancedatarelectthecivilian,non-institutionalizedpopulationunder
65 years old; sum of uninsured, privately, and publicly insured percents do not addup to 100 because for certain populations it is possible have both public and privatecoverage.
3 of 4
Uninsured Rate in 2010: 15.7%• The uninsured rate rose from 8.5% in
2009,whichisastatisticallysigniicant change.
Number of Uninsured in 2010:11,862• The number of people without health
insurance rose from 6,327 in 2009,whichisastatisticallysigniicant change
Type of Insurance in 2010:
• 77.5% are covered by private insurance.• 7.9% are covered by public insurance.• 15.7% are uninsured.
Lowincomeisdeinedasabovethepovertylinebutbelowtwicethepovertyline.or100-199%FPL.
Low Income Rate in 2010: 13.5%• Thelowincomeratedeclinedfrom17.4%in2009,whichisnotastatisticallysigniicant change.
• Thelowincomeratedeclinedfrom15.7%in1999,whichisnotastatisticallysigniicant change.
Number with Low Incomes in 2010: 9,237• The number of people with low incomes declined from 11,892 in 2009, which is not a statisticallysigniicant change.
• The number of people with low incomes declined from 9,523 in 1999, which is not a statisticallysigniicant change.
In 2010, a family of three wasconsidered low income if their annual
income was between $17,374 and$34,748.
Champaign
Champaign City Health Insurance Coverage, 2010
0
10
20
30
40
50
60
70
80Uninsured
Public
Private
0
10
20
30
40
50
60
70
80Uninsured
Public
Private
P e r c e n t o f N o n - E l d e r l y

8/4/2019 Champaign City Fact Sheet
http://slidepdf.com/reader/full/champaign-city-fact-sheet 4/4
Oficialpovertydataarebasedonthefederalpoverty
thresholds, which are used to determine poverty status.Themeasureisnotgeographicallyspeciicanddoesnot
relectwhatittakesforfamiliestomakeendsmeet.
workers
2010 Federal Poverty Thresholds
Family Size Poverty Threshold 1 $11,1392 $14,2183 $17,3744 $22,314
measuring poverty
Farmorepeoplestruggletomakeendsmeetthantheoficial
povertydatasuggest.TheIllinoisSelf-SuficiencyStandardshows
that it takes a family of 3 (adult, preschooler, school age child)$45,598 to make ends meet in Champaign County.
All data are derived from the U.S. Census Bureau’s American Community Survey and from the 2000 Decennial Census. The American
Community Survey recently released estimates on 2010 income, poverty, and health insurance coverage, which are the most current dataavailable for geographies with populations over 65,000. For more information on the American Community Survey, visit www.census.gov/
acs/www/. Statistical signicance refers to the probability that the observed changes are “true” rather than the result of an error in sampling or
estimation. Data included here are statistically signicant at the 90th percentile. FormoreinformationontheIllinoisSelf-SuficiencyStandard,
visithttp://www.heartlandalliance.org/research/illinois-self-suficiency-standard/.
The Social IMPACT Research Center (IMPACT) is a nonprofit organization that investigates today’s most pressing social issues and solutions
to inform and equip those working toward a just global society. IMPACT, a program of Heartland Alliance for Human Needs & Human Rights,
provides research, policy analysis, consulting, technical assistance, communications, and coalition building to projects in Illinois, the Midwest,
and nationally. Visit www.heartlandalliance.org/research to learn more.4 of 4
Median Earnings for Female Full-TimeYear-Round Workers in 2010: $36,525• Women’s earnings declined by 4.2% from $38,119 in2009,whichisnotastatisticallysigniicant
change.• Women’s earnings rose by 2.7% from $35,574 in1999,whichisnotastatisticallysigniicant
change.
Median Earnings for Male Full-Time Year-Round Workers in 2010: $44,978• Men’s earnings declined by 7.5% from $48,638 in2009,whichisnotastatisticallysigniicant
change.• Men’s earnings declined by 6.0% from $47,859 in1999,whichisnotastatisticallysigniicant
change.
What does it really take to make
ends meet?
Champaign
In 2010, women earned $0.81 forevery $1.00 earned by men.
-8
-7
-6
-5
-4
-3
-2
-10
1
2
3
-8
-7
-6
-5
-4
-3
-2
-10
1
2
3
Champaign City Change in Median Earnings
of Full-Time, Year-Round Workers
Men
Women
Men
Women
Change 09-10 Change 99-10
P e r c e n t C h a n g e