challenges of modelling surface mass balance - esa...
TRANSCRIPT
9/15/16
1
Challengesofmodellingsurfacemassbalance
MichielvandenBroekeInstituteforMarineandAtmosphericResearch,UtrechtUniversity(IMAU)
AdvancedTrainingCourseonRemoteSensingoftheCryosphereLeeds(UK),12-16September2016
Howdowedefinesurfacemassbalance(SMB)?
Here:thesumofsurfaceand internalmassbalance(climatic massbalance orfirnmassbalance)
Ligtenberg,PhDthesis,2014

9/15/16
2
MassBalance=SurfaceMassBalance– DischargeMB=dM/dt =SMB– D
SMBischallenging:notone,butthreebalances!
Icesheetmassbalance(MB)MB=Surfacemassbalance– Discharge [Gt yr-1]
Surfacemassbalance(SMB)SMB=Precipitation – Sublimation – Runoff- Erosion [Gt yr-1]
Liquid waterbalance(LWB)Runoff=Rain+Condensation +Melt– Refreezing– Retention [Gt yr-1]
Surfaceenergybalance(SEB)M=SWnet +LWnet +H+L+Gs [Wm-2]
J.PaulGettyMuseum

9/15/16
3
Combine EO,insituobservations andSMBmodelling
Remotesensing
Climatemodel
Insituobservations
EvaluationCalibration
Spatial/temporal extension
Firnm
odel
GRACEmasstrends(2003-2012)
Courtesy:BertWouters

9/15/16
4
13yearsoficesheetmasschangesfromGRACE
Velicogna andothers,2015
SMB:snowfalldriven
Greenlandicesheet
SMB:snowfallandrunoffdriven
Antarcticicesheet
The‘simpler’case:
Antarctica
NASA/MODIS

9/15/16
5
Masschangesin2009fromGRACE
MartinHorwath
AddedvalueofSMBmodelling:acasestudy forAntarctica
Elevationchangesin2009fromEnvisat
MartinHorwath
AddedvalueofSMBmodelling:acasestudy forAntarctica

9/15/16
6
is forced using fields of temperature, specific humidity,
zonal and meridional wind components, and surface pres-sure from either GCM or re-analysis output. Relaxation of
RACMO2 prognostic variables towards external forcings is
restricted to the boundary relaxation zone (Fig. 1). Externalforcings are updated every six hours and linearly interpo-
lated in time to yield accurate values in between. Sea
surface temperatures and sea-ice extent are also prescribedfrom the forcing model. The version of RACMO2 used for
this study includes a snow model that calculates tempera-ture, density and meltwater processes (percolation, reten-
tion, refreezing and runoff) in the snow (Ettema et al.
2009), and an improved albedo scheme, where the snowalbedo depends on snow grain size (Kuipers Munneke
et al. 2011). For this study, contributions from drifting
snow processes have not been included, because themodule of Lenaerts and Van den Broeke (2012) was not yet
fully implemented when we started the simulations.
For contemporary climate studies of the AIS (1–30 years),RACMO2 has been run on grids with 27 and 5.5 km hori-
zontal resolution (Lenaerts et al. 2012a, b). However, for the
number of simulation years considered here (660 years intotal), a horizontal resolution of 55 km is considered a good
trade-off between computational expense and spatial detail;
doubling the grid resolution would multiply the computa-tional time by a factor 10. Moreover, the annual integrated
SMB of the AIS at 55 km resolution (Van de Berg et al.
2006) is similar to that at 27 km resolution (Lenaerts et al.2012a). For the scenario runs, the largest uncertainty there-
fore derives not from the model resolution but from the
chosen forcing model and scenario. Given this information,and the fact that a 27 km resolution run is ten times as
expensive as a 27 km run, we chose 55 km as final resolu-tion. The model topography, grid resolution and lateral
relaxation boundary of the domain are shown in Fig. 1.
For the period 1980–1999, a RACMO2 reference sim-ulation, forced by ERA-40 re-analysis data from the
European Centre for Medium-Range Weather Forecasts
(Uppala et al. 2005), was performed in order to check thereliability of the GCM-forced RACMO2 simulations. In
this paper, ERA-40 has been used as forcing instead of its
successor ERA-Interim (Dee and et al. 2011), since thelatter only covered the period 1989–2009 at the time the
RACMO2 simulations were started. Other RACMO2
simulations forced by re-analysis data (ERA-40 or ERA-Interim) yielded realistic SMB results over Antarctica
Fig. 1 Map of Antarcticashowing the model domain, theboundary relaxation zone(dotted area) and modeltopography in meters above sealevel
Future SMB of Antarctica
123
Regionalclimatemodel
domain
27kmresolution
Courtesy:MelchiorvanWessem
Modelled3-hourly
precipitation
Run:RACMO2.3/ANTResolution:27km

9/15/16
7
!.!.!.!.!.!.!.!.!.!.!.!.!.!.!.!.
$+
$+
$+
#*
$+
!(
#*
!.
!(
!(
#*
!.
!(!(!(
#*
#*
$1
!(
#*
!(!(
!(
#*
!(
#*
#*#*
!(
$1$1
!(
!(
!.
!(
$1
!(#*!(!(!(#*
#*
!(
!(
#*
!(
!(#*
#*!(
!(
!(
!(!(
#*
#*
#*
#*
!(
#*#*
!($1#*
!(
$1
!(
!(
#*
#*
!(!(
!(
!(
#*
!(
#*
$1
#*
!(
#*
!(
#*
!(
$1
!(!(!(!(!(
#*
!(
#*
!(
!(
#*
!(!(
!(
#*
!(
#*
!(
!(
#*
!(#*
#*#*!($1
#*
!(
#*
!(#*!(
#*
!(
!(
!(
!($1
#*
#*
!(
!(
#*
!(
#*
!(
#*#*
!(
#*
!(
!(
#*
#*
!(
#*
!(
!(
!(
!(
!(
!(
$1
#*
"/
#*
!(
"/
!(
!(!(
!(
#* #*$1$1
#*
!(
!(!(
#*#*
!(
!(
Schwerdtfeger
Modesta Sofia-B
Kominko-Slade (WAIS)
Lindsey Island
PANDA-NorthEagleDome A
Mt Brown
WhoopWhoop
CapePoinsett
SnyderRocks
CaseySkiway
Law Dome
HauptNunatak
See Inset Map B
See Inset Map A
Dome C (FRA)
Baldrick
PANDA-South
Cape Hallett
JASE2007
D-85
Summit/A
Halvfarryggen
Hugo Is
Margaret
Skinner Saddle
Darwin GlCentral Valley
Dome C II
Bisco IslandAWS 1
Larsen Ice Shelf
Thiel Mountains
D-0
D-3D-17
DC N
Dome Fuji
Atka Bay
D-47
Halley V
Utsteinen
Thurston Island
Evans Knoll
Bear PeninsulaSabrina
Atka &
Ekstrom &
Leningradskaya
Russkaya
Molodeznaya
Druznaja-4
Paola
Cierva CoveAmsler Island
Korff Ice Rise
Troll
Nordenskiold
AWS 18 Windy
Site 8
Emma
Austin
Kathie
Filchner
Gerlache StraitNeko Harbor
Dome C
Vito
Nico
Gill
Erin
D-10
Byrd
Henry
Harry
Wilkins RunwayWest 4m / East ICAO
AGO-5
AGO-4
AGO-3
AGO-2
AGO-1
Mizuho
Lettau Elaine
Sky-Blu
Limbert
Soerasen
Elizabeth
Dome Fuji (JPN)
Concordia
Ekstrom Shelf Ice
Siple DomeJanet
Port Martin
Kohnen Base
Irene
Giulia
Cp Denison
Relay Station
Dismal Is
Butler Is
Fossil Bluff
Bonaparte Pt
Camp Maudheimvida
AWS 17AWS 14
Possession Is
Joinville Is
Union Glacier
Theresa
Marilyn
!(
!(
!(!(!(!(!(!(!(
!(
!(#*
!(
!(
!(
!(
!(
#*
!(
Arelis
Inset Map A
!.
!.
!.!.!.!.!.!.!.
!.
!.
!.
!.
!.!.
!.
#*
!(
$1
!(
!(
#*
$1
$1
$1
#*
!(
$1
#*
$1
!(
!(
$1
$1
#*
#*
#*
#*#*!($1
!(
#*!(
!($1
#*
$1
!(!(
#*$1
$1#*
#*
EmiliaLinda
Minna Bluff
Arelis
Cp Bird
Marble Pt
Butter Pt -Ferrar
Jules
Laurie II
FerrellBiesiada Crevasse
Cp Royds
Herbie Alley N
Tent Is
WindlessBight
N Crevasse
Cp Spencer
Willie Field
Pegasus N
Ford RockRoss Ice Shelf White Out
Lorne
White Is S
Bull Pass
Minna Bluff
Bratina Island
Miers ValleyGarwood Valley
Mt Fleming
Granite Harbour
Victoria Valley
Victoria Lower Gl
Evans Piedmont Gl
Cones
AlexanderTall Tower
LTER AWS (21)
Marble Pt II
White Is
Alessandra
Silvia
Lola
Zoraida
EneideRita
0 100 km
Inset Map B
0 50 km 0 500 km
Coastline: ADD v4.1, 2003; Cartography: April 2016 Sam Batzli, SSEC, University of Wisconsin-Madison; Funding: National Science Foundation ANT-0944018
Manuela
Univ. of Wisconsin (UW)
Brazil
Italy
Netherlands
!(
!(
China/Australia
!(
!(
#* Australia!(
SPAWAR$1$+ AGO
United States AWS International AWS
United Kingdom!(
Russia!(
!. Other US
South Korea!(
Automatic Weather StationsAntarctica - 2016
#*
#*#*
#*
UW / AustraliaUW / ChinaUW / FranceUW / Japan
Commercial"/
Other AWS France!(
Japan!(
Jang Bogo
Whitlock
Belgium/Netherlands!( New Zealand!(
Germany!(
Lucia
Penguin
Maria
Finland!(
China!(
China
#* UW / New Zealand#* UW / United Kingdom
Norway!(
Virginia
UniversityofWisconsin,Madison
kgm-2 y-1
Circles:≈1200 obs.
Data:Arthern andothers,2006
Observation-based accumulationmap

9/15/16
8
ModeledAntarcticsurfacemassbalance
kgm-2 y-1
Run:RACMO2.1/ANTPeriod:1979-2011Resolution:27kmCircles:≈1200obs.
Data:Lenaertsandothers,2012
FilterSMBfieldfromregionalclimate modelRACMOtosameresolution asGRACE
CompareSMBtoGRACEmassanomalies
MartinHorwath

9/15/16
9
MartinHorwath
Convertsnowfallanomaliestofirnthickness change,usingafirn model
Comparemodelled snowdepthchangetoaltimetry
MartinHorwath
Convertsnowfallanomaliestofirnthickness change,usingafirn model
Comparemodelled snowdepthchangetoaltimetry
AmundsenSeaembayment
DronningMaudLand

9/15/16
10
DronningMaudLand,EastAntarctica
Lenaertsandothers,2013
a) SMBfromregionalclimatemodelb) CumulativeSMBanomalyvs.GRACE
MartinHorwath
Convertsnowfallanomaliestofirnthickness change,usingafirn model
Comparemodelled snowdepthchangetoaltimetry
AmundsenSeaembayment
DronningMaudLand
9/15/16
11
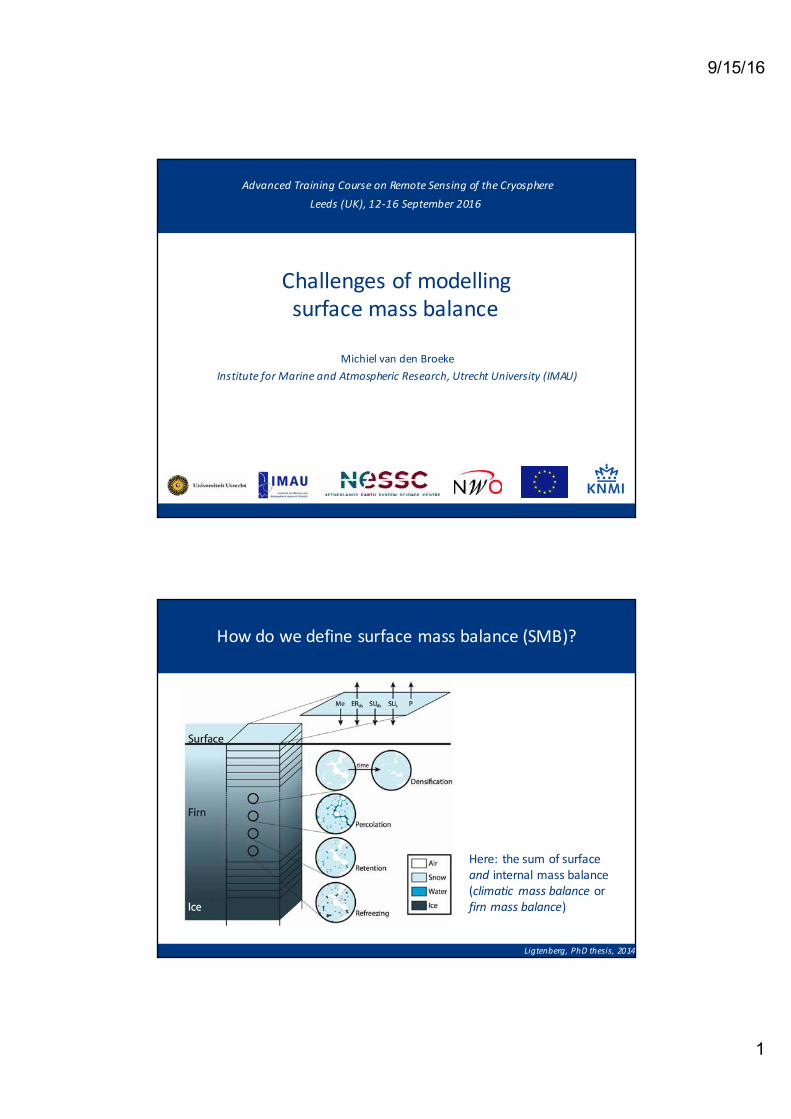
Amundsen Seaembayment,WestAntarctica
Sutterley andothers,2014
a) SMBandDb) MB=SMB– Dc) CumulativeMB
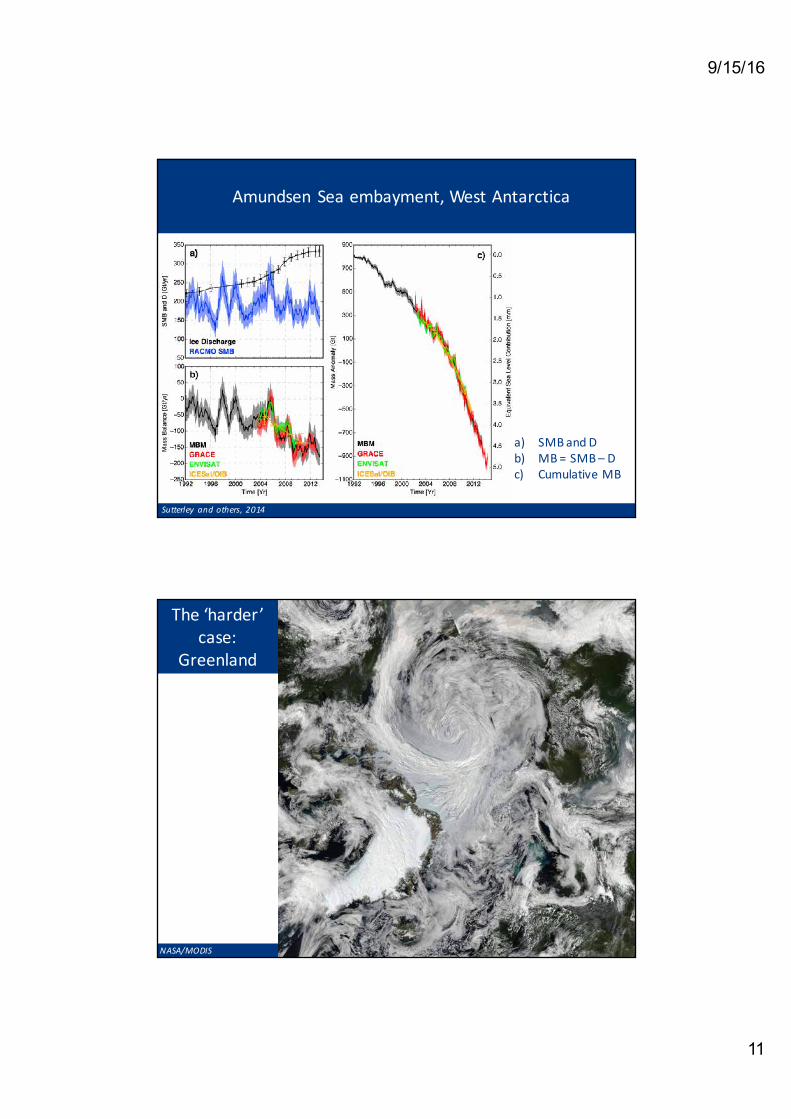
The‘harder’case:
Greenland
NASA/MODIS

9/15/16
12
13yearsoficesheetmasschangesfromGRACE
Velicogna andothers,2015
SMB:snowfalldriven
Greenlandicesheet
SMB:snowfallandrunoffdriven
Antarcticicesheet
SMBischallenging:notone,butthreebalances!
Icesheetmassbalance(MB)MB=Surfacemassbalance– Discharge [Gt yr-1]
Surfacemassbalance(SMB)SMB=Precipitation – Sublimation – Runoff- Erosion [Gt yr-1]
Liquid waterbalance(LWB)Runoff=Rain+Condensation +Melt– Refreezing– Retention [Gt yr-1]
Surfaceenergybalance(SEB)M=SWnet +LWnet +H+L+Gs [Wm-2]
J.PaulGettyMuseum

9/15/16
13
Greenlandautomaticandmannedweatherstations
AdaptedfromGEUS
K-transect,westGreenland
S10
NASA/MODIS

9/15/16
14
Greenlandsurfaceenergybalance
Courtesy:PeterKuipers Munneke
S5:500masl
S6:1000masl
S9:1500masl
S10:1850maslStationS6(1000masl)
Regionalclimatemodel
11kmresolution

9/15/16
15
Modelevaluation:surfaceenergy
balance
Noëlandothers,2015
TCD9, 1177–1208, 2015
Impact of summersnowfall events on
GrIS SMB
B. Noël et al.
Title Page
Abstract Introduction
Conclusions References
Tables Figures
J I
J I
Back Close
Full Screen / Esc
Printer-friendly Version
Interactive Discussion
Discussion
Pa
per
|D
iscussion
Pa
per
|D
iscussion
Pa
per
|D
iscussion
Pa
per
|
(a) (b)
(c) (d)
(e) (f)
(g) (h)
Figure 5. Absolute values of observed and modelled turbulent and net shortwave/longwavefluxes (Wm�2) at station (a) S5 for 2004–2012, (c) S9 for 2004–2008, (e) S9 for 2009–2012 and(g) S10 for 2010–2012; di◆erence in modelled and observed surface albedo and surface meltenergy (Wm�2) at stations (b) S5, (d) S9, (f) S9 and (h) S10 for the same periods, respectively.
1205
TCD9, 1177–1208, 2015
Impact of summersnowfall events on
GrIS SMB
B. Noël et al.
Title Page
Abstract Introduction
Conclusions References
Tables Figures
J I
J I
Back Close
Full Screen / Esc
Printer-friendly Version
Interactive Discussion
Discu
ssio
nP
ap
er
|D
iscu
ssio
nP
ap
er
|D
iscu
ssio
nP
ap
er
|D
iscu
ssio
nP
ap
er
|
(a) (b)
(c) (d)
(e) (f)
(g) (h)
Figure 5. Absolute values of observed and modelled turbulent and net shortwave/longwavefluxes (Wm�2) at station (a) S5 for 2004–2012, (c) S9 for 2004–2008, (e) S9 for 2009–2012 and(g) S10 for 2010–2012; di◆erence in modelled and observed surface albedo and surface meltenergy (Wm�2) at stations (b) S5, (d) S9, (f) S9 and (h) S10 for the same periods, respectively.
1205
500masl 1000masl
1500masl 1850masl
Modeledevaluation:surfacemass balance
kgm-2 y-1
Run:RACMO2.3/GRPeriod:1958-2014Resolution:11kmNoëlandothers,2016

9/15/16
16
Greenlandcumulativemassbalance(1958-2014)
VandenBroekeandothers,2016
Modelled Greenlandicesheetmelt/runoff (1958-2014)
0
200
400
600
800
1000
1960 1965 1970 1975 1980 1985 1990 1995 2000 2005 2010 2015
Mas
s flu
x (G
t yr-1
)
Year
Melt
Runoff
Melt: 12.1 +/- 3.6 Gt yr-1
Runoff: 9.6 +/- 2.4 Gt yr-1
Refreezing: 3.0 +/- 1.7 Gt yr-1
Trends 1991-2014
Refreezing
Surface sublimation
Typical uncertainties
VandenBroekeandothers,2016

9/15/16
17
Modelled Greenlandicesheetmassbalance(1958-2014)
-400
-200
0
200
400
600
1960 1965 1970 1975 1980 1985 1990 1995 2000 2005 2010 2015
Mas
s flu
x (G
t yr-1
)
Year
Solid ice discharge
Surface mass balance
Discharge: 6.7 +/- 0.4 Gt yr-1
SMB: -10.7 +/- 2.9 Gt yr-1
Mass balance: -17.4 +/- 3.0 Gt yr-1
Trends 1991-2014
Ice sheet mass balance
Typical uncertainties
VandenBroekeandothers,2016
Byrdglacier,Antarctica

9/15/16
18
Impactofmodel resolutiononnetsnowaccumulation
Lenaerts and others: Impact of model resolution on simulated wind, drifting snow and SMB 823
Fig. 2. Modeled annual mean (2009) 10m wind speed (contours) and direction (arrows) in RACMO/5.5 (left) and RACMO/27 (right). Thelocations of the four AWSs in Figure 4a–d are indicated by their respective letters.
Drifting snow measurements are sampled at the TalosDome TALDICE drilling site (72◦ S, 159◦ E, 2315ma.s.l.;http://www.taldice.org; see Fig. 1 for location). Measure-ments are obtained with FlowCaptTM driftometer sensorsproduced by ISAW Outdoor Environmental Monitoring(Chritin and others, 1999). The instrument is composedof four sensors: two of these are placed 0.2m above thesnow surface, and the other two 1m above the surface.These instruments provide inaccurate estimates of the snowtransport fluxes (Cierco and others, 2007), but do provide arealistic estimate of the occurrence of drifting snow.Modeled SMB is compared with observations described
by Agosta and others (2012). The observations originatefrom a ∼150 km long stake line that runs from the coast ofTerre Adelie to the southwest (0–1800ma.s.l.). ComparingRACMO to these observations can be regarded as a stringenttest for model performance, because the stake line covers thestrong SMB gradient between the relatively mild and windycoastal climate and drier and calmer conditions inland athigh spatial resolution (100 data points).
RESULTSWind climateFigure 2 compares annual mean 10m wind speed ofRACMO/27 with RACMO/5.5. Although RACMO/5.5 obvi-ously shows much more detail, the regional patterns aresimilar. We find four areas of strong (>14ms−1) winds:three over outlet glaciers (Byrd, Mulock and Reeves/DavidGlaciers) in the Transantarctic Mountains, with several jetsabove 10ms−1, and one in coastal Terre Adelie, witha maximum wind speed of 16m s−1 at ∼69◦ S, 143◦ E,1100ma.s.l. On the smaller scale, the RACMO/5.5 windfield shows distinct features. Maximum wind speeds arehigher and occur closer to the grounding line. Relativelynarrow (<20 km) glacial valleys, in which the katabatic windspeeds converge and accelerate, are much better resolved at
5.5 km. In our simulation the strongest winds are found in theglacial valley of Reeves Glacier, with a maximumwind speedof 20.5m s−1, and, to a lesser extent, David Glacier nearthe Italian base (Mario Zuchelli) in Terra Nova Bay (∼75◦ S,163◦ E), and Byrd Glacier (81◦ S, 158◦ E). The occurrenceof these maxima is supported by results of Bromwich andothers (1990), who showed that Reeves Glacier is the primaryroute for katabatic winds, and David Glacier is an importantsecondary outflow valley.Lenaerts and others (2012b) showed that RACMO/27
underestimates high wind speeds in regions with complextopography. Figure 3 illustrates that in these regions, windspeeds in RACMO/5.5 agree better with observations. Theroot-mean-square error (rmse) decreases from 5.7m s−1 to3.6m s−1, and the mean bias between model and obser-vations drops from −4.3m s−1 to −1.4m s−1. Nonetheless,the extreme wind speeds (>15m s−1) in Terre Adelie remainunderestimated.Figure 3 only shows long-term mean near-surface wind
speeds. Drifting snow processes, however, are usuallyconnected to short-lived wind speed maxima. To evaluatethe model results at higher temporal resolution, Figure 4shows the daily mean 10m wind speed from RACMO/5.5,RACMO/27 and from available AWS observations. Due tolimited temporal coverage and large gaps in the data, theseAWSs are not included in Figure 3. At daily resolution,RACMO/5.5 shows clearly higher maximal wind speeds thanRACMO/27 at all stations, except for Sitry (Fig. 3b), wheretopography is smooth and the model agrees very well withthe observations, even at 27 km resolution. The other threestations are known to be major confluence areas, wherethe katabatic wind accelerates due to the convex shape ofthe glacier valley (Bromwich and others, 2000). At LarsenGlacier, the modeled timing and frequency of wind speedmaxima agree very well with the observations, whereas atPriestley and David Glaciers, observed wind speed maximaremain largely underestimated, also by RACMO/5.5. Theintense local katabatic flow at these locations is likely driven
Byrd glacier basin
Lenaertsandothers,2012
Impactofmodel resolutiononnetsnowaccumulation
Byrd glacier basin
Lenaertsandothers,2012

9/15/16
19
Impactofmodel resolutiononnetsnowaccumulation
Lenaertsandothers,2012
Enhanced dynamical downscaling
Courtesy:MelchiorvanWessem
Run:RACMO2.3/APPeriod:1979-2014Resolution:5.5kmCircles:≈120obs.
9/15/16
20
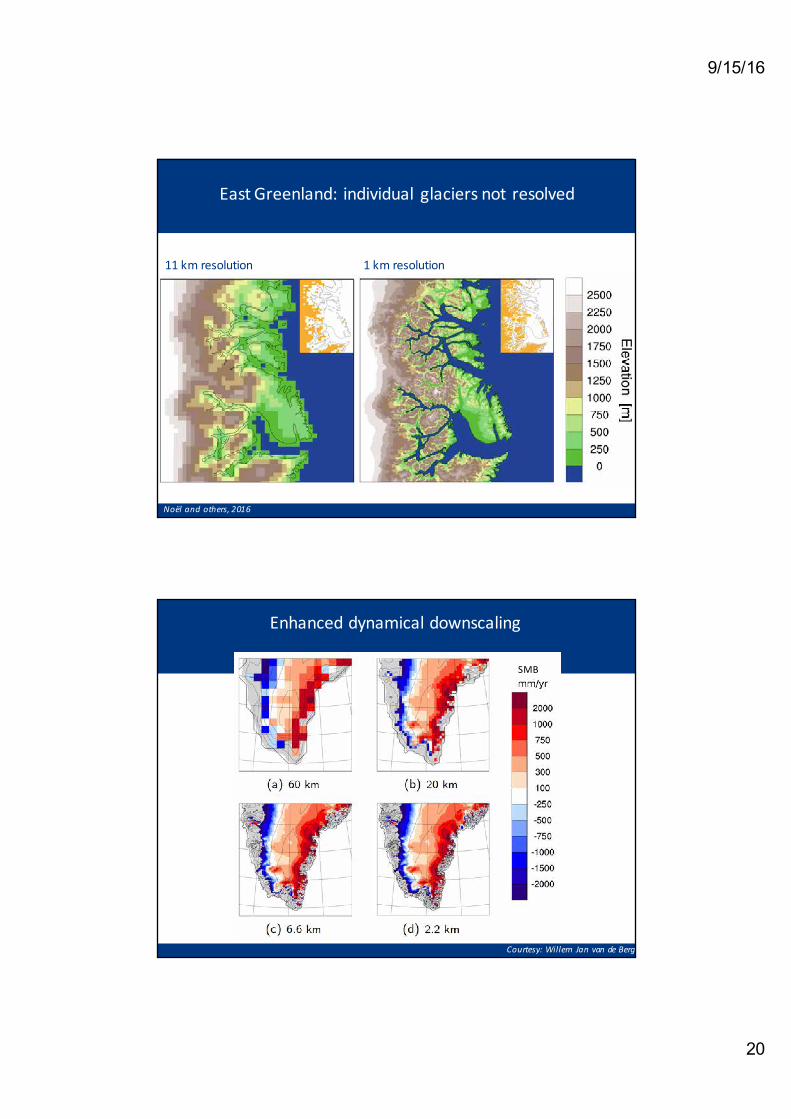
EastGreenland:individual glaciersnotresolved
11kmresolution 1kmresolution
Noëlandothers,2016
Enhanced dynamical downscaling
Courtesy:WillemJanvandeBerg
SMB
9/15/16
21
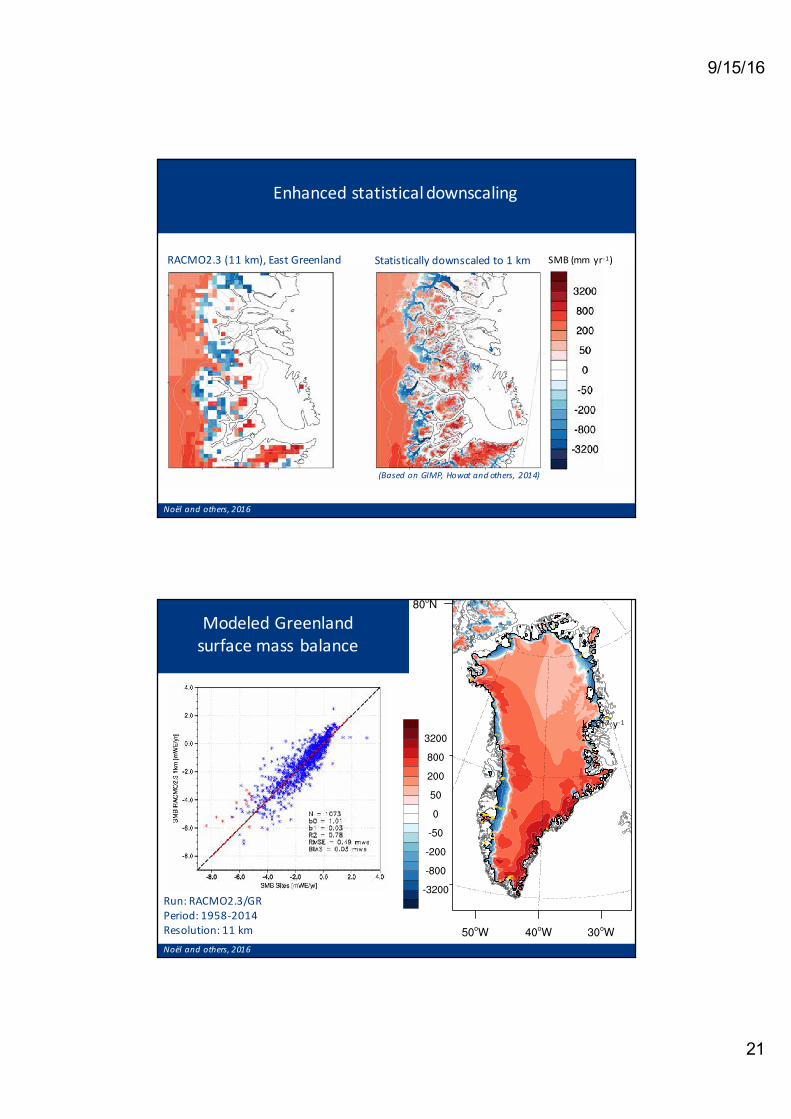
Enhanced statistical downscaling
RACMO2.3(11km),EastGreenland Statisticallydownscaledto1km
(BasedonGIMP,Howatandothers,2014)
SMB(mm yr-1)
Noëlandothers,2016
ModeledGreenlandsurfacemass balance
kgm-2 y-1
Run:RACMO2.3/GRPeriod:1958-2014Resolution:11kmNoëlandothers,2016

9/15/16
22
Outlook
ObservationsFocusonaccurateradiation andturbulence measurements!Newgenerationofautonomousweather stationsNewgenerationofsatellites:GRACE-2,ICESat-2
ModelsFurther improveexistingatmospheric climatemodels(clouds)Further improveexistingsnowmodels(heterogeneous percolation)Movetoglobalmodelsystems(coupledicesheetmodels)Improveprognostic albedoschemes(dust,blackcarbon, bio-albedo)