challenges in waste electrical and electronic equipment
TRANSCRIPT

sustainability
Article
Challenges in Waste Electrical and ElectronicEquipment Management: A Profitability Assessmentin Three European Countries
Idiano D’Adamo 1, Paolo Rosa 2,* and Sergio Terzi 2
1 Department of Industrial and Information Engineering and Economics, University of L’Aquila,Via G. Gronchi 18, 67100 L’Aquila, Italy; [email protected]
2 Department of Management, Economics and Industrial Engineering, Politecnico di Milano,Piazza Leonardo da Vinci 32, 20133 Milano, Italy; [email protected]
* Correspondence: [email protected]; Tel.: +39-02-2399-9537
Academic Editor: Vincenzo TorrettaReceived: 16 April 2016; Accepted: 29 June 2016; Published: 5 July 2016
Abstract: Waste electrical and electronic equipment (WEEE) is known as an important source ofsecondary raw materials. Since decades, its treatment allowed to recover great amounts of basicresources. However, the management of electronic components embedded in WEEE still presentsmany challenges. The purpose of the paper is to cope with some of these challenges through thedefinition of an economic model able to identify the presence of profitability within the recoveryprocess of waste printed circuit boards (WPCBs). To this aim, a set of common economic indexes isused within the paper. Furthermore, a sensitivity analysis on a set of critical variables is conducted toevaluate their impact on the results. Finally, the combination of predicted WEEE volumes (collectedduring the 2015–2030 period) in three European countries (Germany, Italy and the United Kingdom)and related economic indexes quantify the potential advantage coming from the recovery of this kindof waste in the next future.
Keywords: waste electrical and electronic equipment; waste printed circuit boards; end of lifemanagement; profitability assessment; sensitivity analysis
1. Introduction
WEEE (waste electrical and electronic equipment) is one of the most important sources of complexwaste [1]. In economic terms, potential revenues coming from the e-waste recycling are estimated in€ 2 billion and USD 16 billion in Europe and China, respectively [2,3]. A great improvement in materialrecovery rates has been enabled by worldwide initiatives during the last decades supporting theintegration of end-of-life (EoL) strategies within the value chain of companies [4,5]. However, currentperformances are still too low to be able to counteract the annual increase of generated waste, especiallyconsidering WPCBs (waste printed circuit boards), the most complex, hazardous, and valuableelements embedded in e-waste [6–9]. Basic guidelines for the reuse, recovery and recycling of WEEEhave been already established and many authors analysed and compared different WEEE directives andnational recovery systems [10–12]. Their aim was the assessment of the presence of basic principles ableto support the development of a circular economy based on the exploitation of both critical materialsand resources recovered from WEEE. From this side, the European Commission played (and continueto play) a key role in financing several dedicated projects (e.g., Innovative hydrometallurgical processesto recover metals from WEEE including lamps and batteries (HydroWEEE), Countering WEEE IllegalTrade (CWIT), Prospecting Secondary raw materials from the Urban Mine and Mining waste (ProSUM)and Critical Raw Material Closed Loop Recovery (CRM Recovery)).
Sustainability 2016, 8, 633; doi:10.3390/su8070633 www.mdpi.com/journal/sustainability
Sustainability 2016, 8, 633 2 of 19
Even if the sustainability of WPCB recycling processes is a timely topic in the literature [13–15],their economic implications are rarely analysed by the experts [16,17]. Given the limited set ofapplication fields and the relevant growth of WEEE, this paper proposes a feasibility analysis on therecovery process of PCBs from WEEE trying to follow multiple aims.
First, the paper assesses the potential profitability characterizing all the phases of a typical PCBrecovery process focused on WEEE, in both mobile and field configurations. Second, in order tosupport the obtained results, a set of alternative scenarios is analysed for each plant configuration,by taking into account the following critical variables: gold/palladium/copper market prices, goldpurity level, WPCB purchasing cost, plant saturation level and opportunity cost. Third, the estimatesof future profitability trends in three European nations (Germany, Italy and the U Kingdom) within the2015–2030 period are proposed. The results could support governmental and industrial actors duringthe revision of current directives and the evaluation of corrective measures.
The paper is organized as follows: Section 2 proposes a literature review about the currenteconomic models focused on WEEE. Section 3 presents the research framework and a descriptionof the economic model taken into account within the paper. Section 4 presents the main resultscoming from the introduction in the model of current data on WEEE. Section 5 describes a sensitivityanalysis on the main critical variables influencing decisions. Section 6 estimates the future profitabilitytrends in Europe. Finally, Section 7 proposes a discussion of the results and Section 8 presents someconcluding remarks.
2. Literature Review
Current electrical and electronic equipment (EEEs) is replaced with an even faster rate creatingenormous quantities of e-waste [18]. This phenomenon is due to both the rapid technologicaldevelopment and the requirement of higher performances to mass electronic products. Consideringthat, on average, each EEE embeds at least one PCB accounting for almost 3%–5% of its overall weight,WPCB expected volumes are impressive and accountable in several million tons [19]. Furthermore,PCBs are the most valuable elements embedded in EEEs [20–22]. However, current WEEE directivesdo not adequately manage neither their recovery process nor the required purity level of outputmaterials [6,23]. In addition, the existing economic models assessing the profitability of recyclingplants are very few and three main issues characterize them: (i) the limited set of application fields [24];(ii) the absence of standard materials composition of PCBs taken into account [16] and (iii) the focus ona particular phase of the process, considering both costs and revenue performance [25].
Some examples of the current economic models available in the literature are introduced hereand briefly discussed. A cost comparison of different PCB dismantling processes (manual versusmechanical ones) is proposed in [26]. When the treated WPCB amount is less than 1 kton, the costof manual dismantling is lower than the mechanical one (equal to USD 25,000 versus USD 50,000,considering 0.5 ktons of WPCBs). When 10 ktons of WPCBs are treated, the total cost of the mechanicaldismantling is equal to USD 350,000, while the one for the manual dismantling is equal to USD 400,000.
The feasibility of a hydrometallurgical process for the recovery of WPCBs is evaluated in [27].Positive performances are reached when gold exceeds the tipping point of 500 ppm. In addition,considering 1000 ppm of gold, the payback time varies from one to three years, with 100 kg and50 kg of WEEE per batch, respectively. The key role of gold is highlighted also by other authors [24].However, this dependency comes not only from the amount of precious metal characterizing a WPCB,but also from its current market price. Potential revenues are estimated to be equal to 21,500 USD/tonin a baseline scenario, becoming equal to 3800–52,700 USD/ton in alternative scenarios.
Another work evaluates the electrostatic separation, by assessing the payback time equal to2.5 years [28]. Sales revenues are defined as the most sensitive factor in the economic performance ofthe recycling system, but also feedstock stocks have a critical impact [29].
Sustainability 2016, 8, 633 3 of 19
A comparison of PCB mechanical treatment lines is evaluated in [30]. Gross profit is estimatedto be equal to 18 USD/ton with a traditional fluid bed line, 129 USD/ton with a process done in adeveloped country and 256 USD/ton with an automatic line.
Another comparison of economic performances from alternative treatment plants is proposedin [25]. Gross profit is estimated to be equal to ´83 USD/ton with a field plant in a developing country,´101 USD/ton with a field plant in a developed country and 14 USD/ton with an integrated mobilerecycling plant. These two works analyse an hourly productivity equal to 0.3 tons of WPCBs per hourand 0.125 tons of WPCBs per hour, respectively.
A recent work tries to cover these literature gaps by proposing an economic model able to assessthe profitability of a complete PCB recycling process [17]. Net present value (NPV) is estimated to varywithin the range 96,626–495,726 €/ton in a field plant (hourly productivity equal to 0.3 tons of WPCBsper hour) and within the range 52,495–276,267 €/ton in a mobile plant (hourly productivity equal to0.125 tons of WPCBs per hour). Discounted payback time (DPBT) is equal to one year. Within thesame paper, a sensitivity analysis defines the following critical variables: gold content, gold price, finalpurity level, WPCB purchasing cost, plant saturation level and opportunity cost. However, this lastwork assesses PCBs coming from the only automotive sector. This paper wants to extend the analysisto WEEE PCBs, in order to evaluate this growing market.
3. Materials and Methods
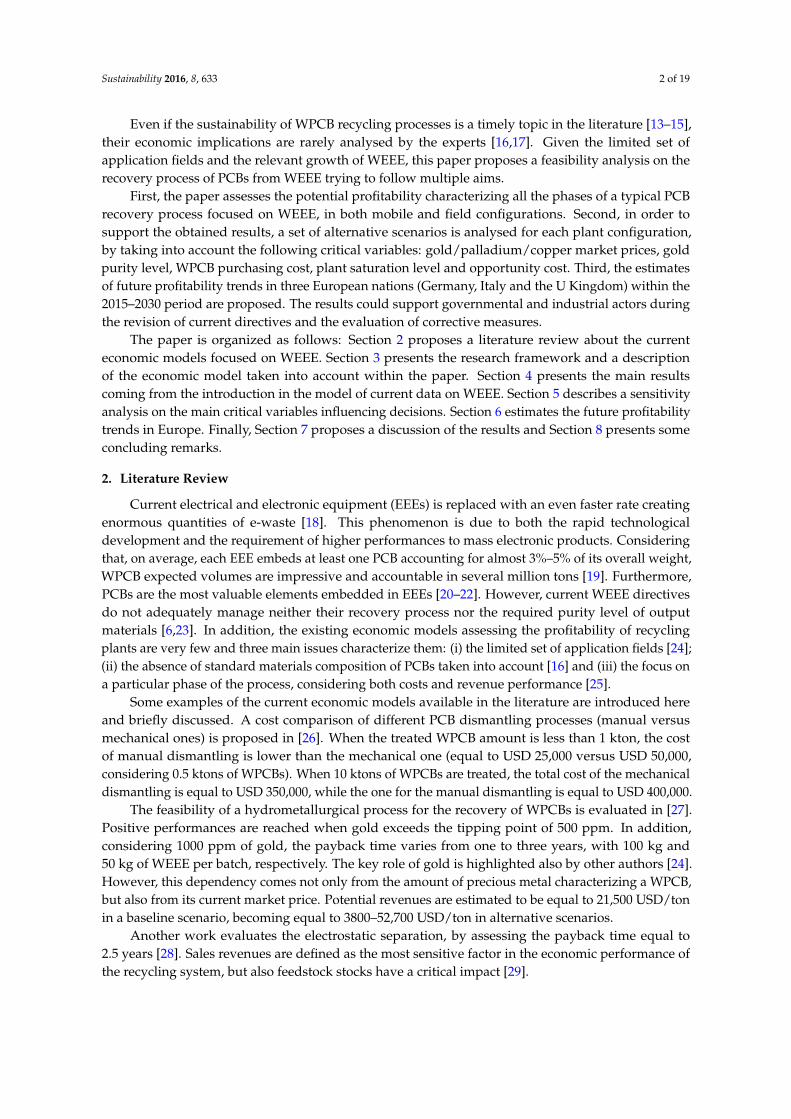
The following Figure 1 gives a summarizing view of the structure of the paper.
Sustainability 2016, 8, 633 3 of 19
A comparison of PCB mechanical treatment lines is evaluated in [30]. Gross profit is estimated
to be equal to 18 USD/ton with a traditional fluid bed line, 129 USD/ton with a process done in a
developed country and 256 USD/ton with an automatic line.
Another comparison of economic performances from alternative treatment plants is proposed
in [25]. Gross profit is estimated to be equal to −83 USD/ton with a field plant in a developing country,
−101 USD/ton with a field plant in a developed country and 14 USD/ton with an integrated mobile
recycling plant. These two works analyse an hourly productivity equal to 0.3 tons of WPCBs per hour
and 0.125 tons of WPCBs per hour, respectively.
A recent work tries to cover these literature gaps by proposing an economic model able to assess
the profitability of a complete PCB recycling process [17]. Net present value (NPV) is estimated to
vary within the range 96,626–495,726 €/ton in a field plant (hourly productivity equal to 0.3 tons of
WPCBs per hour) and within the range 52,495–276,267 €/ton in a mobile plant (hourly productivity
equal to 0.125 tons of WPCBs per hour). Discounted payback time (DPBT) is equal to one year. Within
the same paper, a sensitivity analysis defines the following critical variables: gold content, gold price,
final purity level, WPCB purchasing cost, plant saturation level and opportunity cost. However, this
last work assesses PCBs coming from the only automotive sector. This paper wants to extend the
analysis to WEEE PCBs, in order to evaluate this growing market.
3. Materials and Methods
The following Figure 1 gives a summarizing view of the structure of the paper.
Figure 1. A summarizing view of the structure of the paper.
Starting from a detailed state of the art analysis, the paper assesses the existing literature gaps,
focusing on lacks related to the available economic models. This way, a new economic model is
defined trying to fill in some of these gaps. Subsequently, the results obtained are assessed through
a sensitivity analysis. In order to add value to the paper, a set of the most relevant nations in terms
of e-waste generation are compared and an estimation of future trends is implemented.
3.1. WEEE Volumes
The entire work starts from the overall amount of WEEE collected in three European countries
(Germany, Italy and the United Kingdom) in 2013 [31]. The choice of these three nations depends on
the fact that they represent 47% of the overall WEEE market in Europe. Subsequently, WEEE collected
from households (about 87% in EU-28) are considered because of the lack of data within Eurostat
about Italy and its total amount of single WEEE categories.
Figure 1. A summarizing view of the structure of the paper.
Starting from a detailed state of the art analysis, the paper assesses the existing literature gaps,focusing on lacks related to the available economic models. This way, a new economic model is definedtrying to fill in some of these gaps. Subsequently, the results obtained are assessed through a sensitivityanalysis. In order to add value to the paper, a set of the most relevant nations in terms of e-wastegeneration are compared and an estimation of future trends is implemented.
3.1. WEEE Volumes
The entire work starts from the overall amount of WEEE collected in three European countries(Germany, Italy and the United Kingdom) in 2013 [31]. The choice of these three nations depends onthe fact that they represent 47% of the overall WEEE market in Europe. Subsequently, WEEE collected

Sustainability 2016, 8, 633 4 of 19
from households (about 87% in EU-28) are considered because of the lack of data within Eurostat aboutItaly and its total amount of single WEEE categories.
This lack of data is due to a different way of classification followed by Italy. According to theItalian legislation, WEEE is classified as follows: heaters and refrigerators (R1), large householdappliances (R2), TV and monitors (R3), small household appliances (R4) and lighting equipment(R5) [32]. Instead, other European countries divide WEEE into ten categories (Cat#), by following theWEEE Directive classification guideline. Among these ten groups, only four are selected because oftheir relevance (about 95% in EU-28) on the overall amount of WEEE volumes.
Considering the European classification the following groups are taken into account:
‚ Cat1 WEEE represents big household appliances (e.g., fridges, washing machines andair conditioners);
‚ Cat2 WEEE considers small household appliances (e.g., vacuum cleaners, toasters and fryers);‚ Cat3 WEEE represents IT and telecommunication equipment (e.g., PCs, tablets, notebooks
and smartphones);‚ Cat4 WEEE considers consumer equipment (e.g., TVs, monitors, stereos and cameras).
Table 1 reports data about WEEE annual collected volumes in EU-28.
Table 1. European WEEE collected volumes in 2013 (tons)–Source: [31].
Germany Italy The United Kingdom EU-28
Total (tons) 727,998 437,091 492,490 3,513,906Collected from hh (tons) 616,852 209,173 474,711 3,056,843Collected from hh/Total 85% 48% 96% 87%
Cat1 from hh (tons) 248,618 107,305 255,406 1,550,546Cat2 from hh (tons) 76,331 6834 33,361 243,802Cat3 from hh (tons) 116,681 32,342 133,119 518,454Cat4 from hh (tons) 132,931 58,610 33,325 594,420
ř
(Cat1 + Cat2 + Cat + Cat4) (tons) 574,561 205,091 455,211 2,907,222ř
(Cat1 + Cat2 + Cat + Cat4)/Tot hh 93% 98% 96% 95%
hh = household.
3.2. WPCB Recycling Process
A PCB recycling process can be described as the sum of three macro phases that, starting fromwaste PCBs, are able to recover a set of (almost pure) raw materials. These phases can be distinguishedas follows: disassembly, treatment and refining [19,33]—Figure 2.
During disassembly, hazardous components (e.g., condensers or batteries containing dangerousmaterials) are disassembled from the main board and destined to specific treatment plants.During treatment, PCBs are crushed in micro pieces up to become a uniform powder through severaltechnologies (e.g., shredders and grinders). Then, powders are separated in metal and non-metalones by exploiting different physical principles (e.g., density, magnetism and weight). Finally, metalpowders are refined through the available technologies (e.g., pyrometallurgy, hydrometallurgy, or amix of them) up to becoming almost pure secondary materials [16,34]. Generally, pyrometallurgyis used for its wide application range and high level of efficiency. In contrast, hydrometallurgy ispreferred when high purity products are needed and emissions have to be limited [28].
Considering this paper, the refining process taken into account is the hydrometallurgical one.However, the same economic principles can be used to also assess other refining methods, withouttwisting the overall value of the work. Hydrometallurgy is the optimal choice to implement field andmobile plants, given both its high sustainability level in comparison to other metal refining methodsand the flexibility level of related plants [35–37].
The mobile structure presents a limited capacity but can be easily transferred from one site toanother. In contrast, the field one presents a greater capacity and can be used to manage higher

Sustainability 2016, 8, 633 5 of 19
volumes. Figure 2 reports a sequence of flows characterizing a PCB recovery process. Qw + Qe areflows of PCBs and cases in which they are embedded. Qw are flows of PCBs entering the recoveryprocess. Qend are flows of cases leaving the process and Qhwd are flows of hazardous componentsdirected to dedicated recovery plants. Q(lmpp) are flows of powders lost during the shredding process.QP-rmat are flows of powders after shredding. QP-rnm are flows of nonmetal powders ending intolandfills. QP-rmbr are flows of metal powders entering the refining process. After refining, QP-hrm arevaluable metals and QP-srm are low value metals, both destined to be sold in the secondary materialmarket. Q(lmrp) are materials lost during chemical reactions.
Sustainability 2016, 8, 633 5 of 19
Qend are flows of cases leaving the process and Qhwd are flows of hazardous components directed to
dedicated recovery plants. Q(lmpp) are flows of powders lost during the shredding process. QP-rmat are
flows of powders after shredding. QP-rnm are flows of nonmetal powders ending into landfills. QP-rmbr
are flows of metal powders entering the refining process. After refining, QP-hrm are valuable metals
and QP-srm are low value metals, both destined to be sold in the secondary material market. Q(lmrp) are
materials lost during chemical reactions.
Figure 2. A typical printed circuit board recovery process.
Two kinds of plants (based on the same constructive philosophy) are taken into account: a
mobile and a field one. Their hourly productivity (ph) is set in 0.125 tons/h and 0.3 tons/h (for mobile
and field plants, respectively) [25,30]:
QW = ph × nh × nd. (1)
Furthermore, by considering a working period (nd) of 240 days and eight working hours per day
(nh). According to Equation (1), the plant sizes (Qw) are:
240 tons of powders/year (mobile plant);
576 tons of powders/year (field plant).
3.3. Economic Model
Discounted Cash Flow (DCF) is a well-known economic assessment method estimating the
attractiveness of an investment opportunity and several economic indexes can be selected, as NPV
and DPBT:
NPV is defined as the sum of present values of individual cash flows;
DPBT represents the number of years needed to balance cumulative discounted cash flows and
the initial investment.
NPV does not consider the size of the plant. For this reason, the ratio between NPV and size of
the recycling plant is proposed within this paper. A summary of the main formulas constituting the
original model [17] are reported below:
NPV = ∑ (It − Ot)/(1 + r)tnt = 0 (2)
Figure 2. A typical printed circuit board recovery process.
Two kinds of plants (based on the same constructive philosophy) are taken into account: a mobileand a field one. Their hourly productivity (ph) is set in 0.125 tons/h and 0.3 tons/h (for mobile andfield plants, respectively) [25,30]:
Qw “ phˆnhˆnd (1)
Furthermore, by considering a working period (nd) of 240 days and eight working hours per day(nh). According to Equation (1), the plant sizes (Qw) are:
‚ 240 tons of powders/year (mobile plant);‚ 576 tons of powders/year (field plant).
3.3. Economic Model
Discounted Cash Flow (DCF) is a well-known economic assessment method estimating theattractiveness of an investment opportunity and several economic indexes can be selected, as NPVand DPBT:
‚ NPV is defined as the sum of present values of individual cash flows;‚ DPBT represents the number of years needed to balance cumulative discounted cash flows and
the initial investment.
NPV does not consider the size of the plant. For this reason, the ratio between NPV and size ofthe recycling plant is proposed within this paper. A summary of the main formulas constituting theoriginal model [17] are reported below:
NPV “ÿn
t“ 0pIt ´Otq{p1` rqt (2)

Sustainability 2016, 8, 633 6 of 19
ÿDPBT
t“ 0pIt ´Otq{p1` rqt “ 0 (3)
NPV{Size “ NPV{QW (4)
It “ÿnrm
j “ 1QP´srm,j ˆ plrm ˆ prrm,j,t, @t “ 1 . . . n (5)
C2˝sinv “ Cu,2˝s
inv ˆQW (6)
C2˝slcs,t “ C2˝s
inv{ndebt, @t “ 0 . . . ndebt ´ 1 (7)
C2˝slis,t “
´
C2˝sinv ´C2˝s
lcs,t
¯
ˆ rd, @t “ 0 . . . ndebt ´ 1 (8)
C3˝sinv “ Cu,3˝s
inv ˆQP´rmbr (9)
C3˝slcs,t “ C3˝s
inv{ndebt, @t “ 0 . . . ndebt ´ 1 (10)
C3˝slis,t “
´
C3˝sinv ´C3˝s
lcs,t
¯
ˆ rd, @t “ 0 . . . ndebt ´ 1 (11)
0t “ C2˝slcs,t `C2˝s
lis,t `C3˝slcs,t `C3˝s
lcs,t `Cua˚QW `Cu
l ˆ nd ˆ n1˝sop `Cu
d ˆQhwd`
Cucm ˆQP´rnm `Cu
e ˆ pe2˝su {phq ˆQW ` pi ˆC2˝s
inv `Cul ˆ nd ˆ n2˝s
op ` p2˝sm ˆC2˝s
inv`
C3˝scm,t ˆQP´hrm `Cu
e ˆ e3˝su ˆQP´rmbr ` pi ˆC3˝s
inv `Cul ˆ nd ˆ n3˝s
op ` p3˝sm ˆC3˝s
inv`
C3˝srem,t ˆ p1` infq `Cu
tr ˆ pQW `Qeq ˆ dtf ` ebtt ˆCutax, @t “ 1 . . . n
(12)
Ct`1 “ Ct ˆ p1` infq , @t “ 1 . . . n (13)
Within Equations (2)–(13), the 1˝s apex identifies “disassembly”, the 2˝s apex identifies“treatment”, and the 3˝s apex identifies “refinement”—Table 2.
Table 2. Technical-economic nomenclature.
Acronym Variable Acronym Variable
Ca: Acquisition cost of WPCBs nop: Number of operatorsCu
a : Unitary acquisition cost of WPCB nrm: Number of recycled metalsCu
cm: Unitary conferred material cost nnrm: Number of non-recycled metalsCu
d: Unitary disposal cost NPV: Net present valueCu
e : Unitary electric power cost NPV/Size: Ratio between NPV and sizeCinv: Investment cost Ot: Discounted cash outflowsCu
inv: Unitary investment cost pe: % of envelopeCu
l : Unitary labour cost ped: % of “dangerous” envelopeClcs: Loan capital share cost ph: Hourly productivityClis: Loan interest share cost pi: % of insurance costCu
rem: Unitary reactant materials cost pm: % of maintenance costCt: Cost in period t prm,j: % of metal j in 1 kg of WPCBCu
tax: Unitary taxes prnm: % of not metals in recycled materialsCu
tr: Unitary transportation cost of the plant plrm: Purity level of recycled metaldtf: Distances of transportation of the plant prrm: Price of recycled metalDPBT: Discounted payback time Qe: Quantity of envelopeebt: Earnings before taxes QP´hrm: Quantity of hazardous recycled Metaleu: Energy power Qhwd: Quantity of hazardous wasteIt: Discounted cash inflows QP-rmbr: Quantity of powders (before refinement)inf: Rate of inflation QP-rnm: Quantity of powders (recycled non- metals)lmpp: Lost materials in treatment process QP-srm,j: Quantity of powders (selling recycled metal j)lmrp: Lost materials in refinement process QW: Quantity of WPCBsn: Lifetime of investment r: Opportunity costnd: Number of days rd: Interest rate on loanndebt: Period of loan t: Time of the cash flownh: Number of hours
The profitability of a recycling plant is hugely influenced by two main variables: (i) the set ofmaterials embedded in WPCBs (available from the literature); and (ii) the plant capacity [17].

Sustainability 2016, 8, 633 7 of 19
For this reason, the total number of sets of selected scenarios evaluated within the paper areeight, or the combination of four WPCB groups (Cat1, Cat2, Cat3 and Cat4 WPCBs)—as defined inTable 1—and two plant sizes (240 tons/year and 576 tons/year), as defined before. Finally, potentialrevenues coming from materials recovered by cases embedding PCBs (Qend) are not considered withinthis paper.
3.4. Economic and Technical Inputs
Table 3 reports data about economic and technical inputs of the model and Table 4 reports theinitial assumptions about the materials concentration taken directly from the literature [33]. Input datashow that a mobile plant investment cost is estimated in about k€ 639, while a field plant is assumedto be about k€ 1533 [25,27,30,38]. Economy of scale is the main cause of this difference, quantified inabout 29%.
Table 3. Economic and technical inputs.
Variable Value Reference Variable Value Reference
Cua 1195 €/ton [25] nh 8 h [30]
Cucm 90 €/ton [41] n1˝s
op 1 i´2 ii [26]Cu
d 325 €/ton [25] n2˝sop 2 i´3 ii [25]
Cue 0.11 €/kWh [25] n3˝s
op 2 i´3 ii [25]Cu,2˝s
inv 646 ii´913 i €/ton [25,30] nrm Table 4 [33]Cu,3˝s
inv 2740 ii´3860 i €/ton [27,38] nhrm Table 4 [33]Cu
l 150 €/day [42] nrnm Table 4 [33]Cu
rem 830 €/ton [38] pe 70% [17]Cu
tax 36% [38] ped 5% [17]Cu
tr 0.34 €/(km¨ ton) [43] ph 0.125 i´0.3 ii ton/h [25,30]e2˝s
u 50 i´141 ii kW [25] pi 2% [41]e3˝s
u 3.9 i´9.5 ii MWh/ton [38] p2˝sm 25% [44]
dtf 0 ii´200 i km [38] p3˝sm 5% [27]
inf 2% [41] prnm Table 4 [33]lmpp 20% [33] prm Table 4 [33]lmrp 5% [33] plrm 95% [33]
n 5 i´10 ii year [30] prrm Table 5 [39,40]nd 240 day [30] R 5% [41]
ndebt 5 year [41] rd 4% [41]
i = Mobile plant; ii = Field plant.
Table 4. Characterization of materials embedded in printed circuit boards (percentages)—[33].
Cat1 WPCBs Cat2 WPCBs Cat3 WPCBs Cat4 WPCBs
Selling materials (prm-nrm)Iron (Fe) 15.45 12 14.1 6.93
Copper (Cu) 13 11 20 17.25Aluminium (Al) 7.65 8.6 3.38 10.05
Tin (Sn) 1.49 2.7 0.69 0.73Zinc (Zn) 1.94 1.4 1.35 1.17
Silver (Ag) 0.01 0.02 0.17 0.08Gold (Au) * 0.003 0.002 0.04 0.01
Palladium (Pd) 0.003 0.001 0.01 0.002Beryllium (Be) 0 0 0.002 0Bismuth (Bi) 0 0 0.02 0.03
Chromium (Cr) 0.02 0.02 0.54 0.02

Sustainability 2016, 8, 633 8 of 19
Table 4. Cont.
Cat1 WPCBs Cat2 WPCBs Cat3 WPCBs Cat4 WPCBs
Hazardous metals (prm-nhrm)Antimony (Sb) 0.08 0.06 0.13 0.16
Arsenic (As) 0 0 0.0005 0Bromine (Br) 0.16 0.01 0.82 0.39
Cadmium (Cd) 0 0 0.000001 0Chlorine (Cl) 0.2 0.43 0.01 0.31
Lead (Pb) 1.25 3 0.79 1.09Nickel (Ni) 0.07 0.11 1.13 0.26
Conferred materials (prnm-nrnm)Plastics 41.5 46 30.2 25Epoxy 8.5 16 0.92 14.75
Ceramics 7 0 15.02 13.6Glass 0 0 2 0
Others 2.2 0 8.38 8.5Liquid crystals 0 0 0.16 0
* 0.003% of gold is equal to 30 ppm, or 30 g of gold in 1 ton of WPCBs.
Table 5. Materials market prices—[39,40].
nrm prrm (€/kg) prrm (€/kg) min-max Notes
Copper (Cu) 4.8 3.9–5.7 Since July, continuously under 5 €/kgSilver (Ag) 440 390–510 Since July, within the 400/450 €/kg rangeZinc (Zn) 1.7 1.3–2.3 Since August, under 1.8 €/kgTin (Sn) 14 12–17 Since March, under 16 €/kg
Beryllium (Be) 850 n.d. No commodity markets setting this priceChromium (Cr) 1.9 1.6–2.3 Since April, under 2 €/kg
Iron (Fe) 0.05 0.038–0.056 Since September, under 0.05 €/kgPalladium (Pd) 18,000 13,900–24,500 Until May, over 22,000 €/kgAluminium (Al) 1.5 1.3–1.7 Since May, under 1.6 €/kg
Bismuth (Bi) 11.4 8.2–17.4 Negative trendGold (Au) 33,300 31,200–36,600 Since May, under 35,000; Positive trend
The recovered materials evaluation occurs in function of historical trends of market prices, withina defined time-period. By taking into account the February 2015–February 2016 timeframe as areference, monthly observations were gathered from the most relevant websites focused on rawmaterials exchanges [39,40] Table 5.
After having defined the economic model structure (and related input values), all of the financialindexes useful to assess the investment are estimated in Section 4.
4. Results
Waste recycling processes represent not only an environmental protection action, but also aneconomic opportunity. Here, it is possible to identify the business plan required to define theinvestment’s profitability. Table 6 presents some examples.
Table 6. Business plans for mobile plants.
Business Plan-Cat3 WPCBs (k€) Business Plan–Cat4 WPCBs (k€)
Year 0 1 2 3 4 5 0 1 2 3 4 5It (Fe) 0 1 1 1 1 1 0 1 1 1 1 1It (Cu) 0 170 170 170 170 170 0 145 145 145 145 145It (Ag) 0 133 133 133 133 133 0 59 59 59 59 59It (Au) 0 2450 2450 2450 2450 2450 0 493 493 493 493 493It (Pd) 0 447 447 447 447 447 0 73 73 73 73 73It (Al) 0 9 9 9 9 9 0 26 26 26 26 26It (Be) 0 3 3 3 3 3 0 0 0 0 0 0

Sustainability 2016, 8, 633 9 of 19
Table 6. Cont.
Business Plan-Cat3 WPCBs (k€) Business Plan–Cat4 WPCBs (k€)
It (Bi) 0 0 0 0 0 0 0 0 0 0 0 0It (Cr) 0 2 2 2 2 2 0 0 0 0 0 0It (Sn) 0 17 17 17 17 17 0 18 18 18 18 18It (Zn) 0 4 4 4 4 4 0 3 3 3 3 3
It 0 3236 3236 3236 3236 3236 0 819 819 819 819 819C1˝s
a,t 0 293 298 304 310 317 0 293 298 304 310 317C1˝s
l,t 0 37 37 38 39 40 0 37 37 38 39 40C1˝s
d,t 0 9 9 10 10 10 0 9 9 10 10 10C2˝s
lcs,t 44 44 44 44 44 0 44 44 44 44 44 0C2˝s
lis,t 7 5 4 2 0 0 7 5 4 2 0 0C2˝s
cm,t 0 10 10 10 11 11 0 11 11 11 12 12C2˝s
e,t 0 11 11 11 11 12 0 11 11 11 11 12C2˝s
i,t 0 4 4 4 4 4 0 4 4 4 4 4C2˝s
l,t 0 73 75 76 78 79 0 73 75 76 78 79C2˝s
m,t 0 56 57 58 59 60 0 56 57 58 59 60C3˝s
lcs,t 64 64 64 64 64 0 57 57 57 57 57 0C3˝s
lis,t 10 8 5 3 0 0 9 7 5 2 0 0C3˝s
d,t 0 2 2 2 2 2 0 1 1 1 1 1C3˝s
m,t 0 16 17 17 17 18 0 14 15 15 15 16C3˝s
i,t 0 7 7 7 7 7 0 6 6 6 6 6C3˝s
l,t 0 73 75 76 78 79 0 73 75 76 78 79C3˝s
rem,t 0 70 72 73 75 76 0 62 63 65 66 67C3˝s
e,t 0 36 37 38 39 39 0 32 33 33 34 35Ctr,t 0 55 57 58 59 60 0 55 57 58 59 60Ctax,t 0 850 846 842 838 872 0 ´12 ´15 ´19 ´23 7
Ot 125 1725 1731 1738 1746 1687 116 839 846 853 860 806It-Ot ´125 1511 1505 1498 1490 1549 ´116 ´21 ´27 ´34 ´42 13DCF ´125 1439 1365 1294 1226 1214 ´116 ´20 ´25 ´30 ´34 10ř
DCF ´125 1314 2679 3973 5199 6413 ´116 ´136 ´161 ´191 ´225 ´215
As already presented in Section 3, eight scenarios are analysed within this work, and it is clearthat the financial feasibility is verified only for two categories of WPCBs (Table 7).
Table 7. Economic indexes—baseline scenarios.
Index Cat1 WPCBs Cat2 WPCBs Cat3 WPCBs Cat4 WPCBs
Mobile plant (240 tons of powders/year)DPBT (year) >5 >5 1 >5
NPV (k€) ´1389 ´1521 6413 ´215NPV/QW (€/ton) ´5788 ´6338 26,721 ´896
Field plant (576 tons of powders/year)DPBT (year) >10 >10 1 2
NPV (k€) ´4252 ´4812 29,140 778NPV/QW (€/ton) ´7382 ´8354 50,590 1351
Going into detail, positive results come from both Cat3 WPCBs (NPV equal to k€ 29,140 andk€ 6413 in field and mobile plants, respectively), and Cat4 WPCBs, but only for field plants (NPV equalto k€ 1351). DPBT follows NPV values, and it is equal to one year for Cat3 WPCBs and two years forCat4 WPCBs. This means that cash flows allow recovery of the investments already during the initialperiod of activity. Field plants present a longer lifecycle than mobile plants (10 years out of five years).This aspect, starting from equal gross profits, explains the greater NPV (both in positive and negativeterms). However, as explained in other papers [25,45], mobile facilities can represent an ideal solutionfor small countries or cities, where volumes are limited.

Sustainability 2016, 8, 633 10 of 19
The obtained results confirm that the profitability is not always verified (see Section 2).Furthermore, in comparison to the automotive sector, values coming from WEEE are lower, giventheir limited gold amount (900–4200 ppm in the automotive PCBs [46], 20–400 ppm in WEEE PCBs).However, DPBT is confirmed by this study. About the gold relevance among revenue items, datashowed in Table 8 are significant (equal for both the plant configurations). 415 ppm of gold areestimated for Cat3 WPCBs (max value, accounting for 72% of revenues), and 20 ppm of goldare estimated in Cat2 WPCBS (min value, accounting for 32% of revenues) representing the mainprofitability items.
Table 8. Plant revenue distribution (percentages).
Index Cat1 WPCBs Cat2 WPCBs Cat3 WPCBs Cat4 WPCBs
Gold (Au) 37 32 72 60Copper (Cu) 26 26 5 18
Palladium (Pd) 20 11 17 9Tin (Sn) 9 18 1 2
Silver (Ag) 2 5 4 7Other metals 6 8 1 4
Among other materials, particularly interesting is the influence of palladium (with a high marketprice), and copper (present in a high percentage).
The cost distribution analysis shows that operational costs are equal to 94% of the overall costsfor a field plant and 87% for a mobile one (Table 9). These results are coherent to what proposed byother works [17,27].
Table 9. Plant cost distribution (percentages)—average values.
Index Field Plant Mobile Plant
Acquisition 42 34Labour 18 21Energy 14 5
Reactant materials 9 8Maintenance 7 8Investment 6 13Transport 0 7
Other items 4 4
The most relevant cost item is represented by WPCB purchasing, for both field and mobile plants(42% and 34%, respectively). This value is followed by labour costs (18% and 21%, respectively).Finally, transportation costs are equal to 6.5% in a mobile plant.
Given the structure of the presented economic model (see Section 3.3), it is easily possible toextend the analysis to other case studies. In order to strengthen the obtained results, a sensitivityanalysis comparing alternative scenarios is implemented in the next section.
5. Sensitivity Analysis
The obtained results are related to hypotheses on input variables. Hence, a strong variance of theexpected economic profitability could occur. This limit can be overtaken by implementing a sensitivityanalysis on the following critical variables [19] (Tables 10 and 11):
‚ The material content, as a percentage of a WPCB total weight for all the four categories.This variable is already analysed and four WPCB categories are evaluated within this paper.
‚ The materials market price is evaluated for three materials that, more than others, impact revenues(see Table 8), or gold, palladium and copper. Pessimistic and optimistic scenarios are analysed,by increasing (or decreasing) the initial price by its extreme values (31,200–36,600 €/kg for gold,13,900–24,500 €/kg for palladium and 3.9–5.7 €/kg for copper respectively).

Sustainability 2016, 8, 633 11 of 19
‚ The final purity level is applied only to gold due to its high relevance on revenues. Four pessimisticscenarios are analysed, with purity levels decreased within the range 60%–90% in comparison tothe initial value of 95%.
‚ The WPCB purchasing cost, representing the main cost item (see Table 9). Pessimistic andoptimistic scenarios are assessed, with cost variations between 1000 €/ton up to 1400 €/ton (or anoffset of about 200 €/ton from the baseline scenario);
‚ The plant saturation, in which a lower amount of WPCBs in input represents a lower hourlyproductivity. To this aim, five pessimistic scenarios are assessed, with saturation levels going from50% up to 90%. For example, by considering a mobile plant, 90% of 240 tons per hour is equalto 216 tons per hour. Instead, by considering a field plant, 90% of 576 tons per hour is equal to518 tons per hour;
‚ The opportunity cost, able to evaluate the money value in different periods. Even in this case,an optimistic and pessimistic scenarios are assessed, with values varying from 4% up to 6%;
These values confirm that, sometimes, the profitability is not verified. In particular, field plantstreating Cat4 WPCBs become unprofitable when the gold purity level falls to 80%, or when thesaturation level reaches 60%. More in general:
‚ NPV is always negative with mobile and field plants treating Cat1 and Cat2 WPCBs;‚ NPV is always positive with mobile and field plants treating Cat3 WPCBs;‚ NPV is always negative with mobile plants treating Cat4 WPCBs and almost positive with field
plants (14 scenarios out of 19).
Higher values of NPV can be reached in both the plant configurations when the saturation levelreaches 50% for WPCBs pertaining to Cat1 and Cat2 groups (k€ ´959 and k€ ´1025 , respectively,for the mobile plant, k€ ´2914 and k€ ´3195, respectively, for the field plant), when the gold marketprice reaches 36,600 €/kg for WPCBs pertaining to Cat3 group (k€ 7085 and k€ 32,019 respectivelyfor mobile and field plants) and when the WPCB purchasing cost reaches 1000 €/ton for Cat4 group(k€ ´78 and k€ 1393, respectively, for mobile and field plants).
Table 10. Sensitivity analysis—net present value (k€) in field plants.
Variable Value Cat1 WPCBs Cat2 WPCBs Cat3 WPCBs Cat4 WPCBs
prAu (€/kg) 36,600 ´4076 ´4680 32,019 135731,200 ´4364 ´4896 27,307 410
prPd (€/kg) 24,500 ´3966 ´4675 30,748 104113,900 ´4498 ´4930 27,757 552
prCu (€/kg) 5.7 ´4012 ´4613 29,518 11003.9 ´4491 ´5011 28,762 456
plAu (%)
90 ´4345 ´4882 27,610 47180 ´4532 ´5023 24,552 ´14470 ´4718 ´5164 21,493 ´75960 ´4905 ´5305 18,434 ´1374
Cua (€/t)
1000 ´3637 ´4197 29,755 13931400 ´4898 ´5459 28,493 131
QW (t)
518 ´3982 ´4486 26,047 541461 ´3718 ´4166 23,007 308403 ´3448 ´3840 19,914 71346 ´3184 ´3520 16,874 ´162288 ´2914 ´3195 13,781 ´400
r (%)4 ´4458 ´5047 30,617 8256 ´4060 ´4594 27,767 734

Sustainability 2016, 8, 633 12 of 19
Table 11. Sensitivity analysis—net present value (k€) in mobile plants.
Variable Value Cat1 WPCBs Cat2 WPCBs Cat3 WPCBs Cat4 WPCBs
prAu (€/kg) 36,600 ´1348 ´1490 7085 ´8031,200 ´1415 ´1541 5985 ´301
prPd (€/kg) 24,500 ´1322 ´1489 6789 ´15313,900 ´1447 ´1548 6090 ´268
prCu (€/kg) 5.7 ´1333 ´1474 6501 ´1403.9 ´1445 ´1567 6324 ´290
plAu (%)
90 ´1448 ´1571 5941 ´33480 ´1567 ´1672 4997 ´57370 ´1685 ´1774 4054 ´81260 ´1804 ´1875 3110 ´1050
Cua (€/t)
1000 ´1252 ´1384 6550 ´781400 ´1534 ´1665 6268 ´359
QW (t)
216 ´1303 ´1422 5719 ´246192 ´1217 ´1322 5025 ´278168 ´1131 ´1223 4330 ´309144 ´1045 ´1124 3636 ´340120 ´959 ´1025 2942 ´372
r (%)4 ´1425 ´1560 6598 ´2176 ´1355 ´1483 6235 ´213
Lower values of NPV can occur in mobile plants when the gold purity level reaches 60% forWPCBs pertaining to Cat1, Cat2 and Cat4 groups (k€´1804, k€´1875 and k€´1050, respectively), andwith a saturation level of 50% for WPCBs pertaining to Cat3 (k€ 2942 ). Instead, lower values of NPVare present in field plants with gold purity level of about 60% for Cat1 and Cat4 WPCBs (k€ ´4905and k€ ´1374, respectively), when the WPCB purchasing cost reaches 1400 €/ton for Cat2 WPCBs(k€ ´5459) and with a saturation level of 50% for Cat3 WPCBs (k€ 13,781).
The sensitivity analysis allows for analysis of several alternative scenarios, in which decisionmakers can evaluate different NPV values. No probabilities are assigned to each scenario, but realchanges concerning the following critical variables are considered:
‚ Secondary materials market price can be subjected to great oscillations (see trends proposed inTable 5) reaching maximum variations for precious metals (e.g., gold and palladium).
‚ Gold purity level could fall due to low performing technologies. In fact, the selection of therecycling process is connected to multiple parameters and technological solutions are able tofavour environmental or economic performances or both [47,48].
‚ WPCB purchasing costs can differ because of the different material composition of cores. This issueis not well analysed in the literature [16,49]. In particular, this cost can be influenced by severalaspects such as: (i) supply chain dimension (short or long ones); (ii) type of PCBs (low, medium orhigh grade ones); and (iii) PCB volumes.
‚ Plant saturation level is strictly linked to the historical productive capacity and the actualworking hours. However, a key role is played by the difference between generated and collectedvolumes [15,50]. They depend by four aspects: (i) illegal flows; (ii) no attention of citizens towardsenvironmental problems; (iii) absence of regulations; and (iv) inadequate number (or location) ofcollection centres.
‚ Opportunity cost of capital can change because of either the effect of macro-economic conditionsrelated to the specific nation or the nature of investors (private or public capitals) [44].
This section proposed a more complete overview on profitability coming from mono-core plants.The subsequent section offers an assessment on the economic impact related to the recovery of thesewastes in three main European WEEE markets.

Sustainability 2016, 8, 633 13 of 19
6. Assessment of National Economic Potentials and European Future Trends
The development of the recycling sector concerns all the European countries. A significant amountof potential secondary raw materials is currently lost and the application of EoL strategies acceleratedthe transition towards a circular economy.
6.1. Economic Potential of the German, Italian and English WEEE Markets
This section evaluates the economic potential coming from the recovery of WPCBs embedded inWEEE collected from households in Germany, Italy and the United Kingdom.
Potential values are obtained by multiplying the economic value proposed in Table 7 and therelated volumes estimated in 2013. Starting from WEEE volumes from households presented in Table 1,WPCB volumes are calculated. To this aim, the fractional weight of WPCBs (out of the overall WEEEweight) are defined. Estimated values are 0.4%, 0.5%, 13% and 11% for Cat1, Cat2, Cat3 and Cat4WPCBs, respectively [33].
Table 12 proposes total NPV for both the types of plants and the three countries in 2013.For example, total NPV for Germany is equal to about € 777 million by considering only field plants.This value can be calculated as follows: 0.4% ˆ 248,618 ˆ (´7382) + 0.5% ˆ 76,331 ˆ (´8354) +13% ˆ 116,681 ˆ (50,590) + 11% ˆ 132,931 ˆ (1351) = k€ 776,601.
Table 12. Total NPV (k€) in three European countries in 2013.
Countries Field Plant Mobile Plant
Germany 776,601 384,042Italy 217,959 103,870
The United Kingdom 871,505 452,163EU-28 3,442,084 1,698,762
The profitability is always verified and it depends on both the presence of Cat3 WPCBs (49% inGermany, 38% in Italy, 78% in the United Kingdom and 48% in EU-28) and the quasi-absence of Cat1and Cat2 WPCBs within the related fractional mix (varying from 4% up to 6%).
The European economic potential related to the recovery of WPCBs embedded in WEEE collectedfrom households is estimated in € 3442 million in a scenario with only field plants and € 1699 millionin a scenario with only mobile ones.
The United Kingdom and Germany present relevant results and they represent almost 48% ofthe overall European economic values. In contrast, Italy–even if constituting one of the main nationsgenerating WEEE in Europe (see Table 1)—has very low volumes because of the different classificationsfollowed by its government. This way, a direct comparison with performances reached by other nationshas low/no sense.
Furthermore, the selection between mobile and field plants is related to each nation.Given national WEEE volumes, WEEE mix and population density estimates within a particularterritory, an evaluation about the best type of plant to be constructed is possible. Generally, mobileplants are preferred when population density (and related WEEE volumes) are low. This way, thechance to transfer the plant into different sites allows to reach a higher saturation level and to take intoaccount different WEEE mixes. When population density (and related WEEE volumes) increases, theselection of a field plant is preferable. This way, the economy of scale allows a better distribution ofcosts and enables a faster recovery of the initial investment. However, these considerations are onlytheoretical and great relevance is associated to WEEE collection trends. These results must be verifiedwith optimization models (both economic and environmental ones) in future research.

Sustainability 2016, 8, 633 14 of 19
6.2. Future Trends in the European WEEE Market
An estimate of the potential dimension of the WEEE PCB recycling market in the near future isa useful tool for decision makers. To that aim, the overall amount of expected WEEE collected fromhouseholds from 2015 up to 2030 can be predicted.
Within Eurostat, 2013 is the most updated year, presenting data for Europe; 2015 is the currentyear; and 2020 and 2030 are the years taken into account by Europe as reference targets. Growth ratesare hypothesized to be equal to 3% per year [19], equally increasing for each of the four WPCBcategories [17]. Table 12 proposes the expected profits coming from the correct management ofthese amounts of WPCBs. Minimum and maximum values are associated to mobile and fieldplants, respectively.
The estimated PCB volumes are obtained by considering that WPCB weights impact about 5%(on average) of the overall weight of a generic WEEE (Table 1—[33]). Considering an amount of WEEEequal to 2,907,222 tons in the EU-28 (see Table 1) for the only Cat1, Cat2, Cat3 and Cat4 categories, it ispossible to define the quantity of related WPCBs, estimated to be equal to 145,361 tons.
By considering the European average mix, mobile and field plant values are equal to € 11,686 perton (obtained by dividing k€ 1,698,762 and 145,361 tons) and € 23,680 per ton (obtained by dividingk€ 3,442,084 and 145,361 tons). These values refers to 2013. Total WPCB expected NPV is equal to€ 1895 million in 2015 for mobile plants (obtained by multiplying 11,686 € per ton and 162 ktons).
Furthermore, it is important to clarify that Table 12 values refers to the first four WEEE categories(out of ten). Instead, Table 13 refers to the overall volumes coming from all of the ten WEEE categoriestogether and considering the percentage mix of EU-28.
Table 13. Estimates of collected WPCB volumes and profits in 28 European countries from WEEEcollected from households.
2013 2015 2020 2030
WEEE expected annual collection (ktons) 3057 3243 3760 5052WPCB expected annual collection (ktons) 153 162 188 253
Total WPCB expected NPV–min values (M€) 1786 1895 2197 2952Total WPCB expected NPV–max values (M€) 3619 3840 4451 5982
Estimates on profits in 28 European countries from WEEE PCB recycling are relevant, going from€ 1.79 billion to € 3.62 billion in 2013. Future trends define € 2.95 billion as minimum value and € 5.98billion as maximum value in 2030. This difference depends on the development level of field and/ormobile plants.
In addition, 2013 data are directly dependent from Eurostat data and can give an immediate ideaof the current dimension of the sector. In contrast, 2030 data are only an estimate, but they allow forcomprehension of how the situation could evolve with the current expected trends. Obviously, thesevalues will depend from the mix of mobile and field plants that will be implemented during the nextyears. However, quantitative data about the probability of implementation of these two kinds of plantsis information absent in the literature.
Finally, these values demonstrate once again that the development of a circular economy basedon the exploitation of both critical materials and resources recovered from WEEE is important andcould offer interesting revenuesto industrial companies.
7. Discussion
The previous Sections 4–6 represent the core part of the paper and they proceed to assess the threemain objectives of the paper. Information gathered from these previous sections allow for respondingto the three main targets listed in Section 1, as follows:

Sustainability 2016, 8, 633 15 of 19
‚ The profitability assessment of PCB recovery processes;‚ The evaluation of alternative scenarios through a sensitivity analysis;‚ The estimation of future profitability trends in three selected European nations.
Considering the first point, NPV and DPBT values reported in Table 7 show that positive resultsare related especially to the chance to recover only some specific types of WEEE, in particular Cat3and Cat4. These two groups allow for recovery of high amounts of critical and precious materials andguarantee interesting revenues (at least in theory) shortening the payback time.
In addition, the use of mobile or field plants does not influence the most remunerable types ofWEEE to be treated. The decision to use one or the other is only a question of potentially manageablevolumes. One point favouring mobile plants is that they could enable several small medium enterprisesto work together, bypassing bigger recyclers and secondary materials processes. This way, they canreach the quantities of recovered materials needed to compete in the market, whilst minimizing theinvestments needed.
The presented results are in line with the ones described by the experts within the scientificliterature [25,35,37,45]. However, it is important to point out that a direct comparison with the resultscoming from the literature is not possible due to two reasons. First, the literature generally considersthe recovery of an entire WEEE and not only PCBs. This way, the materials characterization can vary alot. Second, papers describing WEEE consider all ten categories and not only the four categories takeninto account in this paper.
Another element to point out is the comparison between mobile and field plant performance. It isout of the scope of this paper to decide if it is better to use either a mobile or a field plant. The aimof the authors is the only assessment of their economic indexes to support the critical decision aboutwhether to invest in these types of plants.
Considering the second point, the role of several critical variables on the overall economic resultsthat could be reached by the two different plants is clear. Given their lower capacity in comparison withfield plants, mobile plants are more susceptible to strong variations of these variables. This means that,in the case of low WEEE volumes, the plant performance must be very high, exploiting state-of-the-arttechnologies and always trying to saturate the available capacity. Only in this way can companiesimplement mobile recovery plants protect themselves from exogenous oscillations coming from theraw materials market.
Considering the third point, data show as Italy, in comparison with Germany and theUnited Kingdom, needs to do a lot of work to reach the European average regarding WEEE collectedvolumes and improve the overall WEEE recovery chain performance. However, a direct comparison ofItaly and other European countries is not completely possible, given the different WEEE classificationadopted. However, even the comparison between Germany and the United Kingdom offers someinteresting points of discussion.
Even if Germany presents higher WEEE volumes, the United Kingdom—thanks to a higherpresence of Cat3 and Cat4 WEEE in its mix—is the European nation with the highest NPV among thethree countries taken into account. This result has value whatever the type of plant taken into account.Once again, the importance of the national WEEE mix is highlighted.
Another important point related to these two nations is the presence of already establishedsites focused on the recovery of materials, generally owned by multinational companies, likeAurubis (Smethwick, United Kingdom), Umicore (Hoboken, Belgium), SIMS (Stratford-upon Avon,United Kingdom) and Boliden (Stockholm, Sweden). Given their dimensions, these plants, generallybig field ones, are able to take into account relevant quantities of WEEE. This could represent anissue for the implementation of new plants. However, the economic impact given by these alreadyexisting plants is not measurable, given the absence of data in the literature about their physical andeconomic characteristics.

Sustainability 2016, 8, 633 16 of 19
8. Conclusions
Great quantities of WEEE are thrown away worldwide every year. The literature defines WPCBsas the most complex, hazardous, and valuable elements in e-waste. However, the economic evaluationof recovery process of WEEE PCBs is not well analysed. This paper tries to cover this gap.
The profitability of both mobile (240 tons of powders per year) and field plants (576 of powders peryear) considering four WPCB groups (large household appliances (Cat1), small household appliances(Cat2), IT and telecommunications equipment (Cat3) and consumer equipment (Cat4) are evaluated.Three main points can be discussed.
First, the recovery of materials from WEEE PCB recycling processes can be environmentallysustainable, according to the WEEE Directive, while the economic sustainability is verified only forsome categories of WEEE.
In a baseline scenario, NPV is positive in both the plant configurations treating Cat3 WPCBs(equal to k€ 6413 and k€ 29,140 in mobile and field plants, respectively) and in field plants treatingCat4 WPCBs (equal to k€ 778). DPBT confirms this assessment, varying from one to two years inprofitable scenarios.
From the revenue side, gold plays a key role, followed by palladium and copper. From the costsside, there are low investment costs, and the most relevant item is represented by WPCB purchasing.
The evaluation of specific products represents the following step. The material characterization ofPCBs can vary significantly. A solution can be represented by multi-core plants, in which the lowerprofits are balanced by higher saturation levels. As highlighted within this paper, a quantitativeanalysis can support the choice from this side.
Second, the evaluation of alternative scenarios allows for confirmation of the obtained results.From one side, the profitability is guaranteed for Cat3 WPCBs and both the plant configurations andfor Cat4 WPCBs considering field plants in several scenarios. From the other side, NPV is negative forCat1 WPCBs and Cat2 WPCBs in both the plant configurations and for Cat4 WPCBs in mobile plants.
Saturation level, gold market price, WPCB purchasing cost and gold purity level produce themost significant variations in functions of both plant configurations and WEEE categories taken intoaccount. This analysis is a relevant phase in an Engineering Economics framework, and it providesa snapshot that aims to reduce the subjectivity of the initial choice of inputs. However, only valuesdefined in other scientific works are proposed within this paper.
Third, the economic potential related to the recovery of WPCBs embedded into WEEE collectedfrom households in EU-28 is estimated in € 3619 million in a scenario with only field plants and € 1786million in a scenario with only mobile ones in 2013. The United Kingdom and Germany representalmost 48% of these values. Germany has greater WEEE volumes than the United Kingdom, but thislast country presents better economic performance due to the high presence of medium-high gradePCBs within its mix. Future trends concerning the European market show very interesting values andNPV varies from € 2952 million to € 5982 million in 2030.
Materials and metals are present in many energy and material production processes and theirrecoveries play a key role in the development of circular economy. Results obtained in this paperconfirm the advantage in economic terms.
The recycling of WPCBs is an important topic not only in terms of waste treatment but also interms of valuable material recovery. Natural resources are essential and critical components of themodern society. This activity increases the sustainability of a country and policy-makers, and citizensand firms can cooperate in order to make WEEE a resource and not a problem.
Author Contributions: The authors equally gave their contribution to this work. Idiano D’Adamo designed theresearch and analysed the data; Paolo Rosa performed part of the research and wrote the draft paper; Sergio Terziperformed part of the research and finalized writing of the paper.
Conflicts of Interest: The authors declare no conflict of interest.

Sustainability 2016, 8, 633 17 of 19
Abbreviations
Au GoldCu
a Unitary acquisition cost of WPCBCat1 Large household appliancesCat2 Small household appliancesCat3 IT and telecommunications equipmentCat4 Consumer equipmentCu CopperDCF Discounted cash flowDPBT Discounted payback timeEEEs Electrical and electronic equipmentNPV Net present valuePCBs Printed circuit boardsPd PalladiumPlAu Purity level of recycled metal (gold)prrm Price of recycled metal (gold, palladium, copper)QW Quantity of WPCBsr Opportunity costWEEE Waste electrical and electronicWPCBs Waste printed circuit boards
References
1. Barletta, I.; Larborn, J.; Mani, M.; Johannson, B. Towards an Assessment Methodology to Support DecisionMaking for Sustainable Electronic Waste Management Systems: Automatic Sorting Technology. Sustainability2016, 8, 84. [CrossRef]
2. Cucchiella, F.; D’Adamo, I.; Lenny Koh, S.C.; Rosa, P. Recycling of WEEEs: An economic assessment ofpresent and future e-waste streams. Renew. Sustain. Energy Rev. 2015, 51, 263–272. [CrossRef]
3. Zeng, X.; Gong, R.; Chen, W.-Q.; Li, J. Uncovering the Recycling Potential of “New” WEEE in China.Environ. Sci. Technol. 2016, 50, 1347–1358. [CrossRef] [PubMed]
4. D'Adamo, I.; Rosa, P. Remanufacturing in industry: Advices from the field. Int. J. Adv. Manuf. Technol. 2016.[CrossRef]
5. Yan, M.-R.; Chien, K.-M.; Yang, T.-N. Green Component Procurement Collaboration for Improving SupplyChain Management in the High Technology Industries: A Case Study from the Systems Perspective.Sustainability 2016, 8, 105. [CrossRef]
6. Cucchiella, F.; D’Adamo, I.; Rosa, P.; Terzi, S. Scrap automotive electronics: A mini-review of currentmanagement practices. Waste Manag. Res. 2016, 34, 3–10. [CrossRef] [PubMed]
7. Ruan, J.; Xu, Z. Constructing environment-friendly return road of metals from e-waste: Combination ofphysical separation technologies. Renew. Sustain. Energy Rev. 2016, 54, 745–760. [CrossRef]
8. Wang, C.-N.; Nguyen, X.-T.; Wang, Y.-H. Automobile Industry Strategic Alliance Partner Selection:The Application of a Hybrid DEA and Grey Theory Model. Sustainability 2016, 8, 173. [CrossRef]
9. Oguchi, M.; Sakanakura, H.; Terazono, A. Toxic metals in WEEE: Characterization and substance flowanalysis in waste treatment processes. Sci. Total Environ. 2013, 463–464, 1124–1132. [CrossRef] [PubMed]
10. Kilic, H.S.; Cebeci, U.; Ayhan, M.B. Reverse logistics system design for the waste of electrical and electronicequipment (WEEE) in Turkey. Resour. Conserv. Recycl. 2015, 95, 120–132. [CrossRef]
11. Pérez-Belis, V.; Bovea, M.; Ibáñez-Forés, V. An in-depth literature review of the waste electrical and electronicequipment context: Trends and evolution. Waste Manag. Res. 2015, 33, 3–29. [CrossRef] [PubMed]
12. Zhang, S.; Ding, Y.; Liu, B.; Pan, D.A.; Chang, C.-C.; Volinsky, A.A. Challenges in legislation, recyclingsystem and technical system of waste electrical and electronic equipment in China. Waste Manag. 2015, 45,361–373. [CrossRef] [PubMed]
13. Zeng, X.; Li, J. Measuring the recyclability of e-waste: An innovative method and its implications.J. Clean. Prod. 2016. [CrossRef]
14. Birloaga, I.; Vegliò, F. Study of multi-step hydrometallurgical methods to extract the valuable content of gold,silver and copper from waste printed circuit boards. J. Environ. Chem. Eng. 2016, 4, 20–29. [CrossRef]

Sustainability 2016, 8, 633 18 of 19
15. Cucchiella, F.; D'Adamo, I.; Lenny Koh, S.C.; Rosa, P. A profitability assessment of European recyclingprocesses treating printed circuit boards from waste electrical and electronic equipments. Renew. Sustain.Energy Rev. 2016, in press.
16. Ghosh, B.; Ghosh, M.K.; Parhi, P.; Mukherjee, P.S.; Mishra, B.K. Waste Printed Circuit Boards recycling: Anextensive assessment of current status. J. Clean. Prod. 2015, 94, 5–19. [CrossRef]
17. Cucchiella, F.; D’Adamo, I.; Rosa, P.; Terzi, S. Automotive Printed Circuit Boards Recycling: An EconomicAnalysis. J. Clean. Prod. 2016, 121, 130–141. [CrossRef]
18. Cao, J.; Lu, B.; Chen, Y.; Zhang, X.; Zhai, G.; Zhou, G.; Jiang, B.; Schnoor, J.L. Extended producer responsibilitysystem in China improves e-waste recycling: Government policies, enterprise, and public awareness.Renew. Sustain. Energy Rev. 2016, 62, 882–894. [CrossRef]
19. Hadi, P.; Xu, M.; Lin, C.S.K.; Hui, C.-W.; McKay, G. Waste printed circuit board recycling techniques andproduct utilization. J. Hazard. Mater. 2015, 283, 234–243. [CrossRef] [PubMed]
20. Ford, P.; Santos, E.; Ferrão, P.; Margarido, F.; Van Vliet, K.J.; Olivetti, E. Economics of End-of-Life MaterialsRecovery: A Study of Small Appliances and Computer Devices in Portugal. Environ. Sci. Technol. 2016, 50,4854–4862. [CrossRef] [PubMed]
21. Xu, X.; Chen, X.; Zhang, J.; Guo, P.; Fu, T.; Dai, Y.; Lin, S.L.; Huo, X. Decreased blood hepatitis B surfaceantibody levels linked to e-waste lead exposure in preschool children. J. Hazard. Mater. 2015, 298, 122–128.[CrossRef] [PubMed]
22. Cao, J.; Chen, Y.; Shi, B.; Lu, B.; Zhang, X.; Ye, X.; Zhai, G.; Zhu, C.; Zhou, G. WEEE recycling in ZhejiangProvince, China: Generation, treatment, and public awareness. J. Clean. Prod. 2016, 127, 311–324. [CrossRef]
23. Luglietti, R.; Rosa, P.; Terzi, S.; Taisch, M. Life Cycle Assessment Tool in Product Development: EnvironmentalRequirements in Decision Making Process. Procedia CIRP 2016, 40, 202–208. [CrossRef]
24. Wang, X.; Gaustad, G. Prioritizing material recovery for end-of-life printed circuit boards. Waste Manag.2012, 32, 1903–1913. [CrossRef] [PubMed]
25. Zeng, X.; Song, Q.; Li, J.; Yuan, W.; Duan, H.; Liu, L. Solving e-waste problem using an integrated mobilerecycling plant. J. Clean. Prod. 2015, 90, 55–59. [CrossRef]
26. Zeng, X.; Li, J.; Xie, H.; Liu, L. A novel dismantling process of waste printed circuit boards using water-solubleionic liquid. Chemosphere 2013, 93, 1288–1294. [CrossRef] [PubMed]
27. Kamberovic, Z.J. Hydrometallurgical process for extraction of metals from electronic waste-part ii:Development of the processes for the recovery of copper from Printed Circuit Boards (PCB). Assoc. Metall.Eng. Serbia 2011, 17, 139–149.
28. Xue, M.; Li, J.; Xu, Z. Management strategies on the industrialization road of state-of- the-art technologies fore-waste recycling: The case study of electrostatic separation—A review. Waste Manag. Res. 2013, 31, 130–140.[CrossRef] [PubMed]
29. Ghodrat, M.; Rhamdhani, M.A.; Brooks, G.; Masood, S.; Corder, G. Techno economic analysis of electronicwaste processing through black copper smelting route. J. Clean. Prod. 2016, 126, 178–190. [CrossRef]
30. Li, J.; Xu, Z. Environmental Friendly Automatic Line for Recovering Metal from Waste Printed Circuit Boards.Environ. Sci. Technol. 2010, 44, 1418–1423. [CrossRef] [PubMed]
31. Eurostat. Statistics Database. Available online: http://ec.europa.eu/eurostat/data/database (accessed on2 April 2016).
32. Biganzoli, L.; Falbo, A.; Forte, F.; Grosso, M.; Rigamonti, L. Mass balance and life cycle assessment of thewaste electrical and electronic equipment management system implemented in Lombardia Region (Italy).Sci. Total Environ. 2015, 524–525, 361–375. [CrossRef] [PubMed]
33. Reuter, M.; Hudson, C.; Van Schaik, A.; Heiskanen, K.; Meskers, C.; Hagelüken, C. Metal Recycling:Opportunities, Limits, Infrastructure; A Report of the Working Group on the Global Metal Flows to theInternational Resource Panel, UNEP; UNEP: Nairobi, Kenya, 2013.
34. Ferella, F.; De Michelis, I.; Scocchera, A.; Pelino, M.; Vegliò, F. Extraction of metals from automotive shredderresidue: Preliminary results of different leaching systems. Chin. J. Chem. Eng. 2015, 23, 417–424. [CrossRef]
35. Birloaga, I.; Coman, V.; Kopacek, B.; Vegliò, F. An advanced study on the hydrometallurgical processing ofwaste computer printed circuit boards to extract their valuable content of metals. Waste Manag. 2014, 34,2581–2586. [CrossRef] [PubMed]
36. Innocenzi, V.; De Michelis, I.; Kopacek, B.; Vegliò, F. Yttrium recovery from primary and secondary sources:A review of main hydrometallurgical processes. Waste Manag. 2014, 34, 1237–1250. [CrossRef] [PubMed]

Sustainability 2016, 8, 633 19 of 19
37. Rocchetti, L.; Vegliò, F.; Kopacek, B.; Beolchini, F. Environmental Impact Assessment of HydrometallurgicalProcesses for Metal Recovery from WEEE Residues Using a Portable Prototype Plant. Environ. Sci. Technol.2013, 47, 1581–1588. [CrossRef] [PubMed]
38. Cucchiella, F.; D’Adamo, I.; Gastaldi, M.; Koh, S.C.L. Implementation of a real option in a sustainable supplychain: An empirical study of alkaline battery recycling. Int. J. Syst. Sci. 2014, 45, 1268–1282. [CrossRef]
39. Metalprices. Metals. Available online: https://www.metalprices.com/# (accessed on 5 March 2016).40. InfoMine. InvestmentMine. Available online: http://www.infomine.com/investment/ (accessed on
5 March 2016).41. Cucchiella, F.; D’Adamo, I.; Rosa, P. End-of-Life of used photovoltaic modules: A financial analysis.
Renew. Sustain. Energy Rev. 2015, 47, 552–561. [CrossRef]42. Ardente, F.; Mathieux, F.; Recchioni, M. Recycling of electronic displays: Analysis of pre-processing and
potential ecodesign improvements. Resour. Conserv. Recycl. 2014, 92, 158–171. [CrossRef]43. Zhao, W.; Ren, H.; Rotter, V.S. A system dynamics model for evaluating the alternative of type in construction
and demolition waste recycling center—The case of Chongqing, China. Resour. Conserv. Recycl. 2011, 55,933–944. [CrossRef]
44. Copani, G.; Rosa, P. Demat: Sustainability assessment of new flexibility oriented business models in themachine tools industry. Int. J. Comput. Integr. Manuf. 2014. [CrossRef]
45. Song, Q.; Zeng, X.; Li, J.; Duan, H.; Yuan, W. Environmental risk assessment of CRT and PCB workshops in amobile e-waste recycling plant. Environ. Sci. Pollut. Res. 2015, 22, 12366–12373. [CrossRef] [PubMed]
46. IMDS, Database. 2015. Available online: http://www.mdsystem.com/imdsnt/startpage/index.jsp(accessed on 28 March 2015).
47. Li, J.; Lu, H.; Guo, J.; Xu, Z.; Zhou, Y. Recycle Technology for Recovering Resources and Products from WastePrinted Circuit Boards. Environ. Sci. Technol. 2007, 41, 1995–2000. [CrossRef] [PubMed]
48. Kasper, A.C.; Carrillo Abad, J.; García Gabaldón, M.; Veit, H.M.; Pérez Herranz, V. Determination of thepotential gold electrowinning from an ammoniacal thiosulphate solution applied to recycling of printedcircuit board scraps. Waste Manag. Res. 2016, 34, 47–57. [CrossRef] [PubMed]
49. Liu, J.; Yang, C.; Wu, H.; Lin, Z.; Zhang, Z.; Wang, R.; Li, B.; Kang, F.; Shi, L.; Wong, C.P. Future paper basedprinted circuit boards for green electronics: Fabrication and life cycle assessment. Energy Environ. Sci. 2014,7, 3674–3682. [CrossRef]
50. Sthiannopkao, S.; Wong, M.H. Handling e-waste in developed and developing countries: Initiatives, practices,and consequences. Sci. Total Environ. 2013, 463–464, 1147–1153. [CrossRef] [PubMed]
© 2016 by the authors; licensee MDPI, Basel, Switzerland. This article is an open accessarticle distributed under the terms and conditions of the Creative Commons Attribution(CC-BY) license (http://creativecommons.org/licenses/by/4.0/).