challenges in monitoring the social impacts of global
TRANSCRIPT

Challenges in Monitoring the Social Impacts of Global Policy - Shocks at the National and Local Levels
Tomas P. Africa
CBMS1 - Emerging Development Issues in Impact Monitoring and Targeting

1
Challenges in Monitoring the Social Impacts of Global Policy Shocks at the National and Local levels1
In preparing this presentation I examined the documents made available during the Technical Workshop last 17-19 February 2009 on Monitoring and Mitigating the Impact on Poverty of the global and Financial and Economic Crisis held in Manila. One document touched on the list of potential indicators to address the monitoring of the micro-impacts of financial crisis on households. The following were listed as micro-impacts from where potential indicators could be based on. a) Household income ° Diminishing remittances ° Reduced labor income ° Rising poverty b) Shelter ° Housing insecurity c) Water & sanitation ° Less access to safe water and sanitation ° Less spending on other basic services (e.g., transportation, communication,
electricity and water) d) Health & nutrition ° Limited access to basic social services ° Worsening health and nutrition situation e) Education ° Waning school attendance f) Employment ° Returning overseas workers ° Rising unemployment ° Rising underemployment ° Rising child and elderly employment g) Security
1 By Tomas P. Africa. Prepared for the CBMS Session Program, 8th PEP Network General Meeting, June 16-18, 2010, Dakar, Senegal.

2
° Worsening peace & order h) Others ° Smoothing out household consumption (loans, sell/pawn assets) I find many, if not all of the above variables already in existing national surveys, particularly the Annual Poverty Indicators Survey. Thus I intend to present the example of the Philippines in which I was directly involved in the search of the national government for adequate monitoring of poverty and related social developments, in the mid-1990’s and into the next decade. These efforts also supported the formulation and implementation of ‘safety nets’ to cushion the social impacts at the national and local levels arising from global economic shocks. Philippine Experience in Community-based System of Minimum Basic Needs Monitoring The Philippines launched the Social Reform Agenda (SRA) on June 1995 to enable people to have access to opportunities for undertaking sustainable livelihoods espoused under the agenda for change. One of the ten flagship programs under the SRA was the Comprehensive and Integrated Delivery of Social Services (CIDSS) implemented by the Department of Social Welfare and Development that sought to
• alleviate poverty through an integrated delivery of social services; • empower families and communities through the total family approach
and community organizing; • monitor and evaluate changes in the quality of life of targeted poor
families based on the Minimum Basic Needs (MBN) approach, and; • institutionalize CIDSS strategy in local development planning,
implementation, monitoring and evaluation of activities for sustainability. The MBN approach was a strategy of prioritizing primary requirements to ensure that the basic needs for survival, security from personal harm, and enabling needs of the individual, family and community are attended to. The degree to which a Filipino family achieves its MBNs served to measure its quality of life. If the family is unable to meet its minimum basic needs on a sustained basis, then the family is considered deprived of these basic needs and is therefore in a state of poverty. Those who are classified to be at the highest level of deprivation are then targeted for priority assistance. This was put into operation through a system of gathering data using monitoring forms at the community level by volunteer monitors (CVMs). The government officially adopted the Minimum Basic Needs-Community-Based Information System (MBN-CBIS) in 1995.

3
The set of MBN-CBIS indicators to be monitored was formulated by an inter-agency technical working group composed of representatives from key Executive Departments of the national government in the social sector.2 Thirty-three (33) indicators were identified and grouped into indicators of survival, security and enabling needs: a) Survival: 15 indicators on food and nutrition, health, water and sanitation, clothing, b) Security: 9 indicators on shelter, peace and order, income and livelihood, and c) Enabling: 9 indicators on basic education and functional literacy, people’s participation in community development, family or psychosocial care 1. Monitoring of poverty alleviation efforts and other socio-economic development initiatives need not emanate from the national statistics office. The statisticians can assist in developing and transferring the technology of generating accurate, precise3 and cost-efficient information. The inter agency working group included many existing social indicators into the MBN framework. About a fourth was also related to the MDG indicators that were adopted in late 2000. From a statistical standpoint, it had in reality forced the consideration of several social statistics into a government-recognized development framework and approach to be pursued nationwide. And this happened without the active participation of the Philippine Statistical System (PSS). 2. The possibility of aggregating community-level statistics to the national level should be downplayed. In the case of the Philippines, this would entail the summarization of more than 40 thousand villages, even more if communities were to be considered.
2 These included the Social Reform Council, Presidential Commission to Fight Poverty, Department of Social Welfare and Development, Department of the Interior and Local Government, Department of Health, Population Commission, Department of Labor and Employment, Housing and Urban Development Coordinating Council and the Department of Education, Culture and Sports. 3 Precision is to be contrasted with accuracy, which is the property of being close to some target or true value. Precision is a quality associated with a class of measurements and refers to the way in which repeated observations conform to themselves; and in a somewhat narrower sense refers to the dispersion of the observations, or some measure of it, whether or not the mean value around which the dispersion is measured approximates the “true” value. OECD Glossary of Statistical Terms.

4
Giving advice in aggregating statistically robust results from the community level to the national level The Philippine National Statistical Office (PNSO) was drawn into the programme only in 1996, when the Presidential Commission to Fight Poverty (PCFP) approached it for assistance in producing aggregate MBN indicators at the provincial, regional and national levels. An inter-agency Task Force on Poverty Statistics Enhancement (TF-PSE) was organized by the PNSO for a final assessment of the monitoring form and to provide guidance on how to collect and process the data. It revealed a number of shortcomings in the procedures and instruments, such as: lack of procedures to validate the data during its collection; no uniform interpretation of concepts used; no available manual of instructions or procedures; inappropriate phrasing of the questions to be able to come-up with
quantifiable indicators; inclusion of questions in the household questionnaire requiring the answer
from the community; and construction of indicators such that some were positively phrased, while
others negatively phrased, resulting in confusion in identifying unmet needs. 3. Community-based statistics would have to be relevant to the community for the monitoring process to have meaning and to work. This though would have serious implications on the uniformity of questions and variables to be included in the monitoring, as well as the processing of the questionnaires. However, aggregation to the next level of administration, say from village to town or city, could be explored and could be feasible if systematized and institutionalized. (See Chart 1.) Moreover, since the monitoring forms captured only the presence or absence of particular problems/needs in the community, the magnitude and extent of these problems could not be determined. Because the needs and conditions vary from one locality to another, there were feedbacks received that not all the 33 indicators were appropriate or sufficient for some areas. Several communities merely wanted the monitoring of a few indicators such as lack of potable water and sanitary toilets that made their farmers sickly despite fertile lands and irrigation available nearby. Others wanted the inclusion of other indicators not in the list. Cultural communities wanted a measure of ancestral domain holdings. Moreover, while the concept of volunteerism (in data collection, processing and presentation) encouraged people participation, the capabilities of some of the CVMs mattered and the quality of information derived was affected.

5
The form that was designed after months of intensive consultations and debates among key Departments was deemed as not capable of generating robust statistical results. Procedures to correct the inadequacies and oversights observed in the assessment had to be undertaken. However while the assessment provided some concrete solutions to improve the MBN-CBIS procedures and at least get technically better statistics, the original MBN-CBIS procedures were still implemented. It was too late for drastic revisions, or any for that matter, needed for it to be an instrument that could be attributed to an official statistics organization. Although PNSO has the expertise in planning and undertaking data collection activities, it served as an observer to the data collections exercise orchestrated by barangay officials in the poor municipalities. Overseeing technology and fund transfers in the implementation of the community-based monitoring system Related to this the implementation involved the installation of the MBN-CBIS in the fifth and sixth class municipalities (classified according to local government revenue generated) all over the country. There were a total of 960 such ‘poor’ municipalities covering 19,066 barangays (villages) nationwide. An amount of PhP100 million earmarked from the Poverty Alleviation Fund II (PAF2) was provided for this purpose in 1977. The fund was added to the PNSO budget since the PCFP felt that the principal activity to be funded was data collection and no other agency had the skill, experience and presence in the field on data collection and processing other than the PNSO. The funding had a high chance of approval by Congress if it were incorporated into the under the PNSO budget. To maintain good relations, the PNSO eventually served as the fund conduit for capability building, data collection and processing materials in the communities whereby funds necessary for the project were transferred to the concerned local government units in accordance with progress reports and other necessary documents.
With the modest success of the MBN-CBIS, the Minimum Basic Needs – Community-Based Poverty Indicator and Monitoring System (MBN-CBPIMS) was designed. It was also a barangay-based information system for gathering, analyzing and utilizing data regarding the minimum basic needs of local residents. As an indicator system, the MBN-CBPIMS could assist the local government unit (LGU) identify who and where the poor are, how many are poor and what the poor needs in terms of their MBNs. Moreover, it could be adopted by LGUs as a tool for planning and budgeting/programming and therefore significantly improves resource allocation at the local level.
The MBN-CBPIMS was an enhanced information system that is within the context of the MBN approach. It took off from the Minimum Basic Needs –

6
Community-Based Information System (MBN-CBIS). In order to fully achieve the objectives of the MBN Approach, the improvement of the MBN-CBPIS instrument was undertaken by the PNSO in terms of its conceptual framework and data generation techniques. As a result, the MBN data generated under this system can be aggregated up to the provincial level.4
4. There is not one survey instrument/vehicle that would respond to and satisfy the needs in the area of poverty alleviation for policy makers, program formulators and project implementors at the national and local levels. Addressing the lack of adequate and appropriate data on poverty and related statistics Unlike the household surveys conducted by the NSO, the MBN-CBIS could not be a statistical technique of generating information on the poverty situation at the local level and estimates could not be aggregated to the provincial or regional level. Information derived was limited only to particular municipalities that participated in this program. Another motivation for the MBN-CBIS was to have a more frequent measure of poverty available to the national government. Official poverty statistics in the country are based on the Family Income and Expenditures Survey (FIES), which is conducted on a nationwide basis by the PNSO every three years since 1985 and therefore can only be generated every three years. The FIES obtains data on the income and expenditures of families for one whole year. Other than poverty incidence, FIES also gives the distribution of families by income class, income deciles distribution, sources of income, spending pattern by income class and poverty related indicators like housing characteristics. However there has been an increasing demand for monitoring poverty on a more frequent basis, e.g., once a year, through the development and identification of proxy indicators, including those that are not based on income alone. FIES poverty estimates are also generally income-based and it was the consensus that the multiple dimensions of poverty were not being monitored. Also, the sampling design of the FIES up to 1994 allowed for the estimation of poverty incidence at the national and regional levels only. The PNSO still had to address the lack of frequent and relevant poverty statistics. Through the UNDP, the NSO conducted a pilot survey, named as the Annual Poverty Indicators Survey (APIS), which provided not only income and expenditure data but also some socio-economic indicators. This was followed by a nationwide APIS, which eventually became a rider to the quarterly labor force 4 Local Poverty Alleviation Program Philippines, http://www.evis.net.ph/~lpap/primer/page01.htm

7
surveys and was funded by the government. Since 1998, the NSO has been conducting the APIS as a rider to its Labor Force Survey (LFS) during the years when the FIES was not conducted, except in 2001 and 2005 due to budgetary constraints. 5. National monitoring agencies need to be anticipatory at times in order to anticipate both global and domestic policy shocks, or need to be primed to be able to focus on these at the onset rather than at the tail-end of the disturbance. The APIS The APIS was envisioned to be undertaken in the years without the FIES to provide flash non-income indicators (correlates) of poverty that can be used as inputs to the development of an integrated poverty indicator and monitoring system in the country. It presents a socio-economic profile of Filipino families and other information relating to their living conditions. It also generates indicators such as own or owner-like possession of house and lot, roofs and walls of housing units made of strong materials, access to safe water, with sanitary toilet, children 6-12 years old enrolled in elementary, children 13-16 years old enrolled in high school, with members 18 years old and over gainfully employed, and with working children 5-17 years old. Other items like income and expenditures, though with less detail, were maintained to establish correlation with the non-monetary variables. The World Bank also participated and provided technical assistance to the survey. It influenced the inclusion of questions to monitor the effects of the 1997 Asian financial crisis on households. Both the MBN-CBIS and APIS support the government’s thrust to alleviate the conditions of the poor families in the country. About 15 MBN-CBIS indicators were included in the APIS so that an overlap may be established between the two data sets at the provincial level. The APIS provides national data down to the regional and provincial level while the MBN-CBIS provides data at the community level, which can be aggregated at the municipality and up to the provincial level. APIS arose during the Asian financial crisis in 1997; a review came in 2006, before the sub-prime mortgage crisis of 2007-2010. However I find the review cutting down on a few questions on access to health and education facilities for some unexplained reason/s. The FIES and the APIS

8
The FIES and APIS are sample surveys designed to provide indicators related to poverty. The salient difference between the two survey instruments is that, the FIES has a detailed questionnaire items on both income and expenditures while APIS has a summarized version in terms of income and expenditure items. Also the two surveys have different reference periods so that when income data from APIS would be used to estimate poverty incidence, the result could be very different. However, much of the difference would be attributed to the difference in measurements given the difference in the questionnaire items. This was the main reason why income and expenditures data of APIS were never utilized in updating the official poverty statistics on an annual basis. In 2006, a memorandum of agreement (MOA) between the National Economic and Development Authority (NEDA) and the NSO was signed for the implementation of the WBASEM Grant for Poverty Monitoring and Analysis. The WB-ASEM Grant for Technical Assistance (TA) is provided to the Government of the Philippines (GOP) to enhance the impact of poverty analysis on policy formulation and decision-making by ensuring that decisions are based on informed analysis and that resources are allocated to interventions resulting to greatest poverty reduction. … Considering the need for efficient survey tools whether income or non-income-based, in monitoring poverty, and the need to produce reliable poverty indicators in an annual basis, the project “Redesigning the Annual Poverty Indicators Survey as Poverty Monitoring Tool” was carried out by the NSO in collaboration with the NEDA. Specifically this project proposed to redesign the APIS questionnaire and generate appropriate indicators to provide estimates for poverty monitoring. The Sample The 1998, 1999, and 2002 APIS had a national sample of 41,000 households drawn from 3,416 sample barangays/enumeration areas, of which 2,045 are urban and 1,371 are rural. Twelve households were selected in every sample EA/barangay. The 2004, 2007 and 2008 APIS had a national sample of approximately 51,000 housing units drawn from the 2,835 PSUs (barangays). For operational considerations, at most 30 housing units were selected per sample EA. All households in the housing units were interviewed except for housing units with more than three households. In such a housing unit, three households were randomly selected with equal probability. As a rider to the Labor Force Survey (LFS), all sample households of the LFS were interviewed for the APIS. However, only members of the family that is related to the household head by blood, marriage or adoption, were considered as members in the APIS sample. Family members working abroad were excluded.

9
Information on the sampling design, estimation procedure, field operations (training, enumeration and supervision, processing of questionnaires, tabulation, data dissemination, and budget) are discussed extensively in Ericta and Luis paper.

10
Table 1. Comparison of APIS Questions, 1998 and 2008 Questions Deleted/Exchanged from 1998 APIS Health • What type of illness did_have during the last six months? • Did _ visit a health facility like hospital, clinic, etc. during the past six months? • What health facility did_visit during the last six months? Education • What type of school is_currently attending? • How does_travel to school? • How many hours walk does_taken to reach school? Employment • What was_’s primary job or business? • What kind of business/industry did _ engage in? • Did_look for work at anytime during the past six months*/week? • Why did_not look for work? • What was_’s nature/status of employment? • Number of days worked. Family Planning • Are you aware of any family planning method? • Do you know where to get or avail of the family planning service? • Did you use any method of contraception e.g., pills condoms, IUD, etc. during the past six months? • Are you pregnant or lactating during the past six months? • Were you given at least 2 doses of Tetanus Toxoid Injection (TTI) during your last pregnancy?
Questions Added to 2008 APIS Health • Was_illness/injury work related? House/lot • How many house and/lot have you or any member of your family acquired thru government housing or financing program? • When did you or any member of your family acquire this house and/or lot?

11
• During your last pregnancy and/or during lactation period were you provided with Iron? • During your last pregnancy and/or lactation period were you provided with Iodine?
Credit • During the past six months, did you or any member of your family avail of any credit to finance your business or entrepreneurial activity? • What was/were your source(s) of loan? • Why did you not avail of any loan to finance the entrepreneurial activity? Financial Crisis • During the past six months, did the following problems affect you and your family? • Did you take the following steps in response to these problems? Government support • Have you or any member of your family received any educational/scholarship assistance for tertiary education program? • Did you receive any agricultural extension services during the past six months? People participation • Are you or anyone in the family a member of any people’s organization/cooperative* and/or non-government organization? Changes in welfare • How do you cope with the situation?
Credit • Are you or any member of your family aware of any lending institution or private individual whose business is lending money with interests? • Did you or any member of your family avail of any loan in the past six months? • Where did you or any member of your family avail of this loan? • Where did you use the money?
Government support • Are you or any member of your family aware of any government’s program on affordable drugs/medicines like “Botika sa Barangay/ng Bayan”, GMA 50 and NFA rolling store • Have you ever purchased medicines/drugs under this program? • Is there any member of the family a recipient of any scholarship assistance from any government program or any private individual/ organization?
Hunger • During the past 3 months, did it happen once that you or any member of your family experienced hunger because you did not have food to eat?
Summary
12
1. Monitoring of poverty alleviation efforts and other socio-economic development initiatives need not emanate from the national statistics office. The statisticians can assist in developing and transferring the technology of generating accurate, precise and cost-efficient information. 2. The possibility of aggregating community-level statistics to the national level should be downplayed. In the case of the Philippines, this would entail the summarization of more than 40 thousand villages, even more if communities were to be considered. 3. Community-based statistics would have to be relevant to the community for the monitoring process to have meaning and to work. This though would have serious implications on the uniformity of questions and variables to be included in the monitoring, as well as the processing of the questionnaires. However, aggregation to the next level of administration, say from village to town or city, could be explored and could be feasible if systematized and institutionalized. 4. There is not one survey instrument/vehicle that would respond to and satisfy the needs in the area of poverty alleviation for policy makers and program formulators and project implementer at the national and local levels. 5. National monitoring agencies need to be anticipatory at times in order to anticipate both global and domestic policy shocks, or need to be primed to be able to focus on these at the onset rather than at the tail-end of the disturbance. APIS arose during the Asian financial crisis in 1997; a review came in 2006, before the sub-prime mortgage crisis of 2007-2010. However I find the review cutting down on a few questions on access to health and education facilities for some unexplained reason.

13
REFERENCES Africa, Tomas. Social Statistics in the Development Agenda: Two Cases for Relevance and Sustainability. Expert Group Meeting on Setting the Scope of Social Statistics, United Nations Statistics Division in collaboration with the Siena Group on Social Statistics, [ESA/STAT/AC.88/08, 24 April 2003], New York, May 2003. http://unstats.un.org/unsd/demographic/meetings/egm/Socialstat_0503/docs/no_8.pdf Bautista, Victoria. A Critique of the Local Poverty Diagnosis and Planning System. Paper presented during the 9th National Convention on Statistics, Mandaluyong, Metro Manila, Philippines, October 2004. Ericta, Carmelita and Luis, Jeremias. A Documentation of the Annual Poverty Indicators Survey. Philippine Institute for Development Studies Discussion Paper Series No. 2009-20, July 2009 http://dirp4.pids.gov.ph/ris/dps/pidsdps0920.pdf Local Poverty Alleviation Program Philippines, http://www.evis.net.ph/~lpap/primer/page01.htm

14
Family Income and Expenditure Survey, Annual Poverty Indicators Survey
National
Regional
Barangay (Village)/ Community
City/ Municipality
Provincial
Community-Based Monitoring System
Chart 1. From Community to National Statistics: Philippine Case

15
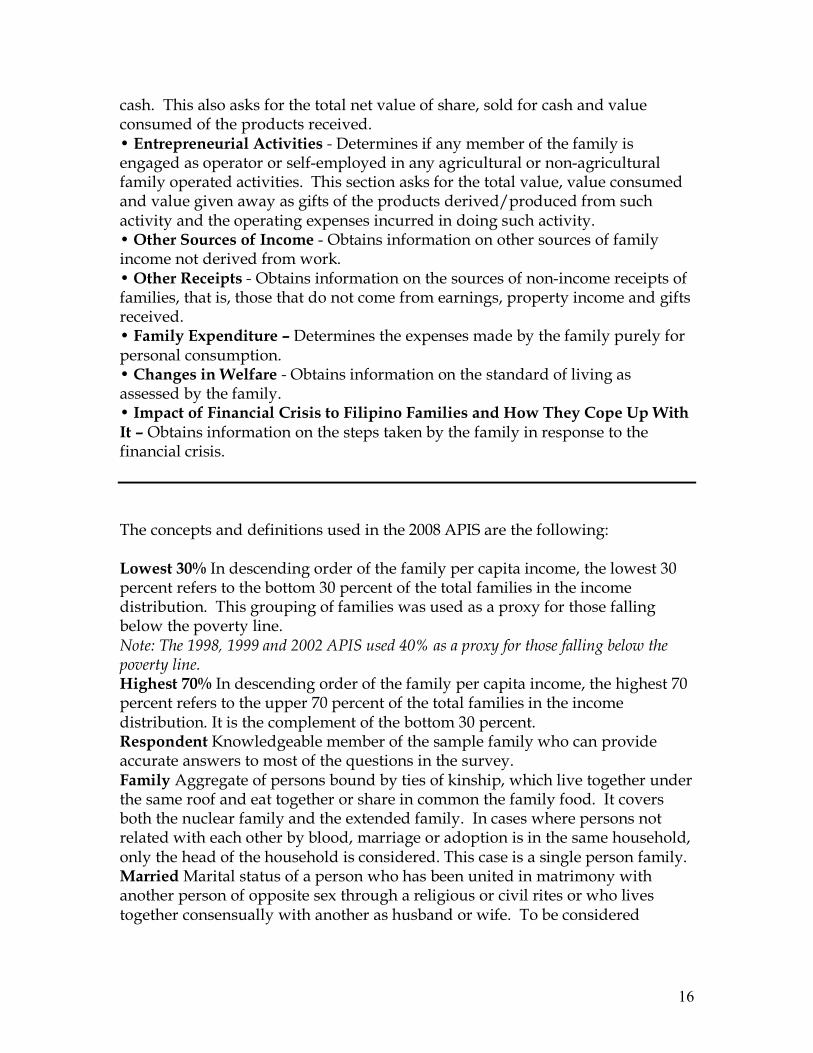
Annex 1. Items in the Survey Questionnaire The original APIS questionnaire contains questions on the following topics: • Demographic Characteristics - Obtains the demographic characteristics of each family member such as relationship to the family head, sex, age and marital status. • Health Status - Obtains information on the types of illnesses and/or injuries experienced by the family and whether these are work related or not, the type of health facilities that they are visiting or consulting in case of illnesses and/or injuries or anything pertaining to their family health. • Schooling Status and Highest Grade Completed – Determines the educational attainment of the family members 5 years old and over. It also determines whether a family member aged between 6 to 24 years is currently attending formal school, and if so, the level the member is currently attending. If not, then the reason for not currently attending school is also asked. • Economic Characteristics - Obtains information on the employment status of each family member 5 years old and over. It also includes questions on occupation and business engaged in by the household members, and the salaries and wages from employment of each working family member. • Family Member Engaged in Hazardous Occupation - Findings were based on the responses to the question “At anytime from (reference period) did (name of the person) engage in an occupation hazardous to his/her health?” • Family Planning – Assesses the knowledge of women 15 to 49 years old in the family regarding family planning. • Housing, Water and Sanitation - obtains information that relates to housing characteristics and household conveniences/amenities owned by the family. The main source of water supply and kind of toilet facility used were also asked. • Credit Information – Obtains information on the availment of credit by the family for use in the operation of economic activities. • Other Relevant Information - Determines if any member of the family has health insurance plan, and if any member of the family is a member of any people’s organization and/or non-government organization. • Family Sustenance - Determines whether or not the family is engaged in family sustenance activities, which is for home consumption only, in order to augment family income. This section asks for the net receipts and value consumed of the products derived from the family sustenance activity. • Net Share of Crops, Fruits and Vegetables Produced or Livestock and Poultry Raised by Other Households - Determines whether or not the family has received a share on crops, fruits, vegetables, livestock, poultry, etc. which were raised and harvested by other households, in terms of the produce or in
16
cash. This also asks for the total net value of share, sold for cash and value consumed of the products received. • Entrepreneurial Activities - Determines if any member of the family is engaged as operator or self-employed in any agricultural or non-agricultural family operated activities. This section asks for the total value, value consumed and value given away as gifts of the products derived/produced from such activity and the operating expenses incurred in doing such activity. • Other Sources of Income - Obtains information on other sources of family income not derived from work. • Other Receipts - Obtains information on the sources of non-income receipts of families, that is, those that do not come from earnings, property income and gifts received. • Family Expenditure – Determines the expenses made by the family purely for personal consumption. • Changes in Welfare - Obtains information on the standard of living as assessed by the family. • Impact of Financial Crisis to Filipino Families and How They Cope Up With It – Obtains information on the steps taken by the family in response to the financial crisis. The concepts and definitions used in the 2008 APIS are the following: Lowest 30% In descending order of the family per capita income, the lowest 30 percent refers to the bottom 30 percent of the total families in the income distribution. This grouping of families was used as a proxy for those falling below the poverty line. Note: The 1998, 1999 and 2002 APIS used 40% as a proxy for those falling below the poverty line. Highest 70% In descending order of the family per capita income, the highest 70 percent refers to the upper 70 percent of the total families in the income distribution. It is the complement of the bottom 30 percent. Respondent Knowledgeable member of the sample family who can provide accurate answers to most of the questions in the survey. Family Aggregate of persons bound by ties of kinship, which live together under the same roof and eat together or share in common the family food. It covers both the nuclear family and the extended family. In cases where persons not related with each other by blood, marriage or adoption is in the same household, only the head of the household is considered. This case is a single person family. Married Marital status of a person who has been united in matrimony with another person of opposite sex through a religious or civil rites or who lives together consensually with another as husband or wife. To be considered

17
married, the couple should still be living together or if living apart from each other, the separation must only be temporary. Family Planning Method Included are natural and modern methods of contraception. These include basal body temperature, billings/ovulation/mucus method, calendar, withdrawal, periodic abstinence, condom, diaphragm, vasectomy/male sterilization, pills, foam, injection, intra-uterine device and ligation/female sterilization. With Access to Family Planning The ratio of the number of families with married women 15-49 years old who know where to get/avail of family planning services to the number of families with married women 15-49 years old. With Access to Health Facilities The ratio of the number of families where at least one member visited any health facility to the total number of families. Visited any Health Facility A person is considered to have visited any health facility if he consulted or received any medical care from any health facility. Health facilities include government hospital, private hospital, private clinic, rural health unit/health center, and barangay health stations. Sanitary Toilet Sanitary toilet facilities include water sealed and closed pit types of toilet facilities. Proportion of families own*/with sanitary toilet The ratio of the number of families with flush toilet (either owned or shared) and close pit to the total number of families. Note: The 1998 APIS used the term “own”. Proportion of families with access to safe drinking water*/water supply The ratio of the number of families who access water from community water system (piped into their dwelling, yard/plot or public tap) and protected wells to the total number of families. *The 1998 APIS used safe drinking water. Strong Materials Strong materials include galvanized iron/aluminum, tile, concrete, brick, stone and asbestos. Proportion of families with houses made of strong materials The ratio to the total number of families of those families with houses having roofs and outer walls made of strong materials such as galvanized iron/aluminum, tile, concrete, brick stone and asbestos. School Refers to formal schools including vocational/technical schools offering post secondary courses. Proportion of families with owned or ownerlike possession of housing units The ratio of the number of families with owned or amortized housing units to the total number of families. Proportion of families with gainfully employed family head The ratio of the number of families with a family head who is gainfully employed to the total number of families. Proportion of families with gainfully employed members 18 years old and over The ratio of the number of families with gainfully employed members

18
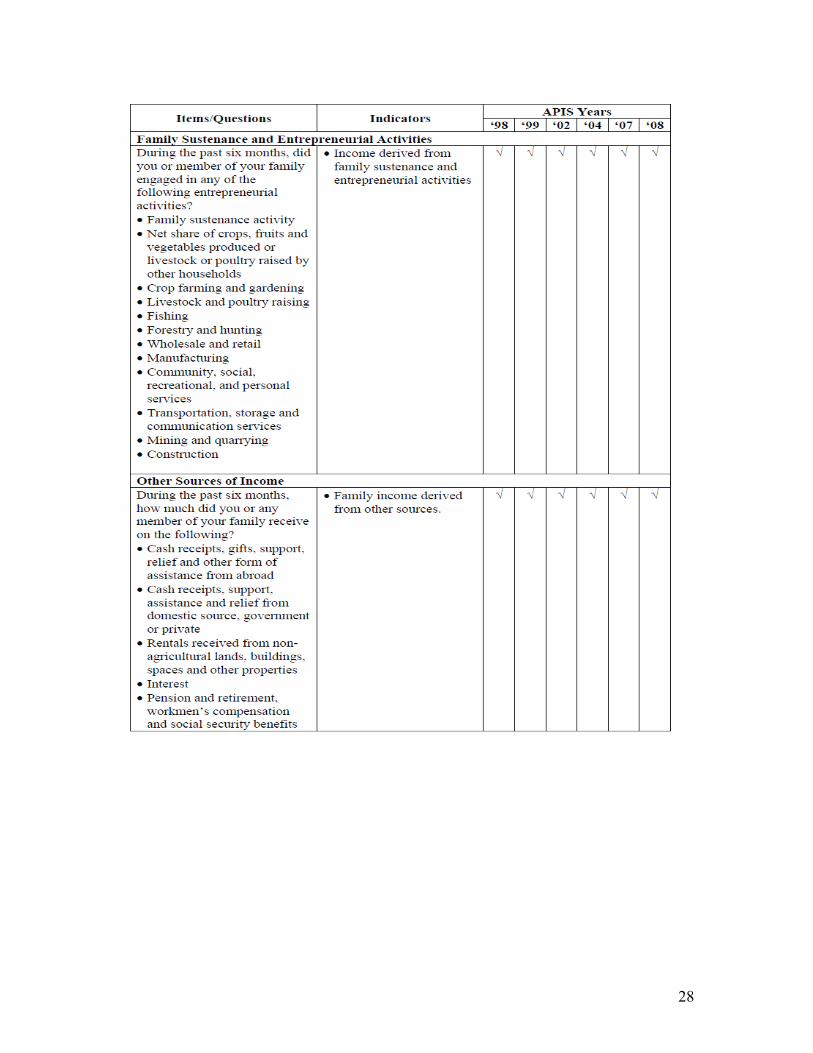
18 years old and over to the total number of families with members 18 years old and over. Proportion of families with children 6-12 years old in elementary The ratio of the number of families with children 6-12 years old attending elementary school to the total number of families with children 6-12 years old. Proportion of families with children 13-16 years old in high school The ratio of the number of families with children 13-16 years old attending high school to the total number of families with children 13-16 years old. Proportion of families with members 5-17 years old who are working The ratio of the number of families with children 5-17 years old who are working to the total number of families with children 5-17 years old. Proportion of families with membership in any PO/NGO The ratio of the number of families with one or more members affiliated to any people’s organization/non-government organization to the total number of families. Hazardous Occupation Persons who were reported to have worked in a hazardous occupation during the reference period include workers exposed to dangerous environmental elements, contaminants, or work conditions including ionizing radiations, chemicals, fires, flammable substances, noxious components; those engaged in construction work, logging, mining, quarrying, blasting, stevedoring, dock work, deep sea fishing, mechanized farming; those engaged in manufacturing or handling of explosive powder-activated tools; and workers exposed to biological agents like bacteria, fungal viruses, potassium, nematodes and other parasites. Gainfully Employed A person is considered as gainfully employed if he is engaged in any occupation for which he is remunerated, directly or indirectly, in cash or in kind. Working A person is considered working if he is engaged in any economic activity for pay, in cash or in kind, in any establishment, office, farm, private home or for profit or without pay on family farm or enterprise. Class of Worker Refers to the relationship of the worker to the establishment which he/she works. Occupation Refers to the type of work, trade or profession performed by the individual during the reference period such as palay farmer, typists, physician, beautician, etc. If he/she is not at work, it refers to the kind of work he was doing or will be doing if merely waiting for a new job to begin within two weeks from the date of interview. Annex 2. The matrix below shows the questions/items included in the questionnaire in each year of the APIS and the indicators derived.

19

20

21

22

23

24

25

26

27
28

29