challenges for the design and implementation of programs...
TRANSCRIPT

Challenges for the Design and Implementation of Programs
Ensuring Early Childhood Comprehensive Attention
University of Nebraska - Lincoln, August 2015
Ricardo Paes de Barros (INSPER/IAS)Rosane Mendonça (UFF)

Presentation Plan
1. The importance and the components of early childhood comprehensive attention is known
2. Defining the roles of family and government in the provision of comprehensive care.
3. Brazilian Progress and the need for continuity4. Monitoring child development5. What is needed I? Focus on positive rights6. What is needed II? Integration of public programs and
between public and private actions 7. What do we need to know? Sequencing

Roles of Family and Government
Confusion between comprehensive attention and care through public programs.
Complementarity or substitution between family actions and governmental programs.
Fulltime versus part-time daycare centers.
Home visits for all versus home visits just for the most vulnerable groups.
Presentation Plan
1. The importance and the components of early childhood comprehensive attention is known
2. Defining the roles of family and government in the provision of comprehensive care.
3. Brazilian Progress and the need for continuity4. Monitoring child ‘development5. What is needed I? Focus on positive rights6. What is needed II? Integration of public programs and
between public and private actions 7. What do we need to know? Sequencing

0
5
10
15
20
25
30
35
40
45
50
1990 1991 1992 1993 1994 1995 1996 1997 1998 1999 2000 2001 2002 2003 2004 2005 2006 2007 2008 2009 2010 2011
Infa
nt m
orta
lity
rate
(o/o
o)
Evolution of Infant Mortality Rate: 1990-2011
MDG to be reached in 2015

Child mortality (up to 5 years old) rate in BrazilianMunicipalities: 1991
Source: HDI-M Atlas
A. Infant and child mortality

Child mortality (up to 5 years old) rate in BrazilianMunicipalities: 2010
Source: HDI-M Atlas
A. Infant and child mortality

0
5
10
15
20
25
30
35
40
45
50
2001 2002 2003 2004 2005 2006 2007 2008 2009 2010 2011 2012 2013
perc
enta
ge o
f chi
ldre
n 0
to 3
yea
rs o
ld a
tten
ding
day
care
ce
nter
s (%
)Evolution of the Access to Daycare Centers: 1990-2011
Coverage double in 10 years

Evaluating the contribution of improvements is socioeconomic status of families
0
10
20
30
40
50
60
70
80
90
100
110
Socioeconomic conditions and sectorial publicprograms of two decades ago
Current socioeconomic conditions andsectorial public programs
Mor
talid
ade
prec
oce
-19
92=1
00
Decomposition of the drop in child mortality between sectoral social programs and socio-economic status
Drop in mortality rates
64%

A. Infant and child mortality

A. Infant and child mortality

Although socioeconomic progress has been of great help, the vast majority of the improvement in child development was due to sectorial
public programs
0
10
20
30
40
50
60
70
80
90
100
110
Socioeconomic conditions and sectorial publicprograms of two decades ago
Current socioeconomic conditions andsectorial public programs of two decades ago
Current socioeconomic conditions andsectorial public programs
Mor
talid
ade
prec
oce
-19
92=1
00
Decomposition of the drop in child mortality between sectoral social programs and socio-economic status
Change due to change in socioeconomic status
Change due to social program
30%
70%

Health: 50 thousand family health care teams – ESF, 66% of population covered, 265 thousand community health agents – PACS and 24 thousand dental care teams - ESD.
Social Assistance: 8 thousand one-stop-shops for social protection –CRAS, 91% with Program of integrated family care – PAIF, 98% of the brazilian municipalities with at least one one-stop-shop for social protection.
Education: 2,5 million children attending 50 thousand childcare centers. More of 25% of the 0-3 population covered.
Supply of basic care services for early childhood

Innovative Local Early Childhood Programs

Child and Adolescent Rights Statute – ECA “Marco Legal” (Legal References) for Early Childhood
Development Subscribing the UN document “A World Fit for Children” Strenghtening and expansion of the number of Child
Guardianship Councils (Conselhos Tutelares) – present in 98% of municipalities
Strenghtening of the State and Municipal Councils for the Protection of the Rights of Children – present in 92% of municipalities.
Strenghtening of Childhood and Adolescense Development Funds (FIA).
Legislation and Institutional Advances
90%
91%
92%
93%
94%
95%
96%
97%
98%
99%
100%
0 10 20 30 40 50 60 70 80 90 100
Prob
abili
ty
Relative family socioeconomic status
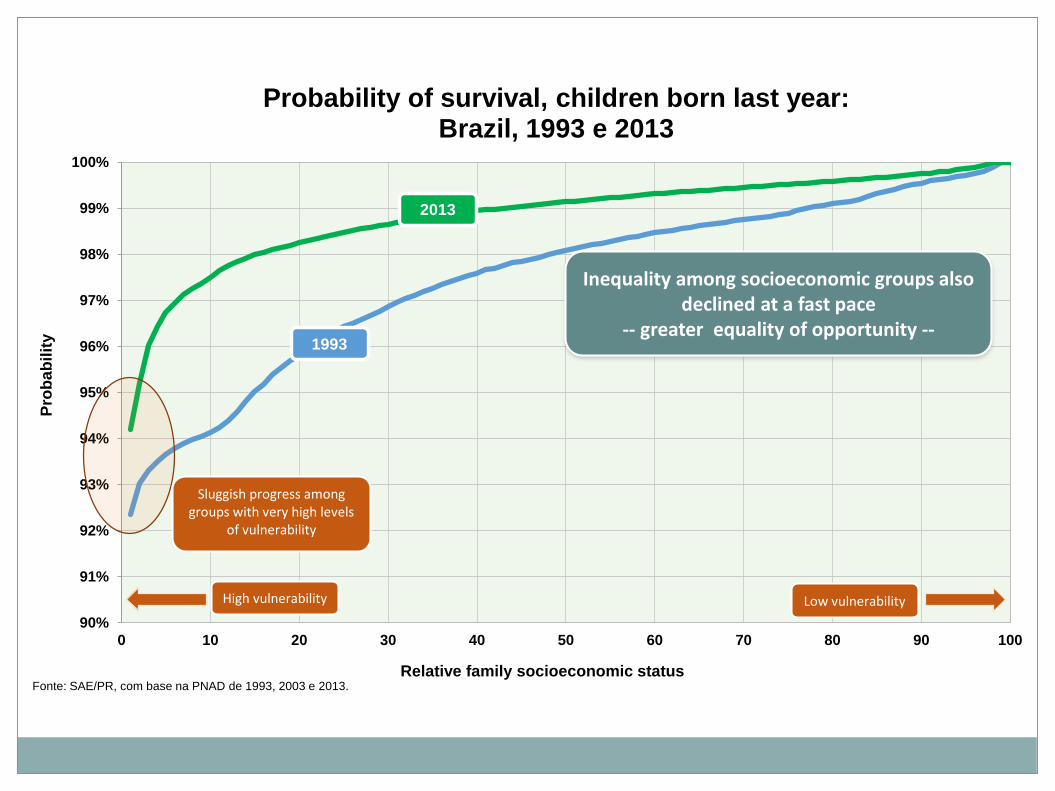
Probability of survival, children born last year: Brazil, 1993 e 2013
Fonte: SAE/PR, com base na PNAD de 1993, 2003 e 2013.
1993
2013
Sluggish progress among groups with very high levels
of vulnerability
High vulnerability Low vulnerability
Inequality among socioeconomic groups also declined at a fast pace
-- greater equality of opportunity --

Challenges for Brasil Carinhoso Program
Taxa de frequência três vezes maior entres os ricos
que entre os pobres

0
5
10
15
20
25
30
35
40
45
50
2001 2002 2003 2004 2005 2006 2007 2008 2009 2010 2011 2012 2013
perc
enta
ge o
f chi
ldre
n 0
to 3
yea
rs o
ld a
tten
ding
day
care
ce
nter
s (%
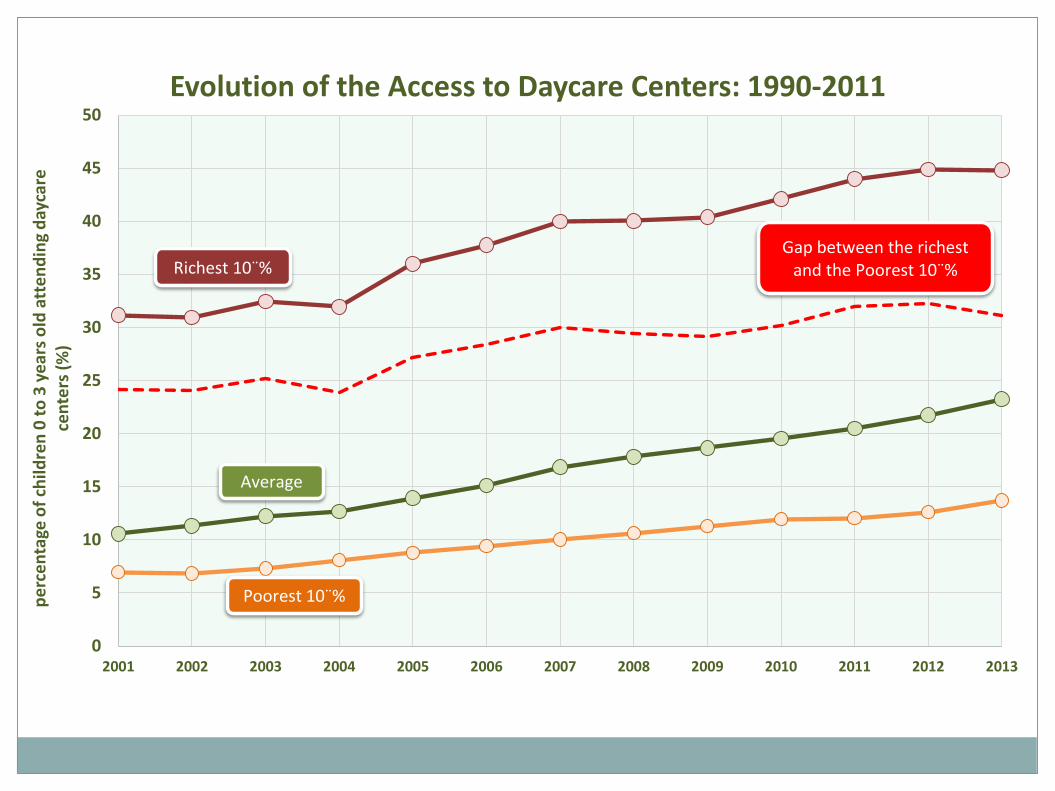
)Evolution of the Access to Daycare Centers: 1990-2011
Poorest 10¨%
Richest 10¨%
Average
Access of the rich is three times the access
of the poor
0
5
10
15
20
25
30
35
40
45
50
2001 2002 2003 2004 2005 2006 2007 2008 2009 2010 2011 2012 2013
perc
enta
ge o
f chi
ldre
n 0
to 3
yea
rs o
ld a
tten
ding
day
care
ce
nter
s (%
)Evolution of the Access to Daycare Centers: 1990-2011
Poorest 10¨%
Richest 10¨%
Average
Gap between the richest and the Poorest 10¨%

0
1
2
3
4
5
6
7
8
9
10
11
12
0 5 10 15 20 25 30 35 40 45 50 55 60 65 70 75 80
perc
enta
ge b
elow
the
extr
eme
pove
rty
line
(%)
Age (yeas)
Age profile of extreme poverty in Brazil: 2013
Extreme poverty among families with children remains
twice the national average

Source: Growing old in an older Brazil : implications of population aging on growth, poverty,public finance and service delivery / Michele Gragnolati, et al. Washington D.C.: The World Bank, 2011. p. 12.
Ratio of net per capita public transfers (elderly to children)

Presentation Plan
1. The importance and the components of early childhood comprehensive attention is known
2. Defining the roles of family and government in the provision of comprehensive care.
3. Brazilian Progress and the need for continuity4. Monitoring child development5. What is needed I? Focus on positive rights6. What is needed II? Integration of public programs and
between public and private actions 7. What do we need to know? Sequencing


Canada is a signatory to the United Nations Convention on the Rights of the Child, which commits us to ensuring that all children are provided with the opportunities they need to develop cognitively,
physically, socio-emotionally and spiritually. The ability to comply with this commitment requires
a system that monitors early childhood outcomes.How else can we guarantee that all children and
their families have the support and resources they need to thrive?
Canadian Early Years TaskForceMembers: Robin Williams MD (Chair until June 30, 2011); Sue Bennett MD; Jean Clinton MD; Clyde Hertzman MD; Denis Leduc MD; Andrew Lynk MD
Principal authors: Clyde Hertzman MD; Jean Clinton MD; Andrew Lynk MD
Monitoring is Necessary

“In this statement, the Canadian Pediatric Society
calls on federal and provincial/territorial governments to measure and monitor
the developmental progress of children in Canada”
Canadian Early Years Task ForceMembers: Robin Williams MD (Chair until June 30, 2011); Sue Bennett MD; Jean Clinton MD; Clyde Hertzman MD; Denis Leduc MD; Andrew Lynk MD
Principal authors: Clyde Hertzman MD; Jean Clinton MD; Andrew Lynk MD


Vulnerability Coverage of daycare and pre-school

Evolution of the percentage of children with development at least as expected: 2010-2012
percentage of children with development at least as expected: 2010
perc
enta
ge o
f chi
ldre
n w
ith d
evel
opm
ent
at le
ast a
s exp
ecte
d: 2
012
Improving
worsening

Communication Gross Motor Fine Motor Problem Solving Personal-Social Scale
510 milestones

Presentation Plan
1. The importance and the components of early childhood comprehensive attention is known
2. Defining the roles of family and government in the provision of comprehensive care.
3. Brazilian Progress and the need for continuity4. Monitoring child development5. What is needed I? Focus on positive rights6. What is needed II? Integration of public programs and
between public and private actions 7. What do we need to know? Sequencing
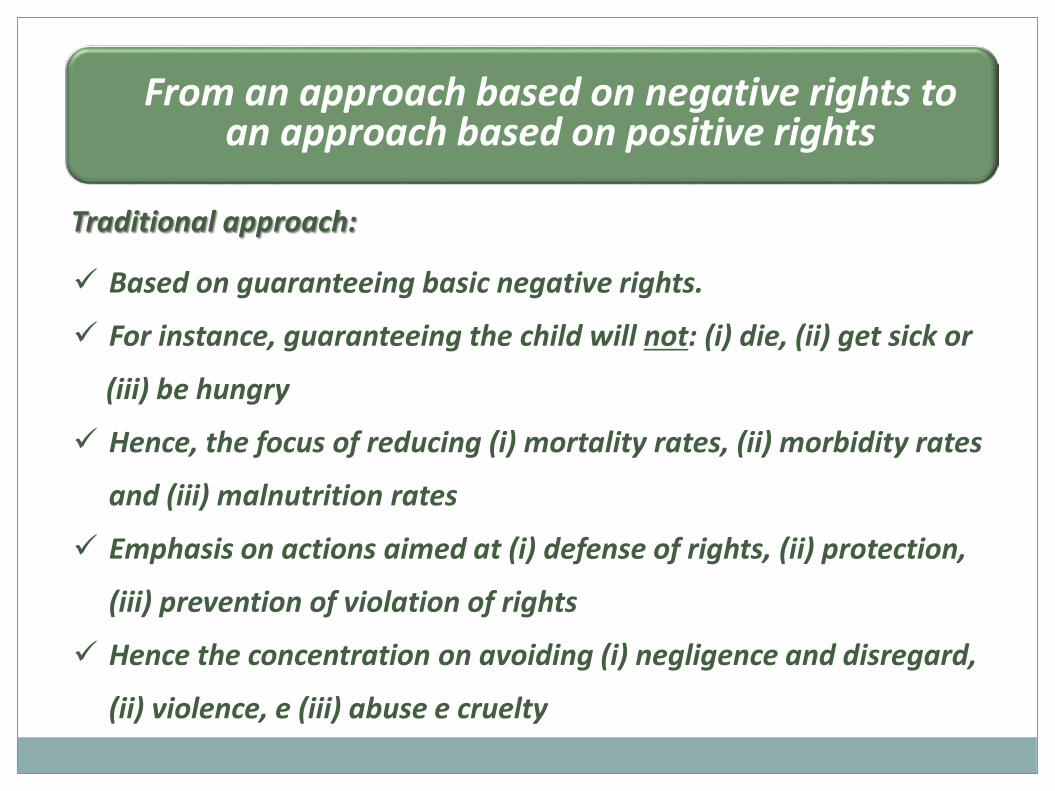
From an approach based on negative rights to an approach based on positive rights
Traditional approach:
Based on guaranteeing basic negative rights.
For instance, guaranteeing the child will not: (i) die, (ii) get sick or
(iii) be hungry
Hence, the focus of reducing (i) mortality rates, (ii) morbidity rates
and (iii) malnutrition rates
Emphasis on actions aimed at (i) defense of rights, (ii) protection,
(iii) prevention of violation of rights
Hence the concentration on avoiding (i) negligence and disregard,
(ii) violence, e (iii) abuse e cruelty
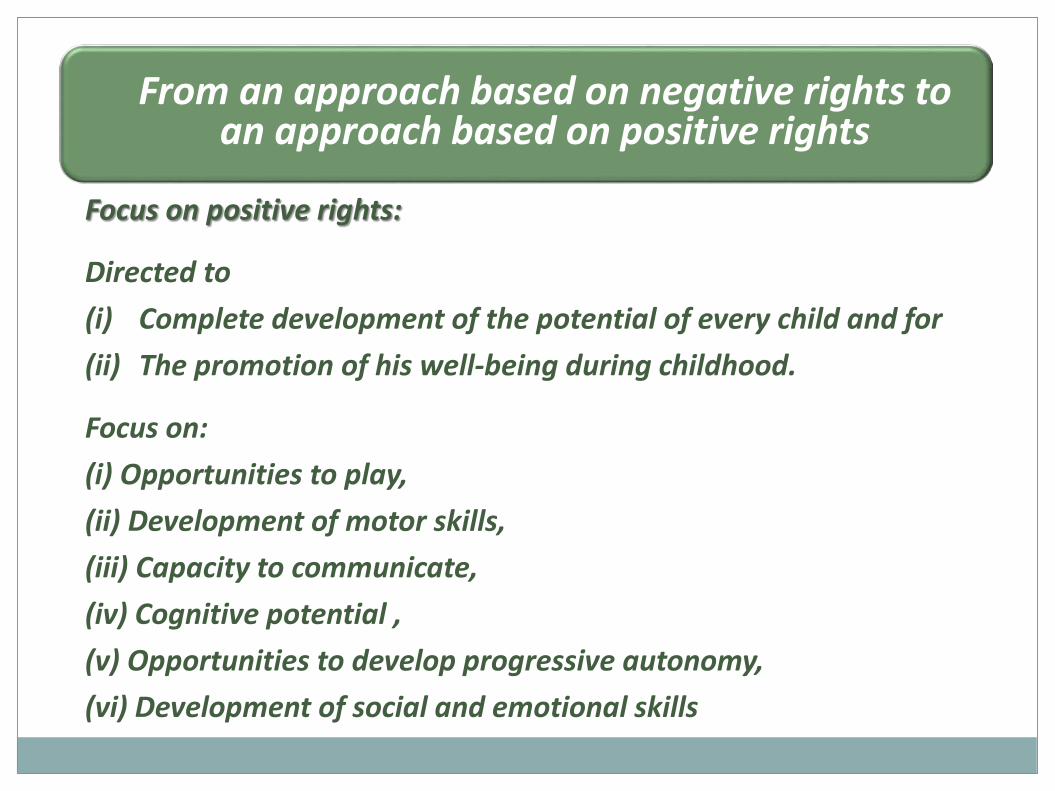
Focus on positive rights:
Directed to(i) Complete development of the potential of every child and for(ii) The promotion of his well-being during childhood.
Focus on: (i) Opportunities to play, (ii) Development of motor skills, (iii) Capacity to communicate, (iv) Cognitive potential , (v) Opportunities to develop progressive autonomy,(vi) Development of social and emotional skills
From an approach based on negative rights to an approach based on positive rights

Focus on positive rights:
Emphasis on child development
Require actions of four types:
(i) Opportunities necessary for each child to develop his full potential; (ii) Condition for each child be able to fully benefit from the available opportunities;(iii) Information and advise for parents to ensure their children have and effective access to the available opportunities;(iv) Stimulation, interaction and incentives to ensure children fully benefit from the available opportunities
From an approach based on negative rights to an approach based on positive rights

Presentation Plan
1. The importance and the components of early childhood comprehensive attention is known
2. Defining the roles of family and government in the provision of comprehensive care.
3. Brazilian Progress and the need for continuity4. Monitoring child development5. What is needed I? Focus on positive rights6. What is needed II? Integration of public programs and
between public and private actions 7. What do we need to know? Sequencing
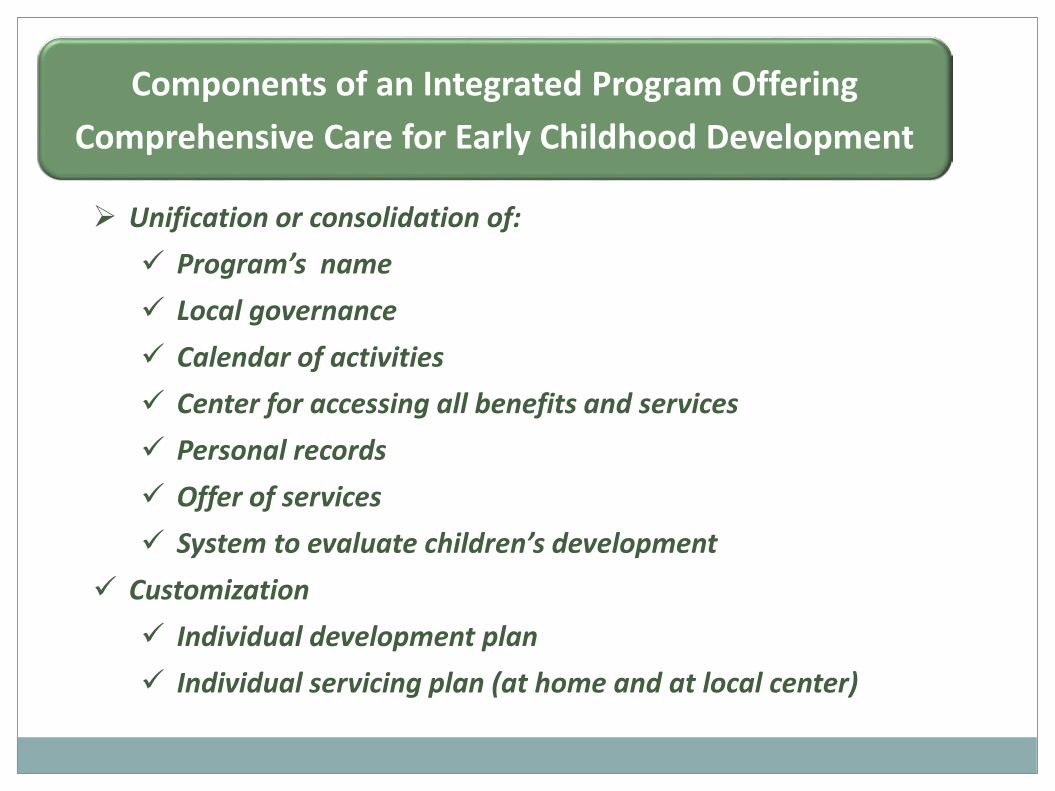
Unification or consolidation of: Program’s name Local governance Calendar of activities Center for accessing all benefits and services Personal records Offer of services System to evaluate children’s development
Customization Individual development plan Individual servicing plan (at home and at local center)
Components of an Integrated Program Offering Comprehensive Care for Early Childhood Development

To promote the complete development of the potential of each child;
To ensure all parents can give to their children the best available attention, care and opportunities;
To take advantage of all synergies among all sectorial actions and services available in the community;
To promote intense community participation in providing comprehensive care for early childhood development.
Objectives of an Integrated Program Offering Comprehensive Care for Early Childhood Development

Presentation Plan
1. The importance and the components of early childhood comprehensive attention is known
2. Defining the roles of family and government in the provision of comprehensive care.
3. Brazilian Progress and the need for continuity4. Monitoring child development5. What is needed I? Focus on positive rights6. What is needed II? Integration of public programs and
between public and private actions 7. What do we need to know? Sequencing

Phases in the Construction of a System to Provide Comprehensive Care to Early
Childhood Development
1. Expansion of coverage of programs devoted to early childhood development
2. Improvements on the quality of public and private services
3. Integration of available supply of services and programs aimed at early childhood development

Ricardo Barros – Insper-IASMirela de Carvalho – Instituto Unibanco
Samuel Franco – Instituto UnibancoRosane Mendonça – UFF
Pedro Olinto – World BankAndrezza Rosalém – IJSN
The Impact of the Availability and Quality of Daycare Centers on
Child Development
University of Nebraska - Lincoln, August 2015

A. On the Impact of the Qualityof Services

Coefficient P-value(%) Coefficient P-value(%)
The impact on educational performance
Finally achieved educational level -0.07 33 0.63 8Probability of completing 8th grade -0.14 63 0.27 0Probability of completing secondary education -0.05 85 0.18 1Probability of going to college -0.06 91 0.35 0Probability of having completed 4th grade before age 14 -9.47 34 0.65 2Probability of having completed 8th grade before age 18 7.65 97 0.41 23Probability of having completing secondary educational before age 25 0.65 6 0.05 9Probability of entering college before age 25 0.67 18 0.50 2
The impact on labor market outcomes
Labor force participation rate (women 25 to 64 years old) 0.67 54 -0.10 16Occupation rate (women 25 to 64 years old) 0.78 53 -0.07 27Labor income (men 25 to 64 years old) -0.06 61 0.06 7
Impact of an extra year of daycare and pre-school on educational performance, labor force participation and income
Source: Barros, Ricardo and Mendonça, Rosane. Uma avaliação dos custos e benefícios da educação pré-escolar no Brasil, July, 1999, IPEA.Note: This study was used as a background paper for: Young, Mary Eming. From Early Child Development to Human Development: Investing in Our Children's Future
-0.05 0
Outcome
Repetition rate (ratio between the number of years spent on school and the number of grades completed) -0.01 80
Daycare Pre-school

Four alternative interpretations
1. Statistically non significant estimates result from the poor quality of the data
2. Weak statistical results are caused by fragile identification strategy (problems with internal validity)
3. Small impact results from the low quality of daycare services in the past (problems with external validity)
4. Daycare really do not have important impacts on child development

Main issues
How important is the quality of daycare services for
child development?
To which extent does the extra cost of quality
compensate for its additional impact?

Diagram 1: Relationship between quality and cost of daycare services and child development
Quality of daycare services Child development
Cost of the
daycare services
Quality of the
daycare services
h
g

Nature of Data Collection
Evaluation of the economic cost of 100 daycare centers in Rio de Janeiro Municipality.
Objective evaluation of the quality of these 100 daycare centers (469 items, 15 dimensions).
Evaluation of the development age of a sample of 10 children per daycare center (total of 1000 children evaluated).
Collection of information on family socioeconomic conditions for each child in the study (household survey).

1.1. Physical Space 5 5
1.2. Building and Land Structures 9 58
1.3. Safety and Environmental Health Material Conditions 2 42
1.4. Material and Furniture for Children's Use 4 39
2.1. Personal Hygiene 7 55
2.2. Personal Hygiene Routine 6 56
2.3. Methods of Health and Safety Conditions 2 34
3.1. Practices of Oral Language and Comprehension 2 12
3.2. Psicomotor Activities 2 18
3.3. Crative Activities 6 35
3.4. Social Development 3 30
3.5. Curricular Structure 4 46
4.1. Human Resources 7 7
4.2. Educator's Necessity 2 17
5. Parents and Community Relations 5.1. Day care's relationship with Family and Community 2 15
Total 15 63 469
Source: Estimates based on the survey "Evaluation of Daycare Services in the Municipality of Rio de Janeiro", 2001 IPEA/UNESA.
3. Activities and Program Structure
4. Human Resources
Macro-dimensions Dimensions Sub-dimensions Indicators
1. Infrastructure
2. Health and Sanitation
Municipality of Rio de JaneiroComposition of the Day Care Quality Indicator

Coefficient P-value (%)
Intercept -0,272 6
Gender (man) -0,039 21
Race (white) -0,018 59
Presence of the mother -0,109 15Years of schooling of the person responsible for the child 0,002 68
Ln family per capita income (R$/month) 0,017 50
Number of observations
R 2- adjusted
Relationship between the logit of daycare center overall quality indicator, child characteristics and
family background - Rio de Janeiro municipality, 2001 -
Source: Estimates produced based on the research “Evaluation of Daycare Services in the Municipality of Rio de Janeiro, 2001”.
Variable
0,00
752
Child characteristics
Family background

Value
14
15 minutes 73
30 minutes 96
84
Distance from home to daycare centers: Rio de Janeiro municipality
Source 2: Estimate based on the "Cadastro da Pré-Matrícula das Creches Municipais da Secretaria Municipal de Educação da Cidade do Rio de Janeiro - 2009".
Indicator
Percentage of children taken from home to daycare center at most 1 (%):
Percentage of children applying to daycare centers who live in the same neighborhood the daycare center is located 2(%):
Average time spent to daycare centers (minutes) 1
Source: Estimates produced based on the research “Evaluation of Daycare Services in the Municipality of Rio de Janeiro, 2001”.

y = 0,08x + 0,88R² = 0,03
0,20
0,30
0,40
0,50
0,60
0,70
0,80
0,90
1,00
0,20 0,30 0,40 0,50 0,60 0,70 0,80 0,90 1,00
Subj
ectiv
e qu
ality
Objective quality
Relationship between objective and subjective measures of quality: Rio de Janeiro - 2001
Fonte: Estimativas produzidas com base na pesquisa Avaliação dos serviços das creches municipais do município do Rio de Janeiro, de 2001.

Months Standard Deviation
Quality 4,13 1,2 17% 11
Logarithm of Quality 1,78 1,3 18% 9
Quality Logit 0,97 1,2 17% 11
Quality 0,103 1,3 18% 17
Logarithm of Quality 0,043 1,3 18% 16
Quality Logit 0,024 1,2 18% 17
Source: Estimates based on the survey "Evaluation of Daycare Services in the Municipality of Rio de Janeiro", 2001 IPEA/UNESA.Technical Notes: The model includes controls for child age, gender, race, presence of parents, household head years of schooling and per capita income. Sample Size: 752 children. R2 range from 0.64 and 0.66.
Municipality of Rio de Janeiro, 2001
P-value (%)
Impact of Daycare Quality Centers on Child Overall Development
Age of Development
Log Age of Development
Specification Regression Coefficient
Impact of Attending a High-Quality versus Low-Quality Day Care in terms of:

Coefficient P-value (%) Coefficient P-value (%) Coefficient P-value (%)
Intercept 8,6 0 10,1 0 9,6 0
Daycare Center Scale
Logarithm of day care size (number of full-time equivalent children)
-0,4 0 -0,37 0 -0,37 0
Daycare Center's Quality
Function of the overall measure of quality 1,9 0 0,73 0 0,44 0
Impact on the costs of offering high-quality as opposed to low-quality services
72% 68% 72%
Number of Observations
Adjusted R2
Source: Estimates based on the survey "Evaluation of Daycare Services in the Municipality of Rio de Janeiro", 2001 IPEA/UNESA.Technical Note: Dependent variable: Logarithm of unit cost.
0,33 0,31 0,32
Explanatory Variables
Quality of Day Care (specification)
Linear Logarithmic Logit
109 109 109
Relationship between Annual Unit Cost and Daycare Center's QualityMunicipality of Rio de Janeiro, 2001
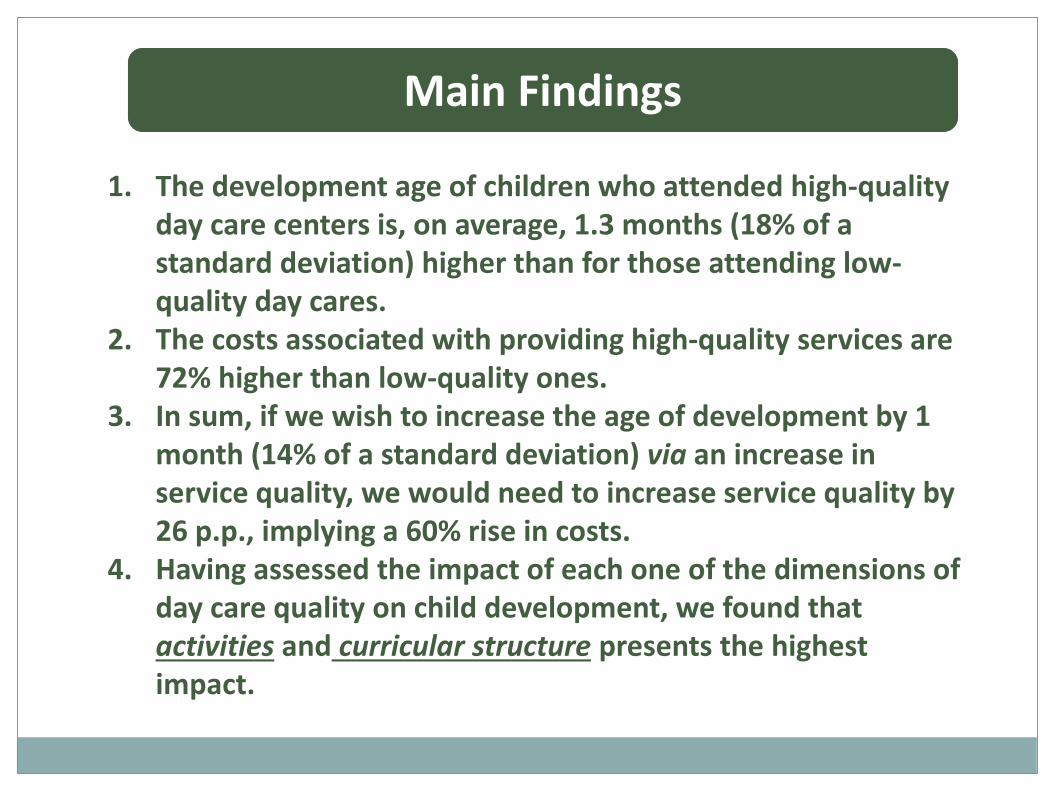
Main Findings
1. The development age of children who attended high-quality day care centers is, on average, 1.3 months (18% of a standard deviation) higher than for those attending low-quality day cares.
2. The costs associated with providing high-quality services are 72% higher than low-quality ones.
3. In sum, if we wish to increase the age of development by 1 month (14% of a standard deviation) via an increase in service quality, we would need to increase service quality by 26 p.p., implying a 60% rise in costs.
4. Having assessed the impact of each one of the dimensions of day care quality on child development, we found that activities and curricular structure presents the highest impact.

B. On the Impact of Fulltime PublicDay Care on Child Development

The Lottery Design
Approximately 25,000 children applied for the 12,000 open slots in the 243 daycare centers
Of these, approximately 24,000 were eligible
Randomization was done by grade and center (depending on the slots available in each grade of each center)
Each child was given a “ranking”
Control children were put in a waiting list
Evaluating the Success of The Randomization Process

Family per capita income cumulative distribution
0
10
20
30
40
50
60
70
80
90
100
0 25 50 75 100 125 150 175 200 225 250 275 300
Family per capita income (R$/month)
Perc
enta
ge o
f the
pop
ulat
ion
Beneficiaries
Waiting list

Sample Design and Attrition Sample of 4350 children from 209 lotteries
(combinations of age group and daycare) Balanced sample 5 to 20 treatment and controls for
each lottery Sample draw from top of list (treatment) and
bottom of list (control) No significant attrition bias: 87% (3777) children
found in the 2008 household survey Balanced attrition: 49.4% treatments, 50.6% controls Short questionnaire collected in mid-2008 covering
contact information, maternal labor supply and depression and family income

Treatment Control
93,9 55,0
93,9 46,5
Attend the daycare the child has applied 91,6 37,6
Attend other public daycare 2,2 8,8
0,0 8,5
Attend non public non free daycare 0,0 4,3
6,1 36,5
0,0 35,0
0,0 1,5
6,1 8,6
Do not attend daycare
Stay home
Attend public daycare
Exposure
"Mãe crecheira" or stay in community facilities
Others
Exposure, No Show and Contamination
Attend daycare
Attend non public daycare

2012 Follow-up
Survey collected in second half of 2012, 4-5 years after initial enrolment Data collected just in six of the 10 regions of the city Each household visited by 2 enumerators One was a student of psychology, administering
developmental assessments to children The other one would conduct a household survey with a
single household respondent
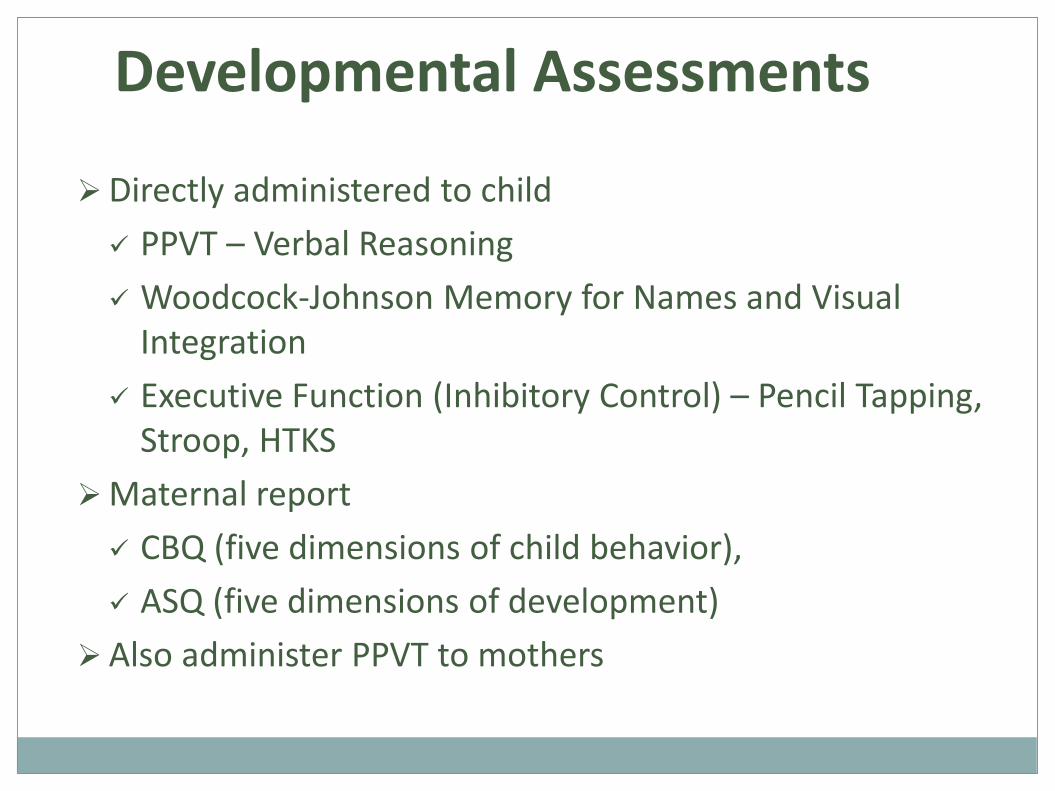
Developmental Assessments
Directly administered to child PPVT – Verbal Reasoning Woodcock-Johnson Memory for Names and Visual
Integration Executive Function (Inhibitory Control) – Pencil Tapping,
Stroop, HTKSMaternal report CBQ (five dimensions of child behavior), ASQ (five dimensions of development)
Also administer PPVT to mothers

Household Survey
Demographics Income and Labor Supply Time use (for child “guardian” figure) Basic expenditure (e.g., food) Basic assets and durables Child care history HOME environmentsMaternal depression

Impact of going to a fulltime public daycare center on working memory
without access with access
Equivalent to a 11 percentage points upward movement in the
distribution

Impact of going to a fulltime public daycare center on inhibitory control
without access with access
Equivalent to a 16 percentage points upward movement in the
distribution