challenges for energy efficiency in local and regional data centers
TRANSCRIPT

Challenges for Energy Efficiency in Localand Regional Data Centers
G. Koutitas1 and P. Demestichas2
1School of Science and Technology, International Hellenic University, Thessaloniki,Greece; e-mail: [email protected] of Digital Systems, University of Piraeus, Piraeus, Greece;e-mail: [email protected]
Abstract
This paper investigates challenges for achieving energy efficiency in localand regional datacenters. The challenges are divided into operational andplanning categories that must be considered for the green transformation ofthe datacenter. The study shows that the standardization of the used metricsand guidelines are necessary for the reduction of the carbon emissions relatedto data centers. The paper presents a review of the available metrics and mostmodern techniques for energy efficiency. Numerous examples and reviews arediscussed that introduce the reader to the most modern green technologies.Finally, the correlation of the energy efficient techniques to the overall carbonemissions is highlighted. It is shown that a green data center not only presentsminimum operational expenditures but also produces low carbon emissionsthat are important to achieve sustainability in modern societies.
Keywords: data center design, energy efficiency of data center, energyefficient metrics, data center carbon footprint computation.
1 Introduction
Energy efficiency and low carbon strategies have attracted a lot of concern.The goal for 20% energy efficiency and carbon reduction by 2020 drovethe Information Communication Technologies (ICT) sector to strategies that
Journal of Green Engineering, 1–32.c© 2010 River Publishers. All rights reserved.

2 G. Koutitas and P. Demestichas
incorporate modern designs for a low carbon and sustainable growth [1, 2].The ICT sector is part of the 2020 goal and participates in three differentways. In the direct way, ICT are called to reduce their own energy demands(green networks, green IT), in the indirect way ICT are used for carbondisplacements and in the systematic way ICT collaborate with other sectorsof the economy to provide energy efficiency (smartgrids, smart buildings,intelligent transportations systems, etc.). ICT and in particular data centershave a strong impact to the global CO2 emissions. Moreover, an importantpart of the OPEX is due to the electricity demands. This paper presents thesources and challenges that have to be addressed to reduce carbon emissionsand electricity expenses of the sector.
The data center is the most active element of an ICT infrastructure thatprovides computations and storage resources and supports respective ap-plications. The data center infrastructure is central to the ICT architecture,from which all content is sourced or passes through. Worldwide, data centresconsume around 40,000,000,000 kW/hr of electricity per year and a big por-tion of this consumption is wasted due to inefficiencies and non-optimizeddesigns. According to the Gartner Report [3], a typical data center consumesthe same amount of energy as 25000 households per year, and the electricityconsumption by data centers is about 0.5% of the world production. In termsof carbon emissions this power consumption pattern is identical to the airlineindustry and comparable to emissions generated by Argentina, Malaysia orthe Netherlands.
Energy efficiency in ICT is defined as the ratio of data processed over therequired energy (Gbps/Watt) and is different than power conservation wherethe target is to reduce energy demands without considering the data volume.Taking into consideration this ratio, green IT technologies have importantbenefits in terms of
• reduce electricity costs and OPEX;• improve corporate image;• provide sustainability;• extend useful life of hardware;• reduce IT maintenance activities;• reduce carbon emissions and prevent climate change;• provide foundations for the penetration of renewable energy sources in
IT systems.
The demand for high speed data transfer and storage capacity together withthe increasingly growth of broadband subscribers and services will drive the

Energy Efficiency in Local and Regional Data Centers 3
green technologies to be of vital importance for the telecommunication in-dustry, in the near future. Already, recent research and technological papersshow that energy efficiency is an important issue for the future networks. In[2] a review of energy efficient technologies for wireless and wired networksis presented. In [4] the design of energy efficient WDM ring networks ishighlighted. It is shown that energy efficiency can be achieved by increas-ing the CAPEX of the network, by reducing the complexity and by utilizingmanagement schemes. The case of thin client solutions is investigated in [5]and it is shown that employing power states in the operation of a data centercan yield energy efficiency. Efforts have been cited related to agreeing andenabling standard efficiency metric, real time measurement systems, model-ling energy efficiency, suggesting optimal designs, incorporating renewableenergy sources in the data center and developing sophisticated algorithmsfor designing and managing the data centers. These approaches have beenpublished by various companies, experts in the field and organizations [6–17].
Although the IT industry has begun “greening” major corporate datacenters, most of the cyber infrastructure on a university campus or SMEsinvolves a complex network of ad hoc and suboptimal energy environments,with clusters placed in small departmental facilities. This paper investigateschallenges for achieving energy efficiency in local and regional data cen-ters and reviews the most recent achievements in this direction. The paperis organized as follows. In Section 2 the data center infrastructure and thepower consumption associated to each part are examined. Section 3 presentsa review of the derived energy efficiency metrics found in the literature andthe effect of energy efficiency to carbon emissions is examined. In Section 4we investigate energy efficient techniques.
2 Data Center Infrastructure and Power Consumption
2.1 Data Center Infrastructure
Data centers incorporate critical and non-critical equipments. Critical equip-ments are related to devices that are responsible for data delivery and areusually named as IT equipments. Non-critical equipments are devices re-sponsible for cooling and power delivery and are named as Non CriticalPhysical Infrastructure (NCPI). Figure 1 presents a typical data center blockdiagram [18, 19].
The overall design of a data center can be classified in four categoriesTier I–IV each one presenting advantages and disadvantages related to power

4 G. Koutitas and P. Demestichas
Figure 1 Typical data center infrastructure [18, 19].
consumption and availability [18, 19]. In most cases availability and safetyissues yield to redundant N +1, N +2 or 2N data center designs and this hasa serious effect on power consumption. According to Figure 1, a data centerhas the following main units:
• Heat Rejection – is usually placed outside the main infrastructure andincorporates chillers, drycoolers and present an N + 1 design.
• Pump Room – they are used to pump chilled water between drycoolersand CRACs and present an N + 1 design (one pump in standby).
• Switchgear – it provides direct distribution to mechanical equipment andelectrical equipment via the UPS.
• UPS – Uninterruptible Power Supply modules provide power supply andare usually designed with multiple redundant configurations for safety.Usually 1000 kVA to 800 kW per module.
• EG – Emergency Generators supply with the necessary power the datacenter in case of a breakdown. Usually diesel generators.
• PDU – Power Distribution Units for power delivery to the IT. Usually200 kW per unit and dual PDUs (2N) for redundancy and safety.
Energy Efficiency in Local and Regional Data Centers 5
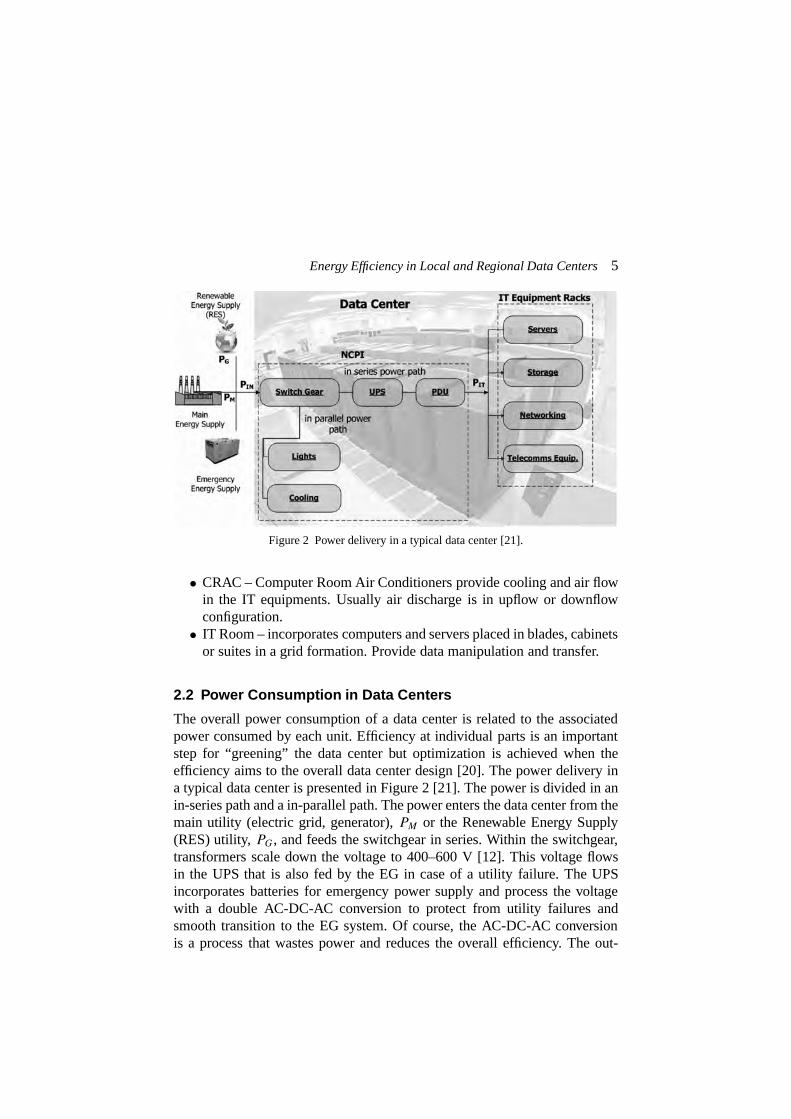
Figure 2 Power delivery in a typical data center [21].
• CRAC – Computer Room Air Conditioners provide cooling and air flowin the IT equipments. Usually air discharge is in upflow or downflowconfiguration.
• IT Room – incorporates computers and servers placed in blades, cabinetsor suites in a grid formation. Provide data manipulation and transfer.
2.2 Power Consumption in Data Centers
The overall power consumption of a data center is related to the associatedpower consumed by each unit. Efficiency at individual parts is an importantstep for “greening” the data center but optimization is achieved when theefficiency aims to the overall data center design [20]. The power delivery ina typical data center is presented in Figure 2 [21]. The power is divided in anin-series path and a in-parallel path. The power enters the data center from themain utility (electric grid, generator), PM or the Renewable Energy Supply(RES) utility, PG, and feeds the switchgear in series. Within the switchgear,transformers scale down the voltage to 400–600 V [12]. This voltage flowsin the UPS that is also fed by the EG in case of a utility failure. The UPSincorporates batteries for emergency power supply and process the voltagewith a double AC-DC-AC conversion to protect from utility failures andsmooth transition to the EG system. Of course, the AC-DC-AC conversionis a process that wastes power and reduces the overall efficiency. The out-

6 G. Koutitas and P. Demestichas
Figure 3 Power consumption by various parts of a data center (system refers to motherboards,fans, etc.) [19].
put of the UPS feeds the PDUs that are placed within the main data centerroom. The PDUs break the high voltage from the UPS into many 110–220 Vcircuits to supply the electronic equipments. Finally, power is consumed forthe IT processes namely as storage, networking, CPU and in general datamanipulation.
The parallel path feeds the cooling system that is important for the heatprotection of a data center. The cooling system is also connected to the EGsince without cooling a typical data center can operate for a few minutesbefore getting overheated. The cooling system incorporates fans and liquidchillers. The power distribution of these processes in an inefficient data centeris presented in Figure 3 [19, 27]. It can be observed that almost 70% ofthe power is consumed for non-critical operations like cooling and powerdelivery and conversion and 30% is used by the IT equipments. Of course, aportion of this percentage is also wasted for networking, CPU, fans, storageand memory processing [19]. In other words, the useful work of the data

Energy Efficiency in Local and Regional Data Centers 7
center is associated to a percentage of power, smaller than the 30% deliveredto the IT equipments.
The power consumption pattern presented in Figure 3 is not constant withtime but varies according to different parameters. The main are the work-load of the data center and the outside environment. Modelling the energyefficiency and the losses of the data center’s equipments is a complex tasksand crucial simplificative assumptions yielded great errors. First of all, theassumption that the losses associated to the power and cooling equipments areconstant with time is wrong. It has been observed that the energy efficiencyof these equipments is a function of the IT load and presents a nonlinear be-haviour. In addition, these equipments are usually operating at lower than themaximum capacity loads and this increases the losses of the system. Finally,the heat generated by the NCPI equipments is not insignificant. In general,the losses of NCPI equipments are highly correlated to the workload of thedata center in a complex nonlinear relationship [21].
According to the input workload the losses of NCPI equipments can becategorized as follows:
• No load losses – Losses that are fixed even if the data center has noworkload. The loss percentage increases with decrease of load.
• Proportional losses – Losses that depend linearly on workload. The losspercentage is constant with load.
• Square law losses – Losses that depend on the square of the workload.These losses appear at high workloads (over 90%). The loss percentagedecreases with a decrease of load.
The IT equipment also present non-constant losses and variable energyefficiency that depends on the input workload. Based on these observationsit is concluded that energy efficiency of a data center is a complicate factorparameter, non-constant with time. For this reason, techniques for measuringand predicting the data center’s energy efficiency is of great importance.
2.3 Sources of Losses at Data centers
The operation of data centers suffers great inefficiencies and a great amountof power is wasted for the operation of non-critical equipments and for theproduced heat by the electronic equipments. The main disadvantage of realdata centers is that a great amount of energy is wasted for cooling or it istransformed to heat because of the inefficient operation of electronic equip-

8 G. Koutitas and P. Demestichas
ments that can be NCPI or IT type. The main causes of power are summarizedas
• Power units (UPS, Transformers, etc.) operate below their full loadcapacities.
• UPS are oversized to the actual load requirements in order to avoidoperating near their capacity limit.
• Air conditioning equipment consumes extra power in order to delivercool air flow at long distances.
• Inefficient UPS equipments.• Blockages between air conditioners and equipments that yield to ineffi-
cient operation.• No virtualization and consolidation.• Inefficient servers.• No closed coupling cooling.• No efficient lighting.• No energy management and monitoring.• Underutilization due to N + 1 or 2N redundant designs.• Oversizing of data center.• Under-floor blockages that contribute to inefficiency by forcing cool-
ing devices to work harder to accommodate existing load heat removalrequirements.
The procedure to transform a data center into an energy efficient one(green data center) is complex and it can only be achieved by targeting bothindividual part optimization that can be considered as operational costs andoverall system performance that can be considered as planning actions. Ac-cording to Figures 2 and 3, the optimized operation of the data center requiresthe input power to be minimized without affecting the operation of the ITequipments.
3 Energy Efficiency Metrics
3.1 Review of Metrics
The energy efficiency of a data center is a complicate non-constant parameterthat depends on the input workload and environmental conditions and itsestimation has attracted a lot of research. In order to investigate and proposedirections to optimize energy consumption in a data center it is important toquantize its performance. This can be achieved by using a standard metric tomeasure the inefficiencies. In past years the efficiency was incorrectly calcu-

Energy Efficiency in Local and Regional Data Centers 9
lated by just adding the efficiencies of the individual parts as published by themanufacturers. This yielded great inaccuracies and overestimations and theneed for a standard metric and accurate model was obvious. As an example,the efficiency of a UPS system is measured as the kWout over the kWin at fullload. According to the workload that enters the UPS, the efficiency can varyfrom 0% at no load to 95% at full load in a nonlinear way [21]. Taking intoconsideration that common data centers operate at 30–40% of their maximumcapacity workloads, the efficiency of the UPS cannot be considered constantand equal to the imposed by the manufacturer value.
In general energy efficiency in the telecommunication industry is relatedto
Energy Efficiency ∼ Joule
bit∼ Watt
Gbps∼ Watt
bitrate/Hz(spectral efficiency)
(1)The optimal description of this value depends on the system’s characterist-ics and the type of equipment. As an example, for modulation and codingtechniques in wireless communications the spectral efficiency is a commonmeasure. For electronic components the ratio of joule per bit best describesperformance. In telecommunication networks and data centers the ratio ofWatts consumed over the Gbps of data processed is preferred. In [22] anabsolute energy efficiency metric is introduced, called dBε. The metric iscomputed according to the following equation:
dBε = 10 log10
[Power/bitrate
kT ln 2
](2)
where k is the Boltzman’s constant and T is the absolute temperature (300 K).The value kT ln 2 represents the minimum energy dissipated per bit of in-formation. Characteristic values of common systems are presented in Table 1[22]. The smaller the dBε value is, the greater the achieved efficiency.
Data centers’ energy efficiency can be broadly defined, according to (1) asthe amount of useful computation divided by the total energy used during theprocess. The development of a standard metric has attracted a lot of researchand initiatives have commenced by the green grid association [23]. The greengrid has established metrics according to the infrastructure efficiency and thedata center performance efficiency.
Data centers encounter power waste in the non-critical equipments and inthe critical equipments. The metrics that best define the non-critical equip-ments’ efficiency are the Power Usage Effectiveness (PUE) and the DataCenter Efficiency (DCiE).

10 G. Koutitas and P. Demestichas
Table 1 Energy efficiency measured for typical systems.System Power Effective bitrate Energy/bit [J/b] dBε
BT network 1 GWatt 22 Tb/s 45 × 10−6 162Dell laptop 80 Watt 1.87 GHz (clock) 42.8 × 10⁻⁹ 131.7Ultra-low power DSL/fiber 165 mWatt 10Mb/s 16.5 × 10⁻⁹ 127.6Tb/s router 10 kWatt 1Tb/s 10 × 10−9 125.4Efficient CPU 2.8 Watt 1 Gflops 2.8 × 10⁻⁹ 119.9Efficient 10 Gb/s system 10 Watt 10Gb/s 1 × 10⁻⁶ 115.4Human brain 20 Watt 40 Tb/s 0.5 × 10⁻¹² 82.31 photon/bit 1.28n Watt 10 Gb/s 0.128 × 10⁻¹⁸ 16.5
PUE is defined as the ratio of the total facility input power over the powerdelivered to IT. DCiE is the inverse of PUE. According to the notation inFigure 2 this is written in mathematical form as
PUE = PIN
PIT= CLF + PLF + 1, 1 < PUE < ∞
DCiE = 1
PUE= PIT
PIN, 0 < DCiE < 1 (3)
where CLF represents the cooling load factor normalized to IT load (lossesassociated to chillers, pumps, air conditioners) and PLF represents the powerload factor normalized to IT load (losses associated to switchgear, UPS,PDU). These metrics characterize the performance or the power wasted inthe non-critical components of the data center. These are the cooling infra-structure and the power infrastructure. Figure 4 presents measured values ofPUE over 24 different data centers.
It can be observed that the mean value of the measured PUE is 1.83or 0.53 (53%) DCiE. This means that almost 53% of the power that entersthe data center is wasted for cooling and power delivery in the non-criticalcomponents. The remaining 47% is used for data processing. The infrastruc-ture efficiency metrics are variable in time and mainly depend on outdoorenvironmental conditions and traffic demands. For example in low temperat-ure periods, losses due to cooling are minimized. In addition, in low trafficperiods losses are increased since the data center is oversized.
In Figure 5 the NCPI efficiency metrics for two different data centers ispresented. It can be observed that data center A is more energy efficient thandata center B but at low input IT workload it is underutilized resulting to lessenergy efficiency.

Energy Efficiency in Local and Regional Data Centers 11
Figure 4 PUE measurements over 24 data centers [19].
The energy efficiency measure of the overall data center’s perform-ance is computed according to the DCeP (Data Center Performance) metricpresented by the green grid [24]. This metric is preferred for long term meas-urements of the performance of the data center and in a mathematical form itis computed according to (4)
DCeP = Useful Work
PIN=
m∑i=1
[Vi · Ui(t, T ) · Ti]EDC
(4)
The term “useful work” describes the number of tasks executed by the datacenter and PIN or EDC represents the consumed power or energy respectivelyfor the completion of the tasks. In the above formulation m is the numberof tasks initiated during the assessment window, Vi is a normalization factorthat allows the tasks to be summed, Ui is a time based utility function for eachtask, t is the elapsed time from initiation to completion of the task, T is theabsolute time of completion of the task, Ti = 1 when the task is completedduring the assessment window, or 0 otherwise.
The assessment window must be defined in such a way to allow the cap-ture of data center’s variation over time. The DCeP factor gives an estimateof the performance of the data center and is not as accurate as DCiE or PUEdue to its relativity. Proxies for computing the useful work according to the

12 G. Koutitas and P. Demestichas
Figure 5 DCiE efficiency metrics for two data centers as a function of IT load.
scenario of interest are presented in [24]. These proxies incorporate computa-tions regarding bits per kilowatt-hour, weighted CPU utilization, useful workself assessment and other cases.
In [9] a power to Performance Effectiveness (PPE) metric is introduced tohelp identify, at the device level, where efficiencies could be gained. It givesthe IT managers a view of performance levels within the data center. It iscomputed according to the following equation:
PPE = Actual Power Performance
Optimal Power Performance(5)
where the optimal power performance is computed as the ratio of the productof optimal server, optimal serever performance utilization, average Watts perserver over 1000. The factor optimal server is equal to rack density multipliedby the optimal percentage. The metric PPE is used at the device level andcompares its actual performance with the theoretical efficiency indicated bythe manufacturers.
A more generic approach to define the efficiency metric of a data centeris presented in [19]. The proposed efficiency metric combines the PUE (or

Energy Efficiency in Local and Regional Data Centers 13
DCiE) and DCeP. The formulation is
Efficiency = Computation
Total Energy(PIN)=
(1
PUE
)×
(1
SPUE
)×
(Computation
PIT
)
(6)where the factor SPUE represents the server energy conversion and capturesinefficiencies caused by non-critical equipments of the IT equipments. Thesecan be the server’s power supply, voltage regulator modules and cooling fans.SPUE is defined as the ratio of the total server input power over the usefulserver power, i.e the power consumed by motherboards, CPU, DRAM, I/Ocards, etc. The combination of PUE and SPUE measures the total lossesassociated to non critical components that exist in the data center’s NCPIand IT equipments.
In [25] the metric DPPE (Data Center Performance per Energy) is presen-ted that correlates the performance of the data center with carbon emissions.The metric follows the general rules presented in (4) and (6) and introducesone more factor for the green energy supply. In a mathematical form it is
DPPE = Data Center Work
Carbon Energy= ITEU × ITEE × 1
PUE× 1
1 − GEC(7)
where
ITEU = Total Measured Energy of IT [KWh]Total Specification Energy IT (by manufacturer) [KWh]
ITEE = a · ∑server capacity + b · ∑
storage capacity + c · ∑ NW capacity
Total Specification Energy IT (by manufacturer) [KWh]
GEC = Green Energy
DC Total Power Consumption
In the above formulation ITEU represents the IT equipment utilization, ITEErepresents the IT equipment energy efficiency, PUE represents the efficiencyof the physical infrastructure and GEC represents the penetration of renew-able (green) energy into the system. ITEU is the average utilization factorof all IT equipment included in the data center and can be considered as thedegree of energy saving by virtual techniques and operational techniques thatutilize the available IT equipment capacity without waste. ITEE is based onDCeP presented in (4) and it aims to promote energy saving by encouragingthe installation of equipment with high processing capacity per unit electricpower. Parameters a, b, c are weighted coefficients. PUE is defined in (3) and

14 G. Koutitas and P. Demestichas
is the efficiency of the physical infrastructure of the data center. Finally, GECis the available “green” energy that the data center is supplied additionally tothe grid electricity. It is also presented in Figure 2 as PG. The higher the valueof DPPE the less the carbon emissions it produces and more energy efficientit is.
3.2 Carbon Emission and Cost Effects
The carbon emissions caused by the operation of data centers are relatedto the consumed power. The grid electricity is responsible for CO2 emis-sions depending on the used material for energy conversion. In order toprovide a measure of carbon emissions, the energy is converted to gr ofCO2. This is subject to each country energy sources. The relationship isQ = 1 KWh ∼ XgrCO2. For anthracite electricity production X = 870,for gas electricity production X = 370 and for petroleum it is X = 950 [26].The used metric is TonsCO2/year. Therefore, the carbon footprint of a dataenter is computed according to [27]
KCO2 = 8.74 · 10−6 · P · X [TonsCO2/year] (8)
where P is shown in Figure 2 and represents the power in Watts consumedby the data center and is related to the grid electricity. In case the data centeris also supplied by green energy then the corresponding Watts in equation(8) would be equal to P = PM = PIN − PG (according to Figure 2). Theeffect of the data center efficiency DCiE and the type of power supply tothe produced carbon emissions is more obvious with the following example.Lets consider a data center that requires for the operation of the IT equipment,PIT = 300 KWatts. The data center is supplied with grid electricity producedby anthracite (X = 870 grCO2/KWh) and has also a G% renewable energysupply (PIN = GPG + (1 − G)PM). The comparison of the additional car-bon emissions produced by a data center with a non perfect infrastructureefficiency (0 < DCiE < 1) in relation to a 100% efficient data center(DCiE = 1) and relative to a data center that is supplied by G% of greenenergy is computed according to
CCO2 = 8.74 · 10−6 · PIT · 1
DCiE· (1 − G) [TonsCO2/year] (9)
where PIT is expressed in Watts. The effect of DCiE and green energy to theannual produced carbon emissions compared to a 100% efficient data centeris shown in Figure 6a).
Energy Efficiency in Local and Regional Data Centers 15
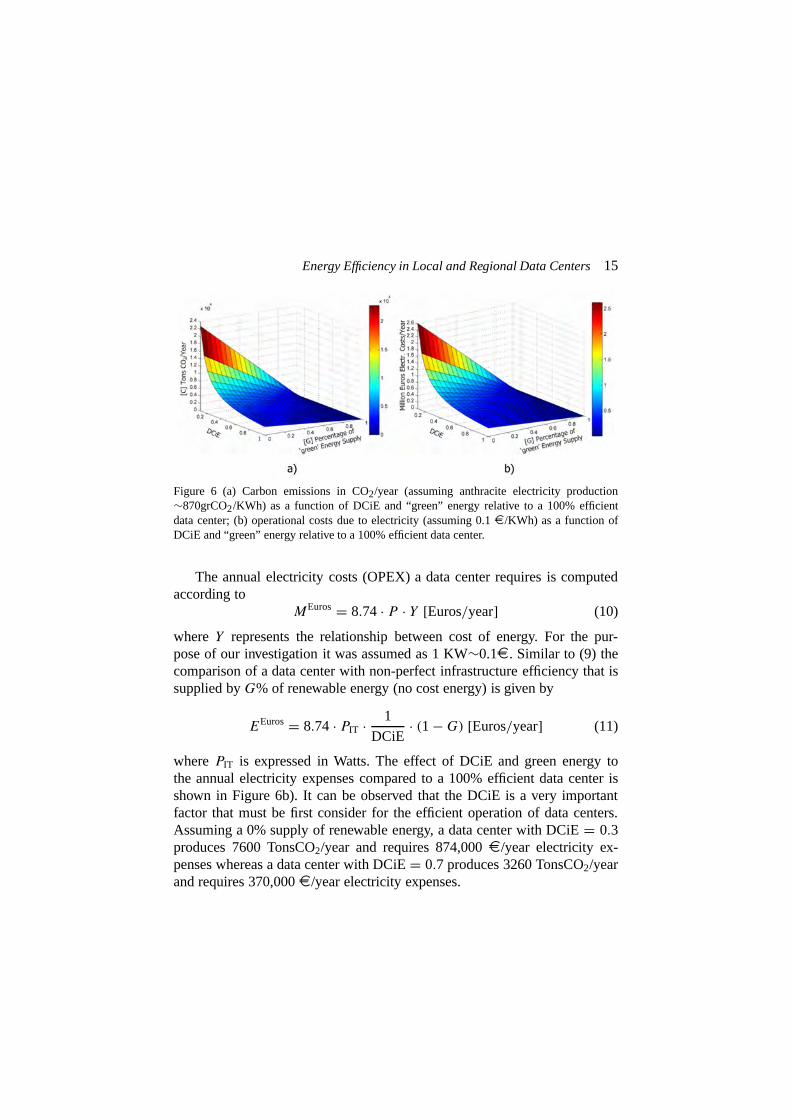
Figure 6 (a) Carbon emissions in CO2/year (assuming anthracite electricity production∼870grCO2/KWh) as a function of DCiE and “green” energy relative to a 100% efficientdata center; (b) operational costs due to electricity (assuming 0.1 ¤/KWh) as a function ofDCiE and “green” energy relative to a 100% efficient data center.
The annual electricity costs (OPEX) a data center requires is computedaccording to
MEuros = 8.74 · P · Y [Euros/year] (10)
where Y represents the relationship between cost of energy. For the pur-pose of our investigation it was assumed as 1 KW∼0.1¤. Similar to (9) thecomparison of a data center with non-perfect infrastructure efficiency that issupplied by G% of renewable energy (no cost energy) is given by
EEuros = 8.74 · PIT · 1
DCiE· (1 − G) [Euros/year] (11)
where PIT is expressed in Watts. The effect of DCiE and green energy tothe annual electricity expenses compared to a 100% efficient data center isshown in Figure 6b). It can be observed that the DCiE is a very importantfactor that must be first consider for the efficient operation of data centers.Assuming a 0% supply of renewable energy, a data center with DCiE = 0.3produces 7600 TonsCO2/year and requires 874,000 ¤/year electricity ex-penses whereas a data center with DCiE = 0.7 produces 3260 TonsCO2/yearand requires 370,000 ¤/year electricity expenses.

16 G. Koutitas and P. Demestichas
Figure 7 Directions for green data center transformation.
4 Challenges for Energy Efficiency
In general, efficiency can be achieved through the optimization of the opera-tion and the optimal planning. Moreover, standards can be engineered in orderto drive energy efficiency. This process incorporates the domains presentedin Figure 7.
4.1 Optimization of Operational Costs
The operational costs are associated to the optimization of individual equip-ments like the IT equipments and NCPI [14, 20].
4.1.1 IT EquipmentEfficiency of IT equipments is an important step for the green operation ofa data center. The DCeP metric of (4) and the factors ITEE and ITEU ofequation (7) show that energy efficiency is correlated to the efficient use of the

Energy Efficiency in Local and Regional Data Centers 17
IT equipment. Achieving efficiency at the IT level can be considered as themost important strategy for a green data center since for every Watt saved incomputation, two additional Watts are saved – one Watt in power conversionand one Watt for cooling [7]. In general the following actions are necessaryto achieve this goal.
Retiring – some data centers have application servers which are operatingbut have no users. These servers add noload losses to the system and needto be removed. The usable lifetime for servers within the data center variesgreatly, ranging from as little as two years for some x86 servers to seven yearsor more for large, scalable SMP server systems. IDC surveys [28] indicatethat almost 40% of deployed servers have been operating in place for fouryears or longer. That represents over 12 million single core-based servers stillin use. The servers that exist in most data centers today have been designedfor performance and cost optimization and not for energy efficiency. Manyservers in data centers have power supplies that are only 70% efficient.
This means that 30% of the power going to the server is simply lost asheat. Having inefficient power supplies means that excess money is beingspent on power with additional cooling needed as well. Another problem withcurrent servers is that they are used at only 15–25% of their capacity. A bigproblem with this, from a power and cooling perspective, is that the amountof power required to run traditional servers does not vary linearly with theutilization of the server. That is, ten servers running each at 10% utilizationwill consume much more power than one or two servers that each run at80–90% utilization [29].
Migrating to more energy efficient platforms – use of blade servers thatproduce less heat in a smaller area around it. Non-blade systems requirebulky, hot and space-inefficient components, and may duplicate these acrossmany computers that may or may not perform at capacity. By locating theseservices in one place and sharing them between the blade computers, theoverall utilization becomes more efficient. The efficiency of blade centers isobvious if one considers power, cooling, networking and storage capabilities[7, 29, 30]. An example is presented in [7] where 53 blade servers consuming21 KWatts provided 3.6 Tflops of operation when in 2002 required Intel Ar-chitecture based HPC cluster of 512 servers arraigned in 25 racks consuming128 KWatts. This means that compared to 2002 technology today 17% of theenergy is necessary for the same performance.
• Power of Blade Servers – Computers operate over a range of DCvoltages, but utilities deliver power as AC, and at higher voltages than
18 G. Koutitas and P. Demestichas
required within computers. Converting this current requires one or morepower supply units (or PSUs). To ensure that the failure of one powersource does not affect the operation of the computer, even entry-levelservers have redundant power supplies, again adding to the bulk andheat output of the design. The blade enclosure’s power supply providesa single power source for all blades within the enclosure. This singlepower source may come as a power supply in the enclosure or as adedicated separate PSU supplying DC to multiple enclosures.
• Cooling of Blade Servers – During operation, electrical and mechan-ical components produce heat, which a system must displace to ensurethe proper functionality of its components. Most blade enclosures, likemost computing systems, remove heat by using fans. The blade’s sharedpower and cooling means that it does not generate as much heat astraditional servers. Newer blade-enclosure designs feature high-speed,adjustable fans and control logic that tune the cooling to the system’srequirements, or even liquid cooling systems.
• Networking of Blade Servers – The blade enclosure provides one ormore network buses to which the blade will connect, and either presentsthese ports individually in a single location (versus one in each com-puter chassis), or aggregates them into fewer ports, reducing the cost ofconnecting the individual devices. This also means that the probabilityof wiring blockage to air flow of cooling systems in the data center isminimized.
More Efficient Server – For energy efficiency, vendors should focus onmaking the processors consume less energy and on using the energy as ef-ficiently as possible. This is best done when there is close coordination insystem design between the processor and server manufacturers [29]. In [31]practical strategies of power efficient computing technologies are presentedbased on microelectronic, underlying logic device, associated cache memory,off-chip interconnect, and power delivery system. In addition, replacement ofold single core processors with dual or quad core machines is important. Thiscombination can improve performance per Watt and efficiency per squaremeter.
Energy Proportional Computing – Many servers operate at a fraction oftheir maximum processing capacity [32]. Efficiency can be achieved when theserver scales down its power use when the workload is below its maximumcapacity. When search traffic is high, all servers are being heavily used, butduring periods of low traffic, a server might still see hundreds of queries

Energy Efficiency in Local and Regional Data Centers 19
Figure 8 Comparison of power usage and energy efficiency for Energy Proportional Comput-ing (EPC) and common server (NO EPC) [32].
per second, meaning that any idleness periods are likely to be no longerthan a few milliseconds. In addition, it is well known that rapid transitionbetween idle and full mode consumes high energy. In [33] a research over5000 Google servers shows that the activity profile for most of the timeis limited to 20–30% of the servers’ maximum capacity. Server’s powerconsumption responds differently at varying input workloads. In Figure 8the normalized power usage and energy efficiency of a common server ispresented as a function of the utilization (% of maximum capacity). It can beobserved that for typical server operation (10–50%) the energy efficiency isvery low meaning that the server is oversized for the given input workload.This means that even for a no workload scenario, the power consumption ofthe server is high. In case of energy proportional computing (EPC) the energyvaries proportionally to the input work. Energy-proportional machines mustexhibit a wide dynamic power range – a property that might be rare today incomputing equipment but is not unprecedented in other domains. To achieveenergy proportional computing two key features are necessary such as widedynamic power range and active low power modes.
Current processors have a wide dynamic power range of even more than70% of peak power. On the other hand the dynamic power range of otherequipment is much narrower such as DRAM 50%, disk drives 25% and

20 G. Koutitas and P. Demestichas
network switches 15%. A processor running at a lower voltage-frequencymode can still execute instructions without requiring a performance impact-ing mode transition. There are no other components in the system withactive low-power modes. Networking equipment rarely offers any low-powermodes, and the only low-power modes currently available in mainstreamDRAM and disks are fully inactive [33]. The same observations are presentedin [34]. A technique to improve power efficiency is with dynamic ClockFrequency and Voltage Scaling (CFVS). CFVS provides performance-on-demand by dynamically adjusting CPU performance (via clock rate andvoltage) to match the workload. Another advantage obtained by energy pro-portional machines is the ability to develop power management software thatcan identify underutilized equipments and set to idle or sleep modes. Finally,benchmarks such as SPECpower ssj2008 provide a standard application basethat is representative of a broad class of server workloads, and it can helpisolate efficiency differences in the hardware platform.
4.1.2 NCPI EquipmentsEfficiency of NCPI equipments is another step for the green operation of datacenter. This is highlighted by the DCiE or PUE metric of (3) and the effect ofan efficient NCPI data center is presented in Figure 6. In general the followingactions are necessary to achieve this goal.
Replacing chiller or UPS systems that have been in service for 15 yearsor more can result in substantial savings. New chiller systems can improveefficiency by up to 50% [20].
Free cooling is a complex technique and requires workload manage-ment according to the environmental conditions. Recently, the green gridassociation presented a European air-side free cooling map [35].
Air conditioners – use of airconditions that can operate at economizermode. This can have a great effect especially for low outdoor temperatures.In addition, if air-conditioners work with low output temps there is a furtherincrease of humidifier operation resulting to increased power demands.
Power delivery – energy efficient power delivery can be achieved usingefficient voltage regulators and power supply units. In [7] a study of threedifferent power delivery architectures is presented namely as: conventionalalternating current (AC), rack-level direct current (DC), and facility-level DCdistribution. Results showed that the greatest efficiency is achieved throughfacility-level 380V DC distribution. Intel calculated that an efficiency of ap-proximately 75% may be achieved with facility-level 380V DC distributionusing best-in-class components. Finally, in [10] a comparison of the energy

Energy Efficiency in Local and Regional Data Centers 21
efficiency, capital expense and operating expense of power distribution at400 and 600 V as alternatives to traditional 480 V is presented. The studyconfirmed that by modifying the voltage at which power is distributed in thedata center, data center managers can dramatically reduce energy consump-tion and the cost of power equipment. The study recommended 400 V powerdistribution, stepped down to 230 V to support IT systems to yield end to endpower delivery efficiency. Switch consolidation is also an effective strategy[34].
4.2 Planning Actions
The individual equipment optimization is a crucial step for the data center tooperate in a green manner but it is inadequate to transform the overall systemoperation. Planning actions for the efficiency of the overall system are re-quired and can be achieved by introducing new technologies and managementtechniques.
4.2.1 Reducing Cooling NeedsA data center usually occupies a large space and the optimum equipmentinstallation can yield to great savings. The following steps are considered asimportant for energy efficiency:
• Organizing IT equipment into a hot aisle and cold aisle configuration[19, 20].
• Minimize blockage by wiring and secondary equipments that influenceair flow and cooling and heat removal.
• Use raised floor environments.• Positioning the equipment so that one can control the airflow between
the hot and cold aisles and prevent hot air from recirculating back to theIT equipment cooling intakes.
• Leveraging low-cost supplemental cooling options.• Use equipments with higher thermal tolerance and so reduce the need of
cooling.• Investigate heat and cooling transfer within the data center space by
using advanced software of fluid mechanics and perform air flowmanagement [36].
4.2.2 Exploitation of VirtualizationVirtualization and consolidation is a necessary step to overcome underutil-ization of the IT equipments of the data center. In [7] a study over 1000

22 G. Koutitas and P. Demestichas
servers showed that the servers operate at 10–25% usage relative to their max-imum capacity. The need for consolidation is obvious. Consolidation is usedfor centralizing IT systems and when used at software level, consolidationmeans centralization of the solution, integration of data, redesign of businessprocesses and when used at hardware level consolidation means centraliz-ation of multiple servers to one more powerful and more energy efficient.Virtualization can also be defined at a software level or hardware level oreven a combination of the above. Virtualization can be oriented for servers,and can also be very effective for networking and storage. Virtualization en-ables multiple low-utilization OS images to occupy a single physical server.Virtualization allows applications to be consolidated on a smaller numberof servers, through elimination of many low utilization servers dedicatedto single applications or operating system versions [37]. The main advant-age of server virtualization is that the total number of servers is reduced,lower infrastructure for cooling and power delivery is required, the energycosts are reduced, the virtual machines operate at their maximum capacity,where the energy efficiency is met, and it can provide business continuity anddisaster recovery. A study presented in [38] showed that server virtualiza-tion in Bosnia-Herzegovina over 500 servers in 60 data centers can provideelectricity costs saving of $500,000 over a three years period.
4.2.3 Remote Monitoring for Optimal PlanningThe aim of remote monitoring is to provide the industry with a set of designguides to be used by operators and designers to plan and operate energyefficient data centers. Remote monitoring is an enabler for optimal planningsince it provides the necessary information for planning actions. The designincludes all IT and NCPI equipment. The outcome is an intelligent monit-oring system that can provide real time information about power conditionof the equipments involved in a data center by means of sensor networksimplementation or SCADA systems.
The energy efficiency design incorporates the following directions [39]:
• Fully Scalable. All systems/subsystems scale energy consumption andperformance to use the minimal energy required to accomplish work-load.
• Fully Instrumented. All systems/subsystems within the data center areinstrumented and provide real time operating power and performancedata through standardized management interfaces.
Energy Efficiency in Local and Regional Data Centers 23
• Fully Announced. All systems/subsystems are discoverable and reportminimum and maximum energy used, performance level capabilities,and location.
• Enhanced Management Infrastructure. Compute, network, stor-age, power, cooling, and facilities utilize standardized manage-ment/interoperability interfaces and language.
• Policy Driven. Operations are automated at all levels via policies setthrough management infrastructure.
• Standardized Metrics/Measurements. Energy efficiency is monitored atall levels within the data center from individual subsystems to completedata center and is reported using standardized metrics during operation.
In order to accomplish this target a set of logical divisions can be extractedand a set of tasks are assigned as shown in Figure 9. An important goal ofremote monitoring is that crucial information of the real data center will begathered that will improve the development of efficiency predictions modelsand will guide to optimal planning actions. Furthermore, better managementof the system is possible. As far as the power management is concerned withan adequate remote monitoring technology, workloads and efficiencies of dif-ferent systems could be measured and ideally, power usage in a data centercould be balanced to the workload. This feature is important for workloadmanagement actions, which are further investigated in a paragraph below.One way to achieve this balance is to idle unneeded equipment or transferworkloads in such a way to obtain high usage capacity of data centers.
A strategy towards real time remote monitoring and management of adata center is also supported in [40]. A data center management software ispresented that supports energy efficiency, stadardization and benchmarkingat different layers of the system.
4.2.4 RightsizingData centers suffer low utilization fractions relative to their maximum capa-city. In [41] a study shows that 70% of today’s data centers operate at less than45% of their maximum capacity limits. This has a serious effect on energyefficiency as presented in Figure 10.
There are numerous reasons why oversizing occurs, for example:
• The cost for not providing sufficient space for a data center is enormousand must be eliminated. This means that in case of undersizing, the totalcost is dangerous.

24 G. Koutitas and P. Demestichas
Figure 9 Logical division and tasks for green data centers and remote monitoring [39].

Energy Efficiency in Local and Regional Data Centers 25
Figure 10 Effect of individual equipment efficiency and rightsizing [41].
• It is a tremendous cost to increase the capacity during data centerlifecycle.
• There are numerous risks associated with an increase of the capacityduring lifecycle.
• It is difficult to predict the final room size so one wants always to beabove the threshold for safety reasons.
The result of oversizing is that the data center operates well below itsmaximum capacity (usually at 30–50%). At this input workload all the equip-ments are not efficiently operate. Rightsizing mainly affects NCPI powerconsumption. In this approach the power and cooling equipments should bebalanced to the IT load of the data center.
There are fixed losses imposed by NCPI independently of IT load.These losses can exceed IT load in low load systems and they are becom-ing a large percentage when the IT load increases. Typical data centersdraw approximately two to three times the amount of power required forthe IT equipment because conventional data center designs are oversizedfor maximum capacity and older infrastructure components can be veryinefficient.

26 G. Koutitas and P. Demestichas
Rightsizing a data center is a complex task since great losses and costs areassociated to an improper sizing of the equipments. For that reason accuratemodels and great management skills need to be performed in order to achievean optimum design. The steps that need to be followed are [41]:
• Investigation of data centers workload and sizing that already exist.• Investigation about the estimated workload and future applications of
the data center.• Avoid underutilization of data center assuming that this will increase the
reliability.• Development of sophisticated prediction workload models.
An approach of adaptable infrastructure and dimensioning can providerightsizing of the system and this is presented in [41]. The effect of rightsizingto the data center’s energy efficiency can be observed in Figure 10.
4.2.5 Network Load Management/Network TopologyVarious architectures of data center topologies and different routing al-gorithms than the already existing ones, can increase the system’s perform-ance. A fat tree data center architecture is presented in [42]. Instead of ahierarchical enterprise expensive switched (10GigE) to be used, commod-ity switched (GigE) are utilized in a fat tree configuration. Despite the factthat more intelligent and complex routing is required (two-level routing al-gorithm) the cost of the new deployment and the overall power consumptionis reduced. The physical meaning of this observation is that for typical datacenters where the workload is small and so oversizing is occurred, by incor-porating in the data center small commodity instead of powerful enterpriseequipments, the workload is distributed in such a way that most of the usedelements are operating near their maximum capacity. This has a positiveeffect at the efficiency of the system. The study proved more than 50%reduction of power consumption and heat generation.
Another approach for electricity cost savings is the routing algorithmpresented in [43]. The authors suggested an algorithm that moves workloadto data centers placed at areas where the electricity cost is low using a realtime electricity price information system coupled to the routing algorithm.The concept is to move workload at data centers placed in areas where theelectricity cost is low and reduce the usage of the other. This means that theincreased power consumption of the fully loaded data centers will result tolow expenses.

Energy Efficiency in Local and Regional Data Centers 27
Figure 11 Rightsizing routing algorithm for energy efficiency.
Despite the fact that the presented technique is associated to cost savingsit can also be used in future systems for workload management accordingto renewable energy availability or environmental conditions to provide freecooling.
Network load management techniques are implemented to provide work-load balance to specific data centers in a network. The main aim is to reducethe workload of data centers that are underutilized and deliver the workload toother data centers to operate them near their maximum capacity. The conceptis presented in Figure 11. The model utilizes the available data derived fromthe remote monitoring system and the required data for energy efficiency met-ric computation and performs workload management in the network devicesto provide maximum energy efficiency. In addition, a real time feedback sys-tem that informs about environmental conditions and availability/productionof renewable energy is coupled to the algorithm.
4.2.6 Avoid Data DuplicationData duplication produces increase power consumption in storage devices.The fact that most of the data is duplicated, for safety reasons, reduces theenergy efficiency of the system. Storage virtualization is one approach toovercome this phenomenon [37].

28 G. Koutitas and P. Demestichas
Table 2 Energy efficiency ranking for 25 typical data centers.The Green Grid Benchmark PUE Number of Data CentersPlatinum <1.25 0%Gold 1.25–1.43 0%Silver 1.43–1.67 0%Bronze 1.67–2.0 27%Recognized 2.0–2.5 40%Non-Recognized >2.5 33%
4.2.7 Alternative Energy SupplyThe DCiE investigated in Section 3.1 proved that in order to increase theefficiency of a data center one approach is to reduce the needs of input powerfrom the utility. This can be achieved by applying alternative energy supplyin the data center. Of course the technology of renewable energy sources andthe produced power is a small fraction of the actual required power to operatea data center. But it can be profitable for small traffic demands where therequirements are reduced. The effect of the penetration of alternative energysource is also more obvious in the DPPE metric shown in equation (7) and inFigure 6.
4.3 Standardization
Standardization of energy efficiency procedures and techniques is consideredas a necessary step for achieving green operation of data centers [16]. Thedevelopment and the design of data centers based on a common stand-ard platform could provide great goals for energy efficient data centers. Abenchmark, presented by the green grid association, categorizes data centersaccording to the measured DCiE factor. This can be considered as the firstapproach to this target and in the near future benchmarks that incorporate theDCeP or DPPE metrics are expected. Data center benchmarks are presentedin Table 2 [16]. It can be observed that silver and gold benchmarks are notyet achieved.
5 Conclusions
This paper presented today’s challenges for achieving energy efficiency inlocal and regional data center systems. The power consumption of differentlayers of the data center was investigated and it was shown that there are greatportions of power wasted both in non critical infrastructure and IT equip-

Energy Efficiency in Local and Regional Data Centers 29
ments. A review of the available metrics for energy efficiency was discussedand the effect of energy efficiency to carbon emissions and operational costswas computed. It was shown that there are great expectations for cost andcarbon savings when the data center operates in a green manner. Strategies fordeveloping and transforming a green data center were also presented based onoperational and planning actions. It was shown that energy efficiency shouldtarget overall system optimization of both non critical and IT equipmentswith main focus placed on cooling, power delivery systems, virtualizationand workload management.
References[1] International Telecommunication Union (ITU), Report on Climate Change, October
2008.[2] G. Koutitasa and P. Demestichas, A review of energy efficiency in telecommunication
networks, in Proc. in Telecomm. Forum (TELFOR), Serbia, November, pp. 1–4, 2009.[3] Gartner Report, Financial Times, 2007.[4] I. Cerutti, L. Valcarenghi, and P. Castoldi, Designing power-efficient WDM ring
networks, in Proc. ICST Int. Conf. on Networks for Grid Applic., Athens, 2009.[5] W. Vereecken, et al., Energy efficiency in thin client solutions, in ICST Int. Conf. on
Networks for Grid Applic., Athens, 2009.[6] J. Haas, T. Pierce, and E. Schutter, Data center design guide, White Paper, The Greengrid,
2009.[7] Intel, Turning challenges into opportunities in the data center, White Paper, Energy
Efficiency in the Data Center, 2007.[8] P. Scheihing, DOE data center energy efficiency program, U.S. Department of Energy,
April 2009.[9] C. Francalanci, P. Gremonesi, N. Parolini, D. Bianchi, and M. Gunieti, Energ-IT: Models
and actions for reducing IT energy consumption, Focus Group on Green IT and Greene-Competences, Preliminary Project Results, Milan, 2009.
[10] EATON, Is an energy wasting data center draining you bottom line? New technologyoptions and power distribution strategies can automatically reduce the cost and carbonfootprint of a data center, White Paper, 2009.
[11] R. Bolla, R. Bruschi, and A. Ranieri, Energy aware equipment for next-generationnetworks, in Proc. Int. Conf. on Future Internet, Korea, November, pp. 8–11, 2009.
[12] Report to Congress, Server and data center energy efficiency, U.S EnvrionmentalProtection Agency, Energy Star Program, August 2007.
[13] L. MacVittie, A green architectural strategy that puts IT in the black, F5 White Paper,2010.
[14] IBM, The green data center, White Paper, May 2007.[15] TheGreenGrid, Guidelines for energy-efficient data centers, White Paper, February 2007.[16] Hewlett Packard, A blueprint for reducing energy costs in your data center, White Paper,
June 2009.

30 G. Koutitas and P. Demestichas
[17] www.cost804.org[18] Cisco, Cisco data center infrastructure 2.5 design guide, Technical Report, December
2006.[19] L.A. Barroso and U. Holzle, The Data Center as a Computer: An Introduction to the
Design of Warehouse-Scale Machines, Morgan and Claypool, 2009.[20] N. Rasmussen, Implementing energy efficient data centers, White Paper, APC, 2006.[21] N. Rasmussen, Electrical efficiency modelling for data centers, White Paper, APC, 2007.[22] M. Parker and S. Walker, An absolute network energy efficiency metric, in Proc. ICST
Int. Conf. on Networks for Grid Applic., Athens, 2009.[23] TheGreenGrid, Green grid metrics: Describing data center power efficiency, White
Paper, February 2007.[24] TheGreenGrid, Proxy proposals for measuring data center productivity, White Paper,
2008.[25] GIPC, Concept of new metric for data center energy efficiency: Introduction to data
center performance per energy DPPE, Green IT Promotion Council, February 2010.[26] International Energy Agency (IEA), CO2 emissions from fuel combustion: Highlights,
Report, 2009.[27] N. Rasmussen, Allocating data center energy costs and carbon to IT users, APC White
Paper, 2009.[28] M. Eastwood, J. Pucciarelli, J. Bozman, and R. Perry, The business value of con-
solidating on energy-efficient servers: Customer findings, IDC White Paper, May2009.
[29] J. Murphy, Increasing Energy Efficiency with x86 Servers, Robert Francis Group, 2009.[30] N. Rasmussen, Strategies for deploying blade servers in existing data centers, APC White
Paper, 2005.[31] L. Chang et al., Practical strategies for power-efficient computing technologies, Proceed-
ings of IEEE, vol. 98, no. 2, February 2010.[32] J. Koomey et al., Server energy measurement protocol, Energy Star, Report, 2006.[33] L.A. Barroso and U. Hozle, The case of energy proportional computing, IEEE Computer,
vol. 40, pp. 33–37, 2007.[34] Force 10, Managing data center power and cooling, White Paper, 2007.[35] www.thegreengrid.org.[36] http://www.futurefacilities.com/software/6SigmaRoom.htm.[37] S. Bigelow, D. Davis, and R. Vanover, Choosing to wait on virtualization, how can the
open virtualization format help you, critical decisions for virtualization storage, VirtualDatacenter, vol. 20, March 2010.
[38] E. Cigic and N. Nosovic, Server virtualization for energy efficient data centers in Bosniaand Herzegovina, Int. Telecommunication Forum TELFOR, Serbia, November 2009.
[39] J. Haas, et al., Data center design guide. Program overview, Report by The Green Grid,2009.
[40] IBM, Taking an integrated approach to energy efficiency with IBM Tivoli software,White Paper, August 2008.
[41] APC, Avoiding costs from oversizing data center and network room infrastructure, WhitePaper, 2003.

Energy Efficiency in Local and Regional Data Centers 31
[42] M. Al-Fares, A. Loukissas, and A. Vahdat, A scalable, commodity data center networkarchitecture, in ACM SIGCOMM, pp. 63–74, August 2008.
[43] A. Qureshi, et al., Cutting the electric bill for internet scale systems, in APC SIGCOMM,2009.
Biographies
G. Koutitas was born in Thessaloniki, Greece. He received his B.Sc. degreein Physics from the Aristotle University of Thessaloniki, Greece, in 2002 andhis M.Sc. degree, with distinction, in Mobile and Satellite Communicationsfrom the University of Surrey, UK, in 2003. He succeeded his Ph.D in radiochannel modeling from the Centre for Communications Systems Research(CCSR) of the University of Surrey in 2007. His main research interests arein the area of radio wave propagation modeling, wireless communications(modeling and optimization) and in the area of ICT for sustainable growthand energy efficiency. He is involved in research activities concerning energyefficient network deployments and design, Green communications andsensor networks.
P. Demestichas was born in Athens, Greece, in 1967. Since December 2007he is Associate Professor at the University of Piraeus, in the Department ofDigital Systems, which he joined in September 2002 as Assistant Professor.From January 2001 until August 2002 he was adjunct lecturer at NTUA, inthe Department of Applied Mathematics and Physics, of the National Tech-nical University of Athens (NTUA). From January 1997 until August 2002he was senior research engineer in the Telecommunications Laboratory ofNTUA. Until December 1996 he had acquired a Diploma and Ph.D. degreein Electrical and Computer Engineering from NTUA, and had conductedhis military service in the Greek Navy. He has been actively involved in anumber of national and international research and development programs.His research interests include the design and performance evaluation ofhigh-speed, wireless and wired, broadband networks, software engineering,network management, algorithms and complexity theory, and queuing theory.Most of his current activities focus on the Information Communications Tech-nologies (ICT), 7th Framework Programme (FP7), “OneFIT” (OpportunisticNetworks and Cognitive Management Systems for Efficient Application Pro-vision in the Future Internet), in which he is the project manager. Moreover,he will be involved in the ICT/FP7 projects “UniverSelf” (Autonomics forthe Future Internet), “Acropolis” (Advanced coexistence technologies for ra-

32 G. Koutitas and P. Demestichas
dio optimization in licenced and unlicensed spectrum), and the COST actionIC0902. He has been the technical manager of the “End-to-End Efficiency”(E3) project, which focused on the introduction of cognitive systems in thewireless world. He is the chairman of Working Group 6 (WG6), titled “Cog-nitive Networks and Systems for a Wireless Future Internet”, of the WirelessWorld Research Forum (WWRF). He has further experience in project man-agement from the FP5/IST MONASIDRE project, which worked on thedevelopment of composite wireless networks. He has actively participatedin FP6/IST (E2R I/II, ACE), Eureka/Celtic, as well as FP5, ACTS, RACEI and II, EURET and BRITE/EURAM. He has around 200 publications ininternational journals and refereed conferences. He is a member of the IEEE,ACM and of the Technical Chamber of Greece.