challenges and opportunities in peer...
TRANSCRIPT

Challenges and Opportunities in Peer Review
A Vision for Ensuring Its Strategic National Value
toni scarpa [email protected]
CSR Advisory CouncilBethesda, MDMay 2, 2011
National Institutes of HealthU.S. Department of Health and Human Services

Peer Review at CSR
The Drivers for Change
Enhancing Peer review: CSR
Enhancing Peer review: Corporate NIH
The 2010 Marcy Speer Award
NIH Peer Review

Peer Review at CSR

CSR Mission Statement
To see that NIH grant applications receive fair, independent, expert, and timely reviews – free from inappropriate influences – so NIH can fund the most promising research.

CSR Activities
Fiscal Year
ApplicationsReceived
Applications Reviewed
Number of Study Sections
Number of Reviewers
Number of SROs
2008 73,000 51,000 1,600 16,000 240
2009 113,000 78,000 2,200 39,000 240
2010 88,000 64,000 1,700 17,000 240

Reorganizing CSR
Divisions Scientific Review Officers
Integrated Review Groups

Reorganizing CSR
Translational and Clinical Sci
Cardiovascular and Respiratory Sciences
Surgical Sciences, Biomedical
Imaging and Bioengineering
Musculoskeletal, Oral And Skin Sciences
Oncology 2 –Translational Clinical
Vascular and Hematology
PhysiologicalPathological Sci
Endocrinology, Metabolism, Nutrition &Reproductive Sciences
Immunology
Infectious Diseases& Microbiology
Digestive, Kidney &Urological Systems
Neuroscience,Development
and Aging
Brain Disorders &Clinical Neuroscience
Molecular, Cellular &Developmental Neuroscience
Integrative, Functional & Cognitive Neuroscience
Emerging Technologies &Training in Neuroscience
Biology of Development & Aging
Biobehavioral &Behavioral Processes
Risk, Prevention& Health Behavior
Population Sciencesand Epidemiology
Healthcare Delivery & Methodologies
AIDS &Related Research
AIDS, Behavioral, Population
Basic- Integrative Biological Sci
Biological Chemistry & Macromolecular
Biophysics
Bioengineering Sciences& Technologies
Genes, Genomes &Genetics
Oncology 1 – Basic Translational
Cell Biology
Interdisciplinary Molecular & Training

Two New CSR Division Directors
Sy Garte Karyl Swartz
Division of Aids, Behavioral and Population Sciences
Division of Physiological & Pathological Sciences

3 New CSR IRG Chiefs
Valerie Durrant Robert Freund Katherine MalindaPopulation Sciences AIDS Vascular, HematologyAnd Epidemiology
34 New Scientific Review Officers

How Applications are Reviewed by CSR (no ARRA)
0%
10%
20%
30%
40%
50%
60%
70%
80%
90%
100%
2006 2007 2008 2009 2010
STANDING RECURRING SEP SEP

0
10
20
30
40
50
0 10 20 30 40 50
Cum
ulat
ive
Perc
ent
Percentile
CSR Percentile Outcomes for R01sReviewed in Standing SS
200810, N=7604
200910, N=7671
201010, N=7985
Reference

0
10
20
30
40
50
0 10 20 30 40 50
Cum
ulat
ive
Perc
ent
Percentile
CSR Percentile Outcomes for T1 and T2 R01sReviewed in Standing SS
200810 T1, N=5503200910 T1, N=5757201010 T1, N=6403200810 T2, N-2055200910 T2, N=1886201010 T2, N=1554Reference

0
10
20
30
40
50
0 10 20 30 40 50
Cum
ulat
ive
Perc
ent
Percentile
CSR Percentile Outcomes for T1 Experienced PI R01s Reviewed in Standing SS
200810 T1 Exp, N-3235
200910 T1 Exp, N=3227
201010 T1 Exp, N=3650
Reference

The Drivers for Change

1st Driver: The NIH Budget
0
5
10
15
20
25
30
35
40
1998 2000 2002 2004 2006 2008 2010
Regular
$, B
illio
n

2nd Driver: Number of Applications
0
20
40
60
80
100
120
1996 1998 2000 2002 2004 2006 2008 2010
Thou
sand
s


Research Project Grants Submitted by Applicants
FY RPGs Submitted No of PIs Avg RPG per PI
2000 24,060 18,598 1.3
2001 23,376 18,235 1.3
2002 25,873 19,714 1.3
2003 31,626 23,217 1.4
2004 35,849 25,621 1.4
2005 40,243 27,908 1.4
2006 41,401 28,506 1.5
2007 40,175 27,549 1.5
2008 39,298 26,505 1.5
2009 59,263 37,668 1.6
2010 45,646 31,221 1.5

Application Received By Month of FY
0 10,000 20,000 30,000 40,000 50,000 60,000 70,000 80,000 90,000 100,000 110,000
2001 Received
2002 Received
2003 Received
2004 Received
2005 Received
2006 Received
2007 Received
2008 Received
2009 Received
2010 Received
2011 Received
5194
6082
7513
9341
8903
8943
7928
9459
9472
11336
11317
4997
5439
9038
6998
8001
7052
7103
7304
7123
7509
10245
2640
3168
3508
7417
7954
7751
7764
7679
8636
9886
6165
3677
3706
3144
5320
6739
7677
9133
9018
9220
8736
8106
8319
11290
10653
5706
6342
8319
6841
8079
7924
7171
8166
10532
8866
3218
3797
4499
4635
4250
4338
4070
3689
22327
5209
3849
3626
3556
6018
13003
5546
7034
8117
9239
8766
8313
8211
7748
11903
12014
5226
6352
6532
6523
6627
6238
6188
6886
6521
5216
2468
2995
3698
4083
3995
3679
3516
4102
4650
4835
4290
2866
5961
Number of Applications
Oct Nov Dec Jan Feb Mar Apr May Jun Jul Aug Sep

R01 and R21 Received for CSR Review
0
2000
4000
6000
8000
10000
12000
Feb Jun Oct Feb Jun Oct Feb Jun Oct Feb Jun Oct Feb
R01R21
2007 2008 2009 2010 2011

R21 Applications Reviewed Per Fiscal Year

Applications Reviewed by CSR

3rd Driver: Reviewer’s Load
Applications Per Reviewer
0.00
2.00
4.00
6.00
8.00
10.00
12.00
14.00

4th Driver: CSR Budget$
Mill
ions
Cost of Peer Review, including travel and small honorarium for 20,000Reviewers is 0.4-0.6% of the funds requested

Annual Savings in Reviewers’ Expense Budget
• Non-refundable tickets with one possible change$17 million
• 4,000 fewer reviewers$4 million
• 20% reviews using electronic platforms$11 million
• One meeting a year on the West Coast$1.8 million
• Replacing CDs with zApp1 million
• Sun setting late additional material0.6 million

Enhancing Peer Review

Major Complaints About NIH Peer Review
• The process is too slow
• There are not enough senior/experienced reviewers
• The process favors predictable research instead of significant, innovative, or transformative research
• The time and effort required to write and review are a heavy burden on applicants and reviewers

The Overall Goal
• Addressing Review and Funding for New Investigators
• Reviewing Expeditiously• Reviewing More and Mentoring Less• Saving Reviewers Time• Focusing More on Impact and Significance and Less
on Approach• Being More Transparent• Reviewing the Changes

1. Improving Study Section Alignment
2. Rewriting Study Section Guidelines
3. Shortening the Review Cycle
4. Advancing Additional Review Platforms
5. Recruiting the Best Reviewers
6. Miscellaneous
CSR’s Efforts to Enhance Peer Review

1. Improving Study Section Alignment
• Input from the community
• Internal IRG reviews
• Open Houses
• CSR Advisory Council

Positional Map of Musculoskeletal Tissue Engineering Study Section

Positional Map of Membrane Biology and Protein Processing Study Section

2. Revising Study Section Guidelines• Cellular Signaling and Regulatory Systems
• [Roster]
• The Cellular Signaling and Regulatory Systems (CSRS) study section reviews applications that focus on the initiation and execution of programs that control cellular homeostasis and physiology. A distinguishing characteristic of these applications is an emphasis on signaling networks and the coordination of processes related to cell proliferation, survival, and growth.
• Cell cycle regulation, mitosis, meiosis, checkpoint controls and regulation by ubiquitination• Proteolytic mechanisms associated with cell cycle, senescence and death• Programmed cell death and apoptosis, particularly their regulation in the context of stress,
growth, and transformation.• Proliferation and growth control by the nucleus; signaling pathways regulating transcription• Integrative cell physiology, e.g., stress, clocks, cellular modeling; cell differentiation and
transformation• Basic studies of cytokine signaling• Application of state-of-the-art technologies such as imaging and computational modeling of
cellular signaling networks
• Study sections with most closely related areas of similar science listed in rank order are:
• Molecular and Integrative Signal Transduction• Intercellular Interactions• Membrane Biology and Protein Processing• Molecular Genetics A• Molecular Genetics B
• 1.7 million views

3. Shortening the Review Time
0 2 4 6
2009
2007
2005
To enable resubmission, when doable and desirable, 4 months earlier than in the past.
Months: Submission to Posting Summary Statements


4. Advancing Additional Review Platforms
• Additional Review Platforms Help Recruiting Reviewers
• Electronic Review Modes Reduce Travel
• Electronic ReviewsTelephone Assisted MeetingVideo Assisted MeetingInternet Assisted Meeting (previously AED)Telepresence

4. Advancing Additional Review PlatformsWhat It Looks Like: Video Assisted Meeting

4. The First Telepresence Study Section, 2010

4. Advancing Additional Review PlatformWhat It Looks Like: Internet Assisted Meeting (previously AED)
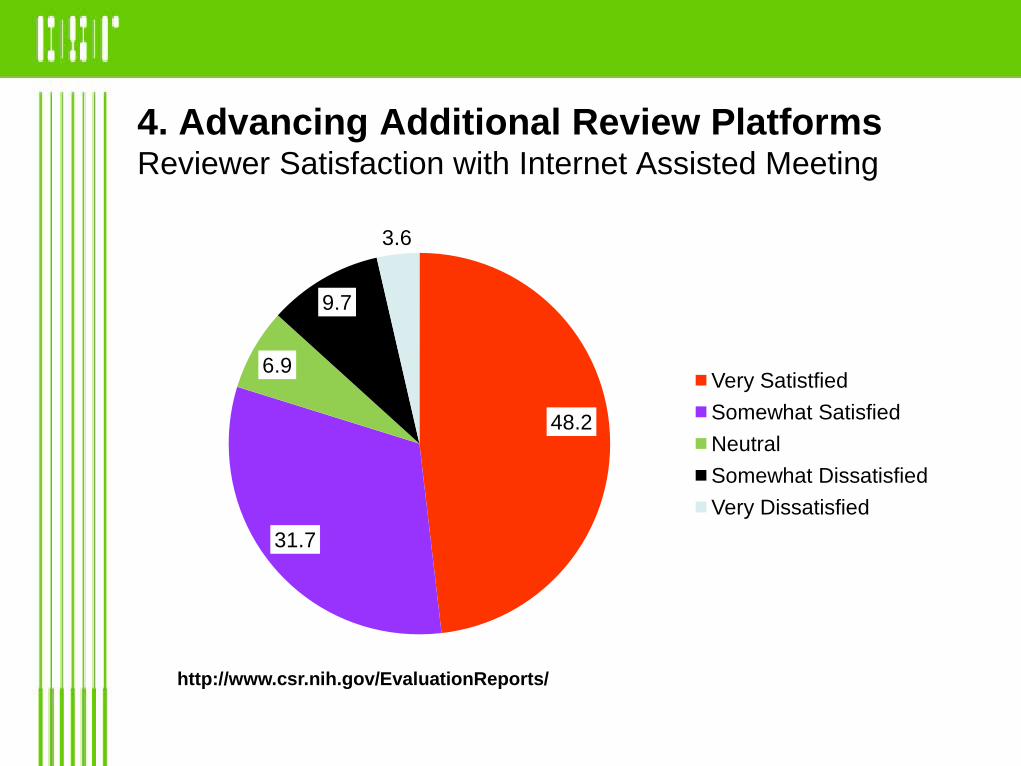
4. Advancing Additional Review PlatformsReviewer Satisfaction with Internet Assisted Meeting
48.2
31.7
6.9
9.7
3.6
Very SatistfiedSomewhat SatisfiedNeutralSomewhat DissatisfiedVery Dissatisfied
http://www.csr.nih.gov/EvaluationReports/

4. Advancing Additional Review PlatformsCost Comparison of Review Platforms
Phone Internet Video Face to Face
Cost/application, $ 25 107 237 867
524Cost/reviewer, $ 31 100 292 1767
Not including honoraria for reviewers

4. Advancing Additional Review Platforms
• Editorial Board ReviewComplex ScienceSmall BusinessTR01 Several ARRA Mechanisms
• College of Reviewers
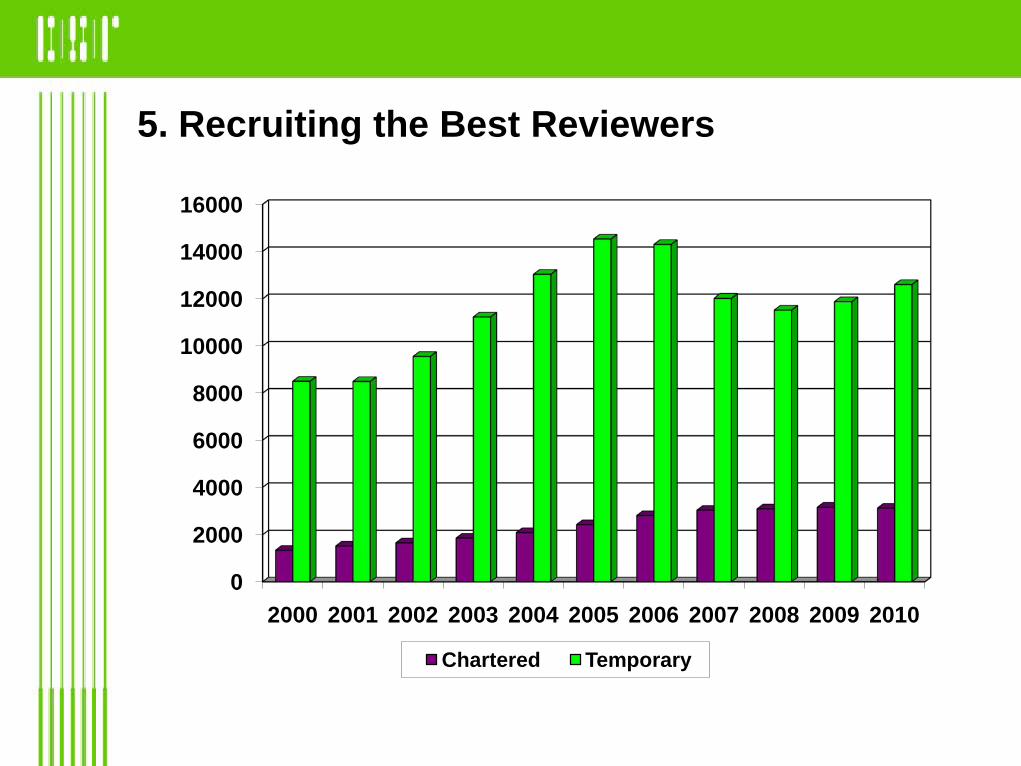
5. Recruiting the Best Reviewers
0
2000
4000
6000
8000
10000
12000
14000
16000
2000 2001 2002 2003 2004 2005 2006 2007 2008 2009 2010
Chartered Temporary

0.0%
10.0%
20.0%
30.0%
40.0%
50.0%
60.0%
70.0%
80.0%
1998 1999 2000 2001 2002 2003 2004 2005 2006 2007 2008
Academic Rank of All CSR Reviewers
PROFESSOR ASSOCIATE PROFESSOR ASSISTANT PROFESSOR
5. Recruiting the Best ReviewersAcademic Rank of ALL CSR Reviewers

5. Recruiting the Best ReviewersSome Successful Strategies
• Move a meeting a year to the West Coast
• Additional review platforms
• Develop a national registry of volunteer reviewersSearchable database with 5,000 reviewers
• Provide tangible rewards for reviewersNo submission deadlines for chartered members of study sections (effective February 2008)
• Provide flexible time for reviewersChoice of 3 times/year for 4 years or 2 times/year for 6 years
6. Miscellaneous
• Enlarging Published Rosters for Small SEPs
• Evaluating New vs. A2 Applications
• Sun Setting Additional Material
• Expecting Grantees to Serve
• Participating by Phone

Enhancing Peer ReviewCorporate NIH

Corporate NIH: Enhancing Peer Review
• The Charge from Dr. Zerhouni:
“Fund the best science, by the best scientists, with the least administrative burden…”
http://enhancing-peer-review.nih.gov
Two advisory committees to the NIH Director

The Process
DiagnosticDesign
Implementation Plan
Begin Phased Implementation
of Selected Actions
June 2007 – Feb. 2008 March 2008 – June 2008 September 2008
2

1. Review Highly Transformative Research
• OD Transformative RO1 (T-RO1)Awards once a year, funding for 5 yearsReviewed 740 first year, 500 second year , 300 this year1st year: 42 funded ($ 32 million)
• Editorial Board ReviewInitial scoring and selection of applications targeted for additional review, based on innovation and potential science transformation, by a small study section of distinguished, broad-science reviewers (the editors)Specific science reviewed by appropriate reviewers (subject experts-the editorial board)Final ranking by the editors

0%
1%
2%
3%
4%
5%
6%
7%
PIs in 1980
Perc
ent o
f PIs
2. Early Stage Career InvestigatorsProjection of Age Distribution of NIH RPG Investigators: 2020
25 30 35 40 45 50 55 60 65 70 75 80 85 90Age

2. Early Stage Career Investigators
Definition of New Investigator:• Not previously competed successfully as PI for a significant
NIH independent research award.
Definition of Early Stage Investigator:• Within 10 years of completing terminal research degree or
within 10 years of completing medical residency (or the equivalent).
New NIH Policy: Fund the same percentage of application for new and established investigators• Use different paylines for New Investigators and Early Stage
Investigators (Only R01)• Cluster the reviews of New Investigator R01 applications so
they are discussed together


4. Funding New Investigators
0.0%
5.0%
10.0%
15.0%
20.0%
25.0%
30.0%
35.0%
40.0%
45.0%
0
1,000
2,000
3,000
4,000
5,000
6,000
1962 1965 1968 1971 1974 1977 1980 1981 1984 1987 1992 1995 1998 2001 2004 2007 2010 est
New
Inve
stig
ator
s as
a Pe
rcen
tage
of A
ll Co
mpe
ting
Aw
arde
es
Num
ber o
f New
and
Exp
erie
nced
R01
Equ
ival
ent P
rinc
ipal
Inve
stig
ator
s
Fiscal Year
New and Experienced Investigators on R01 Equivalent Grants and New Investigators as a Percentage of All Competing R01 Awardees
(FY 1962 - 2010) preliminary
Established Investigators New Investigators Percent New
Source: http://nexus.od.nih.gov

Funding Longevity of NIH Investigators
0
2
4
6
8
10
12
Hal
f Life
of N
IH R
01 S
uppo
rt
Year of Initial R01 Support

3. Funding the Best Research Earlier

0%
10%
20%
30%
40%
50%
60%
70%
1998 1999 2000 2001 2002 2003 2004 2005 2006 2007 2008 2009 2010
Perc
ent o
f Tot
al A
war
dsPercent of R01 Awards by Amendment

Investigators’ Time-to-Award.New R01 Applications, by Year of Original A0 application.

A) Focusing More on Impact and Significance and Less on Approach
• Shorten Applications (13 or 7 pages instead of 25 or 12)• Scoring Significance• Discussed applications receive additional overall impact score• Training of Reviewers and Chairs
4. Improve Quality and Transparency of the Peer Review Process

B) Saving Reviewers’ Time
• Shorter Applications• Bullet Critiques• Additional Review Platforms
4. Improve Quality and Transparency of the Peer Review Process

Recent and Future Peer Review Changes
Changes initiated in May June 2009 Scores 1-9
• Assigned reviewers score each criteria• Shorter summary statement, with boxes for each criteria• Discussion of new investigators first• Scores of individual criteria given to all applicants• Discussed applications will receive additional overall
impact score
Changes initiated in 2010• Shorter application (12 pages for R01) designed to match
scoring criteria

1. Enhanced Review Criteria
• Overall Impact:Assessment of the likelihood for the project to exert a sustained, powerful influence on the research field(s)
• New Core Criteria Order:SignificanceInvestigator(s)InnovationApproachEnvironment

2. Template-Based Critiques
• The objective is to write evaluative statements and to avoid summarizing the application
• Comments should be in the form of bullet points or if necessary short narratives
• The entire template is uploaded to IAR to become part of the summary statement.
1. Significance Please limit text to ¼ pageStrengths•••Weaknesses•••

3. ScoringImpact Score Descriptor
High Impact
1 Exceptional
2 Outstanding
3 Excellent
Moderate Impact
4 Very Good
5 Good
6 Satisfactory
Low Impact
7 Fair
8 Marginal
9 Poor

3. ScoringPriority Scores of R01 and R21 Reviewed by CSR
0%
10%
20%
30%
40%
50%
60%
10 20 30 40 50 60 70 80 90
Cum
ulat
ive
Perc
ent
Priority Score
0%
10%
20%
30%
40%
50%
60%
100 150 200 250 300 350 400
Cum
ulat
ive
Perc
ent
Priority Score
June 2008
June 2009

Scores of R01 and R21 Reviewed by CSR
0
10
20
30
40
50
60
70
10 20 30 40 50 60 70 80 90
Cum
ulat
ive
Perc
ent
Overall Impact Score
Oct/Nov 2009 Meetings
Feb/March 2010 Meetings
June/July 2010 Meetings
4. Order of Review
Why?• Concern of variation of scores during different times of the
meeting. The original plan was to recalibrate scores at the end of the meeting
Solution:• Recalibrate dynamically by discussing in order of average
preliminary scores from assigned reviewers.
Requirement:• Reviewers must participate in entire meeting
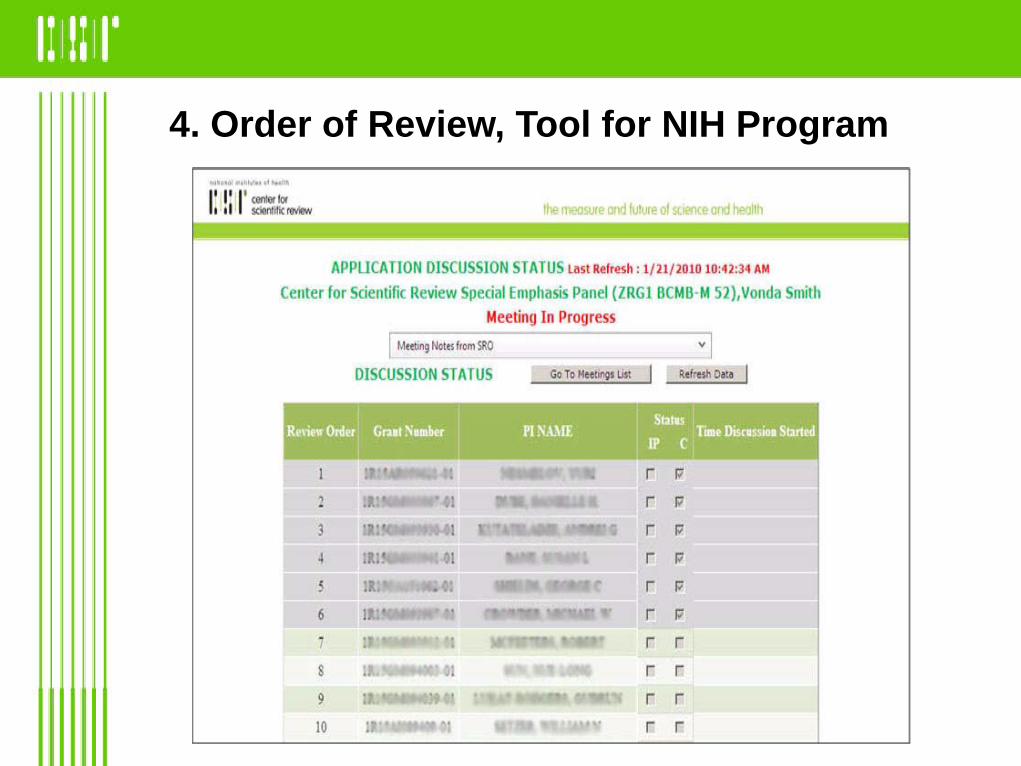
4. Order of Review, Tool for NIH Program

6. Enhancing Peer Review Training
• CSR and NIH Review Staff
6 face to face training sessions, January 20096 face to face training sessions, April 2009Continuous updating
• Chairs
For Chairs appointed in 2009 17 sessionsFor Chairs appointed in 2010, 16 sessionsFor Chairs appointed in 2011 10 sections planned
• Reviewers
Training material (Power Point, interactive training, frequently asked questions, mock study section video, Senior CSR staff at the first meetings

Continuously Reviewing the Changes
• 12/09 Applicant and Reviewers Survey (64% response)
• 1/10 Advisory Council Survey (291 responses)
• 5/11 Planned Survey on Shorter Applications

Key Findings from Reviewers and Councils
• Councils have necessary information to make decisions
• Reviewers like 9 point scoring scale
• Overall impact score is NOT the average of criteria scores
• Approach is most influential criteria score (easiest to assess)
• Clustering works --no difference in scoring ~ ESI/established
• New change—have reviewer write overall impact paragraph
The Marcy Speer Award
Outstanding CSR Peer Reviewer
2010
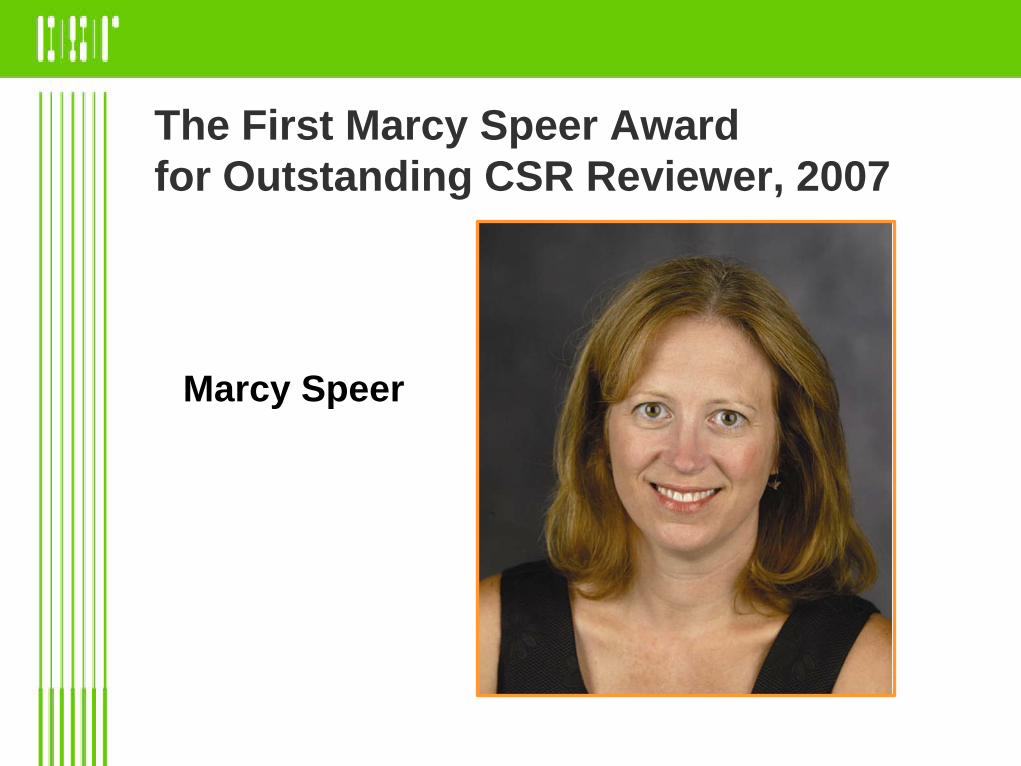
The First Marcy Speer Awardfor Outstanding CSR Reviewer, 2007
Marcy Speer

The 2010 Marcy Speer Awardfor Outstanding CSR Reviewer peer
Alice ClarkUniversity of Mississippi

0
5
10
15
20
25
30
35
0 5 10 15 20 25 30 35
Cum
mul
ativ
e Pe
rcen
t
Percentile
2004-2007 All Clinical vs. All Non Clinical R01s
Clincal Non-Clinical Reference
18.19
21.46
5. Reviewing Clinical Applications
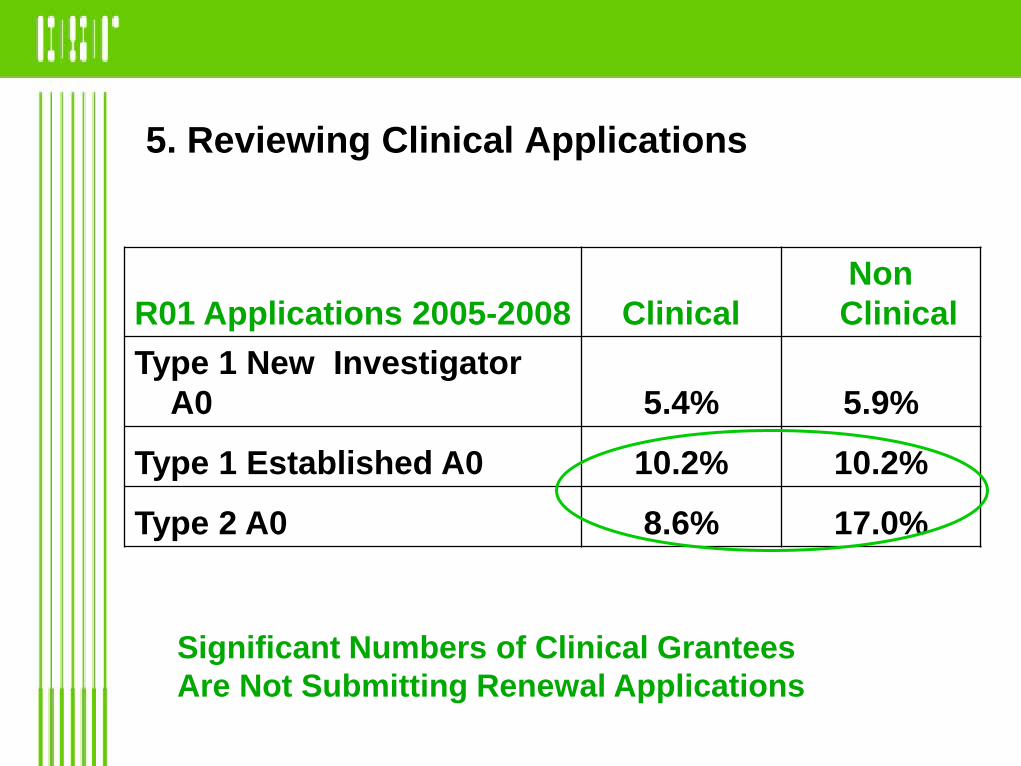
5. Reviewing Clinical Applications
R01 Applications 2005-2008 ClinicalNon Clinical
Type 1 New Investigator A0 5.4% 5.9%
Type 1 Established A0 10.2% 10.2%
Type 2 A0 8.6% 17.0%
Significant Numbers of Clinical Grantees Are Not Submitting Renewal Applications