challenges and opportunities in monitoring of emission ... · 16/05/2017 · challenges and...
TRANSCRIPT
Challenges and Opportunities in
Monitoring of Emission Reductions in
World Bank Land Use Carbon Finance
Programs
Andres Espejo
Forest Carbon Partnership Facility
BioCarbon Fund
May 25, 2017
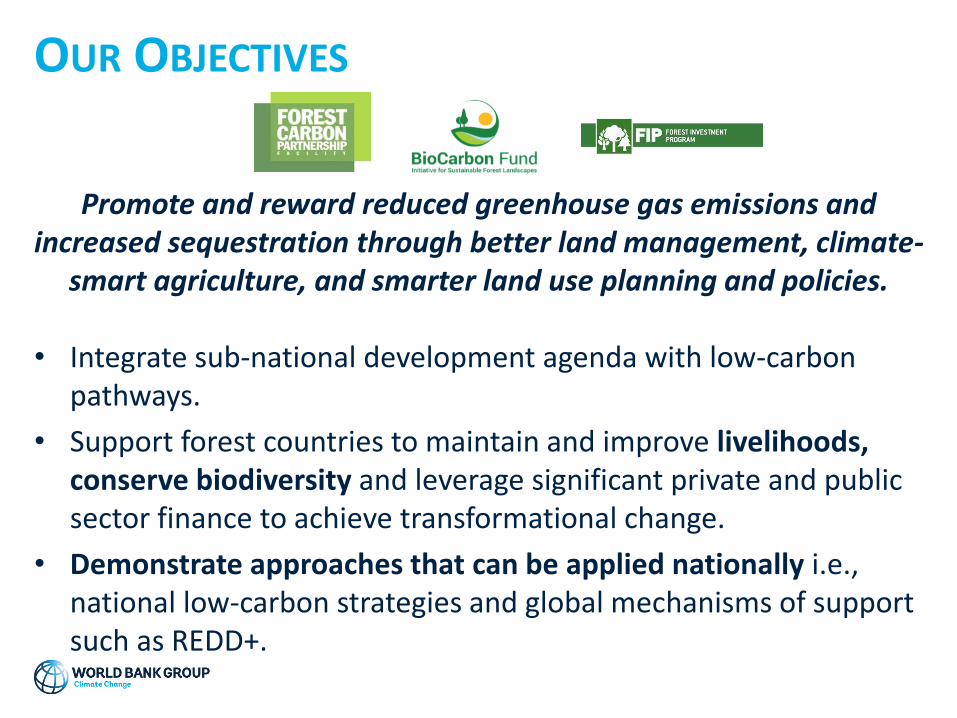
OUR OBJECTIVES
Promote and reward reduced greenhouse gas emissions and increased sequestration through better land management, climate-
smart agriculture, and smarter land use planning and policies.
• Integrate sub-national development agenda with low-carbon pathways.
• Support forest countries to maintain and improve livelihoods, conserve biodiversity and leverage significant private and public sector finance to achieve transformational change.
• Demonstrate approaches that can be applied nationally i.e., national low-carbon strategies and global mechanisms of support such as REDD+.
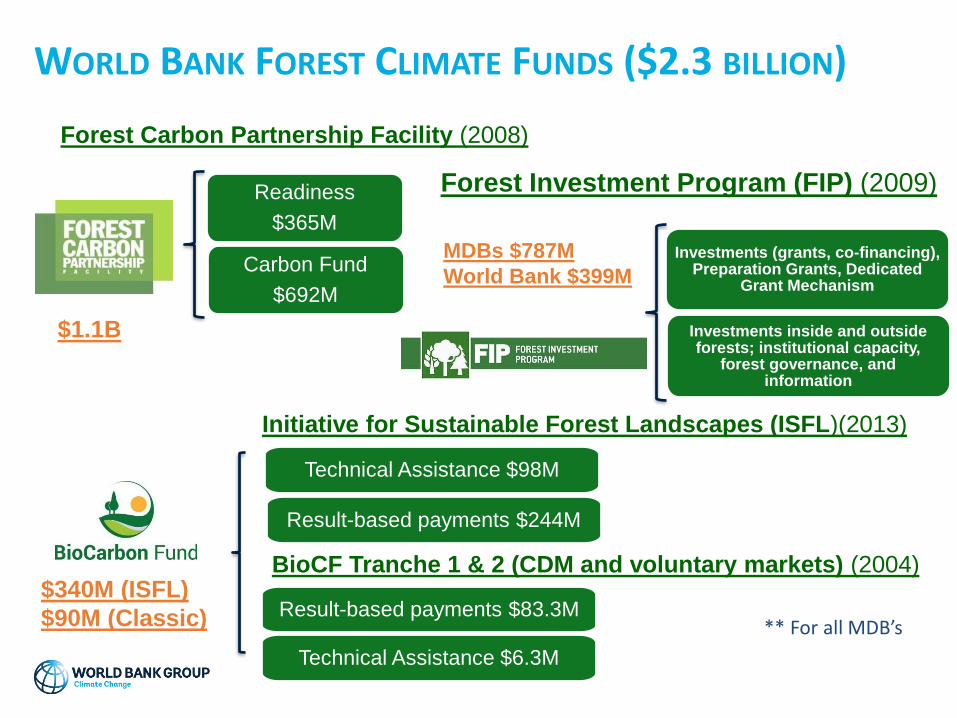
WORLD BANK FOREST CLIMATE FUNDS ($2.3 BILLION)
Readiness
$365M
Carbon Fund
$692M
Technical Assistance $98M
Result-based payments $244M
Initiative for Sustainable Forest Landscapes (ISFL)(2013)
BioCF Tranche 1 & 2 (CDM and voluntary markets) (2004)
Technical Assistance $6.3M
Result-based payments $83.3M
Forest Carbon Partnership Facility (2008)
$340M (ISFL)
$90M (Classic)
$1.1B
Forest Investment Program (FIP) (2009)
Investments (grants, co-financing), Preparation Grants, Dedicated
Grant Mechanism
Investments inside and outside forests; institutional capacity,
forest governance, and information
MDBs $787M
World Bank $399M
** For all MDB’s
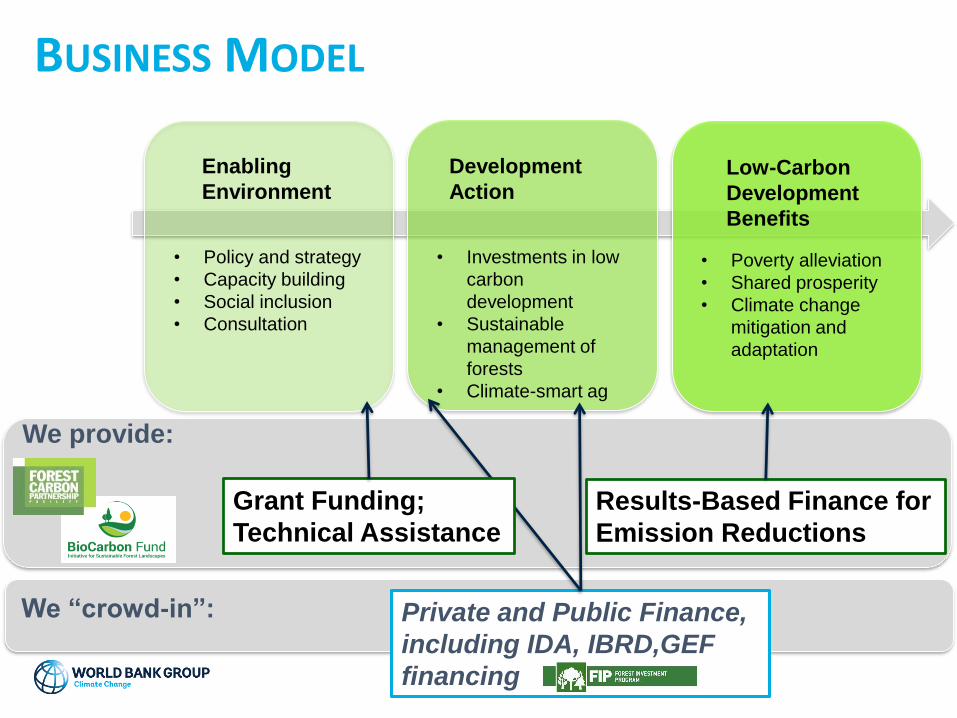
BUSINESS MODEL
Enabling
EnvironmentLow-Carbon
Development
Benefits
Development
Action
• Policy and strategy
• Capacity building
• Social inclusion
• Consultation
• Investments in low
carbon
development
• Sustainable
management of
forests
• Climate-smart ag
• Poverty alleviation
• Shared prosperity
• Climate change
mitigation and
adaptation
Results-Based Finance for
Emission Reductions
Private and Public Finance,
including IDA, IBRD,GEF
financing
Grant Funding;
Technical Assistance
We provide:
We “crowd-in”:
20302015
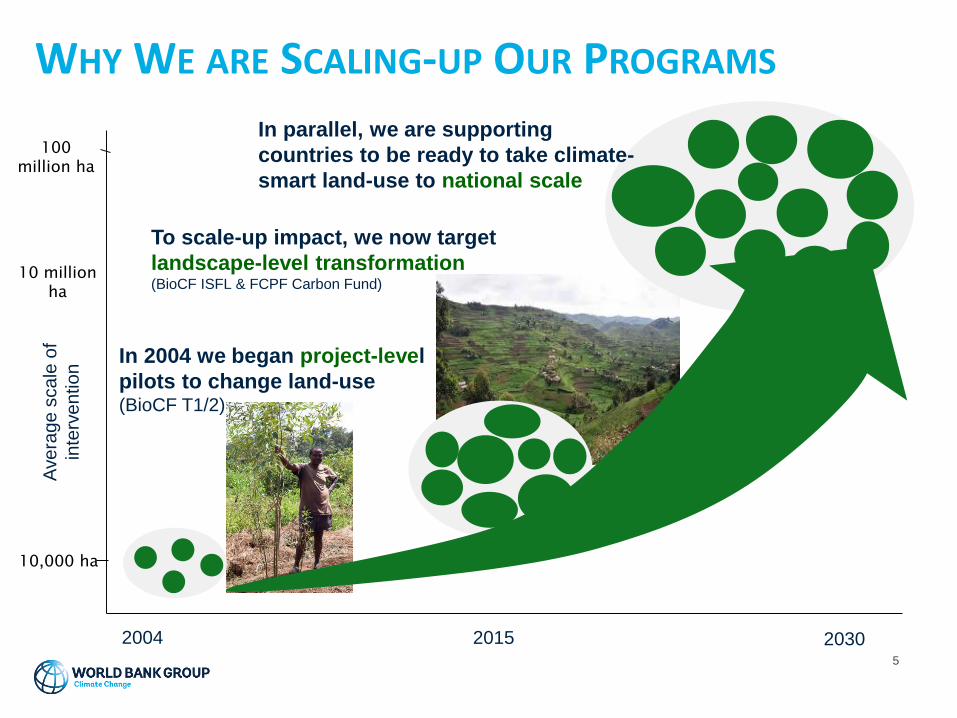
In 2004 we began project-level
pilots to change land-use (BioCF T1/2)
To scale-up impact, we now target
landscape-level transformation (BioCF ISFL & FCPF Carbon Fund)
10,000 ha
10 million
ha
Ave
rag
e s
ca
le o
f
inte
rve
ntio
nWHY WE ARE SCALING-UP OUR PROGRAMS
20045
100
million ha
In parallel, we are supporting
countries to be ready to take climate-
smart land-use to national scale
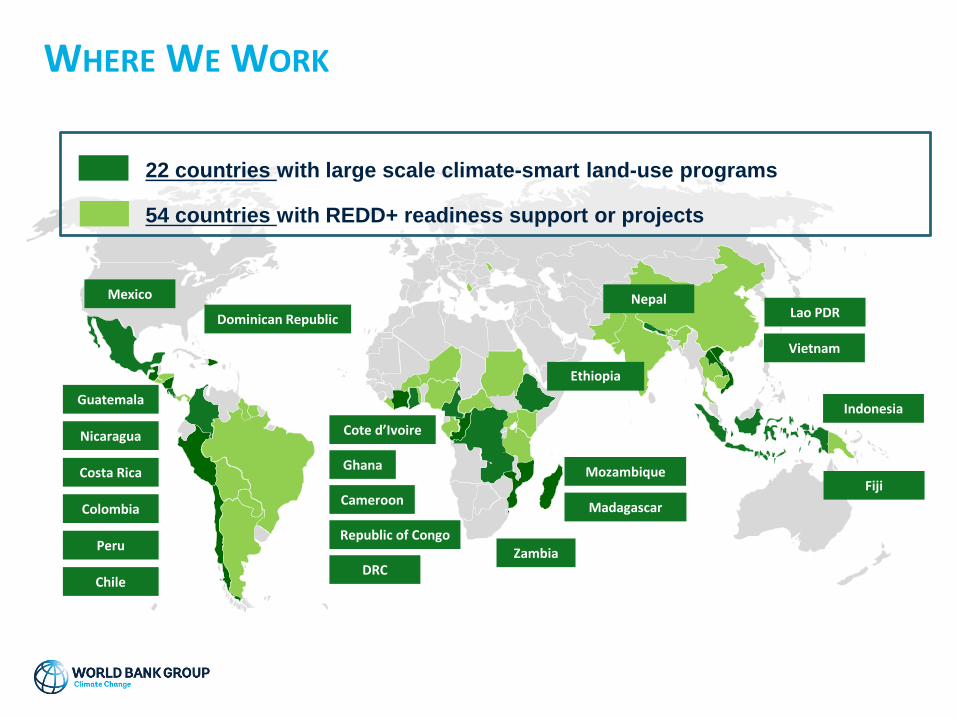
WHERE WE WORK
Zambia
Ethiopia
Ghana
Colombia
Indonesia
Costa Rica
Mexico Nepal
DRC
Republic of Congo
Chile
Vietnam
22 countries with large scale climate-smart land-use programs
54 countries with REDD+ readiness support or projects
Guatemala
Peru
Mozambique
Madagascar
Dominican Republic Lao PDR
Nicaragua
FijiCameroon
Cote d’Ivoire
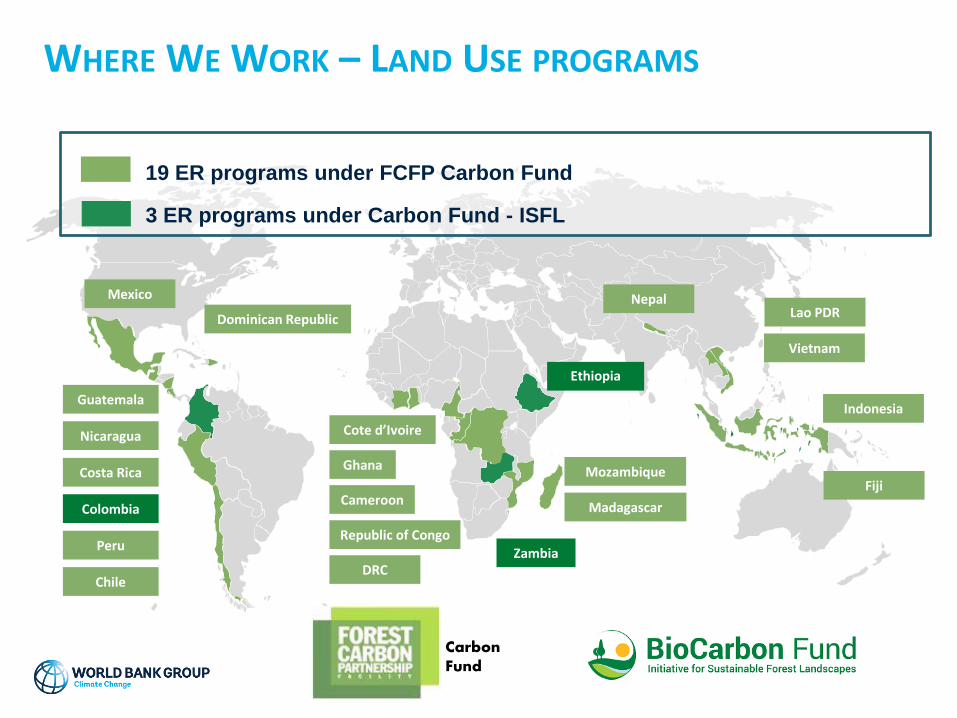
WHERE WE WORK – LAND USE PROGRAMS
Zambia
Ethiopia
Ghana
Colombia
Indonesia
Costa Rica
Mexico Nepal
DRC
Republic of Congo
Chile
Vietnam
19 ER programs under FCFP Carbon Fund
3 ER programs under Carbon Fund - ISFL
Guatemala
Peru
Mozambique
Madagascar
Dominican Republic Lao PDR
Nicaragua
FijiCameroon
Cote d’Ivoire
Carbon Fund
8
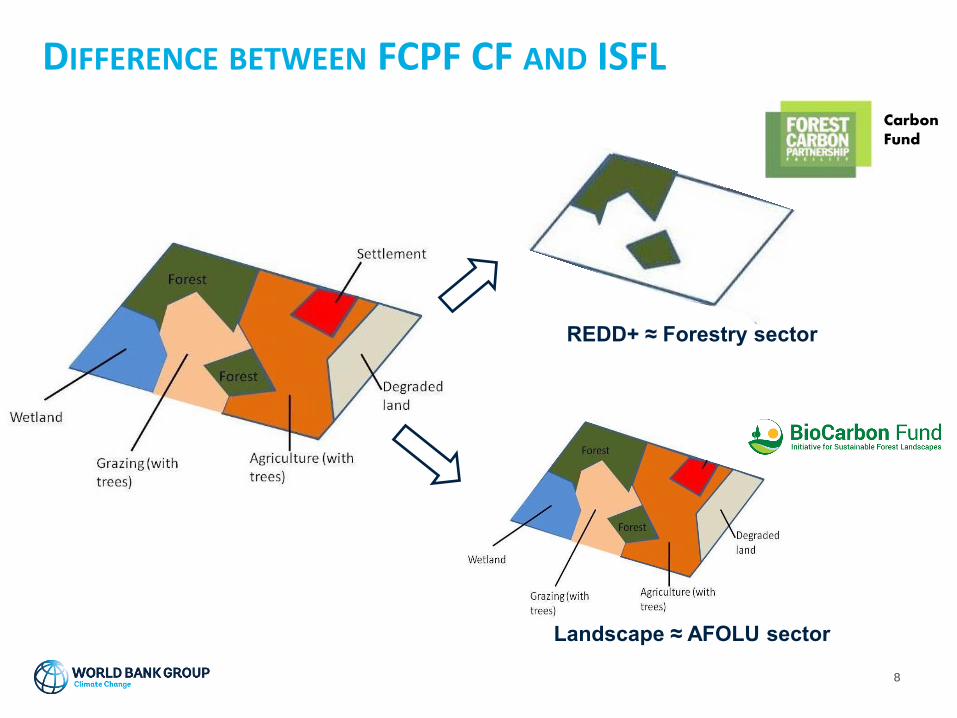
DIFFERENCE BETWEEN FCPF CF AND ISFL
Carbon Fund
REDD+ ≈ Forestry sector
Landscape ≈ AFOLU sector
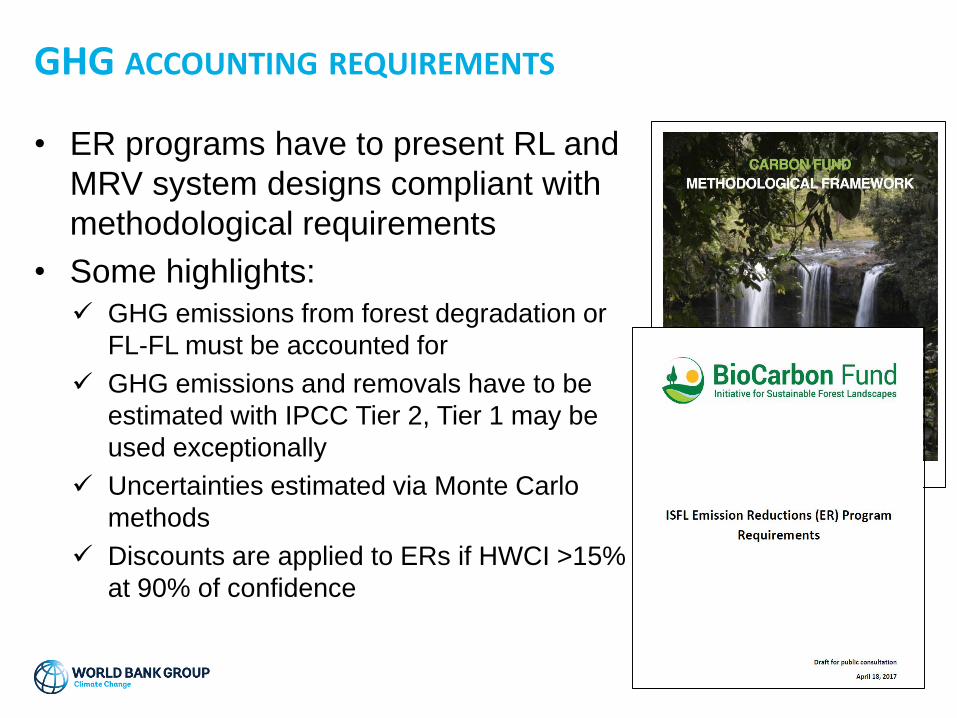
• ER programs have to present RL and
MRV system designs compliant with
methodological requirements
• Some highlights:
✓ GHG emissions from forest degradation or
FL-FL must be accounted for
✓ GHG emissions and removals have to be
estimated with IPCC Tier 2, Tier 1 may be
used exceptionally
✓ Uncertainties estimated via Monte Carlo
methods
✓ Discounts are applied to ERs if HWCI >15%
at 90% of confidence
9
GHG ACCOUNTING REQUIREMENTS
• 7 ER programs have presented Reference Levels so far
• Some figures…
10
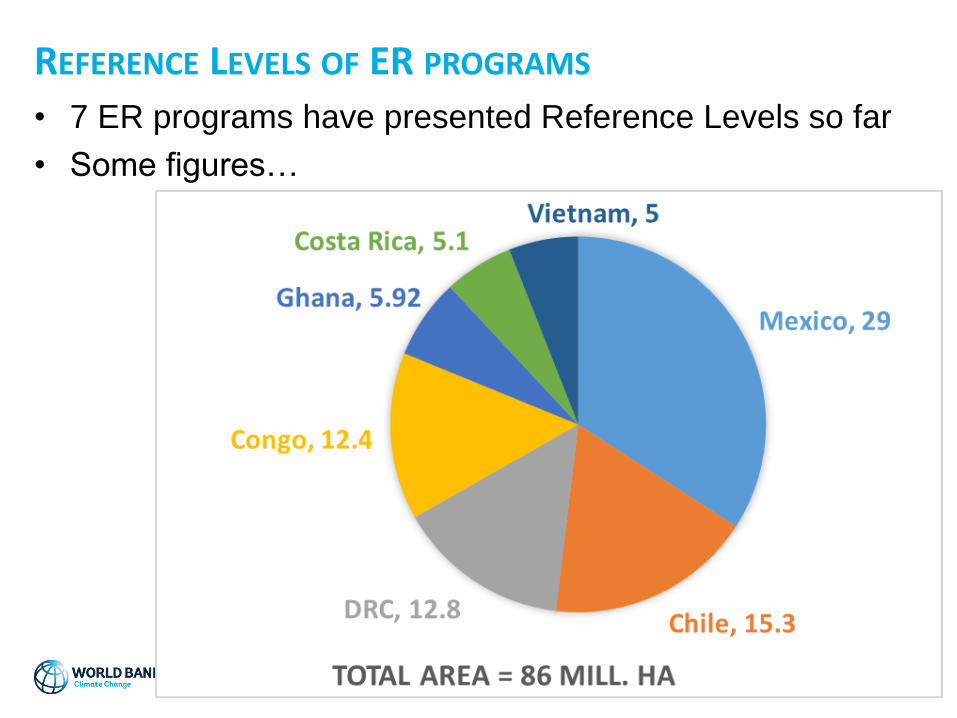
REFERENCE LEVELS OF ER PROGRAMS
• 7 ER programs have presented Reference Levels so far
• Some figures…
11
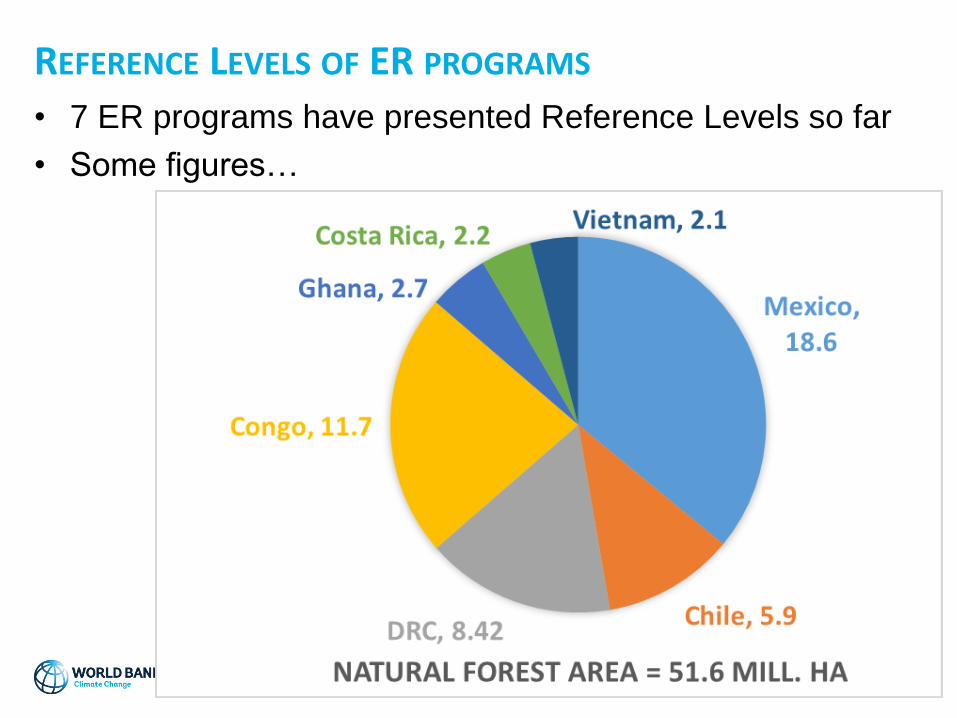
REFERENCE LEVELS OF ER PROGRAMS
• 7 ER programs have presented Reference Levels so far
• Some figures…
12
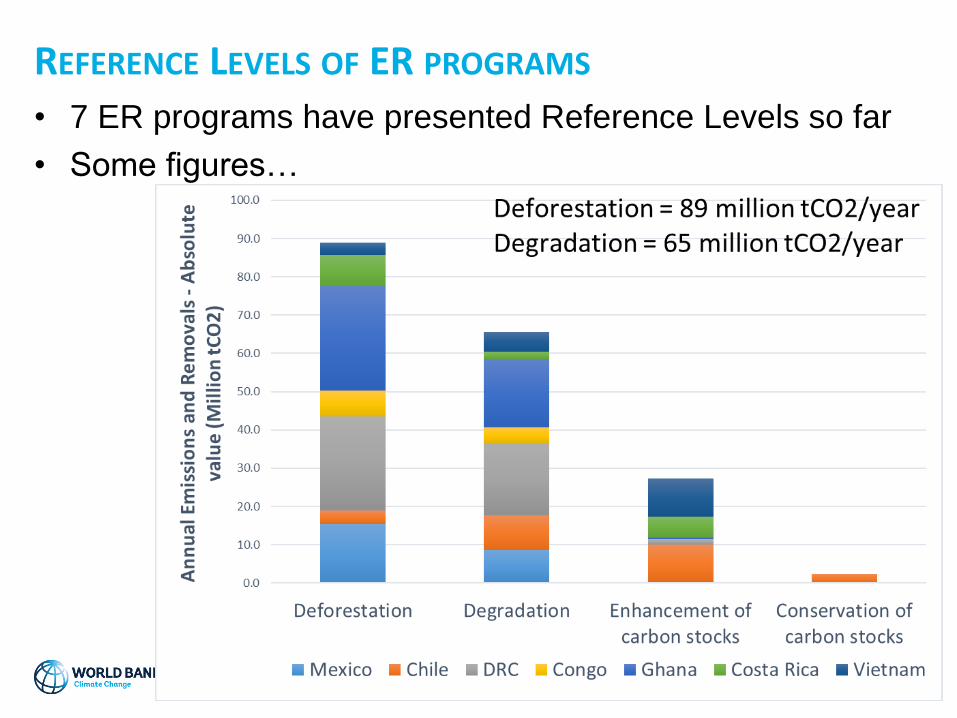
REFERENCE LEVELS OF ER PROGRAMS
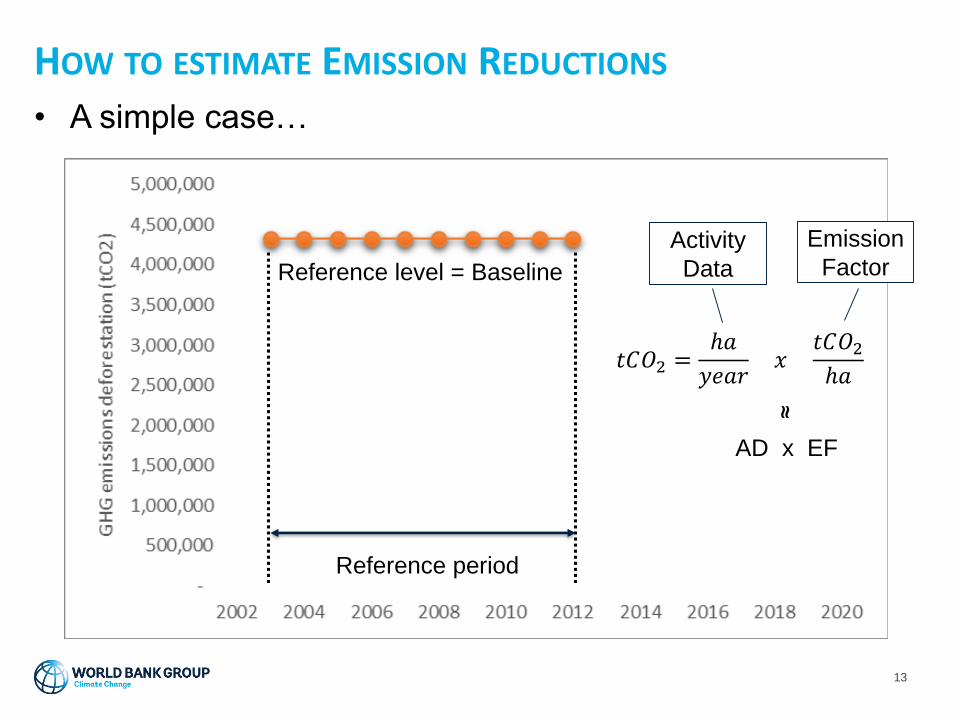
• A simple case…
13
HOW TO ESTIMATE EMISSION REDUCTIONS
Reference period
Reference level = Baseline
AD x EF
𝑡𝐶𝑂2 =ℎ𝑎
𝑦𝑒𝑎𝑟𝑥
𝑡𝐶𝑂2ℎ𝑎
Activity
Data
Emission
Factor
≈
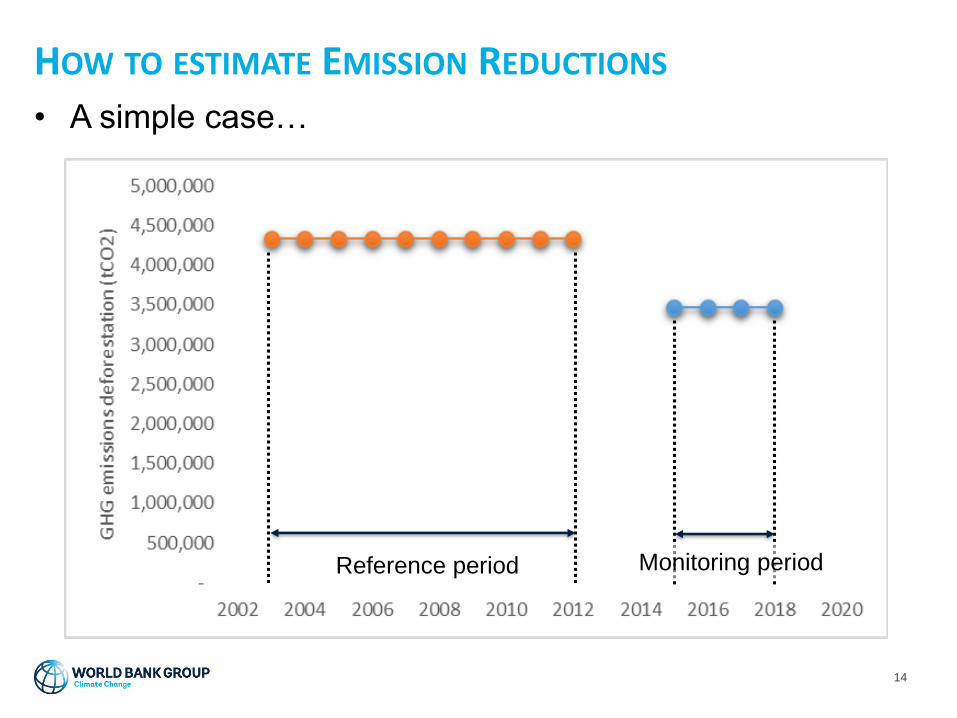
• A simple case…
14
HOW TO ESTIMATE EMISSION REDUCTIONS
Monitoring periodReference period
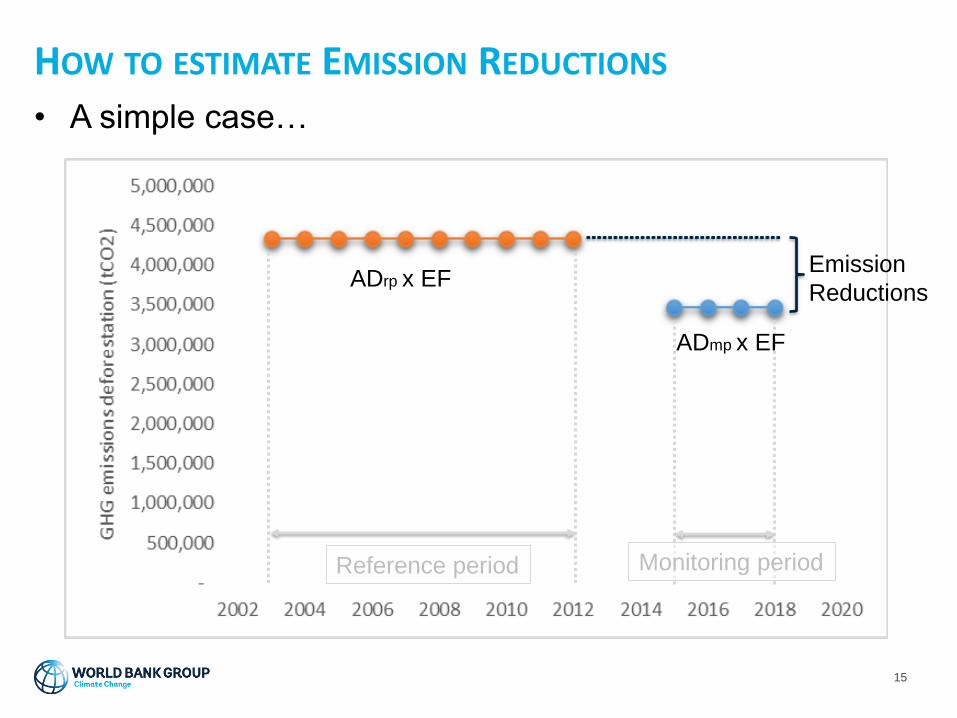
• A simple case…
15
HOW TO ESTIMATE EMISSION REDUCTIONS
Emission
ReductionsADrp x EF
Monitoring periodReference period
ADmp x EF
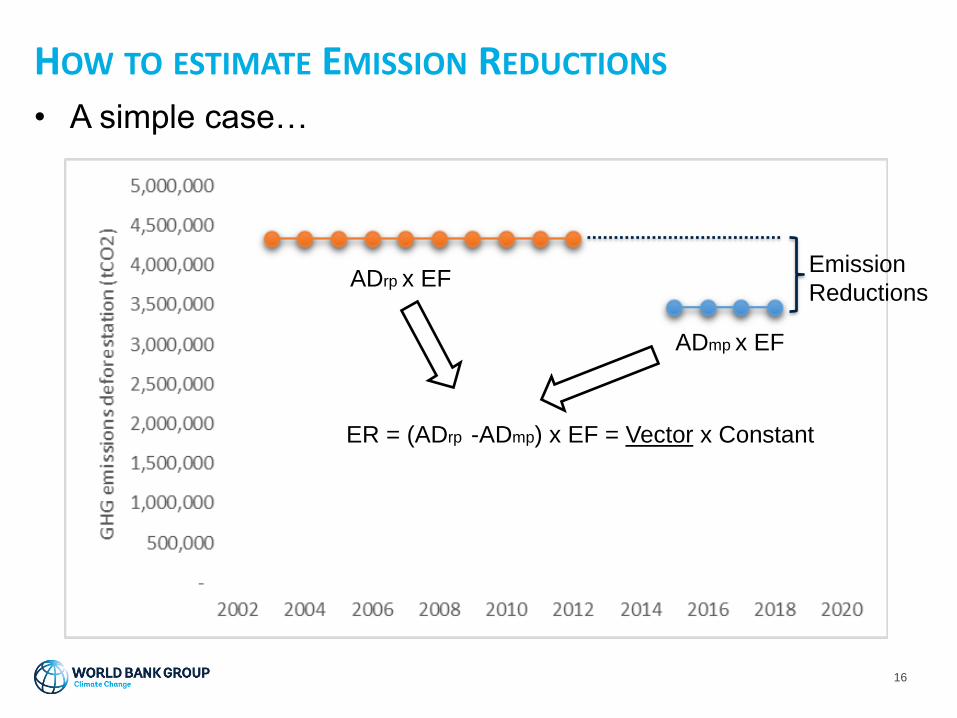
• A simple case…
16
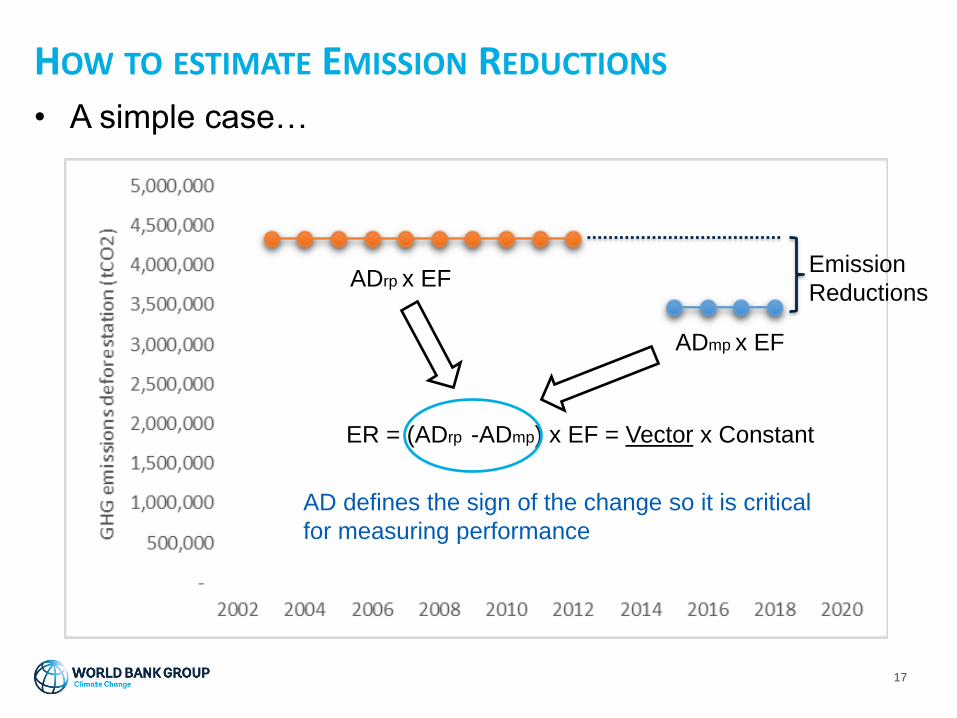
HOW TO ESTIMATE EMISSION REDUCTIONS
Emission
ReductionsADrp x EF
ADmp x EF
ER = (ADrp -ADmp) x EF = Vector x Constant
• A simple case…
17
HOW TO ESTIMATE EMISSION REDUCTIONS
Emission
ReductionsADrp x EF
ADmp x EF
ER = (ADrp -ADmp) x EF = Vector x Constant
AD defines the sign of the change so it is critical
for measuring performance
ACTIVITY DATA ESTIMATION – CHALLENGES
• Activity data has been usually estimated with EO data
with two approaches:
• Wall-to-wall approach, i.e. maps
• Sampling approach
• However, the use of maps has some issues…
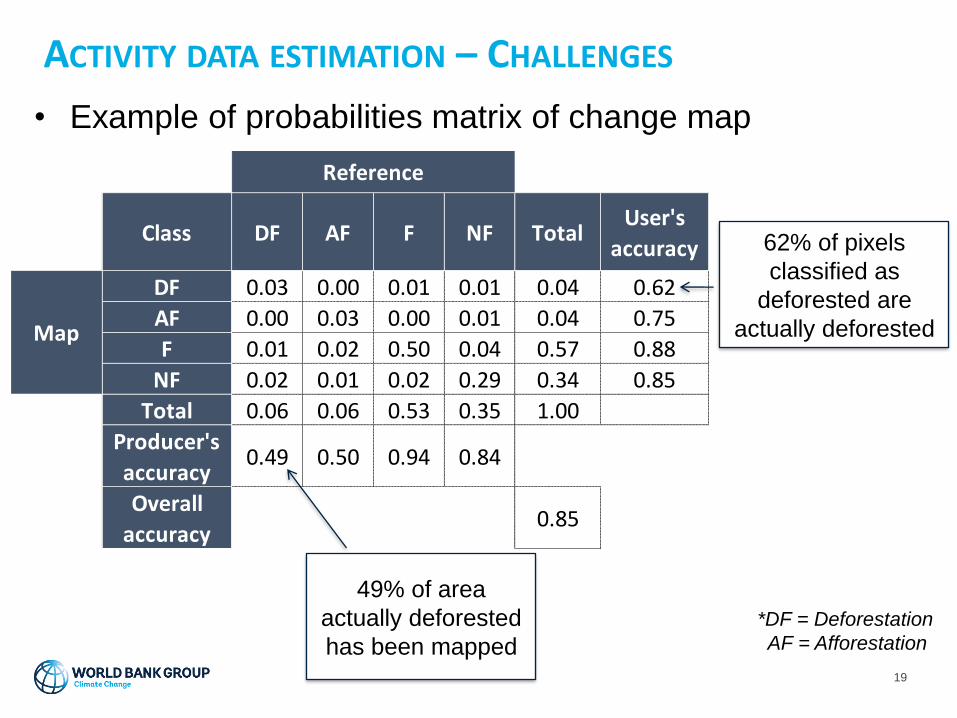
Class DF AF F NF TotalUser's
accuracy
DF 0.03 0.00 0.01 0.01 0.04 0.62
AF 0.00 0.03 0.00 0.01 0.04 0.75
F 0.01 0.02 0.50 0.04 0.57 0.88
NF 0.02 0.01 0.02 0.29 0.34 0.85
Total 0.06 0.06 0.53 0.35 1.00
Producer's
accuracy0.49 0.50 0.94 0.84
Overall
accuracy0.85
Reference
Map
ACTIVITY DATA ESTIMATION – CHALLENGES
19
• Example of probabilities matrix of change map
62% of pixels
classified as
deforested are
actually deforested
49% of area
actually deforested
has been mapped
*DF = Deforestation
AF = Afforestation
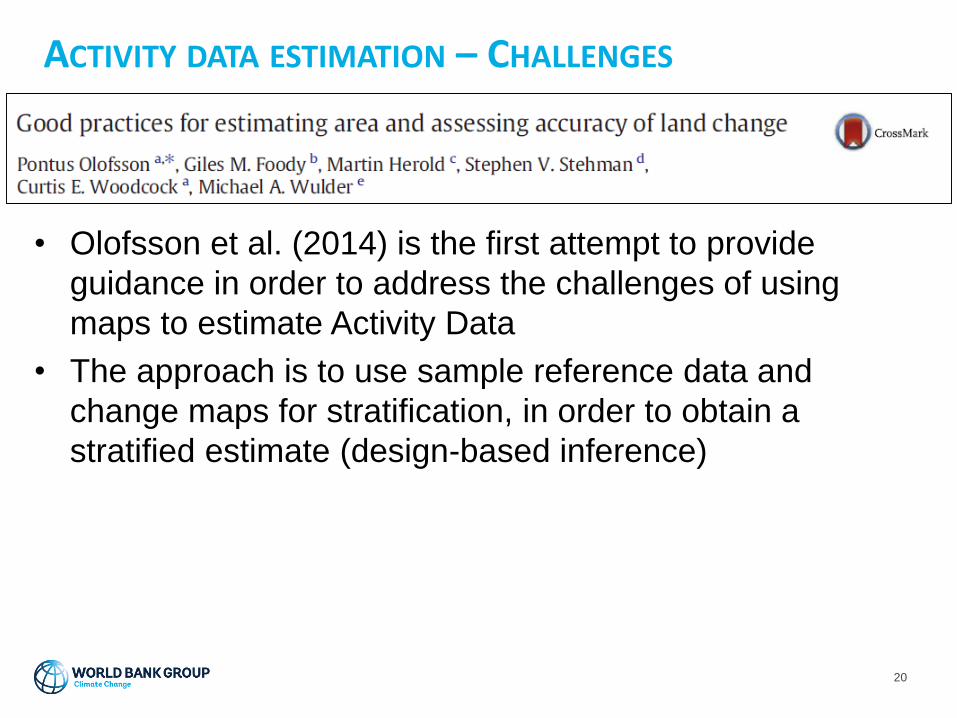
20
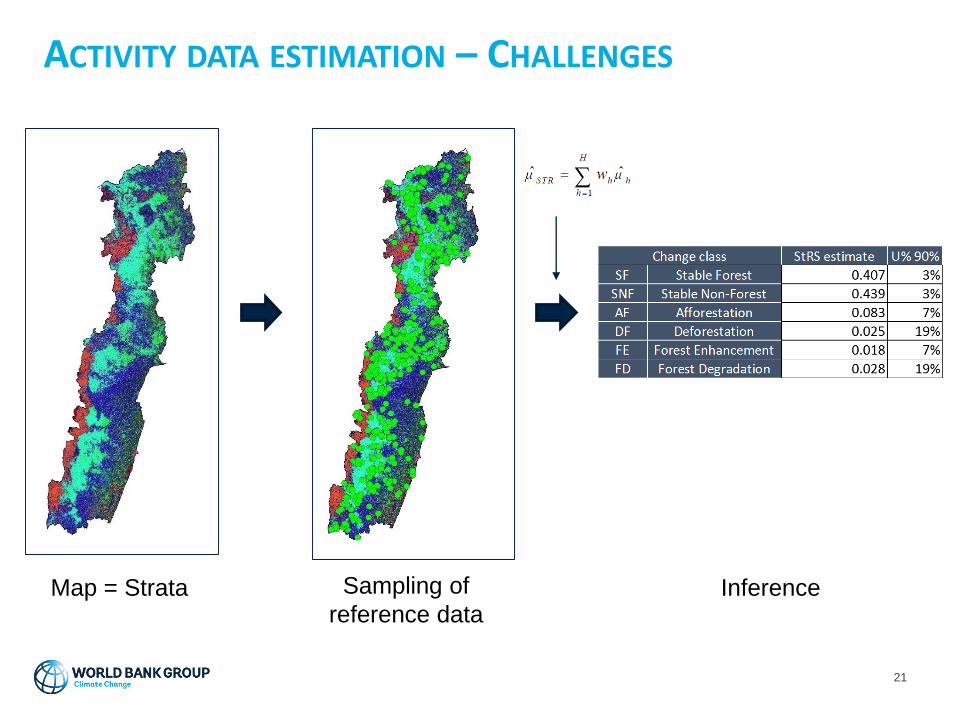
• Olofsson et al. (2014) is the first attempt to provide
guidance in order to address the challenges of using
maps to estimate Activity Data
• The approach is to use sample reference data and
change maps for stratification, in order to obtain a
stratified estimate (design-based inference)
ACTIVITY DATA ESTIMATION – CHALLENGES
21
Map = Strata Sampling of
reference dataInference
ACTIVITY DATA ESTIMATION – CHALLENGES
22
• Five out of seven programs of the CF have applied this
guidance
• Costa Rica has not applied it as it has applied complex
Tier 3 integration frameworks for estimating the RL
• However, some challenges have been faced when
establishing their Reference Levels…
ACTIVITY DATA ESTIMATION – CHALLENGES
23
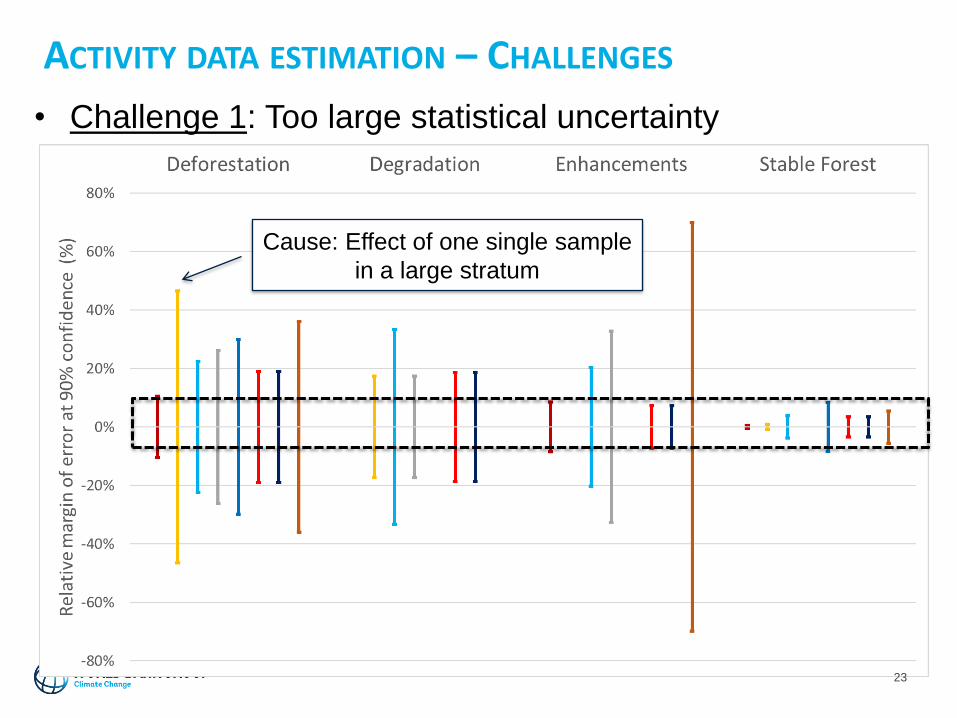
• Challenge 1: Too large statistical uncertainty
Cause: Effect of one single sample
in a large stratum
ACTIVITY DATA ESTIMATION – CHALLENGES
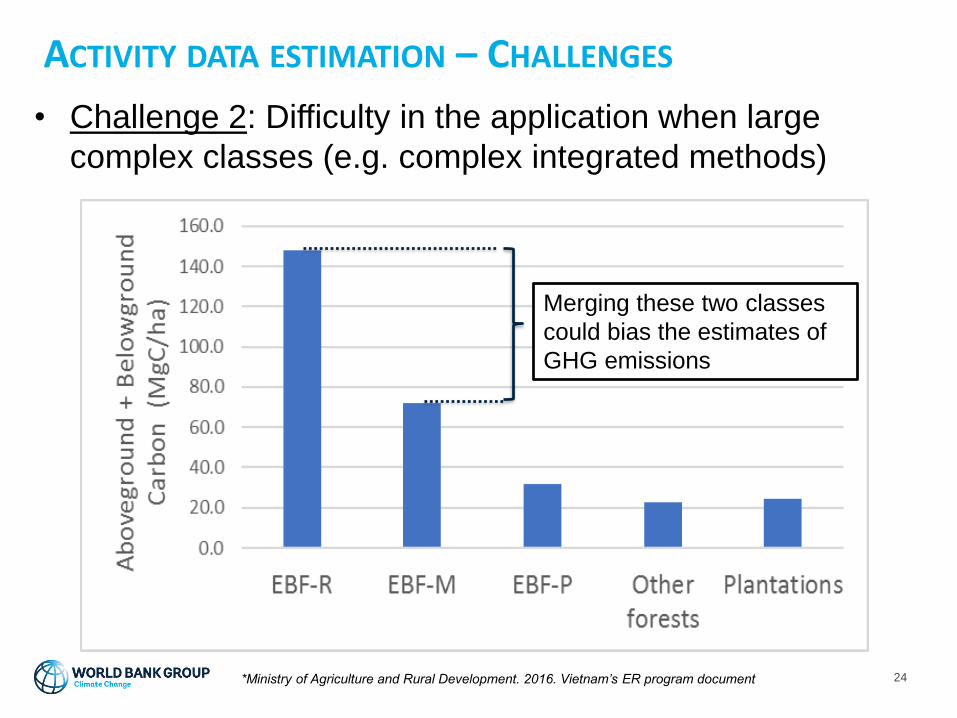
24*Ministry of Agriculture and Rural Development. 2016. Vietnam’s ER program document
• Challenge 2: Difficulty in the application when large
complex classes (e.g. complex integrated methods)
Merging these two classes
could bias the estimates of
GHG emissions
ACTIVITY DATA ESTIMATION – CHALLENGES
25
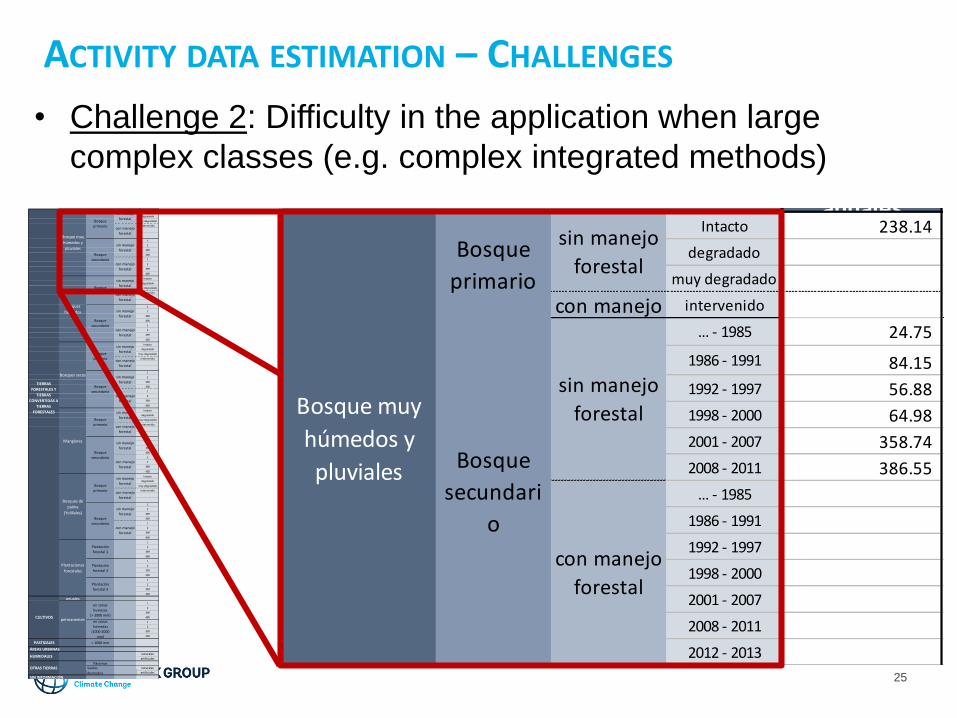
• Challenge 2: Difficulty in the application when large
complex classes (e.g. complex integrated methods)
Intacto
degradado
muy degradado
intervenido
1
2
399
400
1
2
399
400
Intacto
degradado
muy degradado
intervenido
1
2
399
400
1
2
399
400
Intacto
degradado
muy degradado
intervenido
1
2
399
400
1
2
399
400
Intacto
degradado
muy degradado
intervenido
1
2
399
400
1
2
399
400
Intacto
degradado
muy degradado
intervenido
1
2
399
400
1
2
399
400
1
2
399
400
1
2
399
400
1
2
399
400
anuales1
2
399
400
1
2
399
400
PASTIZALES > 1000 mm
ÁREAS URBANASnaturales
artificiales
Páramos OTRAS TIERRAS naturales
artificiales
SIN INFORMACIÓN
CULTIVOS
Bosque
secundario
sin manejo
forestal
con manejo
forestal
TIERRAS
FORESTALES Y
TIERRAS
CONVERTIDAS A
TIERRAS
FORESTALES
Bosque
primario
sin manejo
forestal
con manejo
forestal
Bosque
primario
sin manejo
forestal
con manejo
forestal
Manglares
Bosques de
palma
(Yolillales)Bosque
secundario
Bosques
húmedos
Bosque
secundario
sin manejo
forestal
con manejo
forestal
sin manejo
forestal
con manejo
forestal
Bosque
primario
Bosques secos
Bosque
secundario
sin manejo
forestal
con manejo
forestal
Bosque
secundario
HUMEDALES
Bosque
primario
sin manejo
forestal
con manejo
forestal
Suelos
desnudos
con manejo
forestal
sin manejo
forestal
Bosque
primario
sin manejo
forestal
con manejo
forestal
en zonas
húmedas
(1000-2000
mm)
Bosque muy
húmedos y
pluviales
Plantación
forestal 2
Plantación
forestal 3
Plantaciones
forestales
en zonas
lluviosas
(> 2000 mm)permanentes
Plantación
forestal 1
sin manejo
forestal
con manejo
forestal
2.00 Cultivos
anualesIntacto 238.14
degradado
muy degradado
intervenido
… - 1985 24.75
1986 - 1991 84.15
1992 - 1997 56.88
1998 - 2000 64.98
2001 - 2007 358.74
2008 - 2011 386.55
… - 1985
1986 - 1991
1992 - 1997
1998 - 2000
2001 - 2007
2008 - 2011
2012 - 2013
Bosque muy
húmedos y
pluviales
Bosque
primario
sin manejo
forestal
con manejo
Bosque
secundari
o
sin manejo
forestal
con manejo
forestal
ACTIVITY DATA ESTIMATION – CHALLENGES
26
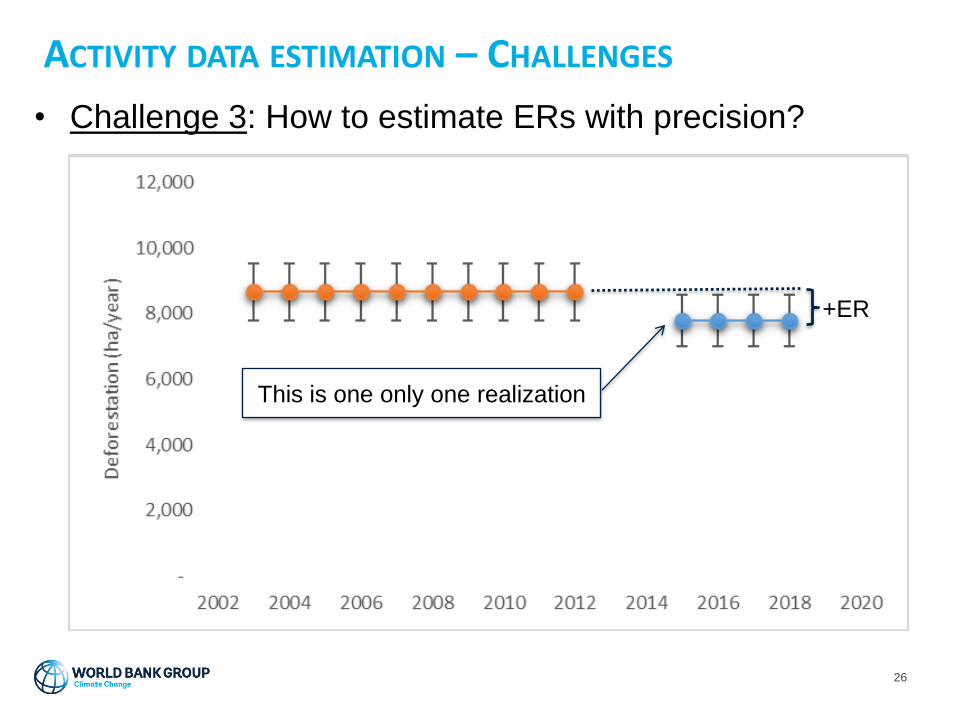
• Challenge 3: How to estimate ERs with precision?
ACTIVITY DATA ESTIMATION – CHALLENGES
This is one only one realization
+ER
27
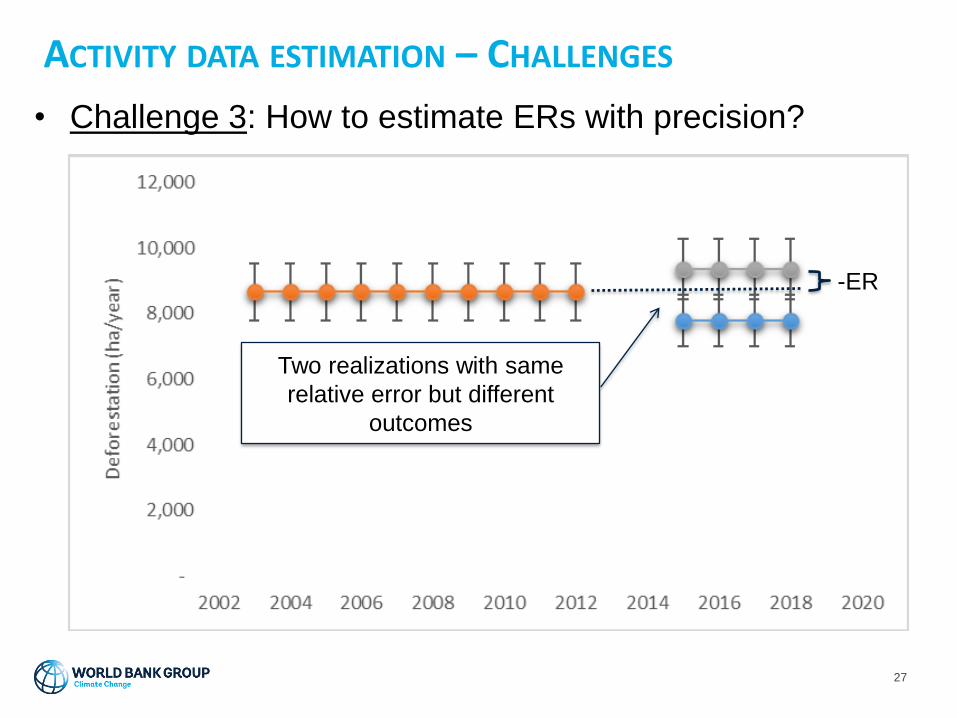
• Challenge 3: How to estimate ERs with precision?
ACTIVITY DATA ESTIMATION – CHALLENGES
Two realizations with same
relative error but different
outcomes
-ER
28
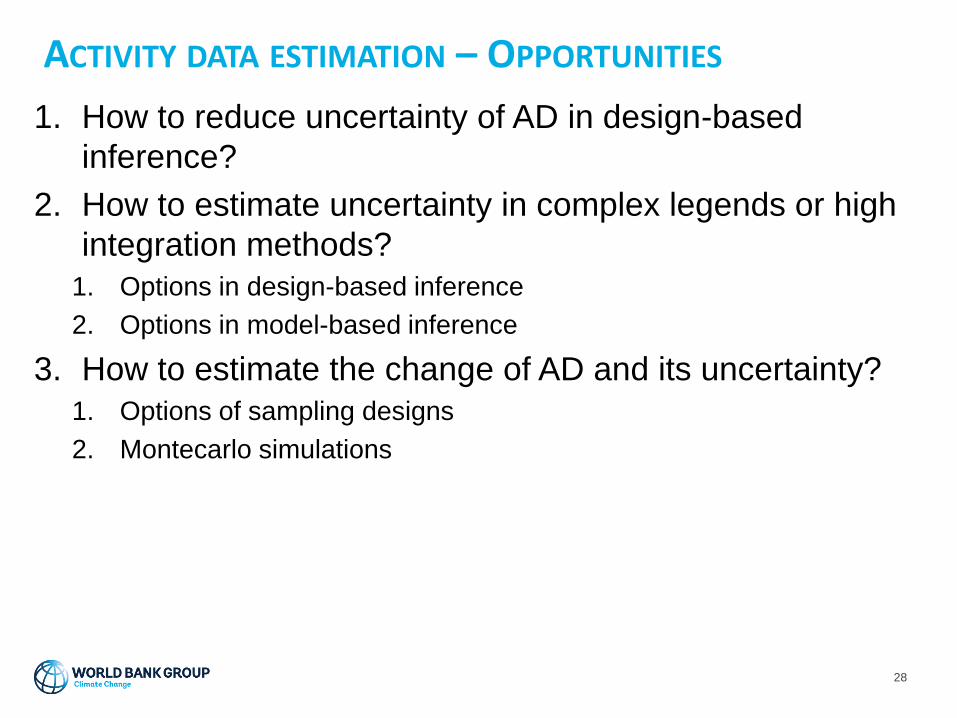
1. How to reduce uncertainty of AD in design-based
inference?
2. How to estimate uncertainty in complex legends or high
integration methods?
1. Options in design-based inference
2. Options in model-based inference
3. How to estimate the change of AD and its uncertainty?
1. Options of sampling designs
2. Montecarlo simulations
ACTIVITY DATA ESTIMATION – OPPORTUNITIES
29
• The methodological requirements of the CF/ISFL require
accounting of GHG emissions from degradation
• ER programs have piloted different methods to estimate
degradation
• ER programs have successfully estimated GHG
emissions from degradation…
• …yet, still many uncertainties and limitations
OTHER CHALLENGES AND OPPORTUNITIES - DEGRADATION
30
OTHER CHALLENGES AND OPPORTUNITIES - DEGRADATION
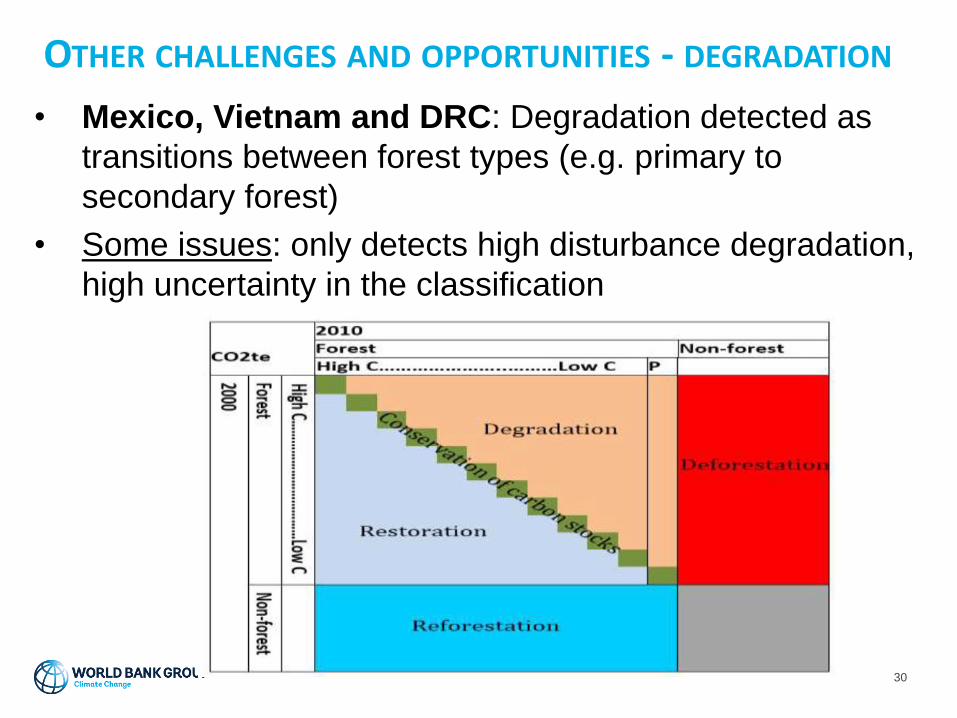
• Mexico, Vietnam and DRC: Degradation detected as
transitions between forest types (e.g. primary to
secondary forest)
• Some issues: only detects high disturbance degradation,
high uncertainty in the classification
31
OTHER CHALLENGES AND OPPORTUNITIES - DEGRADATION
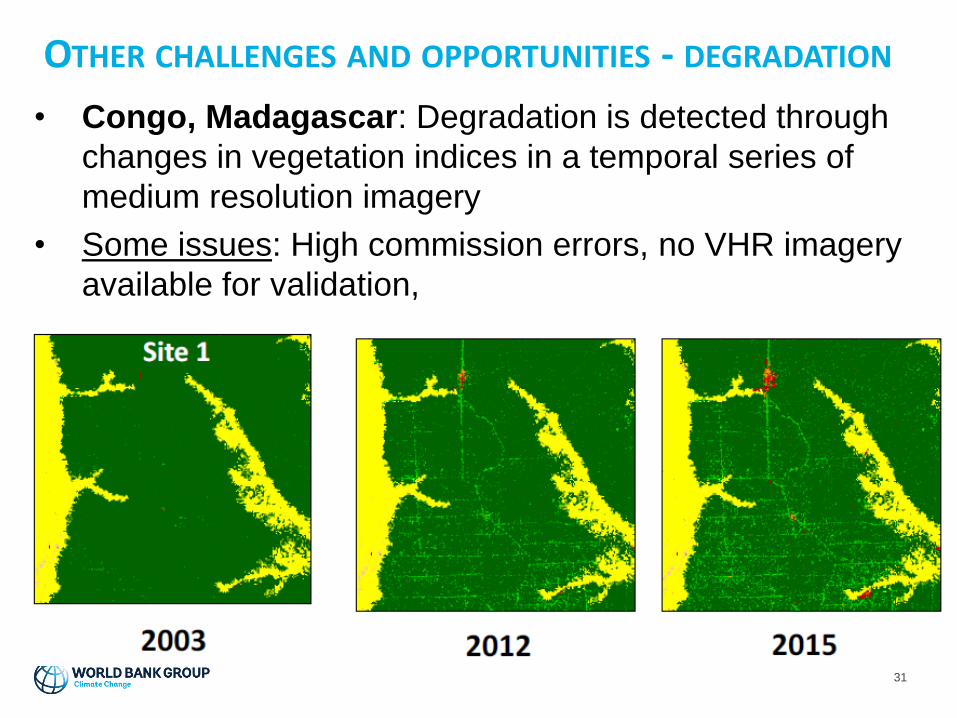
• Congo, Madagascar: Degradation is detected through
changes in vegetation indices in a temporal series of
medium resolution imagery
• Some issues: High commission errors, no VHR imagery
available for validation,
32
OTHER CHALLENGES AND OPPORTUNITIES - DEGRADATION
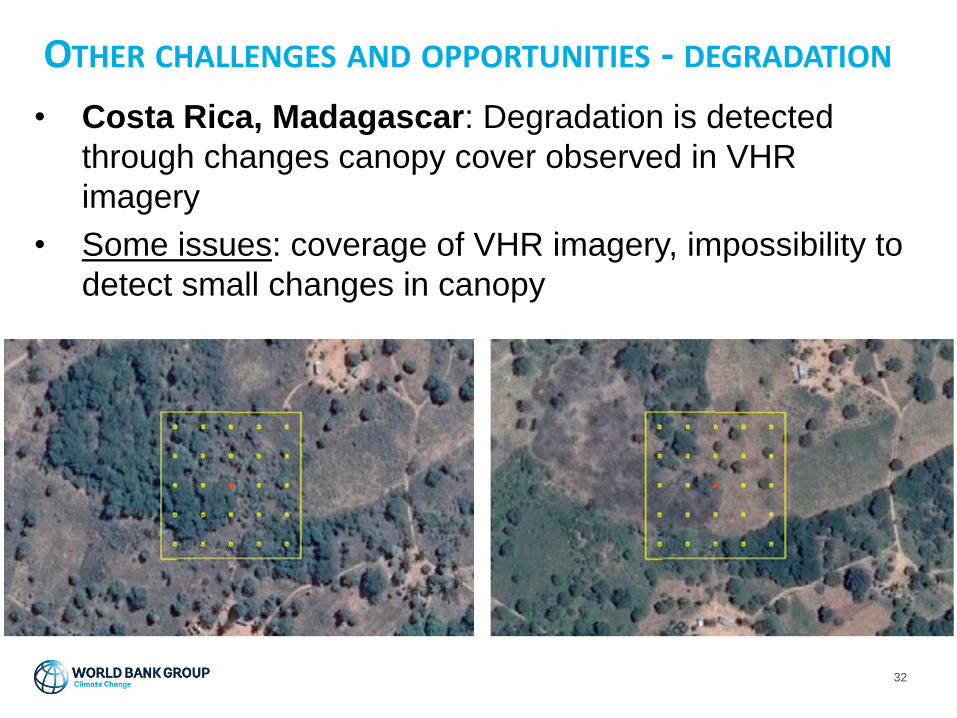
• Costa Rica, Madagascar: Degradation is detected
through changes canopy cover observed in VHR
imagery
• Some issues: coverage of VHR imagery, impossibility to
detect small changes in canopy
33
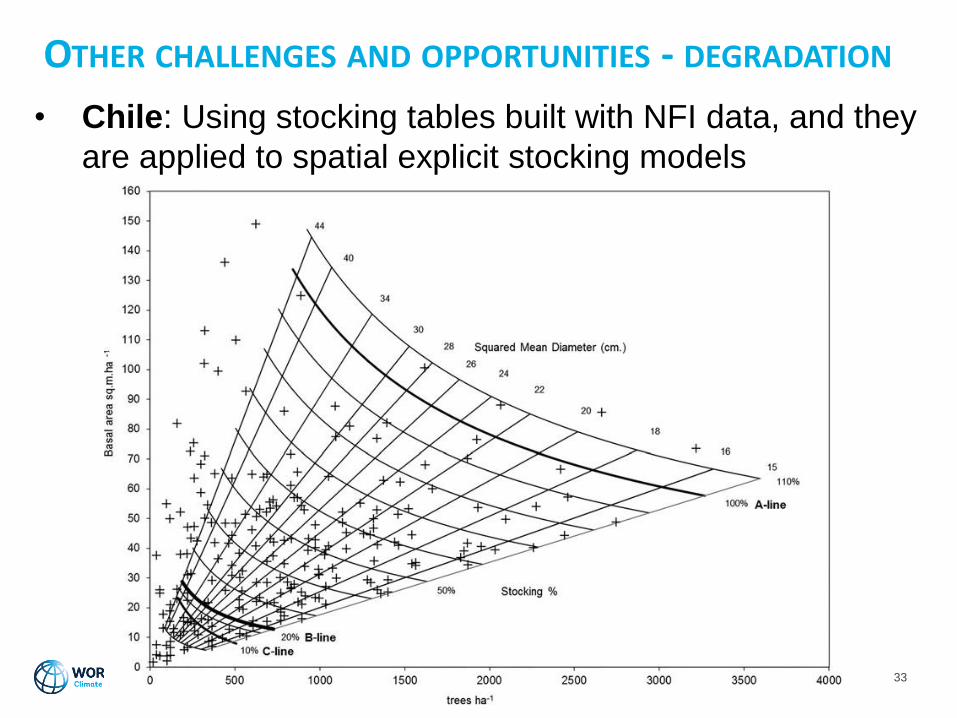
OTHER CHALLENGES AND OPPORTUNITIES - DEGRADATION
• Chile: Using stocking tables built with NFI data, and they
are applied to spatial explicit stocking models
34
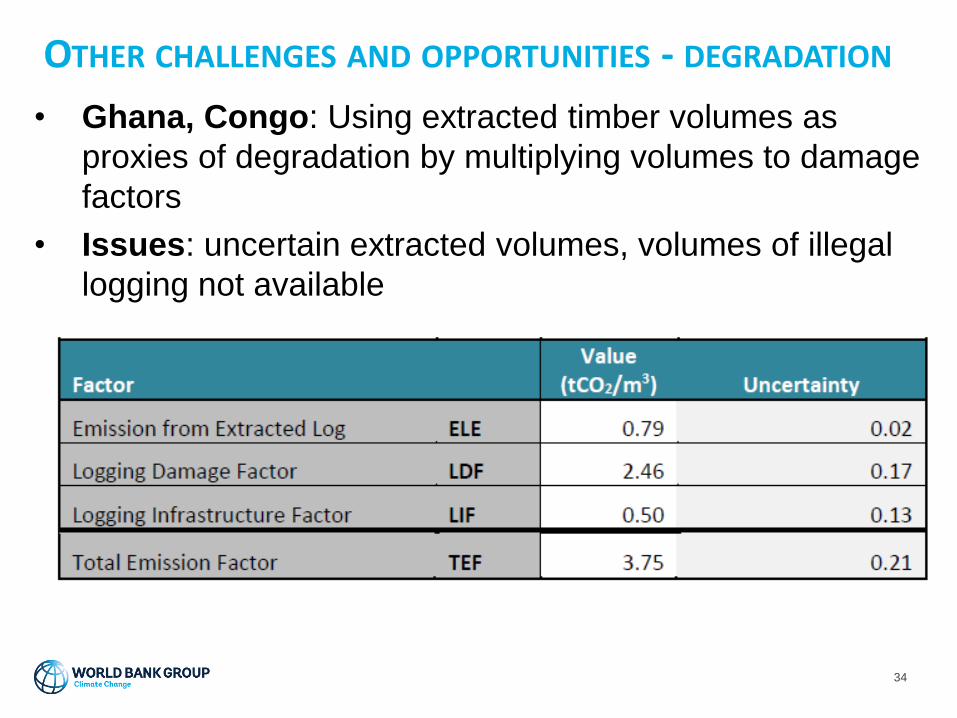
OTHER CHALLENGES AND OPPORTUNITIES - DEGRADATION
• Ghana, Congo: Using extracted timber volumes as
proxies of degradation by multiplying volumes to damage
factors
• Issues: uncertain extracted volumes, volumes of illegal
logging not available
35
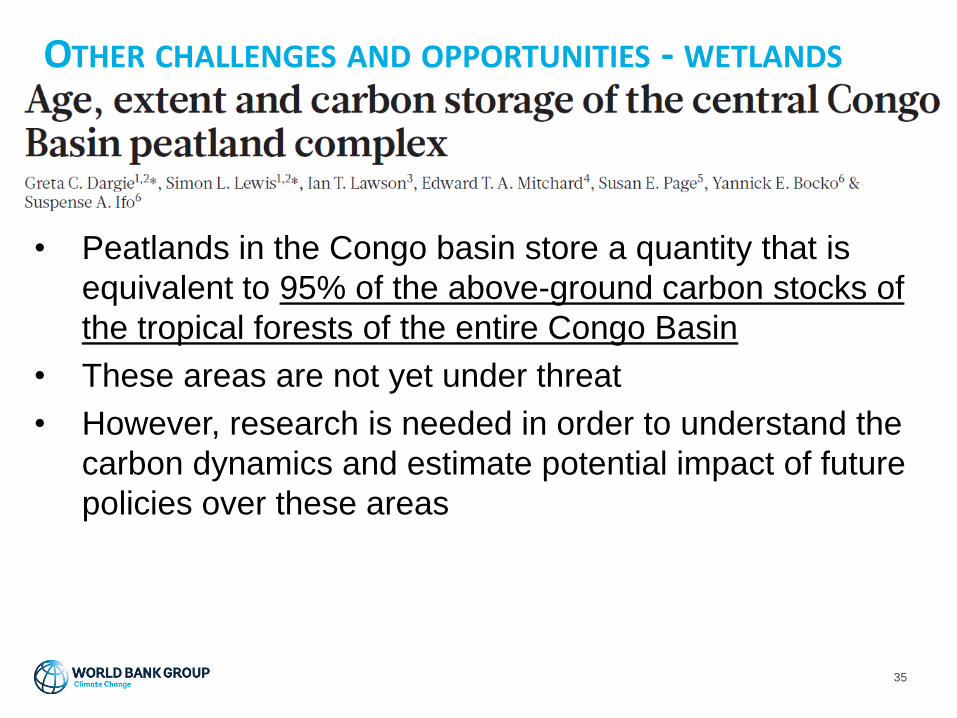
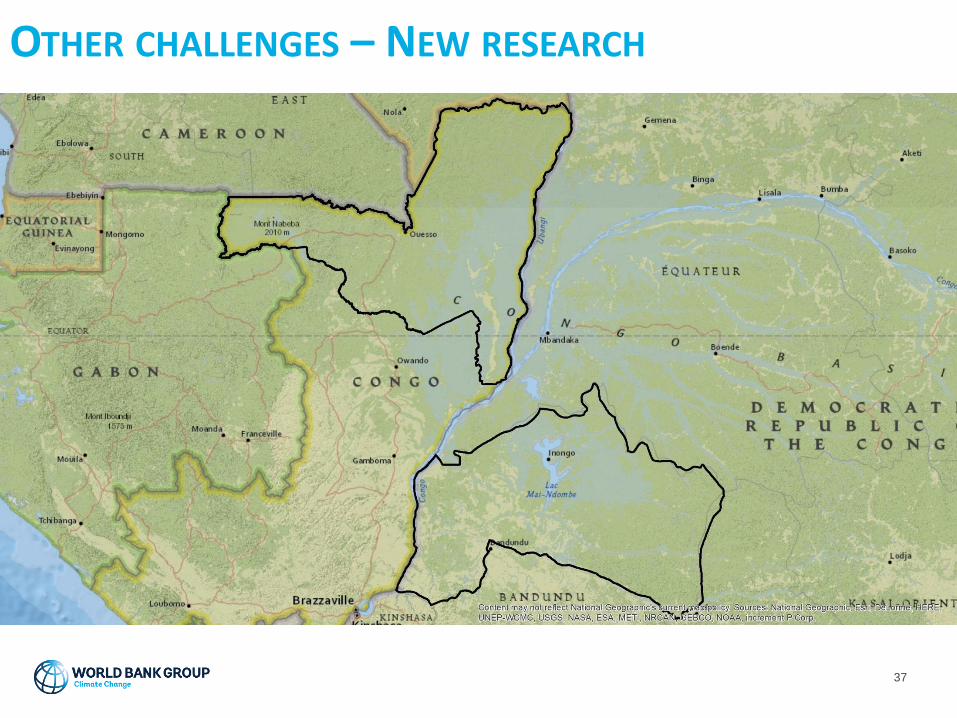
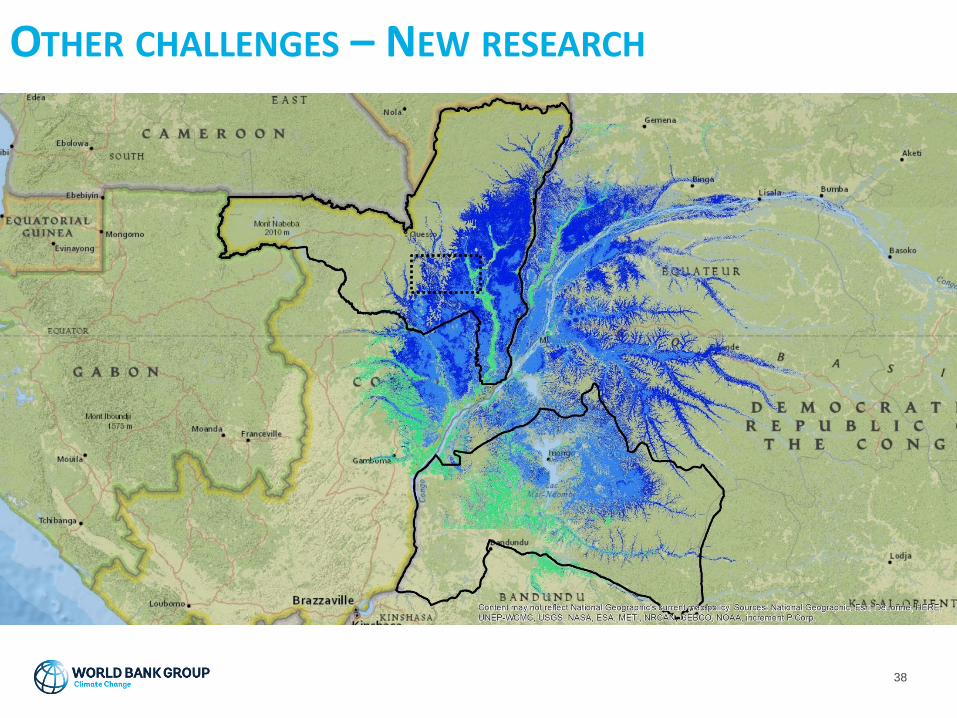
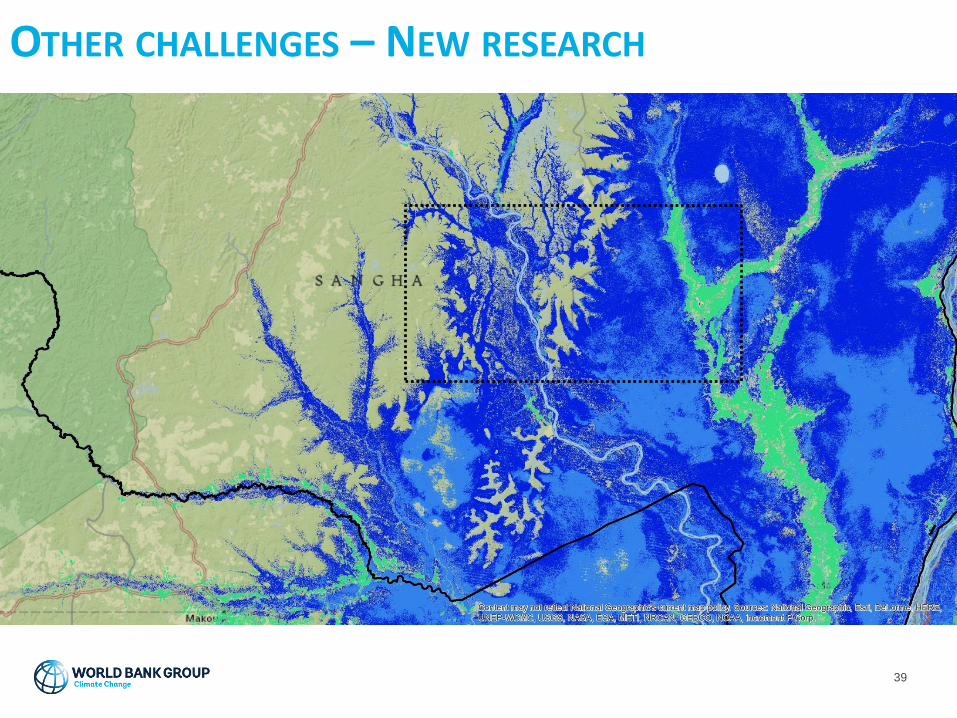
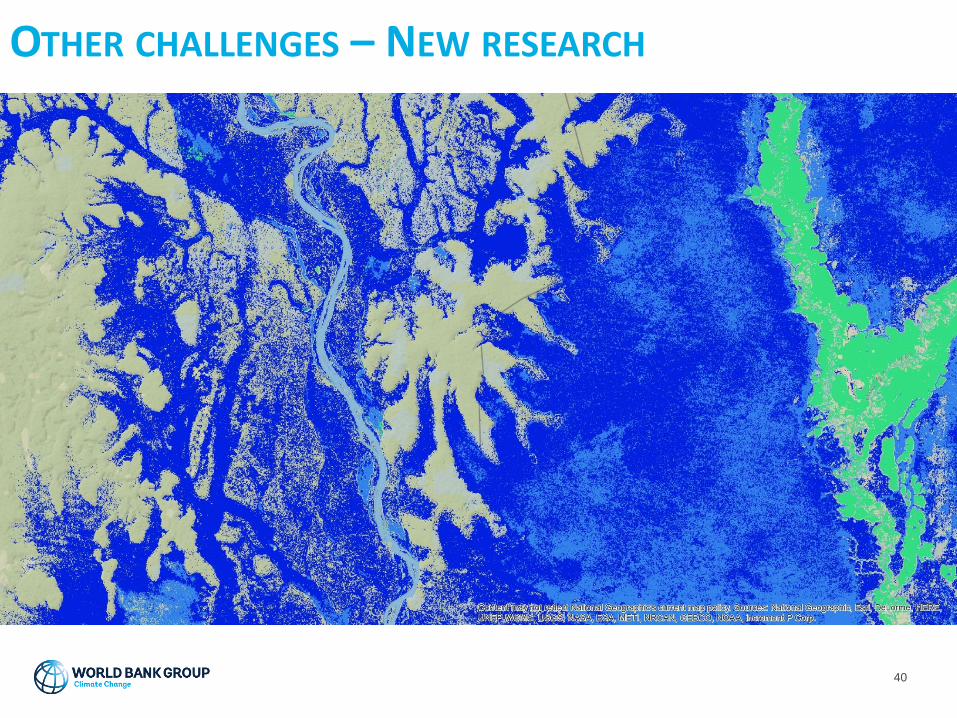
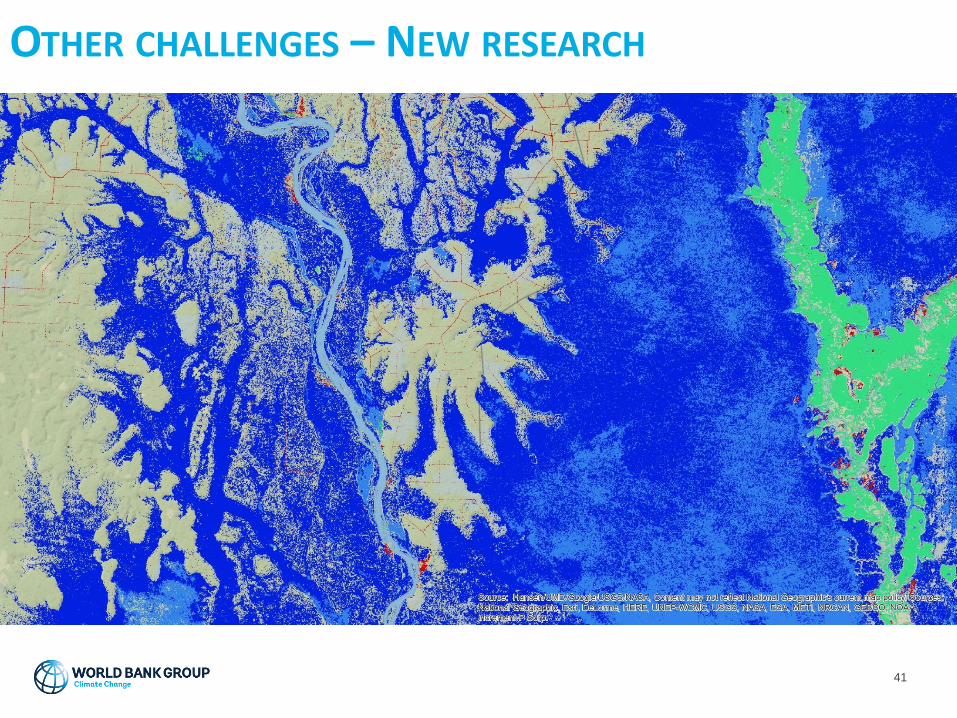
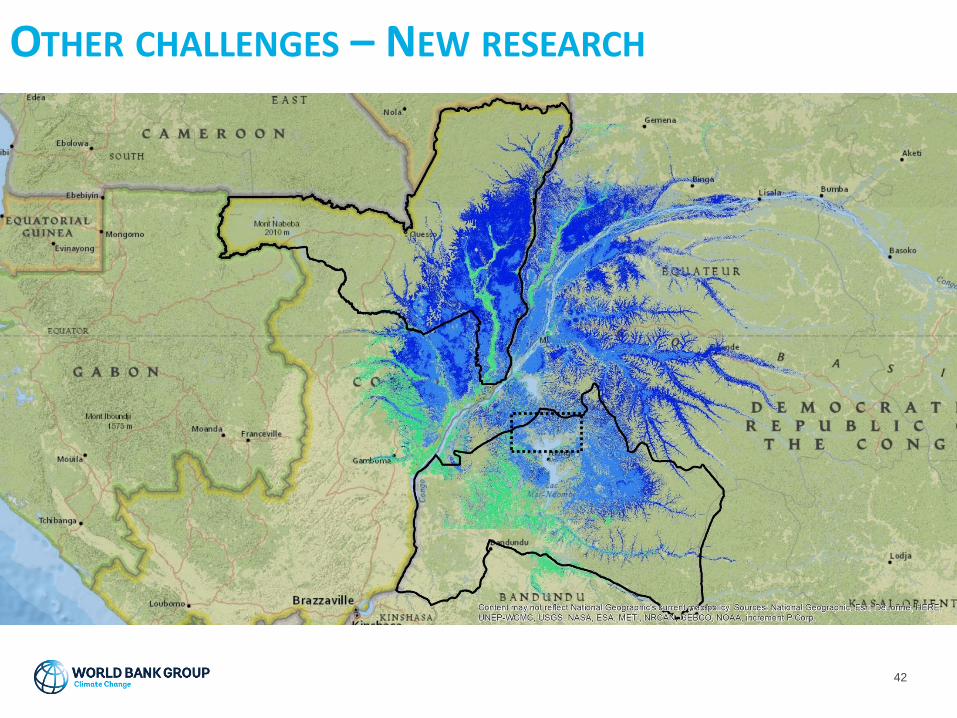
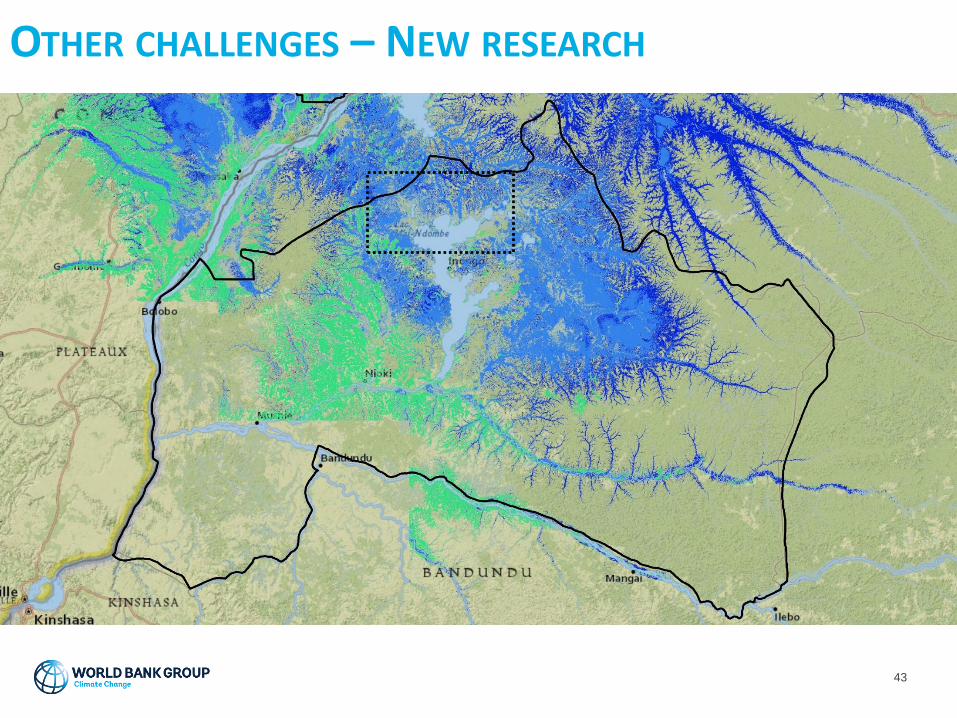
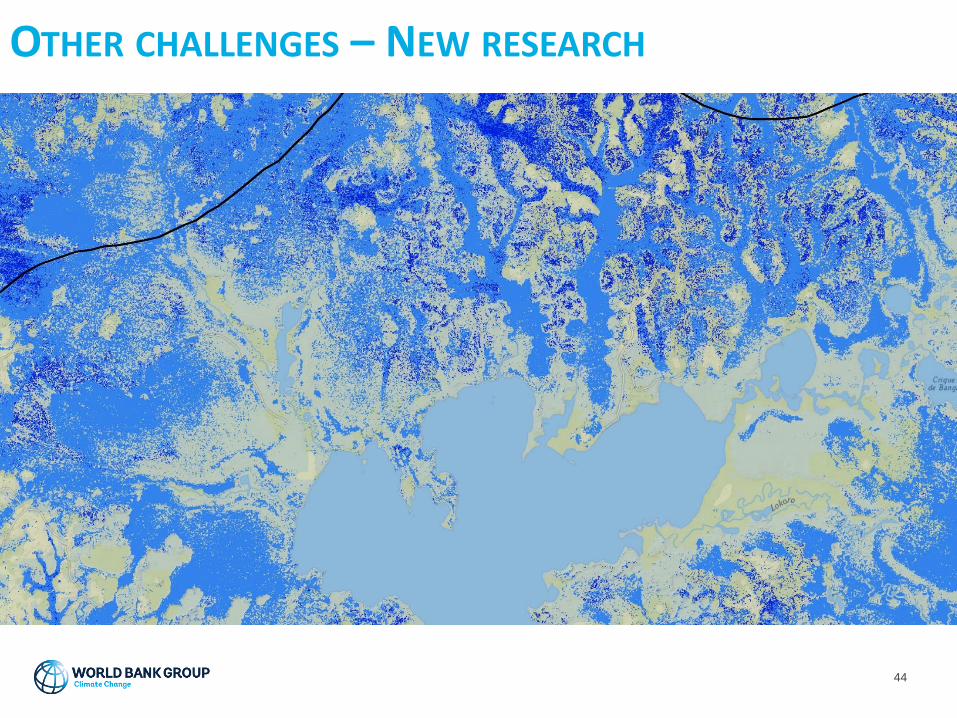
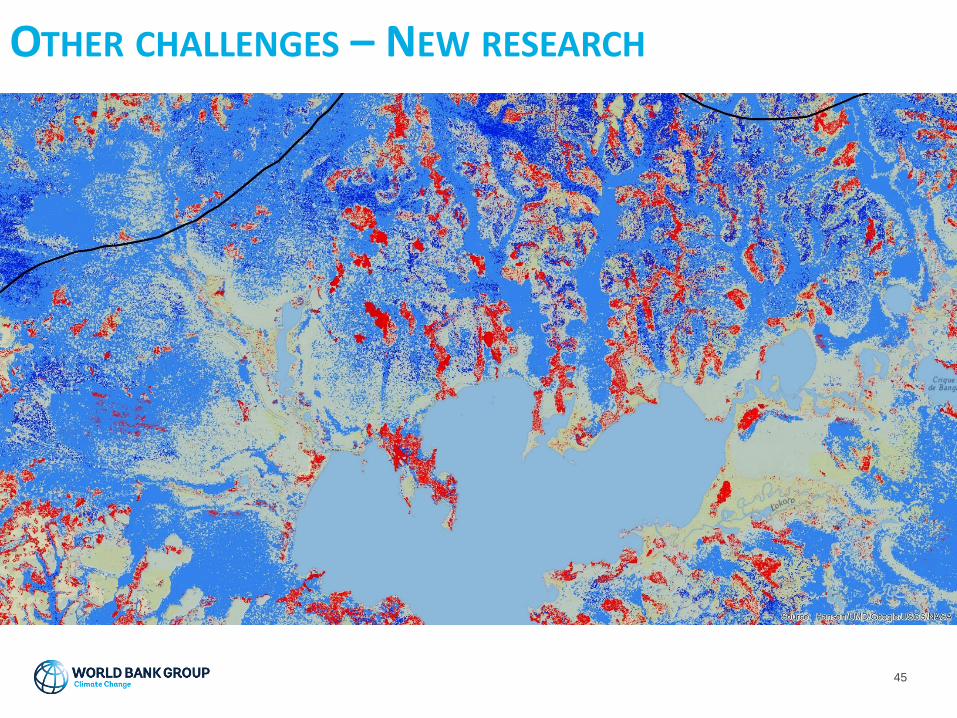
• Peatlands in the Congo basin store a quantity that is
equivalent to 95% of the above-ground carbon stocks of
the tropical forests of the entire Congo Basin
• These areas are not yet under threat
• However, research is needed in order to understand the
carbon dynamics and estimate potential impact of future
policies over these areas
OTHER CHALLENGES AND OPPORTUNITIES - WETLANDS
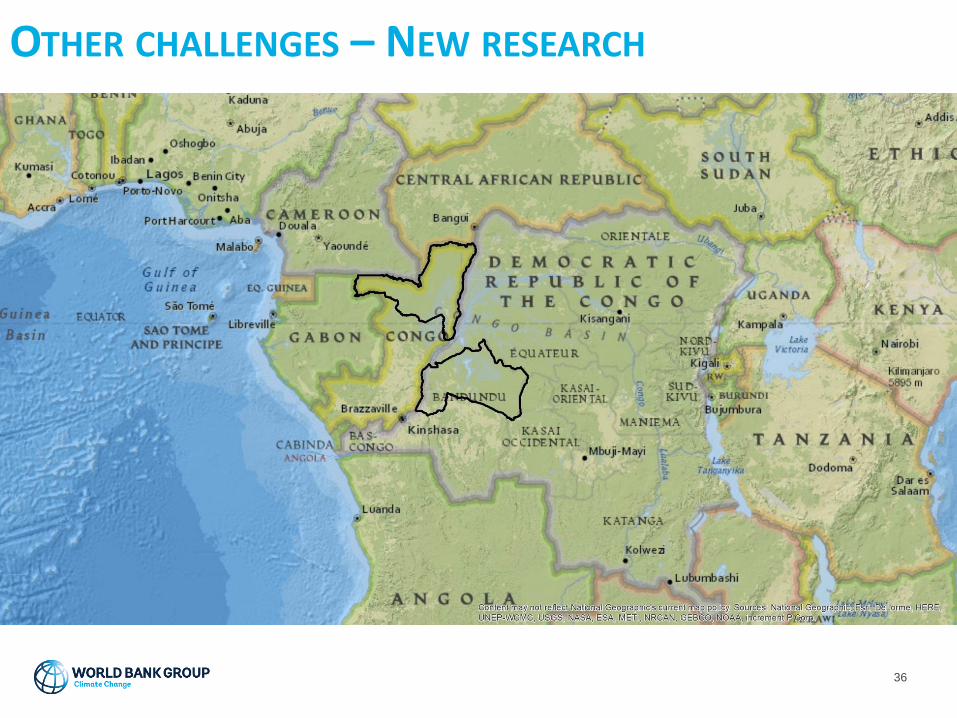
OTHER CHALLENGES – NEW RESEARCH
36
OTHER CHALLENGES – NEW RESEARCH
37
OTHER CHALLENGES – NEW RESEARCH
38
OTHER CHALLENGES – NEW RESEARCH
39
OTHER CHALLENGES – NEW RESEARCH
40
OTHER CHALLENGES – NEW RESEARCH
41
OTHER CHALLENGES – NEW RESEARCH
42
OTHER CHALLENGES – NEW RESEARCH
43
OTHER CHALLENGES – NEW RESEARCH
44
OTHER CHALLENGES – NEW RESEARCH
45

THANK YOU