challenges and leadership for latin america - ilc, aiesec
TRANSCRIPT

Challenges and Leadership
for Latin AmericaVladimir Olarte Cadavid, AAC y Kaiser Associates
Twitter: @vladimirolarte | Blog: www.DesarrolloInclusivo.com
Work Email: [email protected]
Personal Email: [email protected]

Key challenges for Latin America
Political
Corruption
Poverty and
economic inequality
Education and
human development
Sustainable
development
Source: World Economic Forum, and Author

Key challenge – Overcome corruption
and strengthen institutions
Source: Revista Semana from Colombia, newspaper Folha de São Paulo from Brazil

Key challenge – Overcome corruption
and strengthen institutions
Buen gobierno – Índice de Percepción de Corrupción en el Sector Público, 2010 (rango: 1 peor a 10 mejor)
América Latina Asia Pacífico Europa Oriental África
2,0
3,5 3,5 3,73,1
7,2
2,9 2,83,3
4,4
5,4
2,73,5
2,1 2,4
4,4
5,34,5
3,1 3,4
Ven
ezue
la
Perú
Col
ombi
a
Bra
sil
Méx
ico
Chi
le
Arg
enti
na
Ind
ones
ia
Ind
ia
Mal
asi
a
Cor
ea d
el S
ur
Vie
tnam
Ch
ina
Ru
sia
Ucr
ania
Turq
uía
Polo
nia
Sud
áfri
ca
Egip
to
Mar
ruec
os
Promedio PG**Asia Pacífico
3,7
Promedio PG**Europa Oriental
3,5
Promedio PG**África
3,7
Co
lom
bia
Promedio PG**América Latina
3,7
Media3,7
Source: Transparencia Internacional

Key challenge – Overcome poverty and
increasing inequality

0 5 10 15 20 25 30 35 40 45 50 55 60 65 70 75 80
Co
efi
cie
nte
de
GIN
I*(2
00
0-2
010
)
Incidencia de pobreza por ingreso, población con menos de US$ 2 por día 2009 (%)
Incidencia de la pobreza y la desigualdad en el Peer Group(País: millones de pobres)
27,9
China: 498
0,20
0,30
0,40
0,50
0,60
0,70
0,58
Marruecos: 2
Brasil: 25
Ucrania: 1
Indonesia: 144
Polonia: 1
Vietnam: 43
*Coeficiente de GINI: medida de la distribución del ingreso entre cero y uno. 1,00 corresponde a la perfecta desigualdad y cero a la perfecta igualdad.
Perú: 5
América Latina Asia-Pacífico Europa Oriental África
México: 9
54,2
1,1
2,5
3,8
7,5
12,1
11,5
13,2
13,7
14,2
13,1
17,1
18,7
18,9
20,3
25,1
24,6
24,9
33,7
34,8
35,0
45,5
1,0
3,7
7,2
14,0
28,9
19,2
57,5
15,2
18,2
19,7
16,6
31,1
27,2
17,9
48,6
28,2
37,8
39,4
54,7
19,2
TaiwánChina
MalasiaMarruecos
VietnamChile
ArgentinaCorea
IndonesiaRusia
PoloniaSudáfrica
TurquíaEgipto
VenezuelaIndiaBrasil
MéxicoPerú
UcraniaColombia
Egipto: 15
2002 2009 (Estimado)
Sudáfrica: 21
India: 926
Rusia: 3Malasia: 3
Colombia: 13
Millonesde pobres
Población bajo línea nacional de pobreza (%)
Venezuela: 3
Argentina: 3
Turquía: 6Marruecos: 4
Source: ONU – Human Development Report, Banco Mundial – WorldDevelopment Indicators, CIA – World Fact Book, DANE, Sistema Nacional de Evaluación de Gestión y Resultados – SINERGIA
Key challenge – Overcome poverty and
increasing inequality
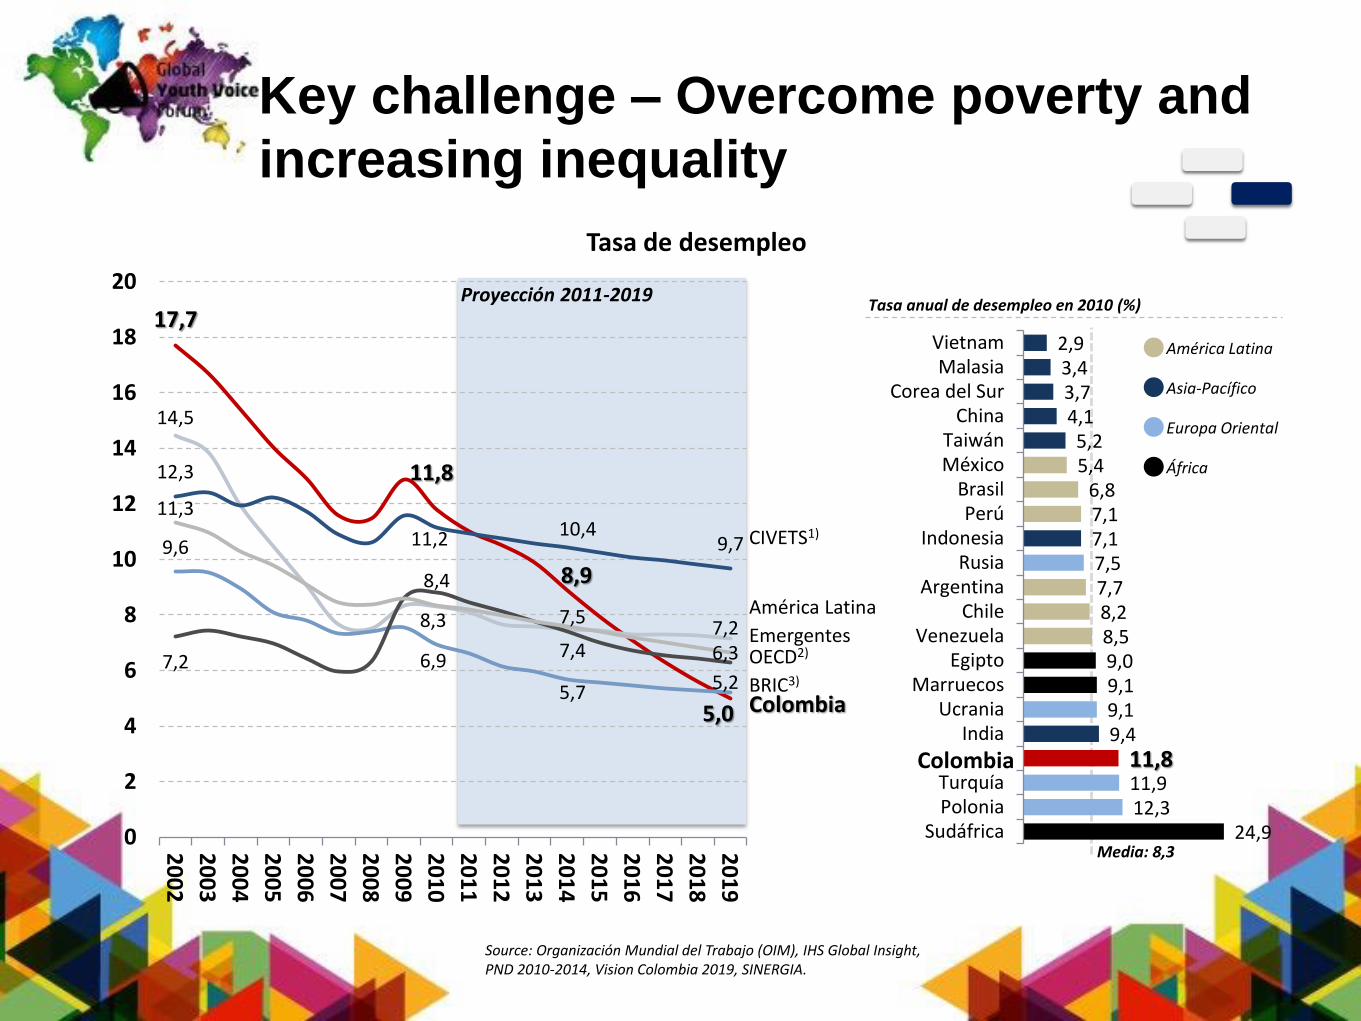
Source: Organización Mundial del Trabajo (OIM), IHS Global Insight, PND 2010-2014, Vision Colombia 2019, SINERGIA.
Key challenge – Overcome poverty and
increasing inequality
17,7
11,8
8,9
5,0
14,5
8,3 7,57,2
12,3
11,2 10,49,79,6
6,9
5,7 5,27,2
7,4 6,3
11,3
8,4
0
2
4
6
8
10
12
14
16
18
20
20
02
20
03
20
04
20
05
20
06
20
07
20
08
20
09
20
10
20
11
20
12
20
13
20
14
20
15
20
16
20
17
20
18
20
19
Tasa de desempleo
OECD2)
Colombia
América Latina
CIVETS1)
Emergentes
BRIC3)
24,912,311,911,8
9,49,19,19,08,58,27,77,57,17,16,8
5,45,2
4,13,73,42,9
SudáfricaPoloniaTurquía
ColombiaIndia
UcraniaMarruecos
EgiptoVenezuela
ChileArgentina
RusiaIndonesia
PerúBrasil
MéxicoTaiwán
ChinaCorea del Sur
MalasiaVietnam
Tasa anual de desempleo en 2010 (%)
Colombia
América Latina
Asia-Pacífico
Europa Oriental
África
Proyección 2011-2019
Media: 8,3

Source: Banco Mundial – World Development Indicators, IHS Global Insight, Sistema Nacional de Evaluación de Gestión y Resultados –SINERGIA
Key challenge – Overcome poverty and
increasing inequality
1 4 4 5 1 5 1 2 1 3 2 1 1 2 2 223 16
34
7
21
50
178 11
1
20
3 3 16 11 9 10 11 22
96
10
51 9
14
1
10
28
1315
6
20
2
67
64 4
11
4421
7
2
9
1
7
104
2
5 2
52
4
3
32
8
2
2
3
16
28
3976
11
3341
67 7090
55
94
17
70 80 8047
37
65
1
49
212 3
58
4 9 6 2 2 1 1 6 6 3 4
29
6 9
Ven
ezu
ela
Pe
rú
Co
lom
bia
Bra
sil
Mé
xico
Ch
ile
Arg
en
tin
a
Ind
on
esi
a
Ind
ia
Mal
asia
Co
rea
de
l Su
r
Vie
tnam
Ch
ina
Ru
sia
Ucr
ania
Turq
uía
Po
lon
ia
Sud
áfri
ca
Egip
to
Mar
rue
cos
América Latina Asia Pacífico Europa Oriental África
Exportaciones – valor, participación del PIB, crecimiento y distribución por tipo de producto
Materias primas agrícolas Petróleo y combustibles
Bienes TIC
Alimentos
Seguros y servicios financieros Manufacturas
Minerales y metales
Co
lom
bia
Valor exportaciones de bienes (USD billones)
28 23 14 10 29 35 19 22 12 84 46 67 27 27 38 17 35 23 13 19
Dis
trib
uci
ón
po
r ti
po
de
pro
du
cto
(%
)
+24 +32 +21 +29 +24 +15 +32 +26 +32 +30 nd +30 +10 +20 +11 +16 +32 +30 +27 +23
17
26
36
4052
67
69
71
71
86
121
158
162
194
199
202
298
400
464
1.582
Taiwán
Marruecos
Egipto
Perú
Colombia
Ucrania
Venezuela
Argentina
Vietnam
Chile
Sudáfrica
Turquía
Indonesia
Polonia
India
Malasia
Brasil
Mexico
Rusia
Corea
China
Colombia
% PIB 2010Media: 29%
Var % 2010Media: 25%
nd

Key challenge – Improve education and
skills development
“In the face of inequality,
quality education is the best
second opportunity” – Jesús Ferro Bayona
President,
Universidad del Norte Colombia

Source: ONU – Human Development Report, Banco Mundial – WorldDevelopment Indicators, CIA – World Fact Book, DANE, Sistema Nacional de Evaluación de Gestión y Resultados – SINERGIA
Key challenge – Improve education and
skills development
23
98
13
21
32
10
77
67
79
38
15
28
12
79
26
52
68
27
34
35
76
97
57
74
68
67
85
100
94
82
95
79
56
81
85
90
101
90
113
105
113
119
97
104
97
97
98
99
105
100
107
103
109
106
116
114
127
120ColombiaBrasil
México
Argentina
Chile
Perú
Venezuela
Marruecos
Egipto
Sudáfrica
Turquía
Ucrania
Polonia
Rusia
Vietnam
Taiwán
Malasia
Indonesia
India
Corea del Sur
China
-0,6
+0,4
+0,3
+1,2
+0,4
+0,8
+3,8
nd
nd
+1,1
-2,8
+1,2
-0,4
-0,1
-2,2
-1,3
+0,7
+0,4
0,0
-3,8
+0,2
Cobertura en educación secundaria (%)*Cobertura en educación primaria (%)* TACC** TACC**
-0,7
+0,8
+0,7
+3,2
+1,7
+6,1
+3,5
nd
nd
nd
-2,4
+1,1
+1,6
-0,2
-1,8
+0,4
+4,8
+2,4
-0,8
-1,0
+2,8
+2,8
+2,0
+2,7
nd
+5,8
+1,9
+5,4
nd
nd
nd
+3,4
+4,9
nd
+8,7
+8,3
nd
+3,3
+3,9
+1,9
+6,1
+11,6
ndnd nd
América Latina Asia-Pacífico Europa Oriental África
Cobertura en educación superior (%)* TACC**
Media: 107 Media: 83 Media: 42

Source: PISA - OECD
Key challenge – Improve education and
skills development
365 381 386 419 421 388 371
546600
468 445495
370413 412 425 449
398 402
539 556
459 464500
Ven
ezu
ela
Per
ú
Co
lom
bia
Bra
sil
Méx
ico
Ch
ile
Arg
en
tin
a
Ind
on
esia
Ind
ia
Mal
asia
Co
rea
del
Su
r
Vie
tnam
Ch
ina
Ru
sia
Ucr
ania
Turq
uía
Po
lon
ia
Sud
áfri
ca
Egip
to
Mar
ruec
os
369402 405 416 447
401 383
538575
478 454508
América Latina Asia Pacífico Europa Oriental África
Puntaje encomprensiónde lectura(rango: 150 a 700)
Puntaje enciencias(rango: 150 a 700)
Puntaje enmatemáticas(rango: 150 a 700)
América Latina Asia-Pacífico Europa Oriental África
Calidad educativa – Programa Internacional de Evaluación de los Estudiantes PISA
nd nd nd nd nd nd nd nd
Co
lom
bia
Media449
Media440
Media448
nd nd nd nd nd nd nd
nd nd nd nd nd nd nd
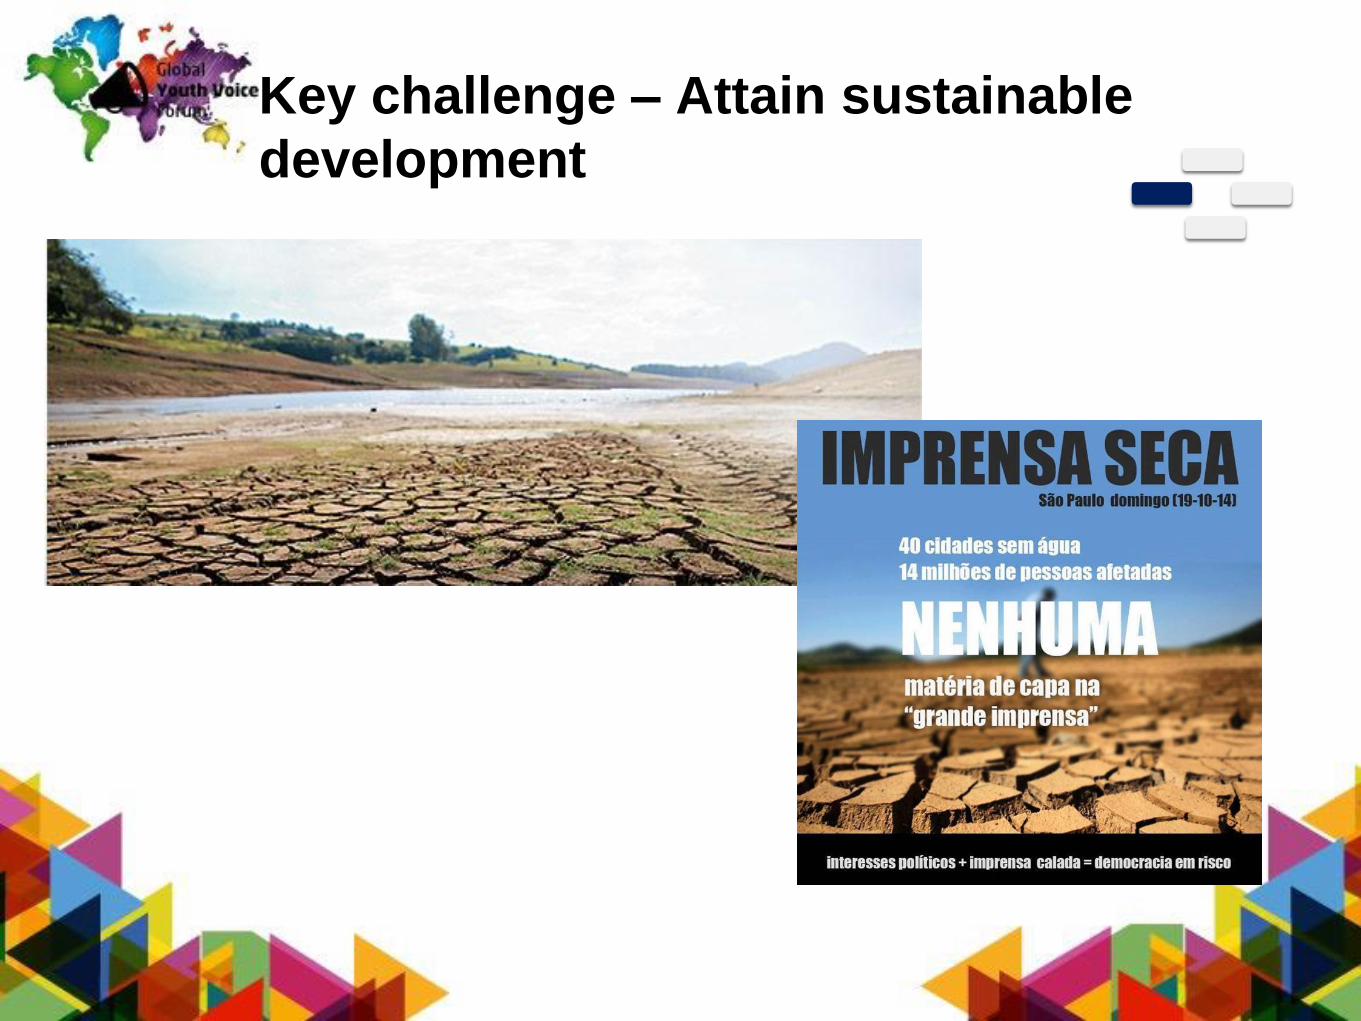
Key challenge – Attain sustainable
development

Latin America needs leaders that
dream big and are determined to make
those BHAGs happen!
1.Self-awareness and self-steem
2. Vision
3. Commitment
4. Influence and collaboration
5. Ethics
* BHAG: Big, Hairy, Ambitious Goals

Self-awareness and self-steem

Vision for yourself, your organization,
your community, with an international
perspective

Commitment, determination,
positiveness, resilience

Influence, collaboration,
and inter-personal skills

Ethics and value-driven behavior

Latin America needs leaders that
dream big and are determined to make
those BIHAGs* happen!
“That truth that you seek
you will not get from anyone.
You carry it always with you."
-- Alejandro Dorowsky
* BHAG: Big, Hairy, Ambitious Goals
Challenges and Leadership
for Latin AmericaVladimir Olarte Cadavid, AAC y Kaiser Associates
Twitter: @vladimirolarte | Blog: www.DesarrolloInclusivo.com
Work Email: [email protected]
Personal Email: [email protected]