ch6 social fs2021 - forestresearch.gov.uk
TRANSCRIPT

The Research Agency of the
Forestry Commission
Forestry Statistics 2021 Chapter 6: Social
Release date:
30 September 2021
Coverage:
United Kingdom
Geographical breakdown:
Country
Issued by: Forest Research, Silvan House,
231 Corstorphine Road, Edinburgh, EH12 7AT
Enquiries: Robert Stagg, 0300 067 5238
Statistician: Sheila Ward, 0300 067 5236
Website: www.forestresearch.gov.uk/statistics/

2
Forestry Statistics 2021: Chapter 6 Social
Forest Research is the Research Agency of the Forestry Commission and is the
leading UK organisation engaged in forestry and tree related research.
The Agency aims to support and enhance forestry and its role in sustainable
development by providing innovative, high quality scientific research, technical
support and consultancy services.

3
Forestry Statistics 2021: Chapter 6 Social
Contents
Introduction................................................................................................... 4
Key findings................................................................................................... 6
6.1 Visits to woodland - household surveys ....................................................... 7
6.1.1 England ................................................................................................ 9
6.1.2 Wales ................................................................................................. 14
6.1.3 Public Opinion of Forestry Survey - Woodland visitors ............................... 15

4
Forestry Statistics 2021: Chapter 6 Social
Introduction This chapter contains statistics on the number and profile of visits to all woodlands
from household surveys.
The statistics in this chapter need to be viewed in the context of broader changes in
the UK population, with an increasing and ageing population.
More recently, the Covid-19 pandemic has affected visits to the outdoors. Some
information on visits to forests and woodlands from the 2021 Public Opinion of
Forestry surveys is provided in this release and there is further information on visits
to the outdoors more generally in the following:
www.forestresearch.gov.uk/research/engagement-nature-and-during-covid-
19-restrictions/;
www.gov.uk/government/collections/people-and-nature-survey-for-england
(see monthly indicators);
gov.wales/national-survey-wales-monthly-and-quarterly-survey
www.nature.scot/doc/naturescot-research-report-1255-enjoying-outdoors-
monitoring-impact-coronavirus-and-social and
www.outdoorrecreationni.com/news/revealed-outdoor-recreation-people-
nature-and-health-survey-results/.
Geographical coverage for social statistics varies. Estimates are presented at
country level and, where possible, UK or GB totals are included. Further information
on the data sources and methodology used to compile the figures is provided in the
Sources chapter.
Most of the statistics presented in this chapter have been previously released,
either by Forest Research or by other organisations. Figures for earlier years have
not been revised from those previously published. For further details on revisions,
see the Social section of the Sources chapter.

5
Forestry Statistics 2021: Chapter 6 Social
The frequency with which the estimates in this chapter are updated varies
depending on the data sources used. Whilst some of the information presented is
now several years old, it represents the latest available data and has been included
to provide a more rounded picture of the social use of forests in the UK.
Previous editions of Forestry Statistics have included data on day visitors to
Northern Ireland Forest Service sites where an admission charge was made.
However, as charging at forest car parks was suspended for much of the year, it is
not possible to provide comparable estimates for 2020-21 and this section has been
dropped from the 2021 edition.
In addition, as there are have been no new estimates of visitors to Scotland’s
national forest and lands (formerly known as the National Forest Estate in Scotland)
(from All Forests Surveys that ran in Scotland in 2004-2007 and 2012-13, with an
update to the estimated total in 2016), the section on on-site surveys has been
dropped from this edition.
A copy of all social tables can be accessed in spreadsheet format from the Data
Downloads web page at www.forestresearch.gov.uk/tools-and-
resources/statistics/data-downloads/.

6
Forestry Statistics 2021: Chapter 6 Social
Key findings The main findings are:
Around two thirds (69%) of respondents to the UK Public Opinion of Forestry
Survey 2021 had visited forests or woodlands in the last few years. Of those,
36% reported an increase in the number of visits in the last 12 months.
Around one half (51%) of respondents to the UK Public Opinion of Forestry
Survey 2021 who had visited forests or woodlands in the last few years
reported an increase in their level of happiness when in forests and
woodlands as a result of the coronavirus (COVID-19) restrictions that had
been in place since March 2020
There were an estimated 368 million visits to woodlands in England in 2018-
19.
Around one half (49%) of visits to woodlands in England in 2018-19 were
within 2 miles.
“Health and exercise” and “fresh air or to enjoy pleasant weather” were
important reasons for visits to woodlands in England and Wales.
Walking was the most common activity on visits to woodland in England.
7
Forestry Statistics 2021: Chapter 6 Social
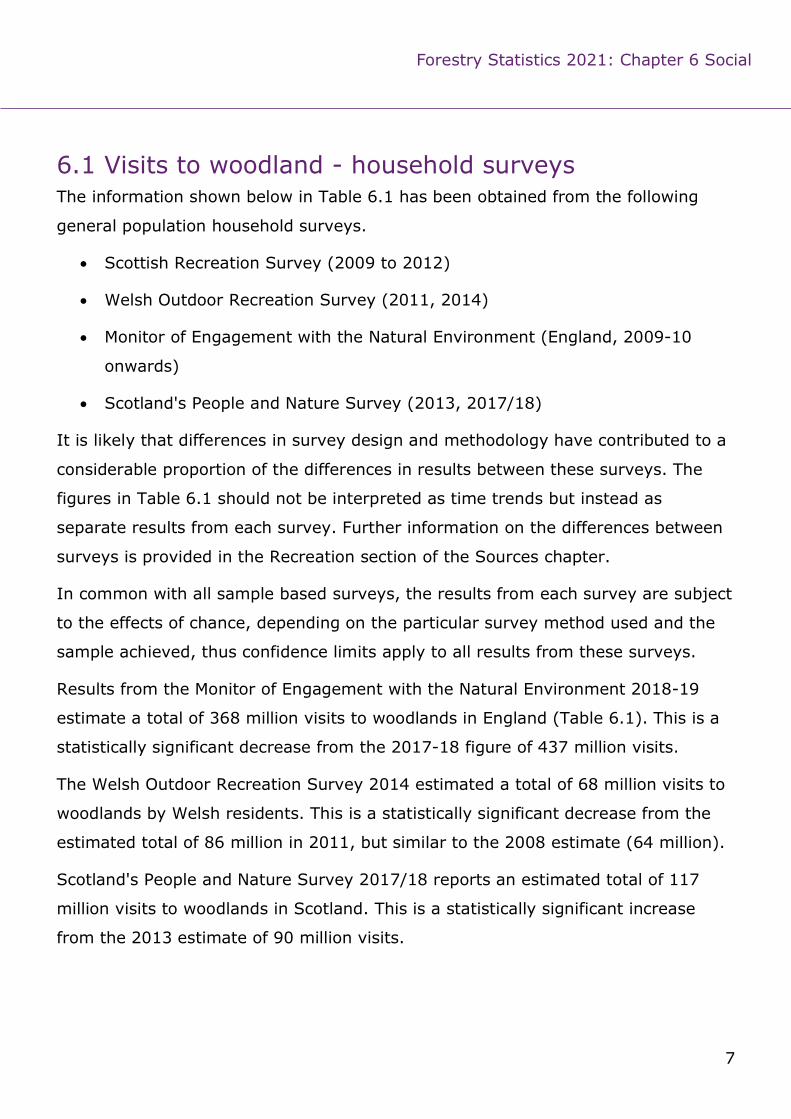
6.1 Visits to woodland - household surveys The information shown below in Table 6.1 has been obtained from the following
general population household surveys.
Scottish Recreation Survey (2009 to 2012)
Welsh Outdoor Recreation Survey (2011, 2014)
Monitor of Engagement with the Natural Environment (England, 2009-10
onwards)
Scotland's People and Nature Survey (2013, 2017/18)
It is likely that differences in survey design and methodology have contributed to a
considerable proportion of the differences in results between these surveys. The
figures in Table 6.1 should not be interpreted as time trends but instead as
separate results from each survey. Further information on the differences between
surveys is provided in the Recreation section of the Sources chapter.
In common with all sample based surveys, the results from each survey are subject
to the effects of chance, depending on the particular survey method used and the
sample achieved, thus confidence limits apply to all results from these surveys.
Results from the Monitor of Engagement with the Natural Environment 2018-19
estimate a total of 368 million visits to woodlands in England (Table 6.1). This is a
statistically significant decrease from the 2017-18 figure of 437 million visits.
The Welsh Outdoor Recreation Survey 2014 estimated a total of 68 million visits to
woodlands by Welsh residents. This is a statistically significant decrease from the
estimated total of 86 million in 2011, but similar to the 2008 estimate (64 million).
Scotland's People and Nature Survey 2017/18 reports an estimated total of 117
million visits to woodlands in Scotland. This is a statistically significant increase
from the 2013 estimate of 90 million visits.

8
Forestry Statistics 2021: Chapter 6 Social
Table 6.1 Number of visits to woodland by journey starting point million visits
Sources:
England 2009 - 2018: Monitor of Engagement with the Natural Environment (MENE), carried out by
TNS;
Wales 2011, 2014: Welsh Outdoor Recreation Survey carried out by TNS;
Scotland 2009 - 2012: Scottish Recreation Survey (ScRS), carried out by TNS;
Scotland 2013, 2017, 2019: Scotland's People and Nature Survey (SPANs), carried out by TNS.
Notes:
1. MENE covered trips taken in England, including those from holiday bases, by respondents living
in England. Results relate to 12 month periods from March to February. The survey has now
been replaced by the People and Nature Survey for England.
2. The Welsh Outdoor Recreation Survey totals shown are for trips with woodland as the main
destination.
3. The Scottish Recreation Survey ran from July 2003 until December 2012. It was replaced by
Scotland's People and Nature Survey that ran from March 2013 to February 2014, from May
2017 to April 2018 and from May 2019 to March 2020. Both surveys covered visits to the
outdoors for leisure and recreation in Scotland by people living in Scotland. The total shown is
for all trips that included a visit to woodland.
4. In each survey, visits to overseas destinations are excluded.
5. .. Denotes data not available.
Year England Wales Scotland
2009 317 .. 57
2010 326 .. 63
2011 358 86 65
2012 357 .. 62
2013 378 .. 90
2014 417 68 ..
2015 446 .. ..
2016 439 .. ..
2017 437 .. 117
2018 368 .. ..
2019 .. .. 123

9
Forestry Statistics 2021: Chapter 6 Social
These figures are outside the scope of National Statistics. For further information
see the Sources chapter.
6.1.1 England
Household surveys in England In March 2009 fieldwork commenced on the Monitor of Engagement with the
Natural Environment (MENE) survey, which includes collecting information on visits
to the outdoors in England. Further information on the survey, including copies of
annual reports and online data viewers to access more detailed results, is available
at www.gov.uk/government/collections/monitor-of-engagement-with-the-natural-
environment-survey-purpose-and-results.
Tables 6.2a to 6.2e shows the main characteristics of visits to woodlands over the
most recent 5 years.
In 2018-19, walking was the main mode of transport for almost one half (47%) of
visits to woodland.
Table 6.2a Mode of transport to visit woodlands - England 2014-15 to 2018-19
per cent of respondents
Source: Monitor of Engagement with the Natural Environment (MENE), Natural England.
Notes:
1. All trips that included a visit to woodland.
These figures are outside the scope of National Statistics. For further information
see the Sources chapter.
Main mode of transport 2014-15 2015-16 2016-17 2017-18 2018-19
On foot 60 60 54 53 47
Car / van 36 36 42 44 45
Bicycle 2 2 2 1 1

10
Forestry Statistics 2021: Chapter 6 Social
Around one half (49%) of visits to woodland were within 2 miles.
Table 6.2b Distance travelled to visit woodlands - England 2014-15 to 2018-19
per cent of respondents
Source: Monitor of Engagement with the Natural Environment (MENE), Natural England.
Notes:
1. All trips that included a visit to woodland.
These figures are outside the scope of National Statistics. For further information
see the Sources chapter.
Distance travelled (one way)
2014-15 2015-16 2016-17 2017-18 2018-19
Less than 1 mile 39 32 28 29 25
1 to 2 miles 25 31 28 27 24
3 to 5 miles 19 20 21 23 26
6 to 10 miles 9 8 11 11 10
Over 10 miles 9 10 12 10 16

11
Forestry Statistics 2021: Chapter 6 Social
Health or exercise was the most popular reason for visiting woodlands in England in
2018-19 (70%).
Table 6.2c Motivation for visits to woodlands - England 2014-15 to 2018-19
per cent of respondents
Source: Monitor of Engagement with the Natural Environment (MENE), Natural England.
Notes:
1. All trips that included a visit to woodland.
2. Excludes other reasons for visiting, each reported by fewer than 20% of respondents in 2018-19.
3. Respondents were able to select more than one option, so results do not sum to 100%.
These figures are outside the scope of National Statistics. For further information
see the Sources chapter.
Motivation for visit 2014-15 2015-16 2016-17 2017-18 2018-19
For health or exercise 53 60 55 56 70
To exercise your dog 66 65 60 53 53
For fresh air or to enjoy pleasant weather
39 41 39 41 46
To relax and unwind 35 42 37 37 40
To enjoy scenery 32 38 34 36 34
To be somewhere you like 23 26 25 26 29
For peace and quiet 22 27 33 26 29
To enjoy wildlife 27 30 28 28 28
To spend time with family 17 14 15 16 28
12
Forestry Statistics 2021: Chapter 6 Social
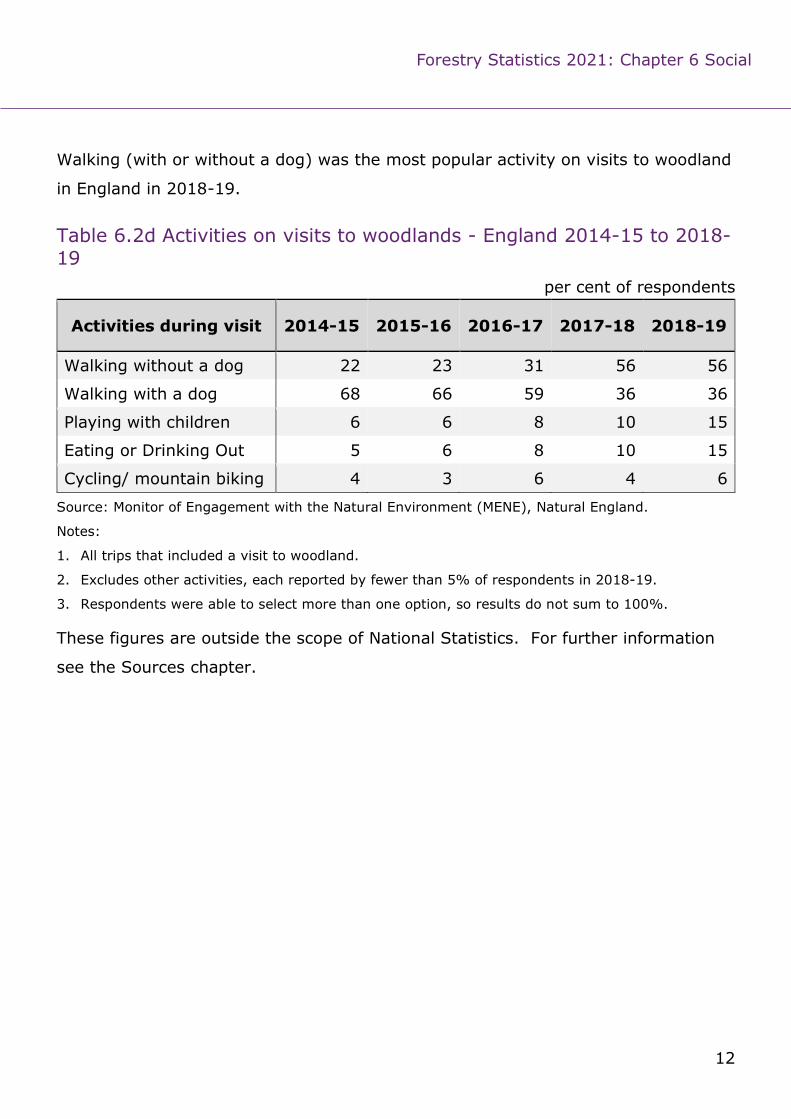
Walking (with or without a dog) was the most popular activity on visits to woodland
in England in 2018-19.
Table 6.2d Activities on visits to woodlands - England 2014-15 to 2018-19
per cent of respondents
Source: Monitor of Engagement with the Natural Environment (MENE), Natural England.
Notes:
1. All trips that included a visit to woodland.
2. Excludes other activities, each reported by fewer than 5% of respondents in 2018-19.
3. Respondents were able to select more than one option, so results do not sum to 100%.
These figures are outside the scope of National Statistics. For further information
see the Sources chapter.
Activities during visit 2014-15 2015-16 2016-17 2017-18 2018-19
Walking without a dog 22 23 31 56 56
Walking with a dog 68 66 59 36 36
Playing with children 6 6 8 10 15
Eating or Drinking Out 5 6 8 10 15
Cycling/ mountain biking 4 3 6 4 6
13
Forestry Statistics 2021: Chapter 6 Social
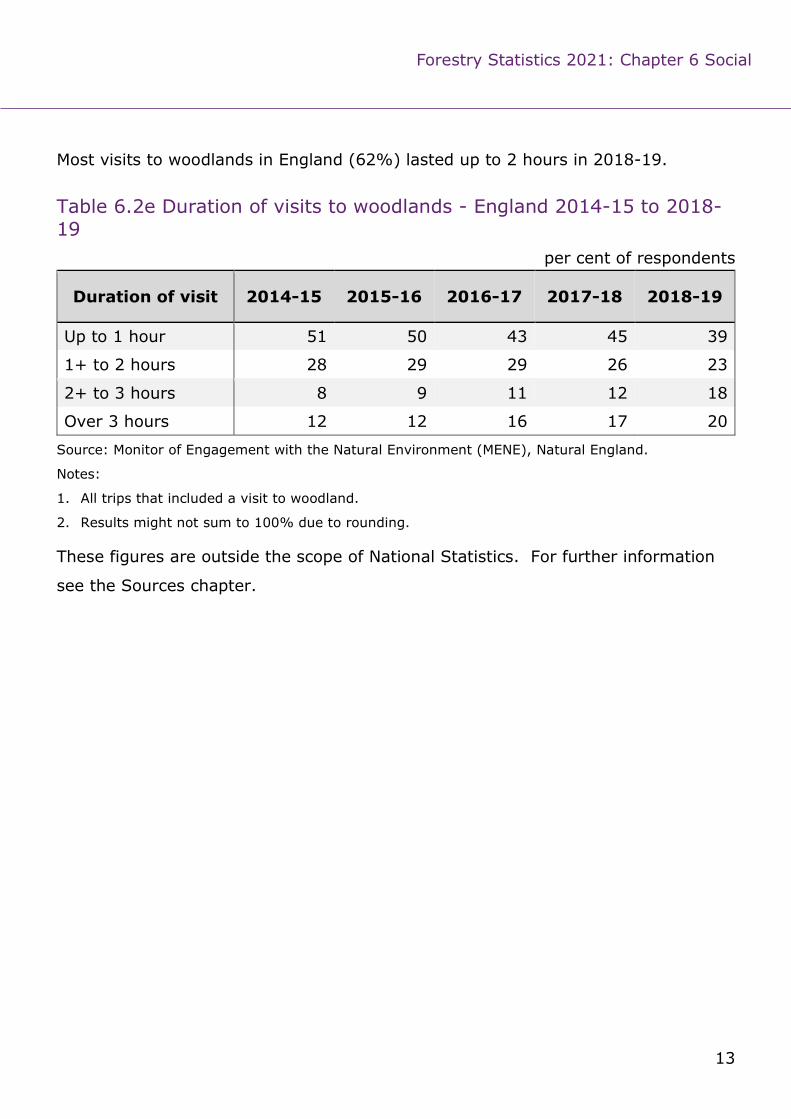
Most visits to woodlands in England (62%) lasted up to 2 hours in 2018-19.
Table 6.2e Duration of visits to woodlands - England 2014-15 to 2018-19
per cent of respondents
Source: Monitor of Engagement with the Natural Environment (MENE), Natural England.
Notes:
1. All trips that included a visit to woodland.
2. Results might not sum to 100% due to rounding.
These figures are outside the scope of National Statistics. For further information
see the Sources chapter.
Duration of visit 2014-15 2015-16 2016-17 2017-18 2018-19
Up to 1 hour 51 50 43 45 39
1+ to 2 hours 28 29 29 26 23
2+ to 3 hours 8 9 11 12 18
Over 3 hours 12 12 16 17 20
14
Forestry Statistics 2021: Chapter 6 Social
6.1.2 Wales
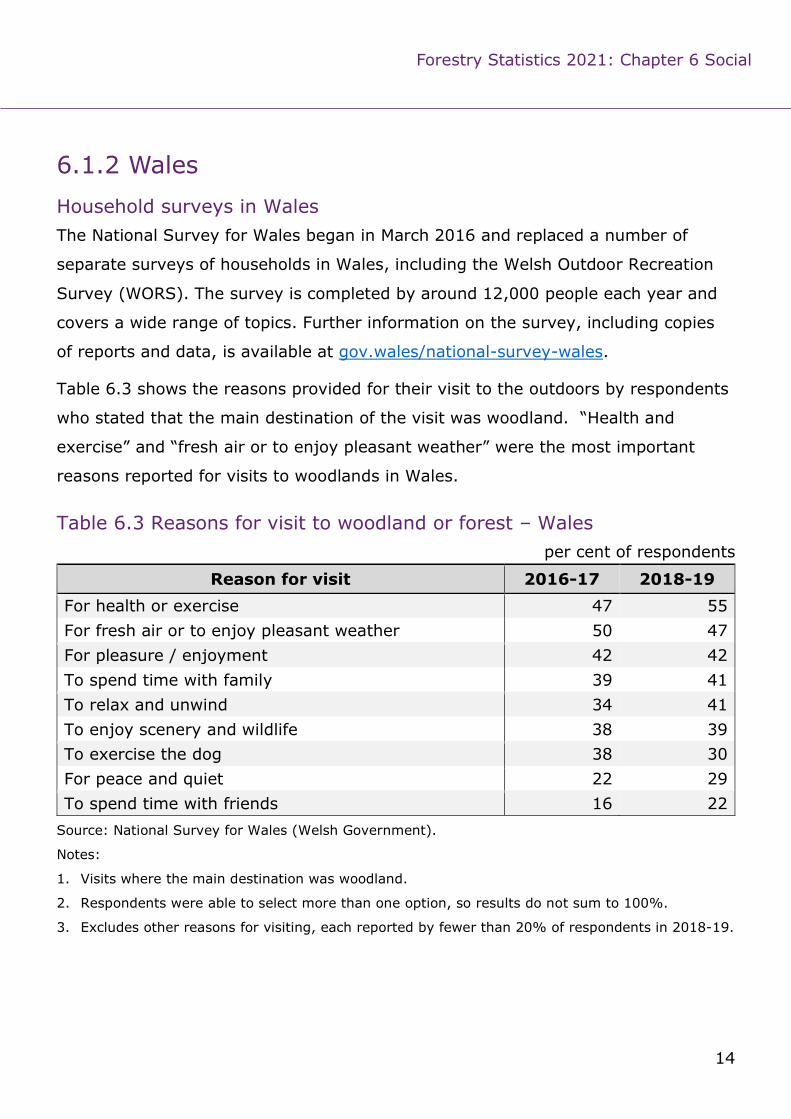
Household surveys in Wales The National Survey for Wales began in March 2016 and replaced a number of
separate surveys of households in Wales, including the Welsh Outdoor Recreation
Survey (WORS). The survey is completed by around 12,000 people each year and
covers a wide range of topics. Further information on the survey, including copies
of reports and data, is available at gov.wales/national-survey-wales.
Table 6.3 shows the reasons provided for their visit to the outdoors by respondents
who stated that the main destination of the visit was woodland. “Health and
exercise” and “fresh air or to enjoy pleasant weather” were the most important
reasons reported for visits to woodlands in Wales.
Table 6.3 Reasons for visit to woodland or forest – Wales per cent of respondents
Source: National Survey for Wales (Welsh Government).
Notes:
1. Visits where the main destination was woodland.
2. Respondents were able to select more than one option, so results do not sum to 100%.
3. Excludes other reasons for visiting, each reported by fewer than 20% of respondents in 2018-19.
Reason for visit 2016-17 2018-19
For health or exercise 47 55
For fresh air or to enjoy pleasant weather 50 47
For pleasure / enjoyment 42 42
To spend time with family 39 41
To relax and unwind 34 41
To enjoy scenery and wildlife 38 39
To exercise the dog 38 30
For peace and quiet 22 29
To spend time with friends 16 22

15
Forestry Statistics 2021: Chapter 6 Social
6.1.3 Public Opinion of Forestry Survey - Woodland visitors The Public Opinion of Forestry Survey obtains people's attitudes to forestry and
forestry-related issues, including visits to woodland.
The 2021 surveys were run in February/March 2021 and were impacted by the
Coronavirus (COVID-19) pandemic in two ways. Firstly, the restrictions in place in
early 2021 led to a change in methodology for the surveys, with the 2021 surveys
being run online or by telephone for the first time (previously, face-to-face
interviewing had been used). Secondly, requirements to stay at home (with people
only being allowed outdoors for one hour a day in order to undertake exercise) and
requirements to stay in local areas, both of which were in force for some of the
year leading up to the survey, may have resulted in changes to the responses
provided to the survey. It is not possible to quantify the extent to which any
changes observed in the survey are a result of COVID-19 restrictions (either on the
survey design or on the behaviour of respondents).
Copies of reports, providing further information on the survey, and accompanying
tables are available at www.forestresearch.gov.uk/tools-and-
resources/statistics/statistics-by-topic/public-opinion-of-forestry/.
The results shown in Tables 6.4 to 6.6 and Figures 6.1 and 6.2 have been taken
from the UK and country reports on the latest surveys in 2021 and from surveys in
earlier years.
In the UK 2021 survey, over two thirds (69%) of respondents said that they had
visited woodland in the last few years for walks, picnics or other recreation (Table
6.4).

16
Forestry Statistics 2021: Chapter 6 Social
Table 6.4 Woodland visitors1 per cent of respondents
Source: UK/GB, Scotland, Wales and Northern Ireland Public Opinion of Forestry Surveys
Base: UK/GB = 4,000 respondents (2003 to 2007), 2,000 respondents (2009 to 2019), 5,000
respondents (2021);
Scotland and Wales = 1,000 respondents each;
Northern Ireland = 120 respondents (2003), 1,000 respondents (all other years).
Notes:
1. Those stating that they had visited woodland in the last few years. Data for Wales from 2015
and for Scotland from 2017 relates to visits in the last 12 months.
2. The range of uncertainty around any result should be no more than ±4.6% (for surveys with
around 1,000 respondents) and ±2.1% (for around 5,000 respondents). To compare results
over time, a difference of at least 5 percentage points (for surveys each with around 2,000
respondents) and at least 7 percentage points (for surveys each with around 1,000 respondents)
is required to indicate that there is a significant difference.
3. .. Denotes data not available (survey not run that year or question not asked).
These figures are outside the scope of National Statistics. For further information
see the Sources chapter.
Year England Wales Scotland Northern Ireland
UK
2003 66 62 64 77 67
2005 65 69 50 67 65
2007 76 79 75 62 77
2009 77 .. 57 .. 77
2010 .. .. .. 72 ..
2011 68 68 75 .. 67
2013 65 64 76 .. 66
2014 .. .. .. 75 ..
2015 55 64 78 .. 56
2017 62 72 84 .. 61
2019 63 77 .. 78 63
2021 69 63 86 .. 69

17
Forestry Statistics 2021: Chapter 6 Social
Survey respondents were asked how frequently they had visited during the
previous summer and winter. Figure 6.2, which presents UK results for the 2021
survey, shows that respondents visited much more often during the summer, with
45% of respondents visiting at least once a month in the summer compared to
36% in the winter.
Figure 6.1 Frequency of visits to woodlands
Source: UK Public Opinion of Forestry Survey, 2021.
Base: All respondents (approximately 5,000).
Notes:
1. The range of uncertainty around any result should be no more than ±2.1%.
These figures are outside the scope of National Statistics. For further information
see the Sources chapter.
9
10
15
19
12
16
17
17
47
38
0% 20% 40% 60% 80% 100%
Winter
Summer
Per Cent of Respondents
Several times per week Several times per month About once a month
Less often Never

18
Forestry Statistics 2021: Chapter 6 Social
In the UK 2021 Public Opinion of Forestry survey, 77% of respondents aged 16 to
34 said that they had visited woodland in the last few years for walks, picnics or
other recreation (Table 6.5). This compares with 71% of respondents aged 35 to 54
and 62% of those aged 55 or over.
Table 6.5 Woodland visitors1 by age group per cent of respondents
Source: UK and GB Public Opinion of Forestry Surveys, 2003 to 2021.
Base: 4,000 respondents (2003 to 2007); 2,000 respondents (2009 to 2019); 5,000 respondents
(2021).
Notes:
1. Those stating they had visited woodland in the last few years.
2. The range of uncertainty around any result should be no more than ±3.5% (for surveys with
around 2,000 respondents) and ±2.1% (for surveys with around 5,000 respondents). To
compare results over time, a difference of at least 5 percentage points (for surveys each with
around 2,000 respondents) is required to indicate that there is a significant difference.
These figures are outside the scope of National Statistics. For further information
see the Sources chapter.
Year Aged 16 to 34 Aged 35 to 54 Aged 55 and over
Total
2003 71 72 60 67
2005 66 74 56 65
2007 79 82 69 77
2009 78 84 69 77
2011 65 74 63 67
2013 62 75 60 66
2015 54 62 53 56
2017 60 68 55 61
2019 61 71 56 63
2021 77 71 62 69
19
Forestry Statistics 2021: Chapter 6 Social
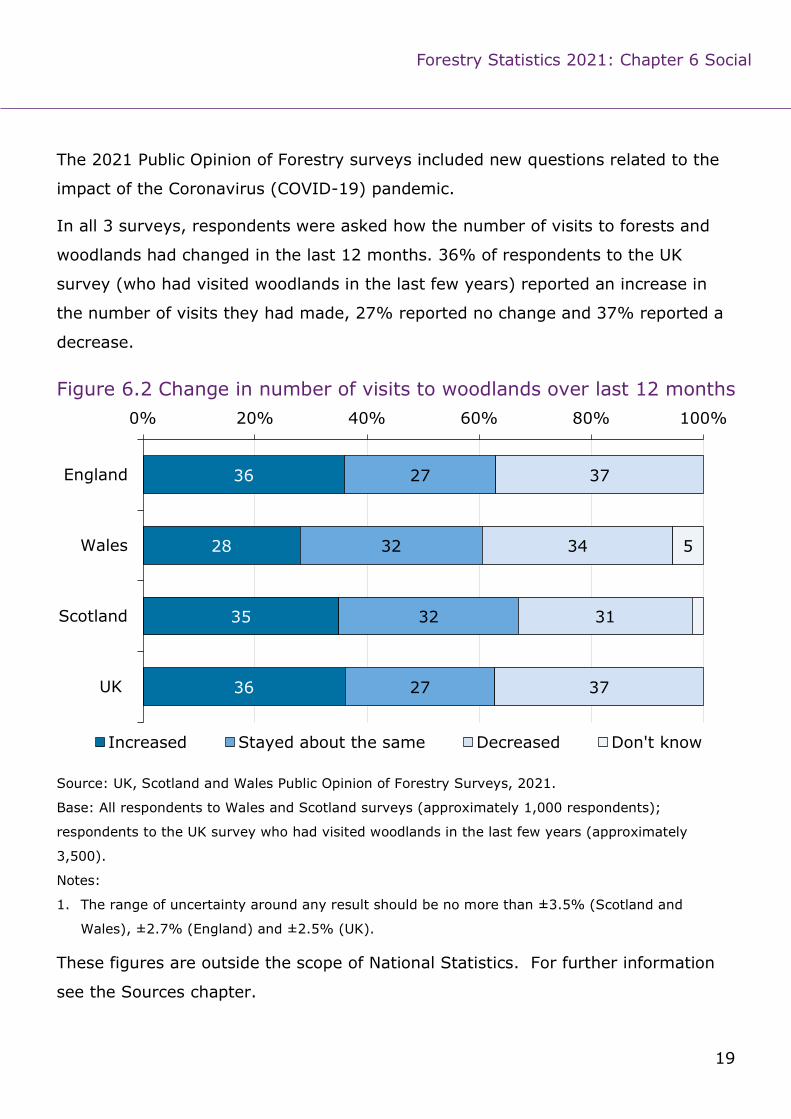
The 2021 Public Opinion of Forestry surveys included new questions related to the
impact of the Coronavirus (COVID-19) pandemic.
In all 3 surveys, respondents were asked how the number of visits to forests and
woodlands had changed in the last 12 months. 36% of respondents to the UK
survey (who had visited woodlands in the last few years) reported an increase in
the number of visits they had made, 27% reported no change and 37% reported a
decrease.
Figure 6.2 Change in number of visits to woodlands over last 12 months
Source: UK, Scotland and Wales Public Opinion of Forestry Surveys, 2021.
Base: All respondents to Wales and Scotland surveys (approximately 1,000 respondents);
respondents to the UK survey who had visited woodlands in the last few years (approximately
3,500).
Notes:
1. The range of uncertainty around any result should be no more than ±3.5% (Scotland and
Wales), ±2.7% (England) and ±2.5% (UK).
These figures are outside the scope of National Statistics. For further information
see the Sources chapter.
36
28
35
36
27
32
32
27
37
34
31
37
5
0% 20% 40% 60% 80% 100%
England
Wales
Scotland
UK
Increased Stayed about the same Decreased Don't know

20
Forestry Statistics 2021: Chapter 6 Social
The UK survey in 2021 also asked how views on forests and woodlands had
changed in the last 12 months.
When asked about their feeling of connection to forests and woodlands, 43% of
respondents who had visited woodlands reported an increase, 40% reported no
change and 13% reported a decrease.
Around one half of respondents who had visited woodlands (51%) reported an
increase in their level of happiness when in forests and woodlands. Around one
third (35%) reported no change and 10% reported a decrease.
Around one half of respondents who had visited woodlands (48%) reported an
increase in the amount of time they had taken to appreciate forests and woodlands.
Around one third (33%) reported no change and 15% (in the UK and in England)
reported a decrease.

21
Forestry Statistics 2021: Chapter 6 Social
Table 6.6 Change in views of forests and woodlands due to pandemic per cent of respondents
Source: UK Public Opinion of Forestry Survey 2021.
Base: All respondents who had visited woodlands in the last few years (approximately 3,500).
Notes:
1. The range of uncertainty around any result should be no more than ±2.5%.
These figures are outside the scope of National Statistics. For further information
see the Sources chapter.
Significantly
increased Some
increase
Stayed the
same
Some decrease
Significantly decreased
Your feeling of connection to forests and woodlands
17 27 40 8 5
Your level of happiness when in forests and woodlands
21 30 35 6 4
The amount of time you take to appreciate forests and woodlands
19 29 33 7 7
Forest Research will consider all requests to make the
content of our documents available in alternative formats.
Please send any such requests to: [email protected]
© Crown copyright 2021
Forestry Statistics 2021: Chapter 6 Social
Alice Holt Lodge Farnham Surrey, GU10 4LH, UK Tel: 0300 067 5600
Northern Research Station Roslin Midlothian, EH25 9SY, UK Tel: 0300 067 5900
Forest Research in Wales Environment Centre Wales Deiniol Road, Bangor Gwynedd, LL57 2UW, UK Tel: 0300 067 5774
[email protected] www.forestresearch.gov.uk