ch.2: mapping our world text ref. (pg.26). contents latitude and longitude latitude and longitude...
TRANSCRIPT
Ch.2: Mapping Our Ch.2: Mapping Our WorldWorld
Text ref. (pg.26)Text ref. (pg.26)

ContentsContents
Latitude and LongitudeLatitude and Longitude
Types of MapsTypes of Maps
Remote SensingRemote Sensing

Latitude and LongitudeLatitude and Longitude
Text ref. Ch.2.1, p.27-31Text ref. Ch.2.1, p.27-31

ObjectivesObjectives
Compare and contrast latitude and Compare and contrast latitude and longitude.longitude.
Describe how time zones vary.Describe how time zones vary.

CartographyCartography
Science of Science of mapmaking.mapmaking. Use a series of Use a series of
imaginary grid of imaginary grid of parallel lines and parallel lines and vertical linesvertical lines
Equator circles Equator circles Earth halfway Earth halfway between north and between north and south polessouth poles

LatitudeLatitude
Latitude is the Latitude is the distance in degrees distance in degrees north or south of the north or south of the equator.equator. Equator is equal to 0Equator is equal to 0° °
latitudelatitude Poles are equal to 90° Poles are equal to 90°
latitudelatitude North latitude from North latitude from
equator to the North equator to the North Pole.Pole.
South latitude from South latitude from equator to South Pole.equator to South Pole.

Degrees of LatitudeDegrees of Latitude
1 degree of latitude is equal to about 111 1 degree of latitude is equal to about 111 km.km. CCearthearth= 40 000 km therefore, 40 000 km/360 = = 40 000 km therefore, 40 000 km/360 =
111 km.111 km. Smaller units of measure for latitude include Smaller units of measure for latitude include
minutes minutes ‘ ‘ and seconds “ . and seconds “ . Ex. Mobile is located at 30.694N latitude.Ex. Mobile is located at 30.694N latitude.

LongitudeLongitude
Longitude is the Longitude is the distance in degrees distance in degrees east or west of the east or west of the prime meridian.prime meridian.The prime meridian The prime meridian represents 0represents 0° ° longitude.longitude. Located through Located through
Greenwich, EnglandGreenwich, England 0° to 180° E and W of 0° to 180° E and W of
prime meridianprime meridian

SemicirclesSemicircles
Lines of longitude not Lines of longitude not parallelparallel
Extend vertically from Extend vertically from pole to polepole to pole
Line of longitude Line of longitude directly opposite the directly opposite the prime meridian equal prime meridian equal to 180to 180°° Known as International Known as International
Date LineDate Line

Degrees of LongitudeDegrees of Longitude
Distance covered Distance covered by degrees of by degrees of longitude varies in longitude varies in relation to distance relation to distance from equator.from equator. Greatest at equator Greatest at equator
(111 km), (111 km), approaches a point approaches a point at the polesat the poles
Location with CoordinatesLocation with Coordinates
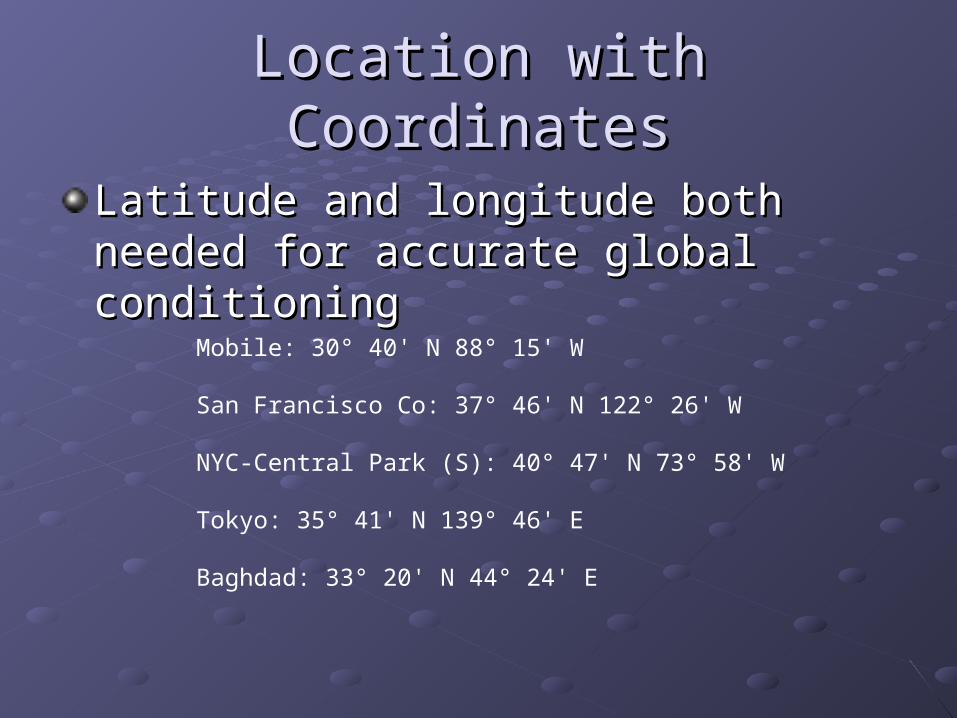
Latitude and longitude both needed for Latitude and longitude both needed for accurate global conditioningaccurate global conditioning
Mobile: 30° 40' N 88° 15' W
San Francisco Co: 37° 46' N 122° 26' W
NYC-Central Park (S): 40° 47' N 73° 58' W
Tokyo: 35° 41' N 139° 46' E
Baghdad: 33° 20' N 44° 24' E

Time ZonesTime Zones
Earth divided in 24 Earth divided in 24 time zones for each time zones for each of the 24 hours of a of the 24 hours of a dayday
Time zones 15Time zones 15° ° widewide U.S. spans 6 time U.S. spans 6 time
zoneszones


Calendar DatesCalendar Dates
By traveling through time zones you gain By traveling through time zones you gain or lose time until you gain or lose an entire or lose time until you gain or lose an entire day.day. International Date Line located at 180International Date Line located at 180° is the ° is the
calendar line for dayscalendar line for daysTravel west across the International Date Line and Travel west across the International Date Line and you advance one calendar day, east across and you advance one calendar day, east across and you lose one calendar day.you lose one calendar day.

Types of MapsTypes of Maps
Text ref. Ch.2.2: p.33-36Text ref. Ch.2.2: p.33-36

ObjectivesObjectives
Compare and contrast different map Compare and contrast different map projectionsprojections
Analyze topographic mapsAnalyze topographic maps
Describe map characteristics, such as Describe map characteristics, such as map scales and map legends.map scales and map legends.

Mercator ProjectionsMercator Projections
Map that has Map that has parallel lines of parallel lines of latitude and latitude and longitudelongitude Landmasses Landmasses
near poles are near poles are distorted, distorted, exaggerated exaggerated
Ex. Greenland Ex. Greenland appears larger appears larger than Australiathan AustraliaUse: navigation Use: navigation of planes and of planes and shipsships


Conic ProjectionsConic Projections
Made by projecting Made by projecting points from a globe points from a globe onto a cone.onto a cone. Very little distortion Very little distortion
in landmasses and in landmasses and their sizestheir sizes
Useful for smaller Useful for smaller maps of regional maps of regional areas, cities, and areas, cities, and roadmaps.roadmaps.


Gnomonic ProjectionsGnomonic Projections
Made by projecting points and lines from a globe onto a Made by projecting points and lines from a globe onto a piece of paper that touches the globe at a single point.piece of paper that touches the globe at a single point. Distort direction and distance between landmassesDistort direction and distance between landmasses Useful in planning shortest distance between two points Useful in planning shortest distance between two points
by displaying Great Circles of longitude and latitude.by displaying Great Circles of longitude and latitude.

Topographic MapsTopographic Maps
Show changes in Show changes in the elevation of the the elevation of the Earth’s surface, as Earth’s surface, as well as features well as features such as mountains, such as mountains, rivers, forests, and rivers, forests, and bridges.bridges. Use lines, symbols, Use lines, symbols,
and colors to and colors to represent changes in represent changes in elevation.elevation.

Contour Lines on Topographic Contour Lines on Topographic mapsmaps
Elevation on topographic maps Elevation on topographic maps represented by contour linesrepresented by contour lines Connects points of equal elevationConnects points of equal elevation Contour lines never crossContour lines never cross


Contour Intervals on Topographic Contour Intervals on Topographic mapsmaps
Used to show changes in elevation from Used to show changes in elevation from one contour line to anotherone contour line to another Mountains have greater contour intervals Mountains have greater contour intervals
between contour lines than do plains or hillsbetween contour lines than do plains or hills


Index Contours in Topographic Index Contours in Topographic MapsMaps
Used to aid in Used to aid in interpreting the elevation interpreting the elevation of landmarks and terrain of landmarks and terrain on a topographic map.on a topographic map. Marked by numbers Marked by numbers
representing elevationrepresenting elevation For example, if contour For example, if contour
interval is 10 m, you can interval is 10 m, you can subtract or add 10 m for subtract or add 10 m for each interval from the each interval from the index contour to index contour to determine the elevation determine the elevation at that location.at that location.

Depression Contour lines in Depression Contour lines in Topographic mapsTopographic maps
To represent areas of To represent areas of lower elevation than lower elevation than their surroundings, their surroundings, depression contour lines depression contour lines will have hachureswill have hachures Short lines at right angles Short lines at right angles
to the contour lineto the contour line Point toward the area Point toward the area
with the lower with the lower depression.depression.

Map LegendsMap Legends
Natural and human-made features are Natural and human-made features are represented by symbols on mapsrepresented by symbols on maps

Map ScalesMap Scales
Defines the ratio between distances on a map and actual distances on Defines the ratio between distances on a map and actual distances on the surface of Earththe surface of Earth
VerbalVerbal: expresses ratio as a statement: expresses ratio as a statement GraphicGraphic: consists of a line that represents a certain distance.: consists of a line that represents a certain distance. FractionalFractional: expresses distance as a ratio: expresses distance as a ratio

Ch.2.3: Ch.2.3: Remote Remote SensingSensing
Text ref. p 37-41Text ref. p 37-41

ObjectivesObjectives
Compare and contrast the different forms Compare and contrast the different forms of radiation in the electromagnetic of radiation in the electromagnetic spectrum.spectrum.
Discuss how satellites and sonar are used Discuss how satellites and sonar are used to map Earth’s surface and its oceans.to map Earth’s surface and its oceans.
Describe the Global Positioning SystemDescribe the Global Positioning System

The Electromagnetic SpectrumThe Electromagnetic Spectrum
Arrangement of electromagnetic radiation Arrangement of electromagnetic radiation according to wavelengthsaccording to wavelengths
Electromagnetic radiation (i.e. light) Electromagnetic radiation (i.e. light)
Speed = 300 000 km/s or 186 000 mi/sSpeed = 300 000 km/s or 186 000 mi/s
Types of EM radiation are defined by their Types of EM radiation are defined by their frequency and wavelengthfrequency and wavelength Frequency is the number of wavelengths that Frequency is the number of wavelengths that
occur each secondoccur each second


Landsat SatellitesLandsat Satellites
Receives reflected wavelengths of energy emitted by Receives reflected wavelengths of energy emitted by Earth’s surfaceEarth’s surfaceInfrared imaging allows for detailed images of lakes, Infrared imaging allows for detailed images of lakes, rivers, forests, etc…rivers, forests, etc…Mirrors based on satellite with light-sensitive detectorsMirrors based on satellite with light-sensitive detectors
Computer image conversionComputer image conversion
Landsat 7 1999, maps 185 kmLandsat 7 1999, maps 185 km22
Can map the Earth in 16 daysCan map the Earth in 16 days


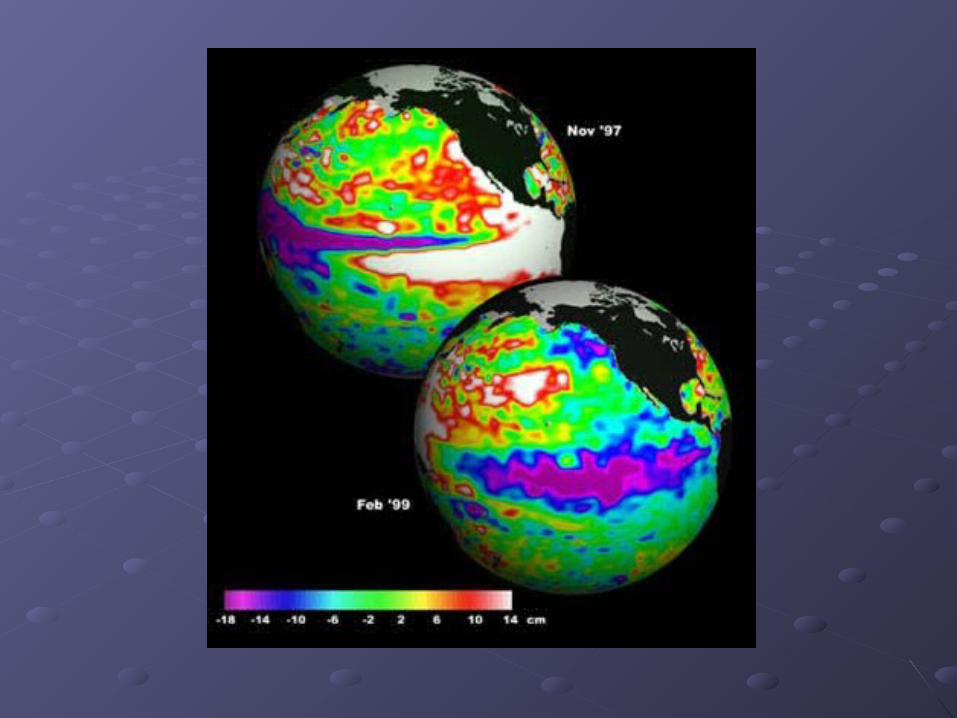
Topex/Poseidon SatelliteTopex/Poseidon Satellite
Uses radar to map features of ocean floorUses radar to map features of ocean floor
““Topex”= topography experimentTopex”= topography experiment
Beacons on ocean surface reflect high Beacons on ocean surface reflect high frequency radar send by Topexfrequency radar send by Topex
Distance to water’s surface calculated by Distance to water’s surface calculated by wave speed formulawave speed formula
v = v = λλ x f x f


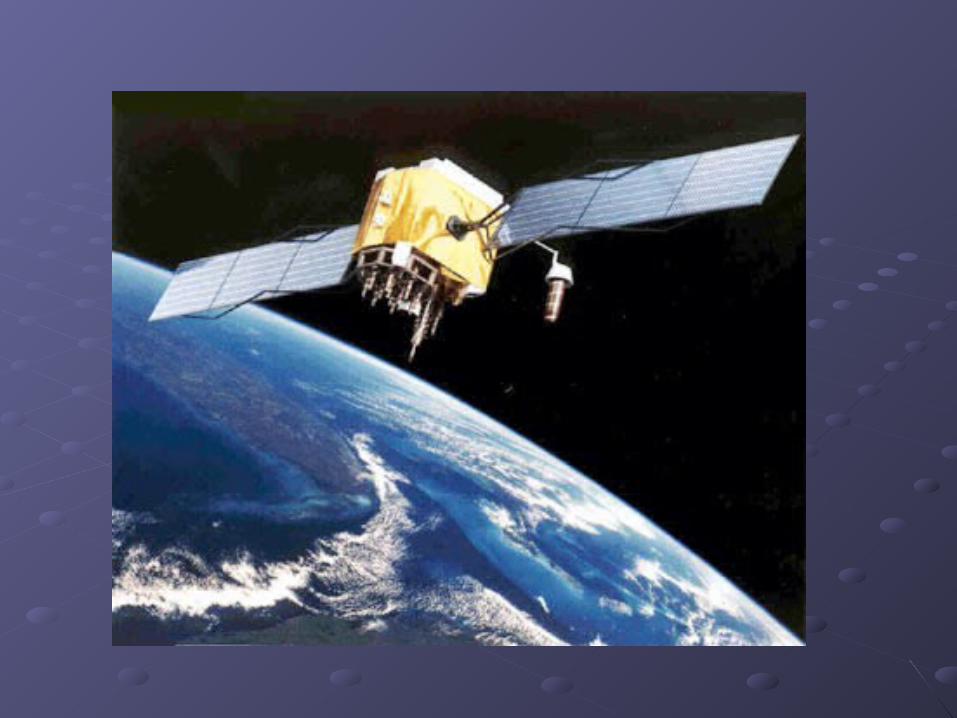
The Global Positioning SystemThe Global Positioning System
GPSGPSRadio-navigation system of 24 satellites Radio-navigation system of 24 satellites used to determine exact position on Earthused to determine exact position on EarthOriginally devised by the military for Originally devised by the military for strategic operationsstrategic operationsHand-held GPS unit can calculate the Hand-held GPS unit can calculate the latitude and longitude of a location by latitude and longitude of a location by processing signals of multiple GPS processing signals of multiple GPS satellites.satellites.


GPS continued…GPS continued…
Uses:Uses: Navigation of ships and planesNavigation of ships and planes Earthquake detectionEarthquake detection Map generationMap generation Wildlife/ecology researchWildlife/ecology research

Sea BeamSea Beam
Technology used to map the ocean floorTechnology used to map the ocean floor
Located on ship rather than satellite-basedLocated on ship rather than satellite-based
SONAR technology used for mappingSONAR technology used for mapping
Sound waves sent from ship bounce off Sound waves sent from ship bounce off ocean floor and return to receiver on ship. ocean floor and return to receiver on ship. Distance calculated using wave speed Distance calculated using wave speed formulaformula


Uses of Sea BeamUses of Sea Beam
Fishing fleetsFishing fleets
Deep-sea drilling operationsDeep-sea drilling operations
OceanographersOceanographers
VolcanologistsVolcanologists
ArcheologistsArcheologists