ch02 ppt brighamfm1ce
TRANSCRIPT
8/3/2019 Ch02 Ppt Brighamfm1ce
http://slidepdf.com/reader/full/ch02-ppt-brighamfm1ce 1/45
PowerPoint Presentationprepared by
Traven ReedCanadore College
8/3/2019 Ch02 Ppt Brighamfm1ce
http://slidepdf.com/reader/full/ch02-ppt-brighamfm1ce 2/45
chapter 2Financial Statements, Cash
Flow, and Taxes

8/3/2019 Ch02 Ppt Brighamfm1ce
http://slidepdf.com/reader/full/ch02-ppt-brighamfm1ce 3/45
CH2
Copyright © 2011 by Nelson Education Ltd. All rights reserved. 2-3
Corporate Valuation andFinancial Statements

8/3/2019 Ch02 Ppt Brighamfm1ce
http://slidepdf.com/reader/full/ch02-ppt-brighamfm1ce 4/45
CH2
Copyright © 2011 by Nelson Education Ltd. All rights reserved. 2-4
Topics in Chapter
Balance sheet
Income statement
Statement of retained earnings
Accounting income versus cash flow
Statement of cash flows
MVA and EVA Personal taxes
Corporate taxes

8/3/2019 Ch02 Ppt Brighamfm1ce
http://slidepdf.com/reader/full/ch02-ppt-brighamfm1ce 5/45
CH2
Financial Statements and
Reports Company annual report describes
the operating results from the past
year and new plans for the comingyear with four financial statements:
± Balance sheet
± Income statement ± Statement of retained earnings
± Statement of cash flows
Copyright © 2011 by Nelson Education Ltd. All rights reserved. 2-5

8/3/2019 Ch02 Ppt Brighamfm1ce
http://slidepdf.com/reader/full/ch02-ppt-brighamfm1ce 6/45
CH2
Balance Sheet
Provide a snapshot of the firm¶sfinancial position at a particular point
in time. Show assets on the left-hand size or
at the top and liabilities/equity (i.e.claims against assets) on t
he rig
ht-
hand size or at the bottom.
Record with book values when assets
are pur chased or liabilities are issued.Copyright © 2011 by Nelson Education Ltd. All rights reserved. 2-6
8/3/2019 Ch02 Ppt Brighamfm1ce
http://slidepdf.com/reader/full/ch02-ppt-brighamfm1ce 7/45
CH2
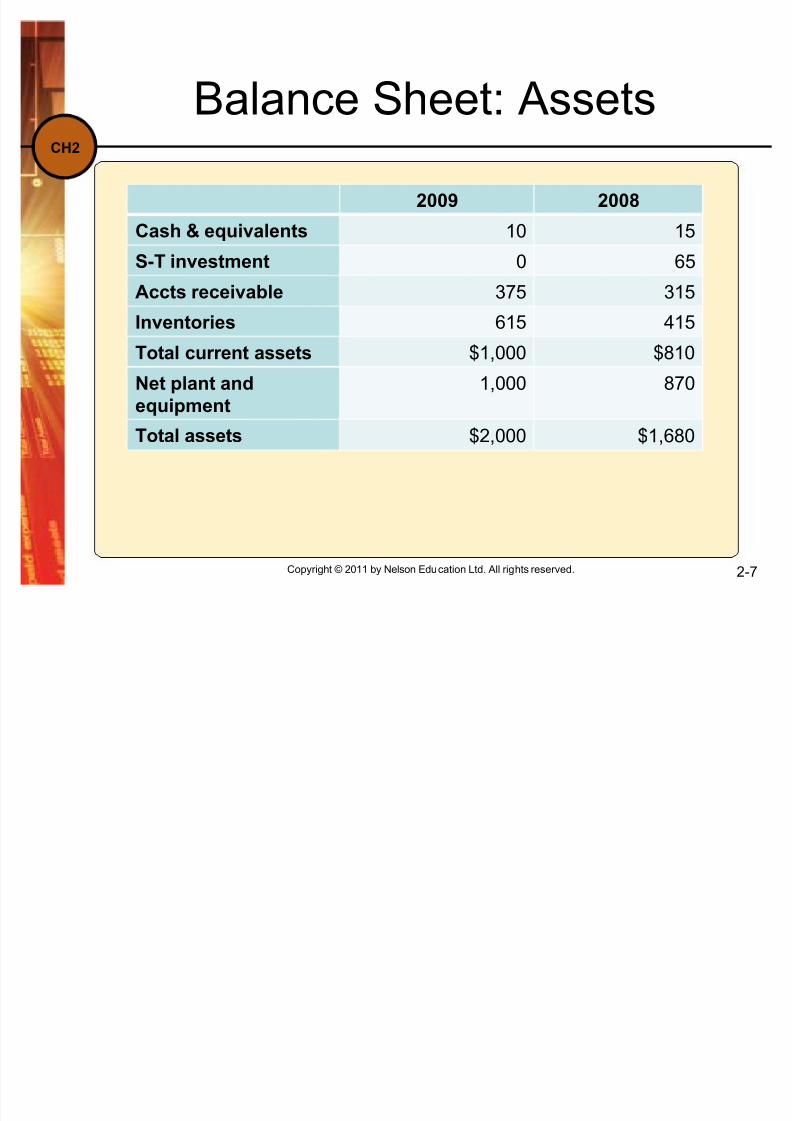
Balance Sheet: Assets
2009 2008
Cash & equivalents 10 15
S-T investment 0 65
Accts receivable 375 315
Inventories 615 415
Total current assets $1,000 $810
Net plant and
equipment
1,000 870
Total assets $2,000 $1,680
Copyright © 2011 by Nelson Education Ltd. All rights reserved. 2-7
8/3/2019 Ch02 Ppt Brighamfm1ce
http://slidepdf.com/reader/full/ch02-ppt-brighamfm1ce 8/45
CH2
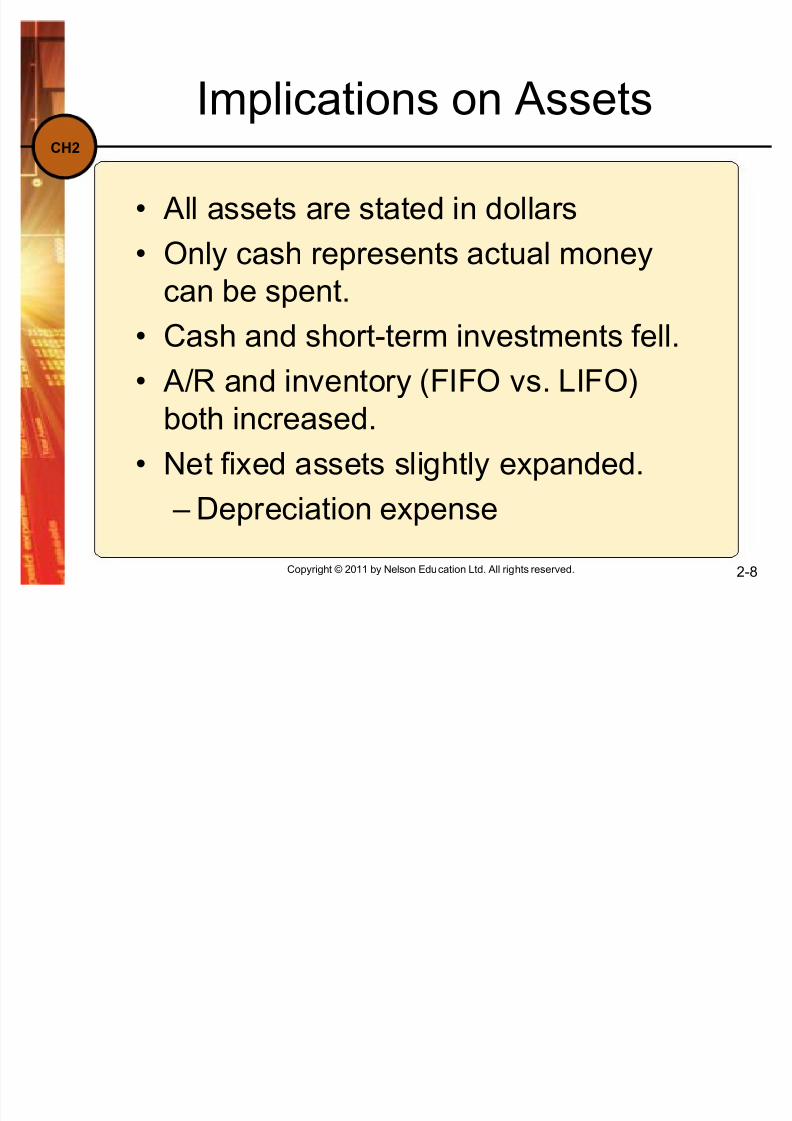
Implications on Assets
All assets are stated in dollars
Only cash represents actual moneycan be spent.
Cash and short-term investments fell.
A/R and inventory (FIFO vs. LIFO)
both increased. Net fixed assets slightly expanded.
± Depreciation expense
Copyright © 2011 by Nelson Education Ltd. All rights reserved. 2-8
8/3/2019 Ch02 Ppt Brighamfm1ce
http://slidepdf.com/reader/full/ch02-ppt-brighamfm1ce 9/45
CH2
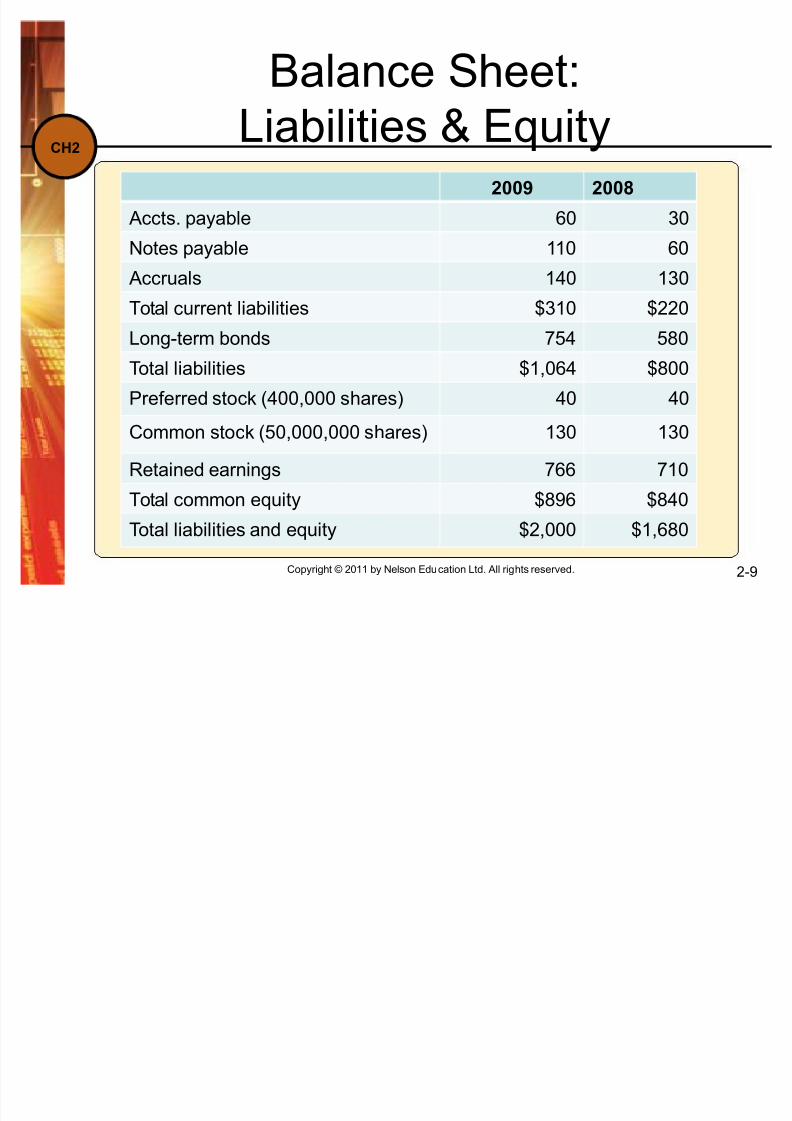
Balance Sheet:
Liabilities & Equity2009 2008
Accts. payable 60 30
Notes payable 110 60
Accruals 140 130Total current liabilities $310 $220
Long-term bonds 754 580
Total liabilities $1,064 $800
Preferred stock (400,000 shares) 40 40
Common stock (50,000,000 shares) 130 130
Retained earnings 766 710
Total common equity $896 $840
Total liabilities and equity $2,000 $1,680
Copyright © 2011 by Nelson Education Ltd. All rights reserved. 2-9

8/3/2019 Ch02 Ppt Brighamfm1ce
http://slidepdf.com/reader/full/ch02-ppt-brighamfm1ce 10/45
CH2
Implications on Liabilities &
Equity CL increased as creditors and
suppliers ³financed´ part of the
expansion. Long-term debt increased to help
finance the expansion.
Thecompany didn¶t issue any newstock.
Retained earnings went up, due tono dividend payment.
Copyright © 2011 by Nelson Education Ltd. All rights reserved. 2-10

8/3/2019 Ch02 Ppt Brighamfm1ce
http://slidepdf.com/reader/full/ch02-ppt-brighamfm1ce 11/45
CH2
Income Statement
Show a firm¶s performance over aperiod of time such as a month, a
quarter or a year
Although NI (i.e. profit or earnings)is an important item, EBITDA can
be a better measure of financialstrength
EBITDA is not as important as FCF
Copyright © 2011 by Nelson Education Ltd. All rights reserved. 2-11
8/3/2019 Ch02 Ppt Brighamfm1ce
http://slidepdf.com/reader/full/ch02-ppt-brighamfm1ce 12/45
CH2
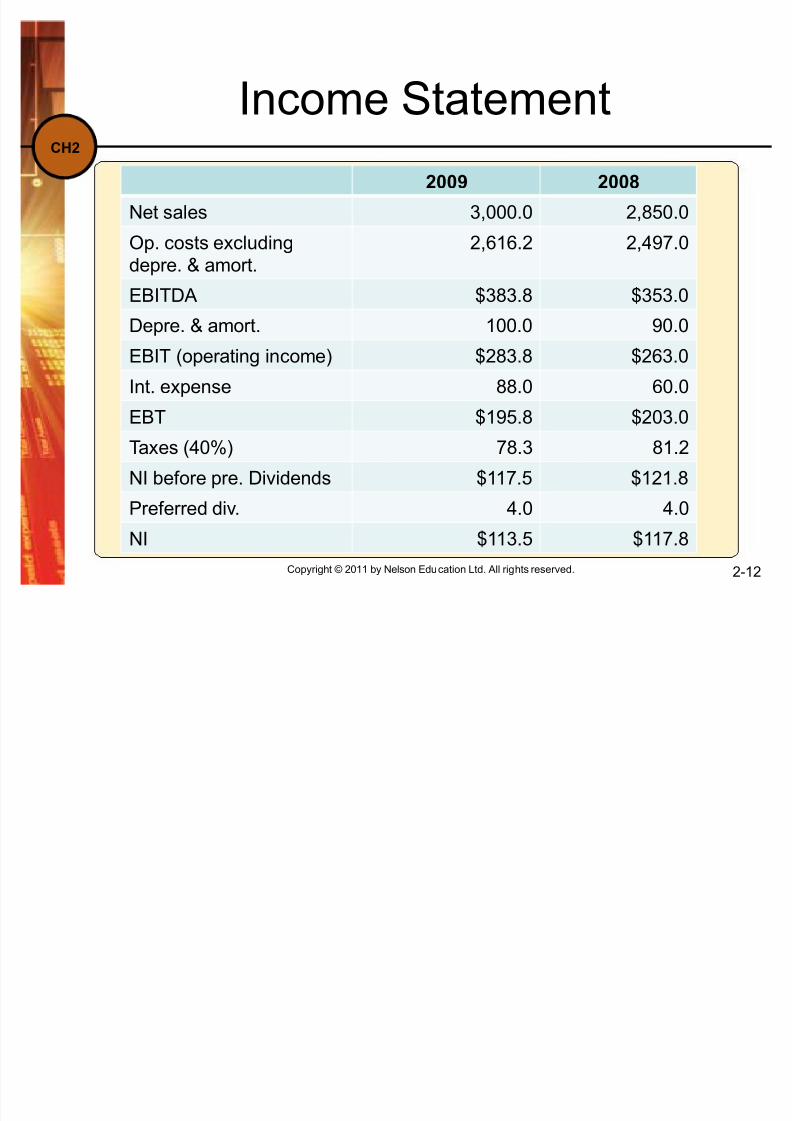
Income Statement
2009 2008
Net sales 3,000.0 2,850.0
Op. costs excludingdepre. & amort.
2,616.2 2,497.0
EBITDA $383.8 $353.0
Depre. & amort. 100.0 90.0
EBIT (operating income) $283.8 $263.0
Int. expense 88.0 60.0
EBT $195.8 $203.0Taxes (40%) 78.3 81.2
NI before pre. Dividends $117.5 $121.8
Preferred div. 4.0 4.0
NI $113.5 $117.8
Copyright © 2011 by Nelson Education Ltd. All rights reserved. 2-12

8/3/2019 Ch02 Ppt Brighamfm1ce
http://slidepdf.com/reader/full/ch02-ppt-brighamfm1ce 13/45
CH2
Stock Price and Other Data
2009 2008
Common stock price $23.00 $26.00
# of shares 50,000,000 50,000,000
EPS $2.27 $2.36
DPS $1.15 $1.06
BVPS $17.92 $16.80
CFPS $4.27 $4.16
Copyright © 2011 by Nelson Education Ltd. All rights reserved. 2-13
8/3/2019 Ch02 Ppt Brighamfm1ce
http://slidepdf.com/reader/full/ch02-ppt-brighamfm1ce 14/45
CH2
Copyright © 2011 by Nelson Education Ltd. All rights reserved. 2-14
What happened to sales andnet income?
Sales increased by over $150million.
Total operating costs shot up.
Interest expenses also went up.
Net income was down.
The firm paid less tax as a result.

8/3/2019 Ch02 Ppt Brighamfm1ce
http://slidepdf.com/reader/full/ch02-ppt-brighamfm1ce 15/45
CH2
Copyright © 2011 by Nelson Education Ltd. All rights reserved. 2-15
Statement of RetainedEarnings, 2009
Balance of retained earnings,12/31/2008 $710.0
Add: Net income, 2009 113.5
Less: Dividends paid, 2009 (57.5)Balance of retained earnings,12/31/2009 $766.0

8/3/2019 Ch02 Ppt Brighamfm1ce
http://slidepdf.com/reader/full/ch02-ppt-brighamfm1ce 16/45
CH2
Net Cash Flow
Net cash flow accounting profitsince some revenues and expenses
are not received or paid in cash
NCF = NI ± noncash revenues +noncash charges
NCF = NI + Depreciation andamortization
Copyright © 2011 by Nelson Education Ltd. All rights reserved. 2-16

8/3/2019 Ch02 Ppt Brighamfm1ce
http://slidepdf.com/reader/full/ch02-ppt-brighamfm1ce 17/45
CH2
Copyright © 2011 by Nelson Education Ltd. All rights reserved. 2-17
Statement of Cash Flows: 2009
Operating Activities
Net Income $117.5
Adjustments:Depreciation 100.0
Change in A/R (60.0)
Change in inventories (200.0)
Change in A/P 30.0
Change in accruals 10.0
Net cash provided by op. act. ($2.5)
8/3/2019 Ch02 Ppt Brighamfm1ce
http://slidepdf.com/reader/full/ch02-ppt-brighamfm1ce 18/45
CH2
Copyright © 2011 by Nelson Education Ltd. All rights reserved. 2-18
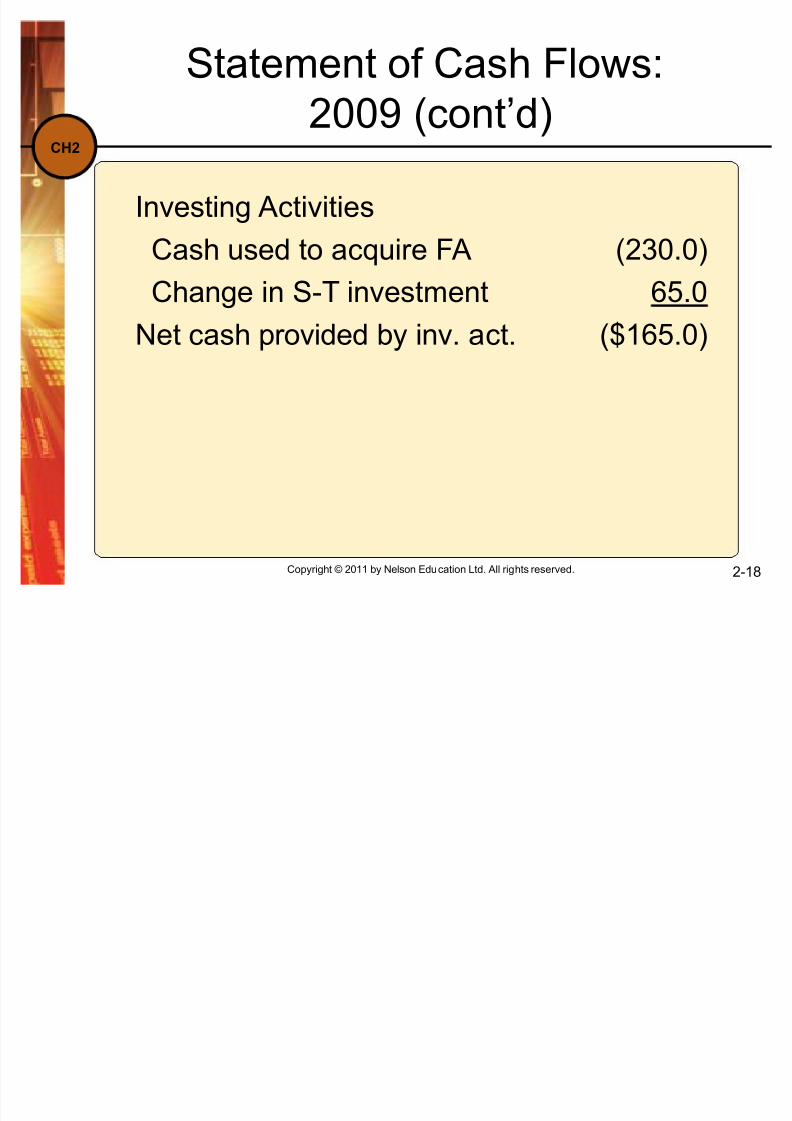
Statement of Cash Flows:2009 (cont¶d)
Investing Activities
Cash used to acquire FA (230.0)
Change in S-T investment 65.0
Net cash provided by inv. act. ($165.0)
8/3/2019 Ch02 Ppt Brighamfm1ce
http://slidepdf.com/reader/full/ch02-ppt-brighamfm1ce 19/45
CH2
Copyright © 2011 by Nelson Education Ltd. All rights reserved. 2-19
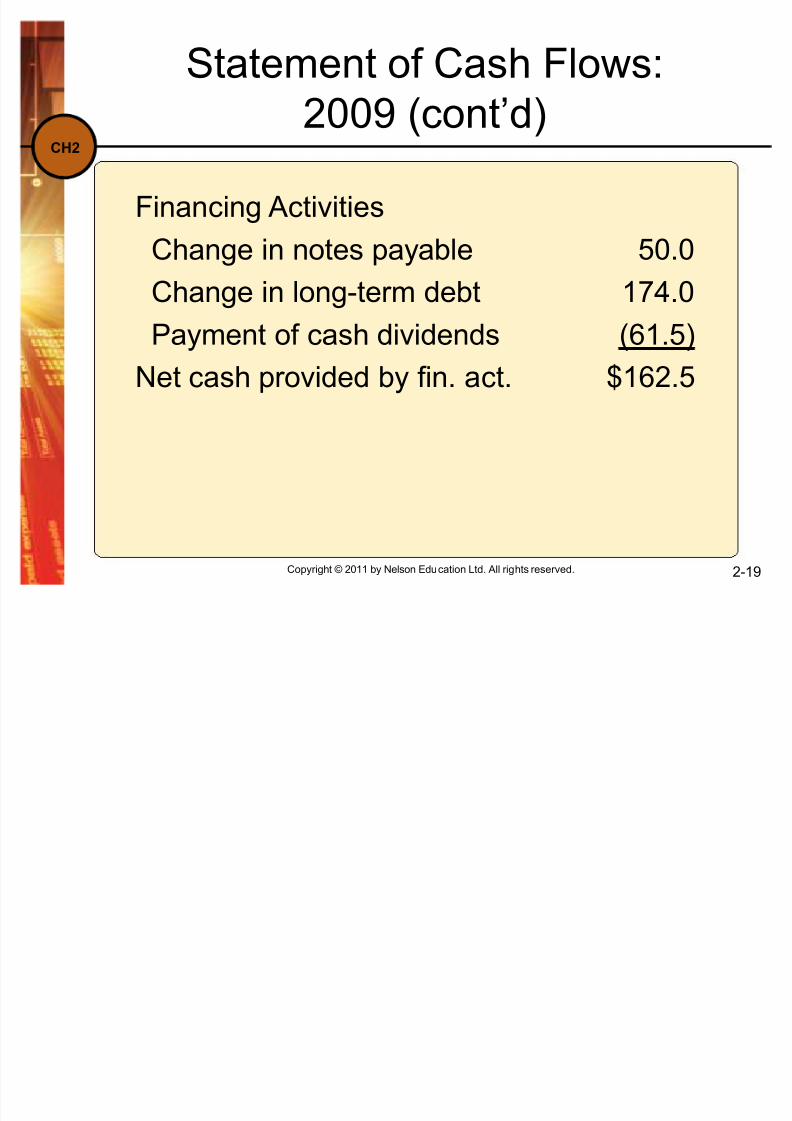
Financing Activities
Change in notes payable 50.0
Change in long-term debt 174.0
Payment of cash dividends (61.5)
Net cash provided by fin. act. $162.5
Statement of Cash Flows:2009 (cont¶d)

8/3/2019 Ch02 Ppt Brighamfm1ce
http://slidepdf.com/reader/full/ch02-ppt-brighamfm1ce 20/45
CH2
Copyright © 2011 by Nelson Education Ltd. All rights reserved. 2-20
Summary of Statement of CF
Net cash provided by op. act. (2.5)
Netc
ash
provided by inv. ac
t. (165.5)Net cash provided by fin. act. 162.5
Net change in cash ($5.0)
Cash at beginning of year 15.0
Cash at end of year $10.0

8/3/2019 Ch02 Ppt Brighamfm1ce
http://slidepdf.com/reader/full/ch02-ppt-brighamfm1ce 21/45
CH2
Copyright © 2011 by Nelson Education Ltd. All rights reserved. 2-21
What can you conclude fromthe statement of cash flows?
Net CF from operations = -$2.5 million,because of reduction net income and big
increases in working
capital. The firm spent $230 million on fixed
assets.
The firm borrowed heavily and sold
bonds to meet itscash
requirements. Even after borrowing, the cash account
fell by $5m.

8/3/2019 Ch02 Ppt Brighamfm1ce
http://slidepdf.com/reader/full/ch02-ppt-brighamfm1ce 22/45
CH2
What are operating current
assets? Operating current assets are the
CA needed to support operations.
± Op CA include: cash, inventory,receivables.
± Op CA exclude: short-term
investments, because t
hese are not apart of operations.
Copyright © 2011 by Nelson Education Ltd. All rights reserved. 2-22

8/3/2019 Ch02 Ppt Brighamfm1ce
http://slidepdf.com/reader/full/ch02-ppt-brighamfm1ce 23/45
CH2
What are operating current
liabilities? Operating current liabilities are the
CL resulting as a normal part of
operations. ± Op CL include: accounts payable and
accruals.
± Op CL exclude: notes payable,because this is a sour ce of financing,not a part of operations.
Copyright © 2011 by Nelson Education Ltd. All rights reserved. 2-23

8/3/2019 Ch02 Ppt Brighamfm1ce
http://slidepdf.com/reader/full/ch02-ppt-brighamfm1ce 24/45
CH2
Net Operating Working
Capital (NOWC) NOWC = Operating current assets
± Operating current liabilities
Copyright © 2011 by Nelson Education Ltd. All rights reserved. 2-24
NOWC2009 = ($10 + $375 + $615)
- ($60 + $140)
= $800 millionUse (Cash + A/R + inventories) ± (A/P + accruals)
to try NOWC2008.

8/3/2019 Ch02 Ppt Brighamfm1ce
http://slidepdf.com/reader/full/ch02-ppt-brighamfm1ce 25/45
CH2
Total net operating capital
(also called operating capital) Total net operating capital = NOWC
+ operating long-term assets.
(TN)OC2009 = $800 + $1,000 =$1,800 million
(TN)OC2008 = $585 + $870 = $1,455
million
Copyright © 2011 by Nelson Education Ltd. All rights reserved. 2-25

8/3/2019 Ch02 Ppt Brighamfm1ce
http://slidepdf.com/reader/full/ch02-ppt-brighamfm1ce 26/45
CH2
Net Operating Profit after
Taxes (NOPAT)NOPAT = EBIT(1 - Tax rate) =
Operating income × ( 1 ± Tax rate)
NOPAT2009 = $283.8 ×(1 - 0.4)
= $170.3 million
NOPAT2008 = $157.8 million
Copyright © 2011 by Nelson Education Ltd. All rights reserved. 2-26

8/3/2019 Ch02 Ppt Brighamfm1ce
http://slidepdf.com/reader/full/ch02-ppt-brighamfm1ce 27/45
CH2
Copyright © 2011 by Nelson Education Ltd. All rights reserved. 2-27
What is free cash flow (FCF)?Why is it important?
FCF is the amount of cash availablefrom operations for distribution to all
investors (including stockholdersand debtholders) after making thenecessary investments to support
operations. A company¶s value depends upon
the amount of FCF it can generate.

8/3/2019 Ch02 Ppt Brighamfm1ce
http://slidepdf.com/reader/full/ch02-ppt-brighamfm1ce 28/45
CH2
Copyright © 2011 by Nelson Education Ltd. All rights reserved. 2-28
What are the five uses of FCF?
1. Pay interest on debt.
2. Pay back principal on debt.
3. Pay cash dividends.
4. Buy back stock.
5. Buy non-operating assets (e.g.,marketable securities, investmentsin other companies, etc.)

8/3/2019 Ch02 Ppt Brighamfm1ce
http://slidepdf.com/reader/full/ch02-ppt-brighamfm1ce 29/45
CH2
Copyright © 2011 by Nelson Education Ltd. All rights reserved. 2-29
Free Cash Flow (FCF) for 2009
FCF = NOPAT - Net investment in
operating capital
= $170.3 - ($1,800 - $1,455)
= $170.3 - $345.0
= -$174.7 million
How do you suppose investors reacted?

8/3/2019 Ch02 Ppt Brighamfm1ce
http://slidepdf.com/reader/full/ch02-ppt-brighamfm1ce 30/45
CH2
Copyright © 2011 by Nelson Education Ltd. All rights reserved. 2-30
Free Cash Flow (FCF) for 2009
FCF = Operating cash flow ± grossinvestment in operating capital
OCF = NOPAT + depreciation
Gross investment in operating capital = netinvestment in op. capital + depreciation
= ($170.3 + $100) - ($345 + $100)= $270.3 - $445.0
= -$174.7 million (same as before)

8/3/2019 Ch02 Ppt Brighamfm1ce
http://slidepdf.com/reader/full/ch02-ppt-brighamfm1ce 31/45
CH2
Copyright © 2011 by Nelson Education Ltd. All rights reserved. 2-31
Return on Invested Capital (ROIC)
ROIC = NOPAT / operating capital
ROIC2009 = $170.3 / $1,800 = 9.46%
Is this enough to cover the firm¶s cost of
capital?

8/3/2019 Ch02 Ppt Brighamfm1ce
http://slidepdf.com/reader/full/ch02-ppt-brighamfm1ce 32/45
CH2
Market Value Added (MVA)
MVA = Market Value of the Firm -Book Value of the Firm
Market Value = (# shares of stock)(price per share) + Value of debt
Book Value = Total common equity+ Value of debt
Copyright © 2011 by Nelson Education Ltd. All rights reserved. 2-32

8/3/2019 Ch02 Ppt Brighamfm1ce
http://slidepdf.com/reader/full/ch02-ppt-brighamfm1ce 33/45
CH2
MVA (cont¶d)
If the market value and book valueof debt are close, then MVA is:
MVA = Market value of equity ±book value of equity
MVA = (Shares outstanding)(Stock
price) ± total common equity MVA = Total market value ± total
investors supplied capital
Copyright © 2011 by Nelson Education Ltd. All rights reserved. 2-33
8/3/2019 Ch02 Ppt Brighamfm1ce
http://slidepdf.com/reader/full/ch02-ppt-brighamfm1ce 34/45
CH2
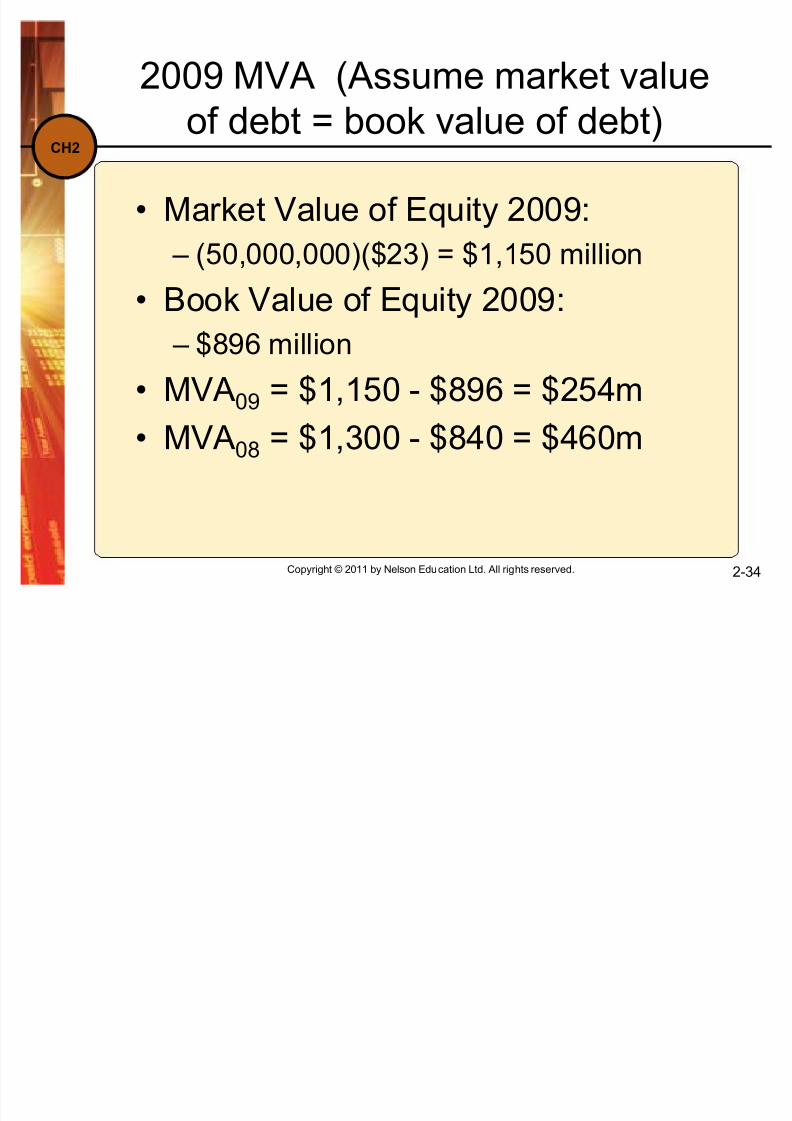
2009 MVA (Assume market valueof debt = book value of debt)
Market Value of Equity 2009:
± (50,000,000)($23) = $1,150 million
Book Value of Equity 2009:
± $896 million
MVA09 = $1,150 - $896 = $254m
MVA08 = $1,300 - $840 = $460m
Copyright © 2011 by Nelson Education Ltd. All rights reserved. 2-34
8/3/2019 Ch02 Ppt Brighamfm1ce
http://slidepdf.com/reader/full/ch02-ppt-brighamfm1ce 35/45
CH2
Copyright © 2011 by Nelson Education Ltd. All rights reserved. 2-35
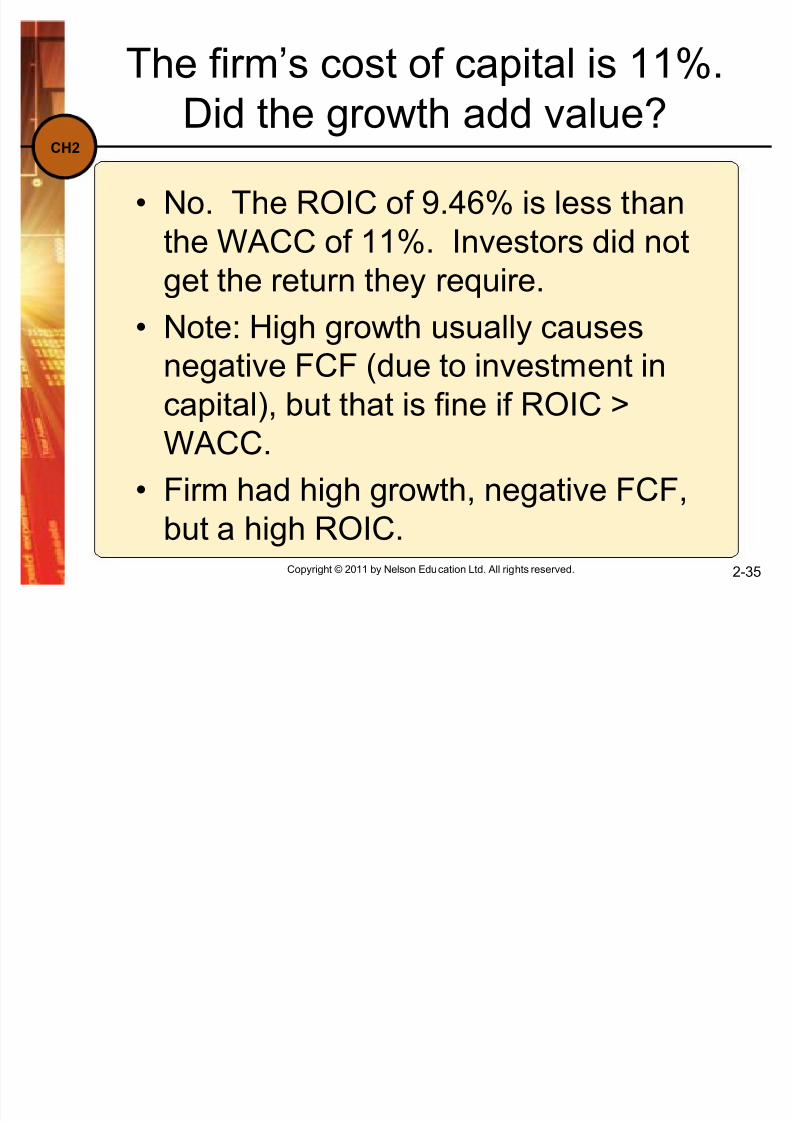
The firm¶s cost of capital is 11%.Did the growth add value?
No. The ROIC of 9.46% is less thanthe WACC of 11%. Investors did not
get the return they require. Note: High growth usually causes
negative FCF (due to investment inc
apital), but th
at is fine if ROIC >WACC.
Firm had high growth, negative FCF,but a high ROIC.

8/3/2019 Ch02 Ppt Brighamfm1ce
http://slidepdf.com/reader/full/ch02-ppt-brighamfm1ce 36/45
CH2
Copyright © 2011 by Nelson Education Ltd. All rights reserved. 2-36
Economic Value Added (EVA)
WACC is weighted average cost of capital
EVA = NOPAT- [(WACC)(Capital)]
8/3/2019 Ch02 Ppt Brighamfm1ce
http://slidepdf.com/reader/full/ch02-ppt-brighamfm1ce 37/45
CH2
Copyright © 2011 by Nelson Education Ltd. All rights reserved. 2-37
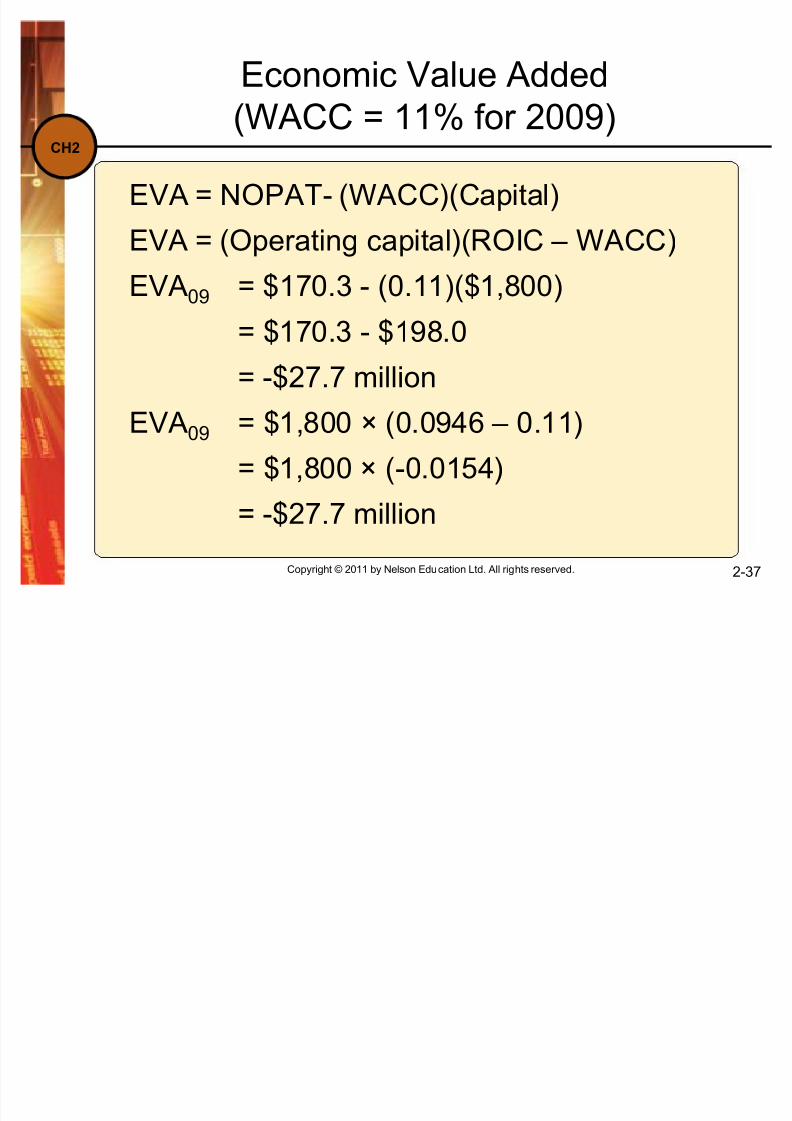
Economic Value Added(WACC = 11% for 2009)
EVA = NOPAT- (WACC)(Capital)
EVA = (Operating capital)(ROIC ± WACC)
EVA09 = $170.3 - (0.11)($1,800)
= $170.3 - $198.0
= -$27.7 million
EVA09 = $1,800 × (0.0946 ± 0.11)= $1,800 × (-0.0154)
= -$27.7 million

8/3/2019 Ch02 Ppt Brighamfm1ce
http://slidepdf.com/reader/full/ch02-ppt-brighamfm1ce 38/45
CH2
Copyright © 2011 by Nelson Education Ltd. All rights reserved. 2-38
Key Features of the Tax Code
Corporate Taxes ± Rate vary with firm size, location, and type of
income being earned ± Both the federal and provincial governments
tax companies
Individual Taxes ± Rate are progressive
± Income tax must be paid at the federal andprovincial level
8/3/2019 Ch02 Ppt Brighamfm1ce
http://slidepdf.com/reader/full/ch02-ppt-brighamfm1ce 39/45
CH2
Copyright © 2011 by Nelson Education Ltd. All rights reserved. 2-39
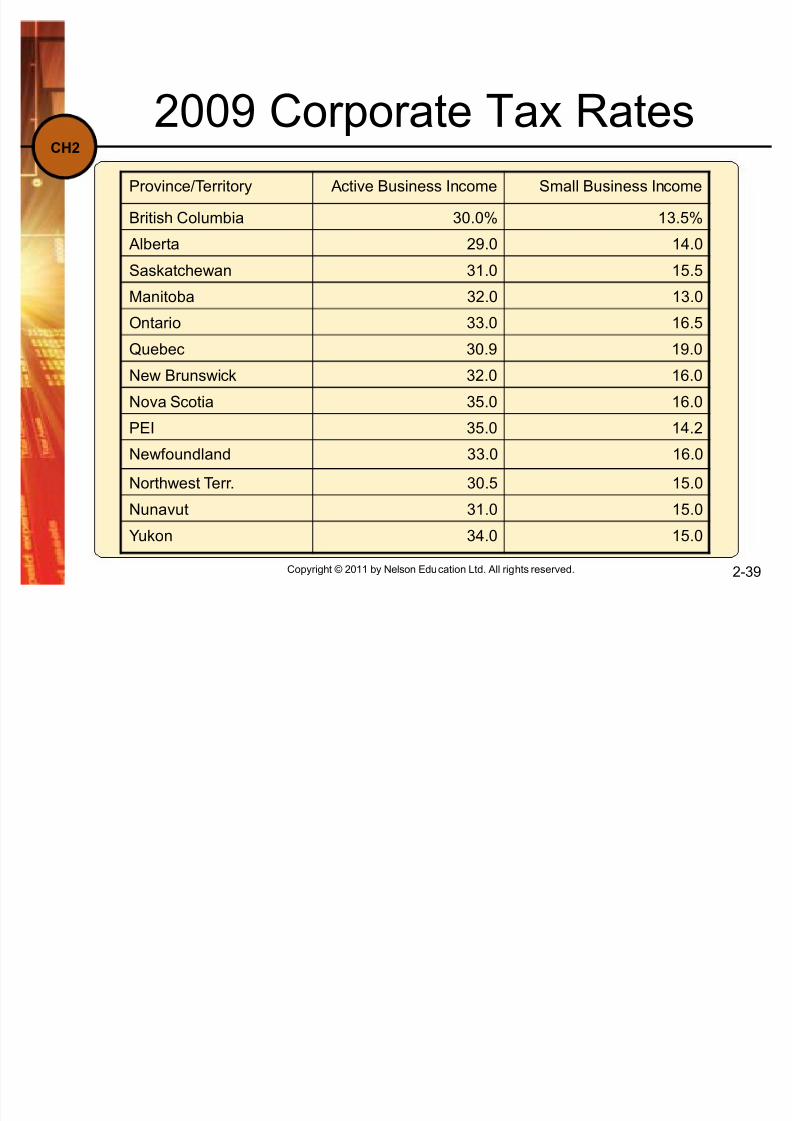
2009 Corporate Tax Rates
Province/Territory Active Business Income Small Business Income
British Columbia 30.0% 13.5%
Alberta 29.0 14.0
Saskatchewan 31.0 15.5
Manitoba 32.0 13.0
Ontario 33.0 16.5
Quebec 30.9 19.0
New Brunswick 32.0 16.0
Nova Scotia 35.0 16.0
PEI 35.0 14.2
Newfoundland 33.0 16.0
Northwest Terr. 30.5 15.0
Nunavut 31.0 15.0
Yukon 34.0 15.0
8/3/2019 Ch02 Ppt Brighamfm1ce
http://slidepdf.com/reader/full/ch02-ppt-brighamfm1ce 40/45
CH2
Copyright © 2011 by Nelson Education Ltd. All rights reserved. 2-40
Features of CorporateTaxation
In Alberta, small business incomeup to $400,000 earned by a CCPC:
± Below $400,000, the combined taxrate is set at 14%.
± Above $400,000, the combined tax
rate bec
omes 29%.

8/3/2019 Ch02 Ppt Brighamfm1ce
http://slidepdf.com/reader/full/ch02-ppt-brighamfm1ce 41/45
CH2
Copyright © 2011 by Nelson Education Ltd. All rights reserved. 2-41
Features of Corporate Taxes (cont¶d)
A corporation can:
± deduct its interest expenses but not its
dividend payments. ± carry back losses for 3 years, carry forward
losses for 10 years.*
± Exclude 100% of dividend income if received
from anoth
er Canadianc
orporation*The loss treatment is to avoid penalizing corporationswhose incomes fluctuate substantially from year toyear.

8/3/2019 Ch02 Ppt Brighamfm1ce
http://slidepdf.com/reader/full/ch02-ppt-brighamfm1ce 42/45
CH2
Copyright © 2011 by Nelson Education Ltd. All rights reserved. 2-42
Example
Assume a small Alberta Canadian-controlled private corporation
(CCPC) has $500,000 of taxableincome from operations, $25,000 of interest income, and $50,000 of
dividend income. What is its tax liability?

8/3/2019 Ch02 Ppt Brighamfm1ce
http://slidepdf.com/reader/full/ch02-ppt-brighamfm1ce 43/45
CH2
Copyright © 2011 by Nelson Education Ltd. All rights reserved. 2-43
Operating income $500,000
Interest income 25,000Taxable dividend
income0*
Taxable income $525,000
*Dividend earned from Canadian companies faces no taxation
Example (cont¶d)

8/3/2019 Ch02 Ppt Brighamfm1ce
http://slidepdf.com/reader/full/ch02-ppt-brighamfm1ce 44/45
CH2
Copyright © 2011 by Nelson Education Ltd. All rights reserved. 2-44
Taxable Income = $525,000
Tax on base @14% = $56,000= $400,000×0.14
Amount over base = $525,000 - $400,000
= $125,000
Total Tax = $56,000 + 0.29 ($125,000)= $92,250
Example (cont¶d)

8/3/2019 Ch02 Ppt Brighamfm1ce
http://slidepdf.com/reader/full/ch02-ppt-brighamfm1ce 45/45
CH2
Copyright © 2011 by Nelson Education Ltd. All rights reserved. 2-45
Key Features of IndividualTaxation
Individuals face progressive taxrates, from 15% to 29%.
The rate on capital gains is one half the rate of ordinary income. Dividends consist of a gross up of
the actual dividend, calculating tax
on the grossed up dividend andthen taking a tax credit on thegrossed up amount.