ch 5: present worth analysis ch 6: annual equivalence
TRANSCRIPT

Part II: Evaluating business & engineering assets
Ch 5: Present worth analysis
Ch 6: Annual equivalence analysis
Ch 7: Rate-of-return analysis

Net present worth measure
Principle: Compute the equivalent net surplus at n = 0 for a given interest rate of i.
Decision rule: Accept the project if the net surplus is positive.
2 3 4 50 1
inflow
outflow
0PW(i)inflow
PW(i)outflow
net surplus
PW(i) > 0
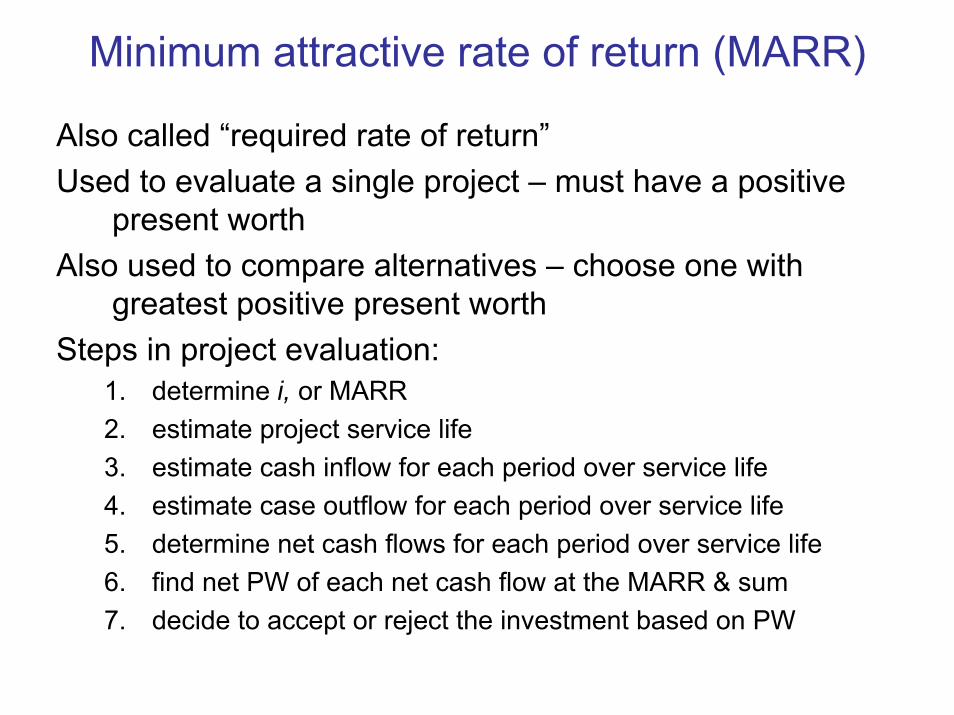
Minimum attractive rate of return (MARR)
Also called “required rate of return”Used to evaluate a single project – must have a positive
present worthAlso used to compare alternatives – choose one with
greatest positive present worthSteps in project evaluation:
1. determine i, or MARR2. estimate project service life3. estimate cash inflow for each period over service life4. estimate case outflow for each period over service life5. determine net cash flows for each period over service life6. find net PW of each net cash flow at the MARR & sum7. decide to accept or reject the investment based on PW
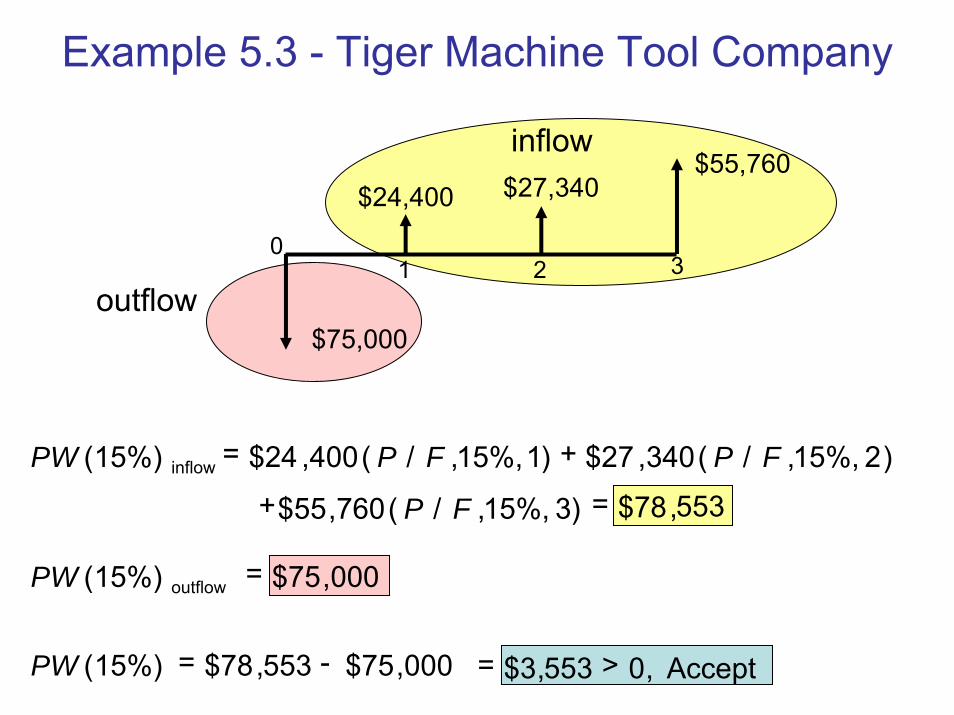
Example 5.3 - Tiger Machine Tool Company
$75,000
$24,400 $27,340$55,760
01 2 3
inflow
outflow
PW (15%) inflow P F P F$24 , ( / , ) $27 , ( / , )400 15%,1 340 15%, 2= +
760$55 P F, ( / , )15%, 3+ $78,553=
PW ( $75,15%) 000outflow =
PW ( $78, $75,15%) 553 000= - $3, ,553 0 Accept= >

Excel solution – example 5.3
Net present value
Year Cash flow PW
0 -75,000 -75,000
1 24,400 21,217
2 27,340 20,673
3 55,760 36,663
Sum 32,500 3,553
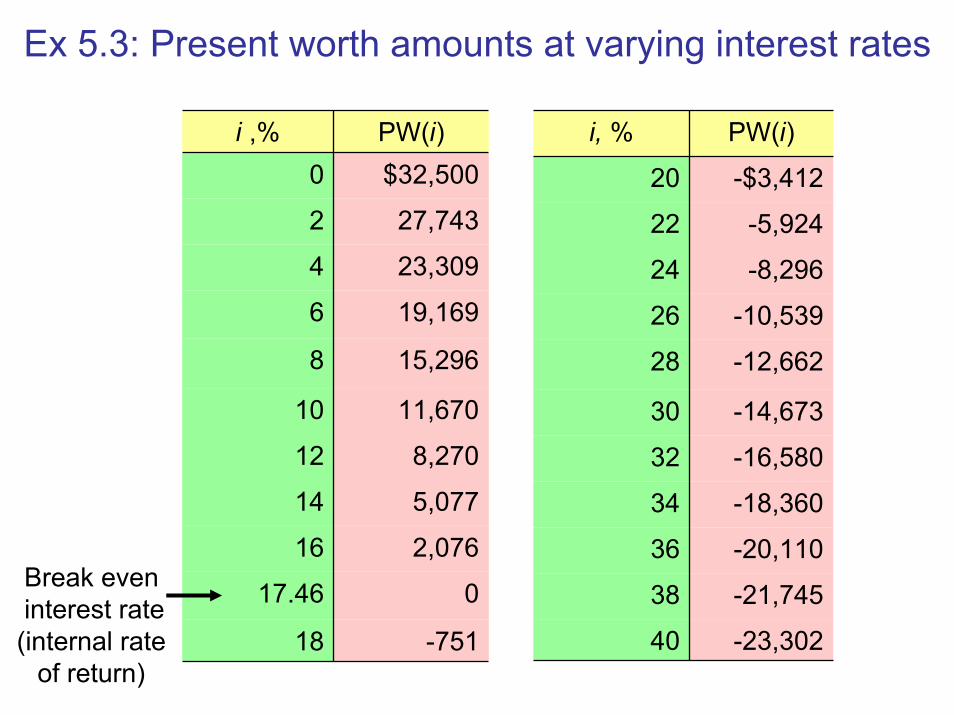
Ex 5.3: Present worth amounts at varying interest rates
i ,% PW(i)0 $32,500
2 27,743
4 23,309
6 19,169
8 15,296
10 11,670
12 8,270
14 5,077
16 2,076
17.46 0
18 -751
i, % PW(i)
20 -$3,412
22 -5,924
24 -8,296
26 -10,539
28 -12,662
30 -14,673
32 -16,580
34 -18,360
36 -20,110
38 -21,745
40 -23,302
Break even interest rate
(internal rate of return)

Present worth profile
40
$3553 17.46%
Break even interest rate(or rate of return)
Accept Reject30
20
PW
(i) (
$ th
ousa
nds) 10
0
-10
-20
-300 5 10 15 20 25 30 35 40
i = MARR (%)

Future worth criterionGiven: cash flows & MARR (i)Find: net equivalent worth at
end of project life
$75,000
$24,400 $27,340$55,760
01 2 3
project life
Should the firm leave the $75,000 in its investment pool to earn 15% over 3 years?
$75,000(F/P,15,3) = $114,066
Or should the firm invest the $75,000 in the project?
$24,400(F/P,15,2) + $27,340(F/P,15,1) + $55,760(F/P,15,0) = $119,470
Note: $5,404(P/F,15,3) = $3,553Net future worth: $119,470 - $114,066 = $5,404

Meaning of net present worth
$75,000
$24,400$27,340
$55,760
Investment pool How much would you have after 3 years if the Investment is made?
$119,470
0 1 2 3Project
Return
to investment pool How much would you have if the investment was not made?
$114,066
What is the net gain from the investment?
$5,404
There is a return of $5,404 to investment pool, above the 15% interest
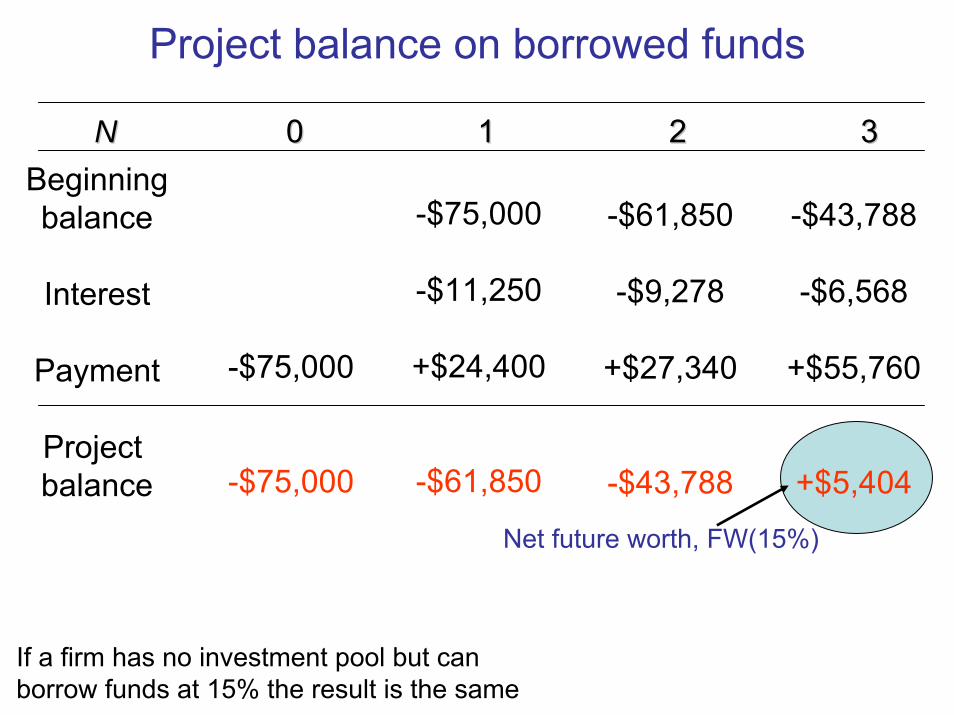
Project balance on borrowed funds
NN 00 11 22 33Beginningbalance
Interest
Payment
Project balance
-$75,000
-$75,000
-$75,000
-$11,250
+$24,400
-$61,850
-$61,850
-$9,278
+$27,340
-$43,788
-$43,788
-$6,568
+$55,760
+$5,404
Net future worth, FW(15%)
If a firm has no investment pool but can borrow funds at 15% the result is the same
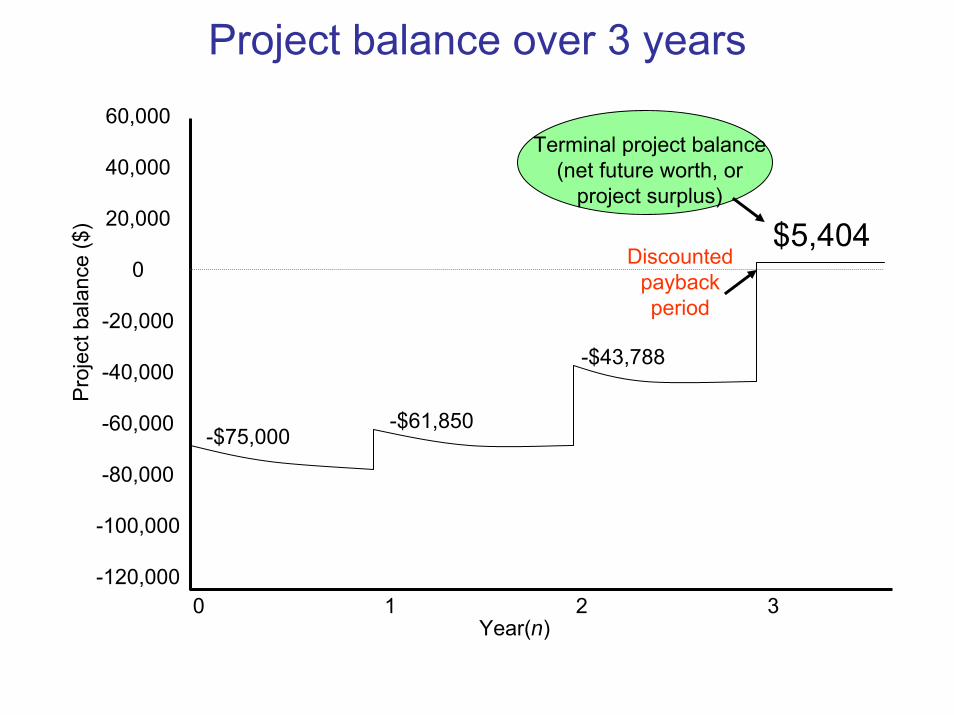
Project balance over 3 years60,000
40,000
20,000
0
-20,000
-40,000
-60,000
-80,000
-100,000
-120,0000 1 2 3
-$75,000-$61,850
-$43,788
$5,404
Year(n)
Terminal project balance(net future worth, or
project surplus)
Discounted payback period
Pro
ject
bal
ance
($)
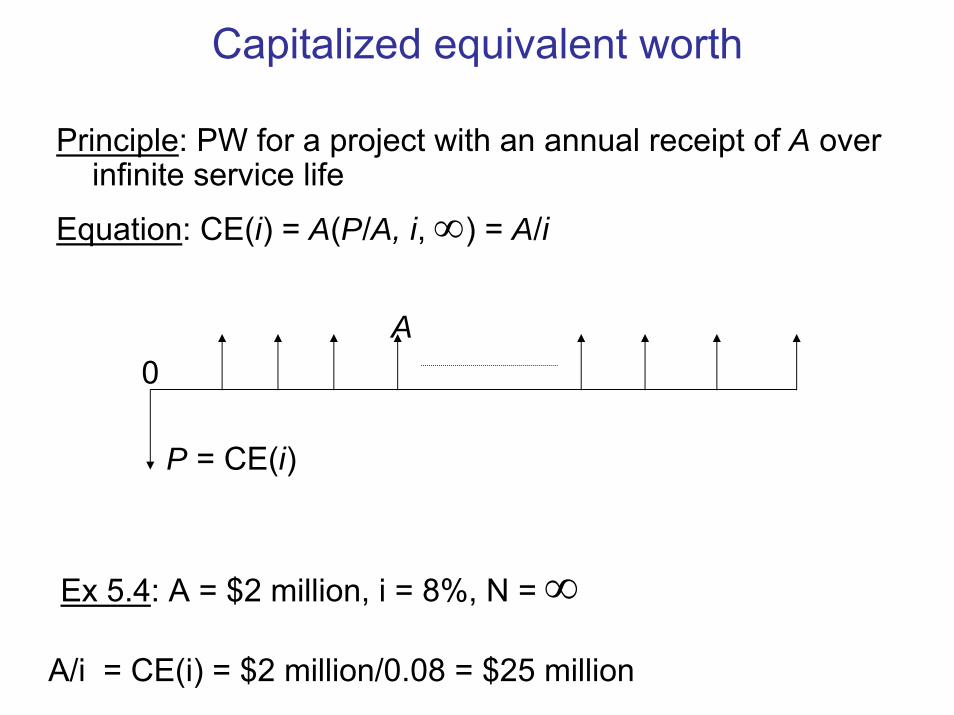
Capitalized equivalent worth
Principle: PW for a project with an annual receipt of A over infinite service life
Equation: CE(i) = A(P/A, i, ∞) = A/i
A0
P = CE(i)
Ex 5.4: A = $2 million, i = 8%, N = ∞
A/i = CE(i) = $2 million/0.08 = $25 million
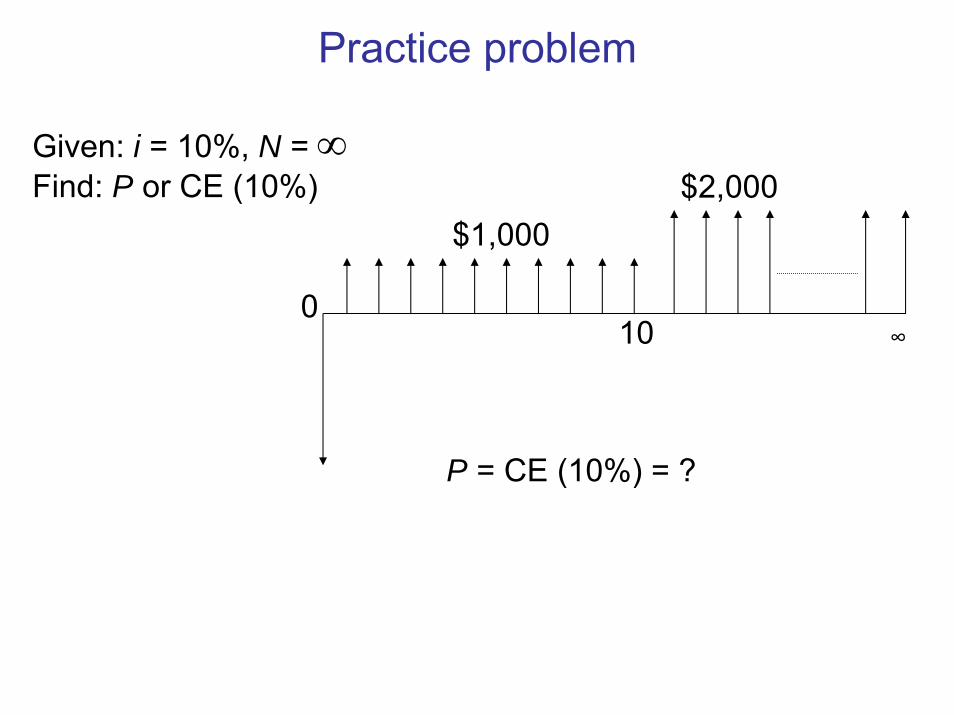
Practice problem
$2,000
10
$1,000
0
Given: i = 10%, N = ∞Find: P or CE (10%)
∞
P = CE (10%) = ?
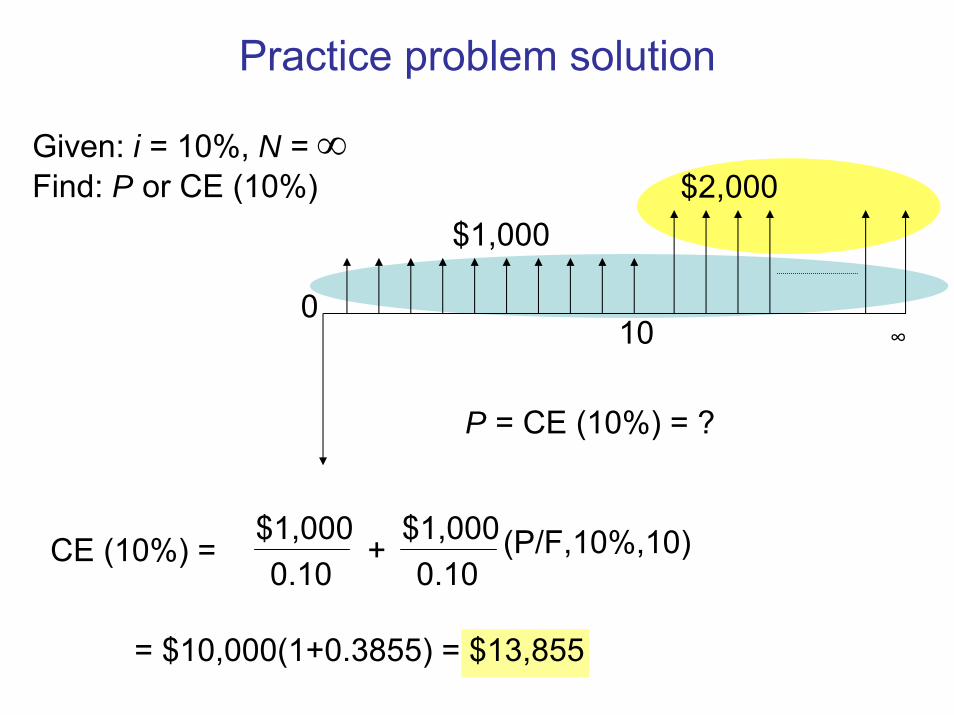
Practice problem solution
10
$1,000$2,000
0
Given: i = 10%, N = ∞Find: P or CE (10%)
∞
P = CE (10%) = ?
CE (10%) =$1,0000.10
$1,0000.10
+ (P/F,10%,10)
= $10,000(1+0.3855) = $13,855

Bridge construction projectConstruction cost = $2,000,000Annual maintenance cost = $50,000Renovation cost = $500,000 every 15 yearsPlanning horizon = infinite periodInterest rate = 5%
$500,000 $500,000 $500,000 $500,000
$2,000,000
$50,000
0 15 30 45 60Years
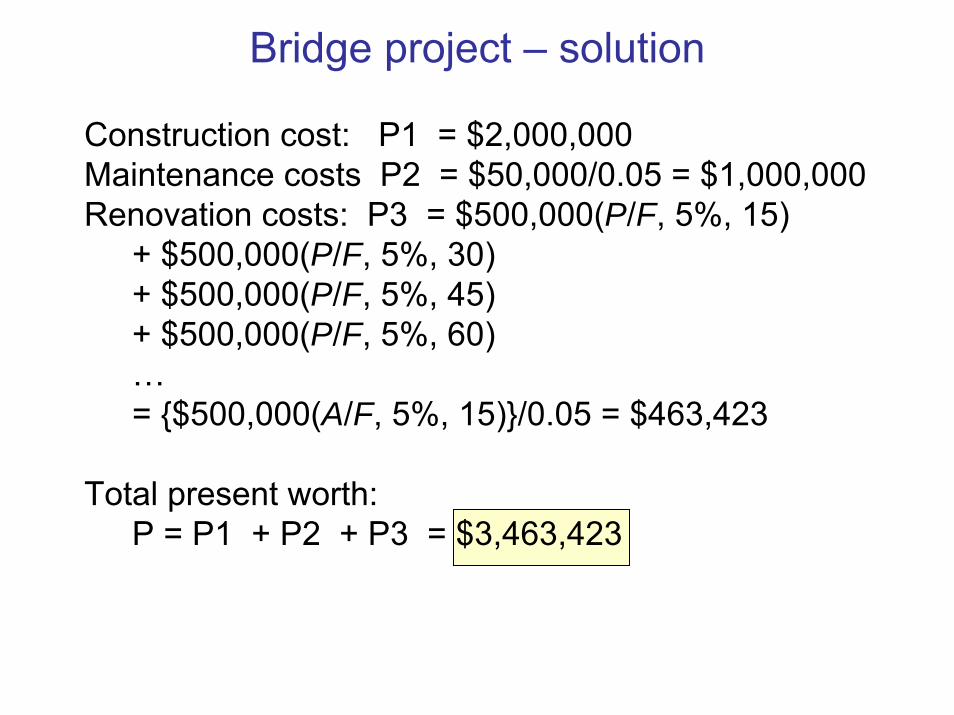
Bridge project – solution
Construction cost: P1 = $2,000,000Maintenance costs P2 = $50,000/0.05 = $1,000,000Renovation costs: P3 = $500,000(P/F, 5%, 15)
+ $500,000(P/F, 5%, 30)+ $500,000(P/F, 5%, 45)+ $500,000(P/F, 5%, 60)…= {$500,000(A/F, 5%, 15)}/0.05 = $463,423
Total present worth: P = P1 + P2 + P3 = $3,463,423

Alternate way to calculate P3
Concept: Find the effective interest rate per payment period
Effective interest rate for a 15-year cycle i = (1 + 0.05)15 - 1 = 107.893%
Capitalized equivalent worth P3 = $500,000/1.07893 = $463,423
150
$500,000
30 45 60
$500,000 $500,000 $500,000

Practice problem – electric motor
Want to purchase an electrical motor rated at 15 HP for $1,000.
The service life of the motor is known to be 10 years with negligible salvage value.
Its full load efficiency is 85%.The cost of energy is $0.08 per kwh.The intended use of the motor is 4,000 hours per year.Find the total cost of owning and operating the motor at
10% interest.

Solution – electric motor
1 HP = 0.7457 kW
15 HP = 150 × 7457 = 11.1855 kW
Required input power at 85% efficiency rating:
= 13.1594 kW11.18550.85
kW
Required total kWh per year13.1594 kW × 4,000 hr/yr = 52,638 kWh/yr
Total annual energy cost to operate the motor52,638 kWh × $0.08/kWh = $4,211/yr
Total cost of owning and operating the motorPW(10%) = $1,000 + $4,211(P/A,10%,10) = $26,875

0 1 2 3 4 5 6 7 8 9 10
$4,211
$1,000
PW(10%) = $1,000 + $4,211(P/A,10%,10) = $26,875

Comparing mutually exclusive projects (alternatives)
PrinciplePrinciple: projects must be compared over an equal time : projects must be compared over an equal time spanspan
Rule of thumbRule of thumb: If the required service period is given, the : If the required service period is given, the analysis period should be the sameanalysis period should be the same
Analysis period: time span over which the economic effects of an investment will be evaluated (study period or planning horizon)
Required service period: time span over which the service of an equipment (or investment) will be needed
Do nothing is an alternative!
Revenue projects: projects whose revenues depend on the choice of alternatives – maximize PW
Service projects: projects whose revenues do not depend on the choice of alternative – minimize PW

Case 1: analysis period equals project lives
Compute the PW for each project over its life
$1,400$2,075
$2,110
$450$600
$5000
$1,000A B$4,000
PW (10%)A = $283 PW (10%)B = $579

$1,000
$450$600
$500
Project A
$1,000
$600$500$450
$3,000
3,993
$4,000
$1,400
$2,075
$2,110
Project B
Comparing projects requiring different levels of investment – assume that theunused funds will be invested at MARR.
PW(10%)A = $283PW(10%)B = $579
This portionof investmentwill earn 10%return on investment.
ModifiedProject A
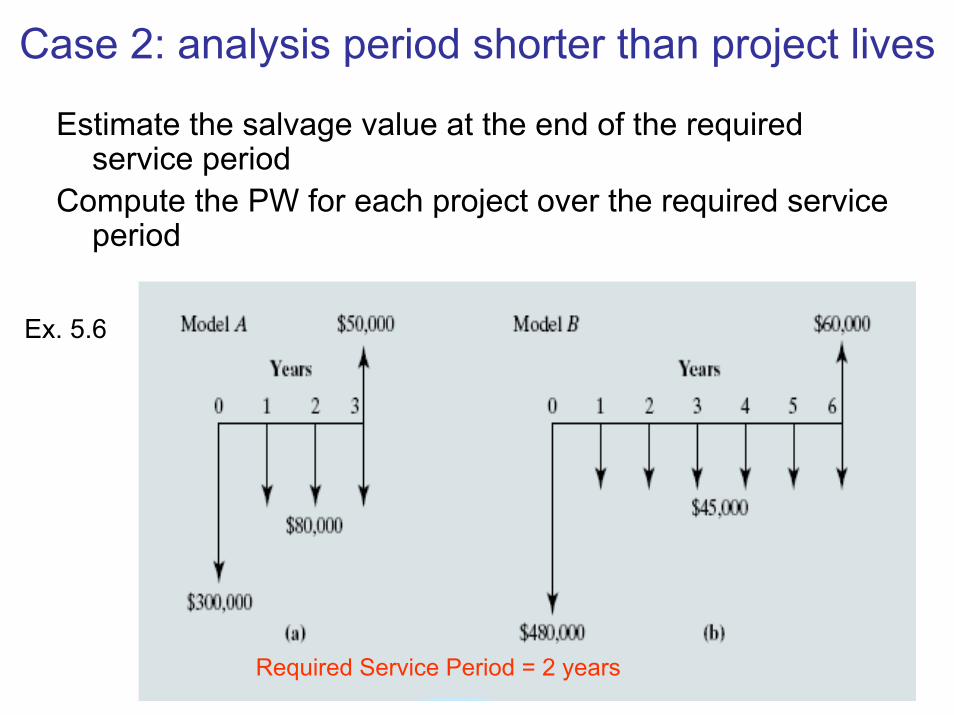
Case 2: analysis period shorter than project lives
Estimate the salvage value at the end of the required service period
Compute the PW for each project over the required service period
Required Service Period = 2 years
Ex. 5.6

PW(15%)B = -$364,000PW(15%)A = -$362,000
Ex. 5.6
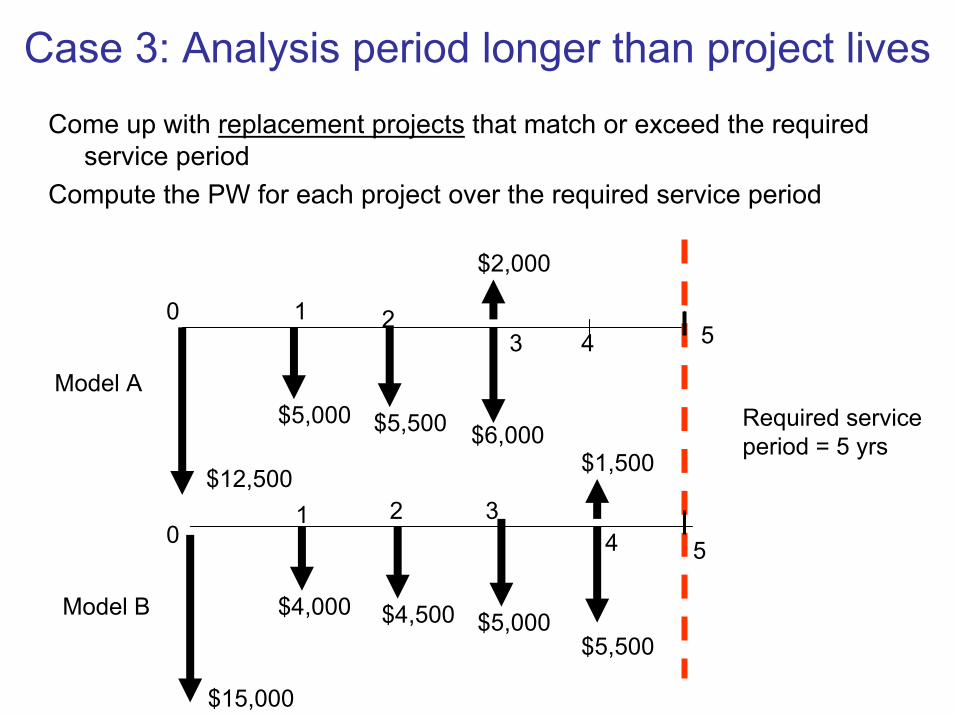
Case 3: Analysis period longer than project lives
Come up with replacement projects that match or exceed the required service period
Compute the PW for each project over the required service period
Required service period = 5 yrs
Model A
Model B
$15,000
$12,500
$4,000 $4,500 $5,000$5,500
$1,500
$5,000 $5,500 $6,000
$2,000
40 1 2
3
1 2 34
5
05
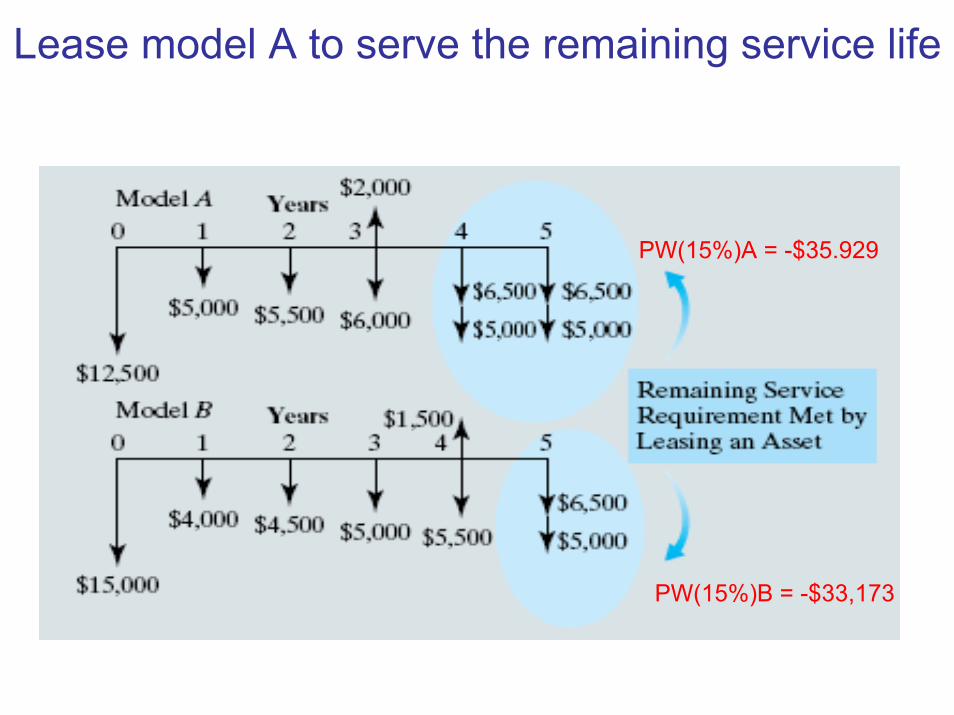
Lease model A to serve the remaining service life
PW(15%)A = -$35.929
PW(15%)B = -$33,173
Summary – vocabulary
Present worth is an equivalence method of analysis in which a project’s cash flows are discounted to a lump sum amount at present time.
The MARR or minimum attractive rate of return is the interest rate at which a firm can always earn or borrow money.
MARR is generally dictated by management and is the rate at which NPW analysis should be conducted.
Two measures of investment, the net future worth and the capitalized equivalent worth, are variations to the NPW criterion.
The term mutually exclusive means that, when one of several alternatives that meet the same need is selected, the others will be rejected.

Summary – vocabulary (cont.)
Revenue projects are those for which the income generated depends on the choice of project.
Service projects are those for which income remains the same, regardless of which project is selected.
The analysis period (study period) is the time span over which the economic effects of an investment will be evaluated.
The required service period is the time span over which the service of an equipment (or investment) will be needed.
The analysis period should be chosen to cover the required service period.
When not specified by management or company policy, the analysis period to use in a comparison of mutually exclusive projects may be chosen by an individual analyst.