ch 1. whatÕs vis, and why do it? ch 2. what: data abstraction
TRANSCRIPT

http://www.cs.ubc.ca/~tmm/courses/547-17F
Ch 1/2/3: Intro, Data, Tasks Paper: Design Study Methodology
Tamara Munzner Department of Computer ScienceUniversity of British Columbia
CPSC 547, Information VisualizationWeek 2: 19 September 2017
News
• Canvas comments/question discussion–one question/comment per reading required
• some did this, others did not• do clearly indicate what’s what
–many of you could be more concise/compact–few responses to others
• original requirement of 2, considering cutback to just 1• decision: only 1 response is required
–if you spot typo in book, let me know if it’s not already in errata list• http://www.cs.ubc.ca/~tmm/vadbook/errata.html• (but don’t count it as a question)• not useful to tell me about typos in published papers
2
Ch 1. What’s Vis, and Why Do It?
3
Why have a human in the loop?
• don’t need vis when fully automatic solution exists and is trusted
• many analysis problems ill-specified– don’t know exactly what questions to ask in advance
• possibilities– long-term use for end users (e.g. exploratory analysis of scientific data)– presentation of known results – stepping stone to better understanding of requirements before developing models– help developers of automatic solution refine/debug, determine parameters– help end users of automatic solutions verify, build trust 4
Computer-based visualization systems provide visual representations of datasets designed to help people carry out tasks more effectively.
Visualization is suitable when there is a need to augment human capabilities rather than replace people with computational decision-making methods.
Why use an external representation?
• external representation: replace cognition with perception
5
Computer-based visualization systems provide visual representations of datasets designed to help people carry out tasks more effectively.
[Cerebral: Visualizing Multiple Experimental Conditions on a Graph with Biological Context. Barsky, Munzner, Gardy, and Kincaid. IEEE TVCG (Proc. InfoVis) 14(6):1253-1260, 2008.]
Why represent all the data?
• summaries lose information, details matter – confirm expected and find unexpected patterns– assess validity of statistical model
6
Identical statisticsx mean 9x variance 10y mean 7.5y variance 3.75x/y correlation 0.816
Anscombe’s Quartet
Computer-based visualization systems provide visual representations of datasets designed to help people carry out tasks more effectively.
https://www.youtube.com/watch?v=DbJyPELmhJc
Same Stats, Different Graphs
Why focus on tasks and effectiveness?
• tasks serve as constraint on design (as does data)– idioms do not serve all tasks equally!– challenge: recast tasks from domain-specific vocabulary to abstract forms
• most possibilities ineffective– validation is necessary, but tricky– increases chance of finding good solutions if you understand full space of possibilities
• what counts as effective?– novel: enable entirely new kinds of analysis – faster: speed up existing workflows
7
Computer-based visualization systems provide visual representations of datasets designed to help people carry out tasks more effectively.
Why are there resource limitations?
• computational limits– processing time– system memory
• human limits– human attention and memory
• display limits– pixels are precious resource, the most constrained resource
– information density: ratio of space used to encode info vs unused whitespace• tradeoff between clutter and wasting space, find sweet spot between dense and sparse
8
Vis designers must take into account three very different kinds of resource limitations: those of computers, of humans, and of displays.
Analysis: What, why, and how
• what is shown?– data abstraction
• why is the user looking at it?– task abstraction
• how is it shown?– idiom: visual encoding and interaction
• abstract vocabulary avoids domain-specific terms– translation process iterative, tricky
• what-why-how analysis framework as scaffold to think systematically about design space
9
Why analyze?• imposes structure on huge design
space–scaffold to help you think
systematically about choices–analyzing existing as stepping stone
to designing new–most possibilities ineffective for
particular task/data combination
10
[SpaceTree: Supporting Exploration in Large Node Link Tree, Design Evolution and Empirical Evaluation. Grosjean, Plaisant, and Bederson. Proc. InfoVis 2002, p 57–64.]
SpaceTree
[TreeJuxtaposer: Scalable Tree Comparison Using Focus+Context With Guaranteed Visibility. ACM Trans. on Graphics (Proc. SIGGRAPH) 22:453– 462, 2003.]
TreeJuxtaposer
Present Locate Identify
Path between two nodes
Actions
Targets
SpaceTree
TreeJuxtaposer
Encode Navigate Select Filter AggregateTree
Arrange
Why? What? How?
Encode Navigate Select
11
Encode
ArrangeExpress Separate
Order Align
Use
Map
Color
Motion
Size, Angle, Curvature, ...
Hue Saturation Luminance
Shape
Direction, Rate, Frequency, ...
from categorical and ordered attributes
Manipulate Facet Reduce
Change
Select
Navigate
Juxtapose
Partition
Superimpose
Filter
Aggregate
Embed
How?
Encode Manipulate Facet ReduceVAD Ch 2: Data Abstraction
12[VAD Fig 2.1]
Datasets
What?Attributes
Dataset Types
Data Types
Data and Dataset Types
Tables
Attributes (columns)
Items (rows)
Cell containing value
Networks
Link
Node (item)
Trees
Fields (Continuous)
Geometry (Spatial)
Attributes (columns)
Value in cell
Cell
Multidimensional Table
Value in cell
Items Attributes Links Positions Grids
Attribute Types
Ordering Direction
Categorical
OrderedOrdinal
Quantitative
Sequential
Diverging
Cyclic
Tables Networks & Trees
Fields Geometry Clusters, Sets, Lists
Items
Attributes
Items (nodes)
Links
Attributes
Grids
Positions
Attributes
Items
Positions
Items
Grid of positions
Position
Why?
How?
What?
Ch 2. What: Data Abstraction
13
Three major datatypes
14
Node (item)
Fields (Continuous)
Attributes (columns)
Value in cell
Cell
Grid of positions
Geometry (Spatial)
Position
SpatialNetworksTables
Attributes (columns)
Items (rows)
Cell containing value
Dataset Types
Multidimensional Table
Value in cell
Networks
Link
Node (item)
Trees
• visualization vs computer graphics–geometry is design decision
15
Attribute types
Attribute Types
Ordering Direction
Categorical Ordered
Ordinal Quantitative
Sequential Diverging Cyclic
Dataset and data types
16
Dataset Availability
Static Dynamic
Data Types
Items Attributes Links Positions Grids
Data and Dataset Types
Tables Networks & Trees
Fields Geometry Clusters, Sets, Lists
Items
Attributes
Items (nodes)
Links
Attributes
Grids
Positions
Attributes
Items
Positions
Items

Further reading: Articles• Mathematics and the Internet: A Source of Enormous Confusion and Great
Potential. Walter Willinger, David Alderson, and John C. Doyle. Notices of the AMS 56(5):586-599, 2009.
• Rethinking Visualization: A High-Level Taxonomy. InfoVis 2004, p 151-158, 2004.• The Eyes Have It: A Task by Data Type Taxonomy for Information Visualizations Ben
Shneiderman, Proc. 1996 IEEE Visual Languages• The Structure of the Information Visualization Design Space. Stuart Card and Jock
Mackinlay, Proc. InfoVis 97.• Polaris: A System for Query, Analysis and Visualization of Multi-dimensional
Relational Databases. Chris Stolte, Diane Tang and Pat Hanrahan, IEEE TVCG 8(1):52-65 2002.
17
Further reading: Books• Visualization Analysis and Design. Munzner. CRC Press, 2014.
–Chap 2: Data Abstraction
• Information Visualization: Using Vision to Think. Stuart Card, Jock Mackinlay, and Ben Shneiderman.–Chap 1
• Data Visualization: Principles and Practice, 2nd ed. Alexandru Telea, CRC Press, 2014.
• Interactive Data Visualization: Foundations, Techniques, and Applications, 2nd ed. Matthew O. Ward, Georges Grinstein, Daniel Keim. CRC Press, 2015.
• The Visualization Handbook. Charles Hansen and Chris Johnson, eds. Academic Press, 2004.
• Visualization Toolkit: An Object-Oriented Approach to 3D Graphics, 4th ed. Will Schroeder, Ken Martin, and Bill Lorensen. Kitware 2006.
• Visualization of Time-Oriented Data. Wolfgang Aigner, Silvia Miksch, Heidrun Schumann, Chris Tominski. Springer 2011.
18
VAD Ch 3: Task Abstraction
19[VAD Fig 3.1]
Trends
Actions
Analyze
Search
Query
Why?
All Data
Outliers Features
Attributes
One ManyDistribution Dependency Correlation Similarity
Network Data
Spatial DataShape
Topology
Paths
Extremes
ConsumePresent EnjoyDiscover
ProduceAnnotate Record Derive
Identify Compare Summarize
tag
Target known Target unknown
Location knownLocation unknown
Lookup
Locate
Browse
Explore
Targets
Why?
How?
What?
• {action, target} pairs–discover distribution
–compare trends
–locate outliers
–browse topology
20
High-level actions: Analyze• consume
–discover vs present• classic split
• aka explore vs explain
–enjoy• newcomer• aka casual, social
• produce–annotate, record–derive
• crucial design choice
Analyze
ConsumePresent EnjoyDiscover
ProduceAnnotate Record Derive
tag
Derive
• don’t just draw what you’re given!–decide what the right thing to show is–create it with a series of transformations from the original dataset–draw that
• one of the four major strategies for handling complexity
21Original Data
exports
imports
Derived Data
trade balance = exports − imports
trade balance
22
Actions: Mid-level search, low-level query
• what does user know?–target, location
• how much of the data matters?–one, some, all
• independent choices, mix & match–analyze, query, search
Search
Query
Identify Compare Summarize
Target known Target unknown
Location known
Location unknown
Lookup
Locate
Browse
Explore
Targets
23
Trends
All Data
Outliers Features
Attributes
One ManyDistribution Dependency Correlation Similarity
Extremes
Network Data
Spatial DataShape
Topology
Paths
Analysis example: Compare idioms
24
[SpaceTree: Supporting Exploration in Large Node Link Tree, Design Evolution and Empirical Evaluation. Grosjean, Plaisant, and Bederson. Proc. InfoVis 2002, p 57–64.]
SpaceTree
[TreeJuxtaposer: Scalable Tree Comparison Using Focus+Context With Guaranteed Visibility. ACM Trans. on Graphics (Proc. SIGGRAPH) 22:453– 462, 2003.]
TreeJuxtaposer
Present Locate Identify
Path between two nodes
Actions
Targets
SpaceTree
TreeJuxtaposer
Encode Navigate Select Filter AggregateTree
Arrange
Why? What? How?
Encode Navigate Select
Analysis example: Derive one attribute
25
[Using Strahler numbers for real time visual exploration of huge graphs. Auber. Proc. Intl. Conf. Computer Vision and Graphics, pp. 56–69, 2002.]
• Strahler number– centrality metric for trees/networks
– derived quantitative attribute
– draw top 5K of 500K for good skeleton
Task 1
.58
.54
.64
.84
.24
.74
.64.84
.84
.94
.74
OutQuantitative attribute on nodes
.58
.54
.64
.84
.24
.74
.64.84
.84
.94
.74
InQuantitative attribute on nodes
Task 2
Derive
Why?What?
In Tree ReduceSummarize
How?Why?What?
In Quantitative attribute on nodes TopologyIn Tree
Filter
InTree
OutFiltered TreeRemoved unimportant parts
InTree +
Out Quantitative attribute on nodes Out Filtered Tree
Chained sequences
26
• output of one is input to next– express dependencies– separate means from ends
joint work with:
Reflections from the Trenches and from the Stacks
Sedlmair, Meyer, Munzner. IEEE Trans. Visualization and Computer Graphics 18(12): 2431-2440, 2012 (Proc. InfoVis 2012).
Design Study Methodology
Michael Sedlmair, Miriah Meyer
http://www.cs.ubc.ca/labs/imager/tr/2012/dsm/
Design Study Methodology: Reflections from the Trenches and from the Stacks.
27
Design Studies: Lessons learned after 21 of them
MizBeegenomics
Car-X-Rayin-car networks
Cerebralgenomics
RelExin-car networks
AutobahnVisin-car networks
QuestVissustainability
LiveRACserver hosting
Pathlinegenomics
SessionViewerweb log analysis
PowerSetViewerdata mining
MostVisin-car networks
Constellationlinguistics
Caidantsmulticast
Vismonfisheries management
ProgSpy2010in-car networks
WiKeVisin-car networks
Cardiogramin-car networks
LibViscultural heritage
MulteeSumgenomics
LastHistorymusic listening
VisTrain-car networks
• commonality of representations cross-cuts domains! 28
Methodology
29
Methods Methodology
ingredients
recipes
Methodology for problem-driven work
• definitions
• 9-stage framework
• 32 pitfalls & how to avoid them
• comparison to related methodologies
INFORMATION LOCATION computerhead
TASK
CLA
RITY
fuzz
ycrisp
NO
T EN
OU
GH
DAT
A
DESIGN STUDY METHODOLOGY SUITABLE
ALGORITHM AUTOMATION
POSSIBLE
PRECONDITIONpersonal validation
COREinward-facing validation
ANALYSISoutward-facing validation
learn implementwinnow cast discover design deploy reflect write
30
alization researcher to explain hard-won knowledge about the domainto the readers is understandable, it is usually a better choice to putwriting effort into presenting extremely clear abstractions of the taskand data. Design study papers should include only the bare minimumof domain knowledge that is required to understand these abstractions.We have seen many examples of this pitfall as reviewers, and we con-tinue to be reminded of it by reviewers of our own paper submissions.We fell headfirst into it ourselves in a very early design study, whichwould have been stronger if more space had been devoted to the ra-tionale of geography as a proxy for network topology, and less to theintricacies of overlay network configuration and the travails of map-ping IP addresses to geographic locations [53].
Another challenge is to construct an interesting and useful storyfrom the set of events that constitute a design study. First, the re-searcher must re-articulate what was unfamiliar at the start of the pro-cess but has since become internalized and implicit. Moreover, theorder of presentation and argumentation in a paper should follow alogical thread that is rarely tied to the actual chronology of events dueto the iterative and cyclical nature of arriving at full understanding ofthe problem (PF-31). A careful selection of decisions made, and theirjustification, is imperative for narrating a compelling story about a de-sign study and are worth discussing as part of the reflections on lessonslearned. In this spirit, writing a design study paper has much in com-mon with writing for qualitative research in the social sciences. Inthat literature, the process of writing is seen as an important researchcomponent of sense-making from observations gathered in field work,above and beyond merely being a reporting method [62, 93].
In technique-driven work, the goal of novelty means that there is arush to publish as soon as possible. In problem-driven work, attempt-ing to publish too soon is a common mistake, leading to a submissionthat is shallow and lacks depth (PF-32). We have fallen prey to this pit-fall ourselves more than once. In one case, a design study was rejectedupon first submission, and was only published after significantly morework was completed [10]; in retrospect, the original submission waspremature. In another case, work that we now consider preliminarywas accepted for publication [78]. After publication we made furtherrefinements of the tool and validated the design with a field evaluation,but these improvements and findings did not warrant a full second pa-per. We included this work as a secondary contribution in a later paperabout lessons learned across many projects [76], but in retrospect weshould have waited to submit until later in the project life cycle.
It is rare that another group is pursuing exactly the same goal giventhe enormous number of possible data and task combinations. Typi-cally a design requires several iterations before it is as effective as pos-sible, and the first version of a system most often does not constitute aconclusive contribution. Similarly, reflecting on lessons learned fromthe specific situation of study in order to derive new or refined gen-eral guidelines typically requires an iterative process of thinking andwriting. A challenge for researchers who are familiar with technique-driven work and who want to expand into embracing design studies isthat the mental reflexes of these two modes of working are nearly op-posite. We offer a metaphor that technique-driven work is like runninga footrace, while problem-driven work is like preparing for a violinconcert: deciding when to perform is part of the challenge and theprimary hazard is halting before one’s full potential is reached, as op-posed to the challenge of reaching a defined finish line first.
5 COMPARING METHODOLOGIES
Design studies involve a significant amount of qualitative field work;we now compare design study methodolgy to influential methodolo-gies in HCI with similar qualitative intentions. We also use the ter-minology from these methodologies to buttress a key claim on how tojudge design studies: transferability is the goal, not reproducibility.
Ethnography is perhaps the most widely discussed qualitative re-search methodology in HCI [16, 29, 30]. Traditional ethnography inthe fields of anthropology [6] and sociology [81] aims at building arich picture of a culture. The researcher is typically immersed formany months or even years to build up a detailed understanding of lifeand practice within the culture using methods that include observation
PF-1 premature advance: jumping forward over stages generalPF-2 premature start: insufficient knowledge of vis literature learnPF-3 premature commitment: collaboration with wrong people winnowPF-4 no real data available (yet) winnowPF-5 insufficient time available from potential collaborators winnowPF-6 no need for visualization: problem can be automated winnowPF-7 researcher expertise does not match domain problem winnowPF-8 no need for research: engineering vs. research project winnowPF-9 no need for change: existing tools are good enough winnowPF-10 no real/important/recurring task winnowPF-11 no rapport with collaborators winnowPF-12 not identifying front line analyst and gatekeeper before start castPF-13 assuming every project will have the same role distribution castPF-14 mistaking fellow tool builders for real end users castPF-15 ignoring practices that currently work well discoverPF-16 expecting just talking or fly on wall to work discoverPF-17 experts focusing on visualization design vs. domain problem discoverPF-18 learning their problems/language: too little / too much discoverPF-19 abstraction: too little designPF-20 premature design commitment: consideration space too small designPF-21 mistaking technique-driven for problem-driven work designPF-22 nonrapid prototyping implementPF-23 usability: too little / too much implementPF-24 premature end: insufficient deploy time built into schedule deployPF-25 usage study not case study: non-real task/data/user deployPF-26 liking necessary but not sufficient for validation deployPF-27 failing to improve guidelines: confirm, refine, reject, propose reflectPF-28 insufficient writing time built into schedule writePF-29 no technique contribution 6= good design study writePF-30 too much domain background in paper writePF-31 story told chronologically vs. focus on final results writePF-32 premature end: win race vs. practice music for debut write
Table 1. Summary of the 32 design study pitfalls that we identified.
and interview; shedding preconceived notions is a tactic for reachingthis goal. Some of these methods have been adapted for use in HCI,however under a very different methodological umbrella. In thesefields the goal is to distill findings into implications for design, requir-ing methods that quickly build an understanding of how a technologyintervention might improve workflows. While some sternly critiquethis approach [20, 21], we are firmly in the camp of authors such asRogers [64, 65] who argues that goal-directed fieldwork is appropri-ate when it is neither feasible nor desirable to capture everything, andMillen who advocates rapid ethnography [47]. This stand implies thatour observations will be specific to visualization and likely will not behelpful in other fields; conversely, we assert that an observer without avisualization background will not get the answers needed for abstract-ing the gathered information into visualization-compatible concepts.
The methodology of grounded theory emphasizes building an un-derstanding from the ground up based on careful and detailed anal-ysis [14]. As with ethnography, we differ by advocating that validprogress can be made with considerably less analysis time. Althoughearly proponents [87] cautioned against beginning the analysis pro-cess with preconceived notions, our insistence that visualization re-searchers must have a solid foundation in visualization knowledgealigns better with more recent interpretations [25] that advocate bring-ing a prepared mind to the project, a call echoed by others [63].
Many aspects of the action research (AR) methodology [27] alignwith design study methodology. First is the idea of learning throughaction, where intervention in the existing activities of the collabora-tive research partner is an explicit aim of the research agenda, andprolonged engagement is required. A second resonance is the identifi-cation of transferability rather than reproducability as the desired out-come, as the aim is to create a solution for a specific problem. Indeed,our emphasis on abstraction can be cast as a way to “share sufficientknowledge about a solution that it may potentially be transferred toother contexts” [27]. The third key idea is that personal involvementof the researcher is central and desirable, rather than being a dismayingincursion of subjectivity that is a threat to validity; van Wijk makes the
Design studies: problem-driven vis research
• a specific real-world problem–real users and real data,–collaboration is (often) fundamental
• design a visualization system–implications: requirements, multiple ideas
• validate the design–at appropriate levels
• reflect about lessons learned–transferable research: improve design guidelines for vis in general
• confirm, refine, reject, propose
31
Design study methodology: definitions
32
INFORMATION LOCATION computerhead
TASK
CLA
RITY
fuzz
ycrisp
NO
T EN
OU
GH
DAT
A
DESIGN STUDY METHODOLOGY SUITABLE
ALGORITHM AUTOMATION
POSSIBLE

9 stage framework
PRECONDITION CORE ANALYSIS
learn implementwinnow cast discover design deploy reflect write
33
9-stage framework learn winnow
cast
ANALYSIS
reflect write
CORE
implementdiscover design deploylearn winnow cast
PRECONDITION
learn winnow cast
34
9-stage framework
PRECONDITION ANALYSIS
reflect write
CORE
implementdiscover design deploylearn winnow cast
discover design
implement deploy
35
9-stage framework
• guidelines: confirm, refine, reject, propose
reflect write
PRECONDITION ANALYSIS
reflect write
CORE
implementdiscover design deploylearn winnow cast
36
9-stage framework
PRECONDITION ANALYSIS
reflect write
CORE
implementdiscover design deploylearn winnow cast
iterative
37
Design study methodology: 32 pitfalls
• and how to avoid them
38
alization researcher to explain hard-won knowledge about the domainto the readers is understandable, it is usually a better choice to putwriting effort into presenting extremely clear abstractions of the taskand data. Design study papers should include only the bare minimumof domain knowledge that is required to understand these abstractions.We have seen many examples of this pitfall as reviewers, and we con-tinue to be reminded of it by reviewers of our own paper submissions.We fell headfirst into it ourselves in a very early design study, whichwould have been stronger if more space had been devoted to the ra-tionale of geography as a proxy for network topology, and less to theintricacies of overlay network configuration and the travails of map-ping IP addresses to geographic locations [53].
Another challenge is to construct an interesting and useful storyfrom the set of events that constitute a design study. First, the re-searcher must re-articulate what was unfamiliar at the start of the pro-cess but has since become internalized and implicit. Moreover, theorder of presentation and argumentation in a paper should follow alogical thread that is rarely tied to the actual chronology of events dueto the iterative and cyclical nature of arriving at full understanding ofthe problem (PF-31). A careful selection of decisions made, and theirjustification, is imperative for narrating a compelling story about a de-sign study and are worth discussing as part of the reflections on lessonslearned. In this spirit, writing a design study paper has much in com-mon with writing for qualitative research in the social sciences. Inthat literature, the process of writing is seen as an important researchcomponent of sense-making from observations gathered in field work,above and beyond merely being a reporting method [62, 93].
In technique-driven work, the goal of novelty means that there is arush to publish as soon as possible. In problem-driven work, attempt-ing to publish too soon is a common mistake, leading to a submissionthat is shallow and lacks depth (PF-32). We have fallen prey to this pit-fall ourselves more than once. In one case, a design study was rejectedupon first submission, and was only published after significantly morework was completed [10]; in retrospect, the original submission waspremature. In another case, work that we now consider preliminarywas accepted for publication [78]. After publication we made furtherrefinements of the tool and validated the design with a field evaluation,but these improvements and findings did not warrant a full second pa-per. We included this work as a secondary contribution in a later paperabout lessons learned across many projects [76], but in retrospect weshould have waited to submit until later in the project life cycle.
It is rare that another group is pursuing exactly the same goal giventhe enormous number of possible data and task combinations. Typi-cally a design requires several iterations before it is as effective as pos-sible, and the first version of a system most often does not constitute aconclusive contribution. Similarly, reflecting on lessons learned fromthe specific situation of study in order to derive new or refined gen-eral guidelines typically requires an iterative process of thinking andwriting. A challenge for researchers who are familiar with technique-driven work and who want to expand into embracing design studies isthat the mental reflexes of these two modes of working are nearly op-posite. We offer a metaphor that technique-driven work is like runninga footrace, while problem-driven work is like preparing for a violinconcert: deciding when to perform is part of the challenge and theprimary hazard is halting before one’s full potential is reached, as op-posed to the challenge of reaching a defined finish line first.
5 COMPARING METHODOLOGIES
Design studies involve a significant amount of qualitative field work;we now compare design study methodolgy to influential methodolo-gies in HCI with similar qualitative intentions. We also use the ter-minology from these methodologies to buttress a key claim on how tojudge design studies: transferability is the goal, not reproducibility.
Ethnography is perhaps the most widely discussed qualitative re-search methodology in HCI [16, 29, 30]. Traditional ethnography inthe fields of anthropology [6] and sociology [81] aims at building arich picture of a culture. The researcher is typically immersed formany months or even years to build up a detailed understanding of lifeand practice within the culture using methods that include observation
PF-1 premature advance: jumping forward over stages generalPF-2 premature start: insufficient knowledge of vis literature learnPF-3 premature commitment: collaboration with wrong people winnowPF-4 no real data available (yet) winnowPF-5 insufficient time available from potential collaborators winnowPF-6 no need for visualization: problem can be automated winnowPF-7 researcher expertise does not match domain problem winnowPF-8 no need for research: engineering vs. research project winnowPF-9 no need for change: existing tools are good enough winnowPF-10 no real/important/recurring task winnowPF-11 no rapport with collaborators winnowPF-12 not identifying front line analyst and gatekeeper before start castPF-13 assuming every project will have the same role distribution castPF-14 mistaking fellow tool builders for real end users castPF-15 ignoring practices that currently work well discoverPF-16 expecting just talking or fly on wall to work discoverPF-17 experts focusing on visualization design vs. domain problem discoverPF-18 learning their problems/language: too little / too much discoverPF-19 abstraction: too little designPF-20 premature design commitment: consideration space too small designPF-21 mistaking technique-driven for problem-driven work designPF-22 nonrapid prototyping implementPF-23 usability: too little / too much implementPF-24 premature end: insufficient deploy time built into schedule deployPF-25 usage study not case study: non-real task/data/user deployPF-26 liking necessary but not sufficient for validation deployPF-27 failing to improve guidelines: confirm, refine, reject, propose reflectPF-28 insufficient writing time built into schedule writePF-29 no technique contribution 6= good design study writePF-30 too much domain background in paper writePF-31 story told chronologically vs. focus on final results writePF-32 premature end: win race vs. practice music for debut write
Table 1. Summary of the 32 design study pitfalls that we identified.
and interview; shedding preconceived notions is a tactic for reachingthis goal. Some of these methods have been adapted for use in HCI,however under a very different methodological umbrella. In thesefields the goal is to distill findings into implications for design, requir-ing methods that quickly build an understanding of how a technologyintervention might improve workflows. While some sternly critiquethis approach [20, 21], we are firmly in the camp of authors such asRogers [64, 65] who argues that goal-directed fieldwork is appropri-ate when it is neither feasible nor desirable to capture everything, andMillen who advocates rapid ethnography [47]. This stand implies thatour observations will be specific to visualization and likely will not behelpful in other fields; conversely, we assert that an observer without avisualization background will not get the answers needed for abstract-ing the gathered information into visualization-compatible concepts.
The methodology of grounded theory emphasizes building an un-derstanding from the ground up based on careful and detailed anal-ysis [14]. As with ethnography, we differ by advocating that validprogress can be made with considerably less analysis time. Althoughearly proponents [87] cautioned against beginning the analysis pro-cess with preconceived notions, our insistence that visualization re-searchers must have a solid foundation in visualization knowledgealigns better with more recent interpretations [25] that advocate bring-ing a prepared mind to the project, a call echoed by others [63].
Many aspects of the action research (AR) methodology [27] alignwith design study methodology. First is the idea of learning throughaction, where intervention in the existing activities of the collabora-tive research partner is an explicit aim of the research agenda, andprolonged engagement is required. A second resonance is the identifi-cation of transferability rather than reproducability as the desired out-come, as the aim is to create a solution for a specific problem. Indeed,our emphasis on abstraction can be cast as a way to “share sufficientknowledge about a solution that it may potentially be transferred toother contexts” [27]. The third key idea is that personal involvementof the researcher is central and desirable, rather than being a dismayingincursion of subjectivity that is a threat to validity; van Wijk makes the
Collaboration incentives: Bidirectional
• what’s in it for domain scientist?– win: access to more suitable tools, can do better/faster/cheaper science– time spent could pay off with earlier access and/or more customized tools
• what’s in it for vis?– win: access to better understanding of your driving problems
• crucial element in building effective tools to help
– opportunities to observe how you use them• if they’re good enough, vis win: research success stories
– leads us to develop guidelines on how to build better tools in general• vis win: research progress in visualization• [The Computer Scientist as Toolsmith II, Fred Brooks, CACM 30(3):61-68 1996]
39
Of course!!!
I’m a domain expert!Wanna collaborate?
40
PITFALL
PREMATURE COLLABORATION COMMITMENT
41
METAPHORWinnowing
Collaborator winnowing
initial conversation
42
(potential collaborators)
initial conversation
furthermeetings
43
Collaborator winnowing
initial conversation
furthermeetings
prototyping
Collaborator winnowing
44
initial conversation
furthermeetings
prototyping
fullcollaboration
Collaborator winnowing
45
collaborator
Collaborator winnowing
initial conversation
furthermeetings
prototyping
fullcollaboration
46
Talk with many, stay with few!
Design study methodology: 32 pitfalls
• and how to avoid them
47
alization researcher to explain hard-won knowledge about the domainto the readers is understandable, it is usually a better choice to putwriting effort into presenting extremely clear abstractions of the taskand data. Design study papers should include only the bare minimumof domain knowledge that is required to understand these abstractions.We have seen many examples of this pitfall as reviewers, and we con-tinue to be reminded of it by reviewers of our own paper submissions.We fell headfirst into it ourselves in a very early design study, whichwould have been stronger if more space had been devoted to the ra-tionale of geography as a proxy for network topology, and less to theintricacies of overlay network configuration and the travails of map-ping IP addresses to geographic locations [53].
Another challenge is to construct an interesting and useful storyfrom the set of events that constitute a design study. First, the re-searcher must re-articulate what was unfamiliar at the start of the pro-cess but has since become internalized and implicit. Moreover, theorder of presentation and argumentation in a paper should follow alogical thread that is rarely tied to the actual chronology of events dueto the iterative and cyclical nature of arriving at full understanding ofthe problem (PF-31). A careful selection of decisions made, and theirjustification, is imperative for narrating a compelling story about a de-sign study and are worth discussing as part of the reflections on lessonslearned. In this spirit, writing a design study paper has much in com-mon with writing for qualitative research in the social sciences. Inthat literature, the process of writing is seen as an important researchcomponent of sense-making from observations gathered in field work,above and beyond merely being a reporting method [62, 93].
In technique-driven work, the goal of novelty means that there is arush to publish as soon as possible. In problem-driven work, attempt-ing to publish too soon is a common mistake, leading to a submissionthat is shallow and lacks depth (PF-32). We have fallen prey to this pit-fall ourselves more than once. In one case, a design study was rejectedupon first submission, and was only published after significantly morework was completed [10]; in retrospect, the original submission waspremature. In another case, work that we now consider preliminarywas accepted for publication [78]. After publication we made furtherrefinements of the tool and validated the design with a field evaluation,but these improvements and findings did not warrant a full second pa-per. We included this work as a secondary contribution in a later paperabout lessons learned across many projects [76], but in retrospect weshould have waited to submit until later in the project life cycle.
It is rare that another group is pursuing exactly the same goal giventhe enormous number of possible data and task combinations. Typi-cally a design requires several iterations before it is as effective as pos-sible, and the first version of a system most often does not constitute aconclusive contribution. Similarly, reflecting on lessons learned fromthe specific situation of study in order to derive new or refined gen-eral guidelines typically requires an iterative process of thinking andwriting. A challenge for researchers who are familiar with technique-driven work and who want to expand into embracing design studies isthat the mental reflexes of these two modes of working are nearly op-posite. We offer a metaphor that technique-driven work is like runninga footrace, while problem-driven work is like preparing for a violinconcert: deciding when to perform is part of the challenge and theprimary hazard is halting before one’s full potential is reached, as op-posed to the challenge of reaching a defined finish line first.
5 COMPARING METHODOLOGIES
Design studies involve a significant amount of qualitative field work;we now compare design study methodolgy to influential methodolo-gies in HCI with similar qualitative intentions. We also use the ter-minology from these methodologies to buttress a key claim on how tojudge design studies: transferability is the goal, not reproducibility.
Ethnography is perhaps the most widely discussed qualitative re-search methodology in HCI [16, 29, 30]. Traditional ethnography inthe fields of anthropology [6] and sociology [81] aims at building arich picture of a culture. The researcher is typically immersed formany months or even years to build up a detailed understanding of lifeand practice within the culture using methods that include observation
PF-1 premature advance: jumping forward over stages generalPF-2 premature start: insufficient knowledge of vis literature learnPF-3 premature commitment: collaboration with wrong people winnowPF-4 no real data available (yet) winnowPF-5 insufficient time available from potential collaborators winnowPF-6 no need for visualization: problem can be automated winnowPF-7 researcher expertise does not match domain problem winnowPF-8 no need for research: engineering vs. research project winnowPF-9 no need for change: existing tools are good enough winnowPF-10 no real/important/recurring task winnowPF-11 no rapport with collaborators winnowPF-12 not identifying front line analyst and gatekeeper before start castPF-13 assuming every project will have the same role distribution castPF-14 mistaking fellow tool builders for real end users castPF-15 ignoring practices that currently work well discoverPF-16 expecting just talking or fly on wall to work discoverPF-17 experts focusing on visualization design vs. domain problem discoverPF-18 learning their problems/language: too little / too much discoverPF-19 abstraction: too little designPF-20 premature design commitment: consideration space too small designPF-21 mistaking technique-driven for problem-driven work designPF-22 nonrapid prototyping implementPF-23 usability: too little / too much implementPF-24 premature end: insufficient deploy time built into schedule deployPF-25 usage study not case study: non-real task/data/user deployPF-26 liking necessary but not sufficient for validation deployPF-27 failing to improve guidelines: confirm, refine, reject, propose reflectPF-28 insufficient writing time built into schedule writePF-29 no technique contribution 6= good design study writePF-30 too much domain background in paper writePF-31 story told chronologically vs. focus on final results writePF-32 premature end: win race vs. practice music for debut write
Table 1. Summary of the 32 design study pitfalls that we identified.
and interview; shedding preconceived notions is a tactic for reachingthis goal. Some of these methods have been adapted for use in HCI,however under a very different methodological umbrella. In thesefields the goal is to distill findings into implications for design, requir-ing methods that quickly build an understanding of how a technologyintervention might improve workflows. While some sternly critiquethis approach [20, 21], we are firmly in the camp of authors such asRogers [64, 65] who argues that goal-directed fieldwork is appropri-ate when it is neither feasible nor desirable to capture everything, andMillen who advocates rapid ethnography [47]. This stand implies thatour observations will be specific to visualization and likely will not behelpful in other fields; conversely, we assert that an observer without avisualization background will not get the answers needed for abstract-ing the gathered information into visualization-compatible concepts.
The methodology of grounded theory emphasizes building an un-derstanding from the ground up based on careful and detailed anal-ysis [14]. As with ethnography, we differ by advocating that validprogress can be made with considerably less analysis time. Althoughearly proponents [87] cautioned against beginning the analysis pro-cess with preconceived notions, our insistence that visualization re-searchers must have a solid foundation in visualization knowledgealigns better with more recent interpretations [25] that advocate bring-ing a prepared mind to the project, a call echoed by others [63].
Many aspects of the action research (AR) methodology [27] alignwith design study methodology. First is the idea of learning throughaction, where intervention in the existing activities of the collabora-tive research partner is an explicit aim of the research agenda, andprolonged engagement is required. A second resonance is the identifi-cation of transferability rather than reproducability as the desired out-come, as the aim is to create a solution for a specific problem. Indeed,our emphasis on abstraction can be cast as a way to “share sufficientknowledge about a solution that it may potentially be transferred toother contexts” [27]. The third key idea is that personal involvementof the researcher is central and desirable, rather than being a dismayingincursion of subjectivity that is a threat to validity; van Wijk makes the
Have data?Have time?Have need?
...
Research problem for
me?...
considerations
48

Design study methodology: 32 pitfalls
49
Are you a user???
... or maybe a fellow tool
builder?
roles
50
biologist
bioinformatician Examples from the trenches
• premature collaboration• fellow tool builders with inaccurate assumptions about user needs• data unavailable early so didn’t diagnose problems
PowerSet Viewer2 years / 4 researchers
WikeVis0.5 years / 2 researchers
51
Design study methodology: 32 pitfalls
52
53
PITFALL
PREMATURE DESIGN COMMITMENT
I want a tool with that cool technique I saw the
other day!Of course they need the cool
technique I built last year!
54
PITFALL
PREMATURE DESIGN COMMITMENT
o
-
--
-
o
oo
+
+
+-
-
o
-
-
o
+o
-
o-
-
o-
-
-o
o
55
METAPHORDesign Space
one technique...
+ goodokaypoor
o
-
o
-
--
-
o
oo
+
+
+-
-
o
-
-
o
+o
-
o-
-
o-
-
-o
o
56
METAPHORDesign Space
know smallscope
Design study methodology: 32 pitfalls
• and how to avoid them
57
alization researcher to explain hard-won knowledge about the domainto the readers is understandable, it is usually a better choice to putwriting effort into presenting extremely clear abstractions of the taskand data. Design study papers should include only the bare minimumof domain knowledge that is required to understand these abstractions.We have seen many examples of this pitfall as reviewers, and we con-tinue to be reminded of it by reviewers of our own paper submissions.We fell headfirst into it ourselves in a very early design study, whichwould have been stronger if more space had been devoted to the ra-tionale of geography as a proxy for network topology, and less to theintricacies of overlay network configuration and the travails of map-ping IP addresses to geographic locations [53].
Another challenge is to construct an interesting and useful storyfrom the set of events that constitute a design study. First, the re-searcher must re-articulate what was unfamiliar at the start of the pro-cess but has since become internalized and implicit. Moreover, theorder of presentation and argumentation in a paper should follow alogical thread that is rarely tied to the actual chronology of events dueto the iterative and cyclical nature of arriving at full understanding ofthe problem (PF-31). A careful selection of decisions made, and theirjustification, is imperative for narrating a compelling story about a de-sign study and are worth discussing as part of the reflections on lessonslearned. In this spirit, writing a design study paper has much in com-mon with writing for qualitative research in the social sciences. Inthat literature, the process of writing is seen as an important researchcomponent of sense-making from observations gathered in field work,above and beyond merely being a reporting method [62, 93].
In technique-driven work, the goal of novelty means that there is arush to publish as soon as possible. In problem-driven work, attempt-ing to publish too soon is a common mistake, leading to a submissionthat is shallow and lacks depth (PF-32). We have fallen prey to this pit-fall ourselves more than once. In one case, a design study was rejectedupon first submission, and was only published after significantly morework was completed [10]; in retrospect, the original submission waspremature. In another case, work that we now consider preliminarywas accepted for publication [78]. After publication we made furtherrefinements of the tool and validated the design with a field evaluation,but these improvements and findings did not warrant a full second pa-per. We included this work as a secondary contribution in a later paperabout lessons learned across many projects [76], but in retrospect weshould have waited to submit until later in the project life cycle.
It is rare that another group is pursuing exactly the same goal giventhe enormous number of possible data and task combinations. Typi-cally a design requires several iterations before it is as effective as pos-sible, and the first version of a system most often does not constitute aconclusive contribution. Similarly, reflecting on lessons learned fromthe specific situation of study in order to derive new or refined gen-eral guidelines typically requires an iterative process of thinking andwriting. A challenge for researchers who are familiar with technique-driven work and who want to expand into embracing design studies isthat the mental reflexes of these two modes of working are nearly op-posite. We offer a metaphor that technique-driven work is like runninga footrace, while problem-driven work is like preparing for a violinconcert: deciding when to perform is part of the challenge and theprimary hazard is halting before one’s full potential is reached, as op-posed to the challenge of reaching a defined finish line first.
5 COMPARING METHODOLOGIES
Design studies involve a significant amount of qualitative field work;we now compare design study methodolgy to influential methodolo-gies in HCI with similar qualitative intentions. We also use the ter-minology from these methodologies to buttress a key claim on how tojudge design studies: transferability is the goal, not reproducibility.
Ethnography is perhaps the most widely discussed qualitative re-search methodology in HCI [16, 29, 30]. Traditional ethnography inthe fields of anthropology [6] and sociology [81] aims at building arich picture of a culture. The researcher is typically immersed formany months or even years to build up a detailed understanding of lifeand practice within the culture using methods that include observation
PF-1 premature advance: jumping forward over stages generalPF-2 premature start: insufficient knowledge of vis literature learnPF-3 premature commitment: collaboration with wrong people winnowPF-4 no real data available (yet) winnowPF-5 insufficient time available from potential collaborators winnowPF-6 no need for visualization: problem can be automated winnowPF-7 researcher expertise does not match domain problem winnowPF-8 no need for research: engineering vs. research project winnowPF-9 no need for change: existing tools are good enough winnowPF-10 no real/important/recurring task winnowPF-11 no rapport with collaborators winnowPF-12 not identifying front line analyst and gatekeeper before start castPF-13 assuming every project will have the same role distribution castPF-14 mistaking fellow tool builders for real end users castPF-15 ignoring practices that currently work well discoverPF-16 expecting just talking or fly on wall to work discoverPF-17 experts focusing on visualization design vs. domain problem discoverPF-18 learning their problems/language: too little / too much discoverPF-19 abstraction: too little designPF-20 premature design commitment: consideration space too small designPF-21 mistaking technique-driven for problem-driven work designPF-22 nonrapid prototyping implementPF-23 usability: too little / too much implementPF-24 premature end: insufficient deploy time built into schedule deployPF-25 usage study not case study: non-real task/data/user deployPF-26 liking necessary but not sufficient for validation deployPF-27 failing to improve guidelines: confirm, refine, reject, propose reflectPF-28 insufficient writing time built into schedule writePF-29 no technique contribution 6= good design study writePF-30 too much domain background in paper writePF-31 story told chronologically vs. focus on final results writePF-32 premature end: win race vs. practice music for debut write
Table 1. Summary of the 32 design study pitfalls that we identified.
and interview; shedding preconceived notions is a tactic for reachingthis goal. Some of these methods have been adapted for use in HCI,however under a very different methodological umbrella. In thesefields the goal is to distill findings into implications for design, requir-ing methods that quickly build an understanding of how a technologyintervention might improve workflows. While some sternly critiquethis approach [20, 21], we are firmly in the camp of authors such asRogers [64, 65] who argues that goal-directed fieldwork is appropri-ate when it is neither feasible nor desirable to capture everything, andMillen who advocates rapid ethnography [47]. This stand implies thatour observations will be specific to visualization and likely will not behelpful in other fields; conversely, we assert that an observer without avisualization background will not get the answers needed for abstract-ing the gathered information into visualization-compatible concepts.
The methodology of grounded theory emphasizes building an un-derstanding from the ground up based on careful and detailed anal-ysis [14]. As with ethnography, we differ by advocating that validprogress can be made with considerably less analysis time. Althoughearly proponents [87] cautioned against beginning the analysis pro-cess with preconceived notions, our insistence that visualization re-searchers must have a solid foundation in visualization knowledgealigns better with more recent interpretations [25] that advocate bring-ing a prepared mind to the project, a call echoed by others [63].
Many aspects of the action research (AR) methodology [27] alignwith design study methodology. First is the idea of learning throughaction, where intervention in the existing activities of the collabora-tive research partner is an explicit aim of the research agenda, andprolonged engagement is required. A second resonance is the identifi-cation of transferability rather than reproducability as the desired out-come, as the aim is to create a solution for a specific problem. Indeed,our emphasis on abstraction can be cast as a way to “share sufficientknowledge about a solution that it may potentially be transferred toother contexts” [27]. The third key idea is that personal involvementof the researcher is central and desirable, rather than being a dismayingincursion of subjectivity that is a threat to validity; van Wijk makes the
o
-
--
-
o
oo
+
+
+-
-
o
-
-
o
+o
-
o-
-
o-
-
-o
o
+ goodokaypoor
o
-
58
METAPHORDesign Space
o
-
--
-
o
oo
+
+
+-
-
o
-
-
o
+o
-
o-
-
o-
-
-o
o
59
METAPHORDesign Space
know broadscope o
-
--
-
o
oo
+
+
+-
-
o
-
-
o
+o
-
o-
-
o-
-
-o
o
60
know
METAPHORDesign Space
consider
o
-
--
-
o
oo
+
+
+-
-
o
-
-
o
+o
-
o-
-
o-
-
-o
o
61
know
METAPHORDesign Space
consider
propose
o
-
--
-
o
oo
+
+
+-
-
o
-
-
o
+o
-
o-
-
o-
-
-o
o
62
know
METAPHORDesign Space
consider
propose
select
o
-
--
-
o
oo
+
+
+-
-
o
-
-
o
+o
-
o-
-
o-
-
-o
o
+ goodokaypoor
o-
63
select
consider propose
Think broad!
METAPHORDesign Space
Design study methodology: 32 pitfalls
64
65
PITFALL
PREMATURE DESIGN COMMITMENT
DOMAIN EXPERTS FOCUSED ON VIS DESIGN VS DOMAIN PROBLEM
Tell me more about your current
workflow problems!
I want a tool with that cool technique I saw the
other day!
Design study methodology: 32 pitfalls
66 67
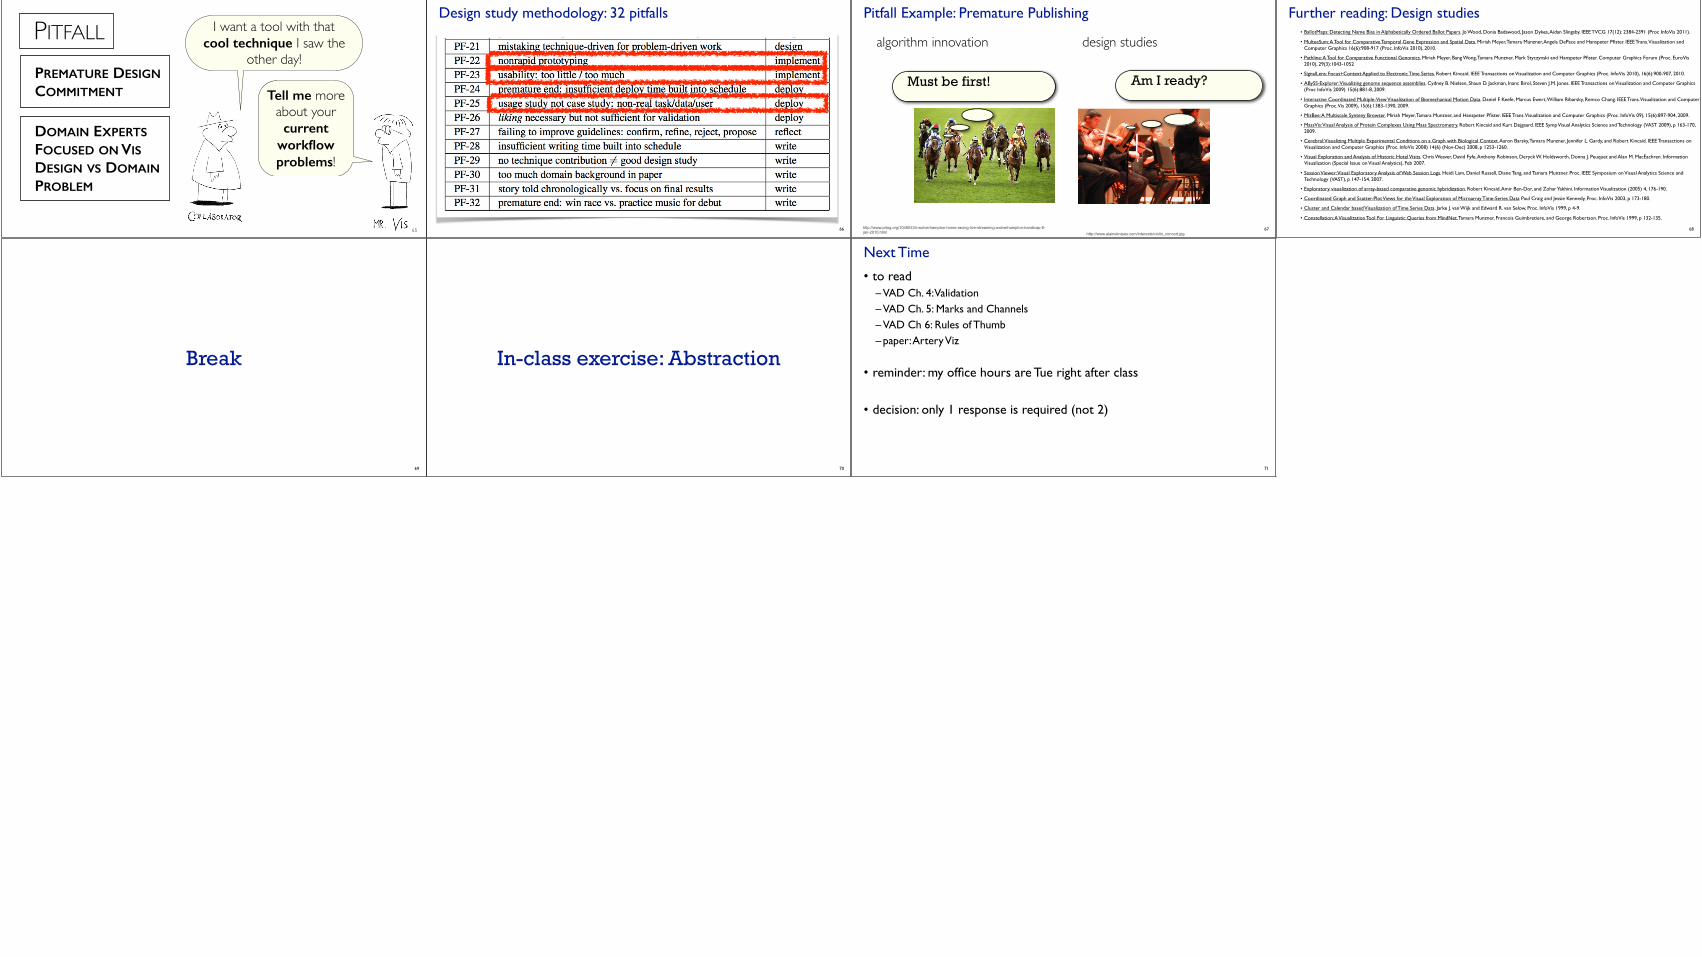
algorithm innovation design studies
Must be first! Am I ready?
http://www.alaineknipes.com/interests/violin_concert.jpghttp://www.prlog.org/10480334-wolverhampton-horse-racing-live-streaming-wolverhampton-handicap-8-jan-2010.html
Pitfall Example: Premature Publishing
• metaphor: horse race vs. music debut
Further reading: Design studies• BallotMaps: Detecting Name Bias in Alphabetically Ordered Ballot Papers. Jo Wood, Donia Badawood, Jason Dykes, Aidan Slingsby. IEEE TVCG 17(12): 2384-2391 (Proc InfoVis 2011).
• MulteeSum: A Tool for Comparative Temporal Gene Expression and Spatial Data. Miriah Meyer, Tamara Munzner, Angela DePace and Hanspeter Pfister. IEEE Trans. Visualization and Computer Graphics 16(6):908-917 (Proc. InfoVis 2010), 2010.
• Pathline: A Tool for Comparative Functional Genomics. Miriah Meyer, Bang Wong, Tamara Munzner, Mark Styczynski and Hanspeter Pfister. Computer Graphics Forum (Proc. EuroVis 2010), 29(3):1043-1052
• SignalLens: Focus+Context Applied to Electronic Time Series. Robert Kincaid. IEEE Transactions on Visualization and Computer Graphics (Proc. InfoVis 2010), 16(6):900-907, 2010.
• ABySS-Explorer: Visualizing genome sequence assemblies. Cydney B. Nielsen, Shaun D. Jackman, Inanc Birol, Steven J.M. Jones. IEEE Transactions on Visualization and Computer Graphics (Proc InfoVis 2009) 15(6):881-8, 2009.
• Interactive Coordinated Multiple-View Visualization of Biomechanical Motion Data. Daniel F. Keefe, Marcus Ewert, William Ribarsky, Remco Chang. IEEE Trans. Visualization and Computer Graphics (Proc. Vis 2009), 15(6):1383-1390, 2009.
• MizBee: A Multiscale Synteny Browser. Miriah Meyer, Tamara Munzner, and Hanspeter Pfister. IEEE Trans. Visualization and Computer Graphics (Proc. InfoVis 09), 15(6):897-904, 2009.
• MassVis: Visual Analysis of Protein Complexes Using Mass Spectrometry. Robert Kincaid and Kurt Dejgaard. IEEE Symp Visual Analytics Science and Technology (VAST 2009), p 163-170, 2009.
• Cerebral: Visualizing Multiple Experimental Conditions on a Graph with Biological Context. Aaron Barsky, Tamara Munzner, Jennifer L. Gardy, and Robert Kincaid. IEEE Transactions on Visualization and Computer Graphics (Proc. InfoVis 2008) 14(6) (Nov-Dec) 2008, p 1253-1260.
• Visual Exploration and Analysis of Historic Hotel Visits. Chris Weaver, David Fyfe, Anthony Robinson, Deryck W. Holdsworth, Donna J. Peuquet and Alan M. MacEachren. Information Visualization (Special Issue on Visual Analytics), Feb 2007.
• Session Viewer: Visual Exploratory Analysis of Web Session Logs. Heidi Lam, Daniel Russell, Diane Tang, and Tamara Munzner. Proc. IEEE Symposium on Visual Analytics Science and Technology (VAST), p 147-154, 2007.
• Exploratory visualization of array-based comparative genomic hybridization. Robert Kincaid, Amir Ben-Dor, and Zohar Yakhini. Information Visualization (2005) 4, 176-190.
• Coordinated Graph and Scatter-Plot Views for the Visual Exploration of Microarray Time-Series Data Paul Craig and Jessie Kennedy, Proc. InfoVis 2003, p 173-180.
• Cluster and Calendar based Visualization of Time Series Data. Jarke J. van Wijk and Edward R. van Selow, Proc. InfoVis 1999, p 4-9.
• Constellation: A Visualization Tool For Linguistic Queries from MindNet. Tamara Munzner, Francois Guimbretiere, and George Robertson. Proc. InfoVis 1999, p 132-135.
68
Break
69
In-class exercise: Abstraction
70
Next Time
• to read– VAD Ch. 4: Validation– VAD Ch. 5: Marks and Channels– VAD Ch 6: Rules of Thumb– paper: Artery Viz
• reminder: my office hours are Tue right after class
• decision: only 1 response is required (not 2)
71