cge training materials national greenhouse gas inventories key category analysis
DESCRIPTION
CGE Training Materials National Greenhouse Gas Inventories Key Category Analysis. Version 2, April 2012. Target Audience and Objective of the Training Materials. - PowerPoint PPT PresentationTRANSCRIPT

Consultative Group of Experts (CGE)
CGE Training MaterialsNational Greenhouse Gas Inventories
Key Category Analysis
Version 2, April 2012
Training Materials for National Greenhouse Gas Inventories
Target Audience and Objective of the Training Materials
These training materials are suitable for people with beginner to intermediate level
knowledge of national greenhouse gas (GHG) inventory development.
After having read this presentation, in combination with the related documentation, the
reader should:
Have an overview of how key category analyses are conducted
Have a general understanding of the methods available, as well as of the main
challenges in that particular area
Be able to determine which methods suits their country’s situation best
Know where to find more detailed information on the topic discussed.
These training materials have been developed primarily on the basis of
methodologies developed, by the IPCC; hence the reader is always encouraged to
refer to the original documents to obtain further detailed information on a particular
issue.
2
Consultative Group of Experts (CGE)
Training Materials for National Greenhouse Gas Inventories

Acronyms and Abbreviations
AD Activity Data
GHG Greenhouse Gas
GPG Good Practice Guidance
GWP Global Warming Potential
KCA Key Category Analysis
LULUCF Land Use, Land-Use Change and Forestry
QA/QC Quality Assurance/Quality Control
3
Consultative Group of Experts (CGE)
Training Materials for National Greenhouse Gas Inventories

Definition
A key category is one that is prioritised within the national inventory system because its
estimate has a significant influence on a country’s total inventory of GHG, in terms of the:
Absolute level
The trend, or
The uncertainty in emissions and removals.
Also, national circumstances may point at additional key categories (relevant even if they
do not fully meet the requisites above) based on a qualitative analysis.
4
Consultative Group of Experts (CGE)
Training Materials for National Greenhouse Gas Inventories

Rationale
It is good practice to:
Identify national key categories in a systematic and objective manner, i.e. to
undertake key category analysis
Use the results of the key category analysis as a basis for methodological and
resource allocation choices.
5
Improved inventory quality, as well as greater confidence in the estimates that are developed.
Consultative Group of Experts (CGE)
Training Materials for National Greenhouse Gas Inventories
Key Category Analysis
Non-Annex I Parties are encouraged to fulfil this good practice only if they:
Have the AD needed to apply the higher level methodology and
Can collect relevant data without jeopardizing the financial resources required for the
whole inventory process.
If not, the level of detail must be reduced until a balance with the available AD is reached:
Tier 3 > Tier 2 > Tier 1
Keep in mind that KCA is a tool that helps you prioritize limited resources by:
Focusing on the most important sources/sinks of emissions in the country
Determining the most appropriate methodological approach (more detailed, higher-
tier methods should be selected for key categories).
6
Consultative Group of Experts (CGE)
Training Materials for National Greenhouse Gas Inventories
General Guidance
The current guidelines for national communications (NCs) from non-Annex I Parties
encourage the use of the GPG-2000 and the GPG-LULUCF for KCA analysis.
GHG inventory compilers are required to perform KCA twice:
The key (source) categories should first be identified excluding LULUCF (i.e., key
categories should be identified for the energy, industrial processes, solvent and other
product use, agriculture, and waste sectors) following the guidance in GPG2000,
Chapter 7 (Methodological Choice and Recalculation).
The key category analysis should then be repeated for the full inventory including the
LULUCF categories.
7
Consultative Group of Experts (CGE)
Training Materials for National Greenhouse Gas Inventories

Caution!
It is possible that some non-LULUCF categories identified as key in the first analysis will
not appear as key when the LULUCF categories are included:
These categories should still be considered as key.
In a few cases, in countries with small net LULUCF emissions or removals, the integrated
analysis may identify additional non-LULUCF categories as key:
The analysis performed for the non- LULUCF sectors should be used to identify the
key categories in those sectors, and the additional non- LULUCF categories
identified in the combined analysis should not be considered as key.
Consultative Group of Experts (CGE)
Training Materials for National Greenhouse Gas Inventories 8

Identifying Key Categories
Any inventory agency that has prepared a national GHG inventory will be able to identify
key categories in terms of their contribution to the absolute level of national emissions.
For those inventory agencies that have prepared a time series, the quantitative
determination of key categories should include evaluation of both the absolute level and
the trend of emissions and removals.
Some key categories may only be identified when their influence on the trend of the
national inventory is taken into account.
9Consultative Group of Experts (CGE)
Training Materials for National Greenhouse Gas Inventories

10
Quality of estimates:
Box 3 > Box 2 > Box 1
KCA is done for the inventory as a whole
Box 1
Box 3
Box 2
Consultative Group of Experts (CGE)
Training Materials for National Greenhouse Gas Inventories
Decision tree to choose a method in a way that is consistent with good practice

Identifying Key Categories
Good practice in determining the appropriate level of disaggregation of categories:
Use subcategory disaggregation suggested by IPCC (see sector guidance)
Consider separately each GHG for each category (default choice unless otherwise
appropriate)
If data are available, undertake a separate analysis for emissions and removals.
11
Table 5.4.1 of the GPG-LULUCF provides information on the recommended level of aggregation for all sectors.
Consultative Group of Experts (CGE)
Training Materials for National Greenhouse Gas Inventories

Identifying Key Categories (continued)
12
Consultative Group of Experts (CGE)
Training Materials for National Greenhouse Gas Inventories
Determination of Significant Subcategories
For each key category, determine whether certain subcategories are particularly
significant:
A subcategory is significant when it has a high contribution to the key category
emissions
If information on subcategories is available, those potentially significant ones could
be included in the key category analysis at the level of categories.
It is good practice to estimate emissions from significant subcategories applying the
most detailed and specific methodology alllowed by the available activity data.
Non-significant subcategories can be treated with Tier 1 methods.
13
Consultative Group of Experts (CGE)
Training Materials for National Greenhouse Gas Inventories
Approaches
Quantitative approaches to determining key categories:
Basic Tier 1 approach (level and trend) and
Tier 2 approach (level and trend), which takes uncertainties into account.
In addition to making a quantitative determination of key categories, it is good practice to
consider qualitative criteria, particularly when a Tier 1 assessment is performed or lower
tier estimation methods are used.
The good practice guidance provided in the two GPGs is applicable to the full inventory of
emissions and removals.
Consultative Group of Experts (CGE)
Training Materials for National Greenhouse Gas Inventories 14
Start Here!
If it is the first time, prepare a preliminary inventory for the year of interest applying Tier 1
methods for all categories.
If you already have a GHG inventory, then use the available GHG data for the most
recent year.
List source and sink categories separately.
Express emissions in carbon dioxide equivalent (CO2 eq) (using the IPCC GWP values).
15
Consultative Group of Experts (CGE)
Training Materials for National Greenhouse Gas Inventories

Quantitative Approach Tier 1: Level Assessment
16
Based on assessing the influence of various categories of sources and sinks on the level,
of the national GHG inventory:
Key categories are those that, when summed together in descending order of magnitude, add up to 95 % of the sum of all Lx,t.
Consultative Group of Experts (CGE)
Training Materials for National Greenhouse Gas Inventories

Estimate GHG Emissions and Removals
LULUCFLULUCF
17
Consultative Group of Experts (CGE)
Training Materials for National Greenhouse Gas Inventories

Step 1: Only consider emissions
18
Consultative Group of Experts (CGE)
Training Materials for National Greenhouse Gas Inventories

Step 2: Order activities in descending order
19
Consultative Group of Experts (CGE)
Training Materials for National Greenhouse Gas Inventories

Step 3: Sum up all emissions
20
Consultative Group of Experts (CGE)
Training Materials for National Greenhouse Gas Inventories

Step 4: Find percentage contribution
21
Consultative Group of Experts (CGE)
Training Materials for National Greenhouse Gas Inventories
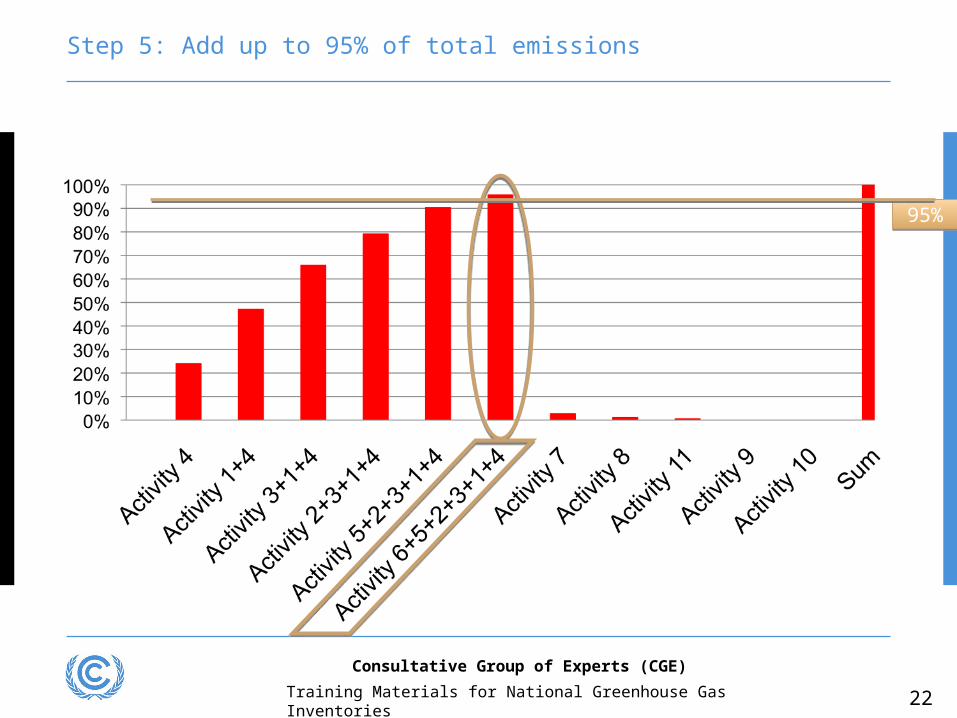
Step 5: Add up to 95% of total emissions
95%95%
22
Consultative Group of Experts (CGE)
Training Materials for National Greenhouse Gas Inventories

But, this is only half of the work!
LULUCFLULUCF
23
Consultative Group of Experts (CGE)
Training Materials for National Greenhouse Gas Inventories
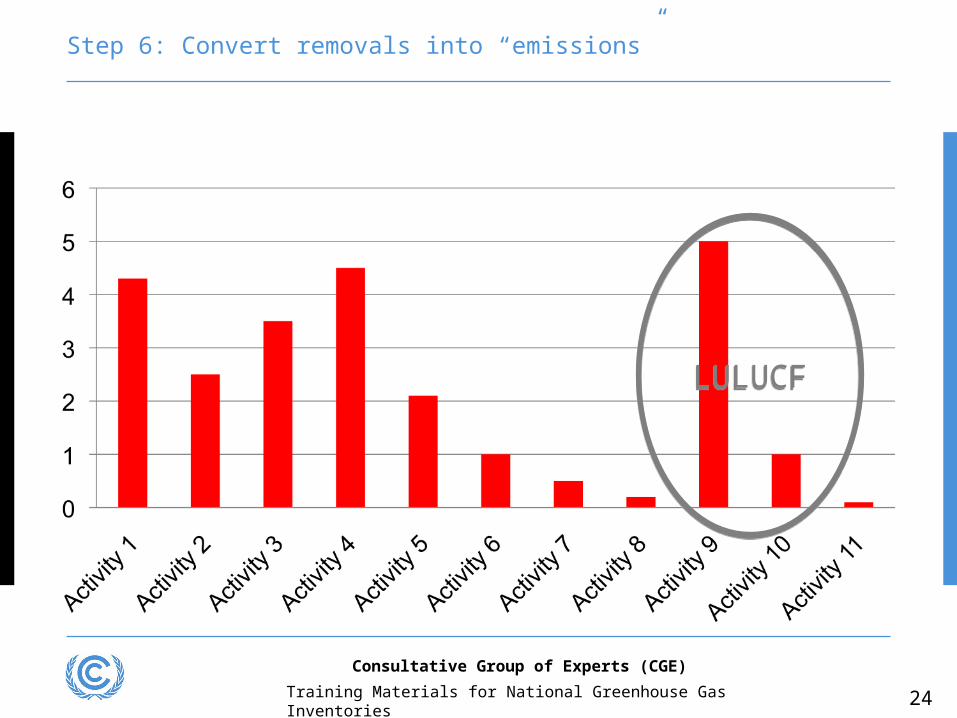
Step 6: Convert removals into “emissions”
LULUCFLULUCF
24
Consultative Group of Experts (CGE)
Training Materials for National Greenhouse Gas Inventories

Step 7: Sum up all “emissions”
25
Consultative Group of Experts (CGE)
Training Materials for National Greenhouse Gas Inventories

Step 8: Order all activities in descending order
26
Consultative Group of Experts (CGE)
Training Materials for National Greenhouse Gas Inventories

Step 9: Find percentage contribution of all activities
27
Consultative Group of Experts (CGE)
Training Materials for National Greenhouse Gas Inventories
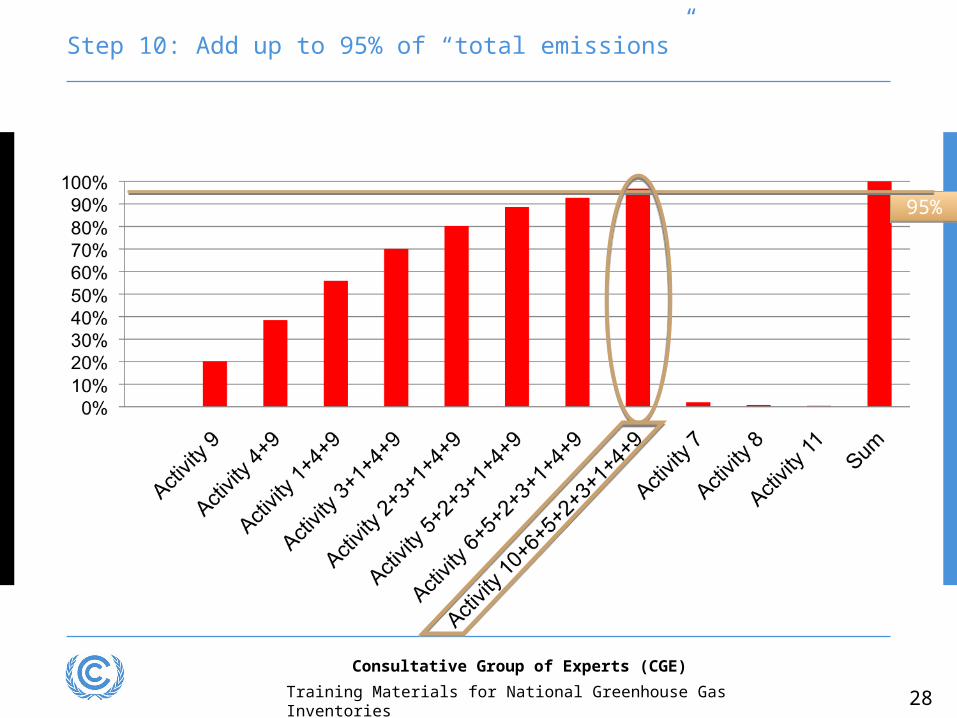
Step 10: Add up to 95% of “total emissions”
95%95%
28
Consultative Group of Experts (CGE)
Training Materials for National Greenhouse Gas Inventories

Key Categories
KCA (only emissions): Activity 4
Activity 1
Activity 3
Activity 2
Activity 5
Activity 6
KCA (emissions and removals) Activity 9
Activity 4
Activity 1
Activity 3
Activity 2
Activity 5
Activity 6
Activity 10
29
Consultative Group of Experts (CGE)
Training Materials for National Greenhouse Gas Inventories
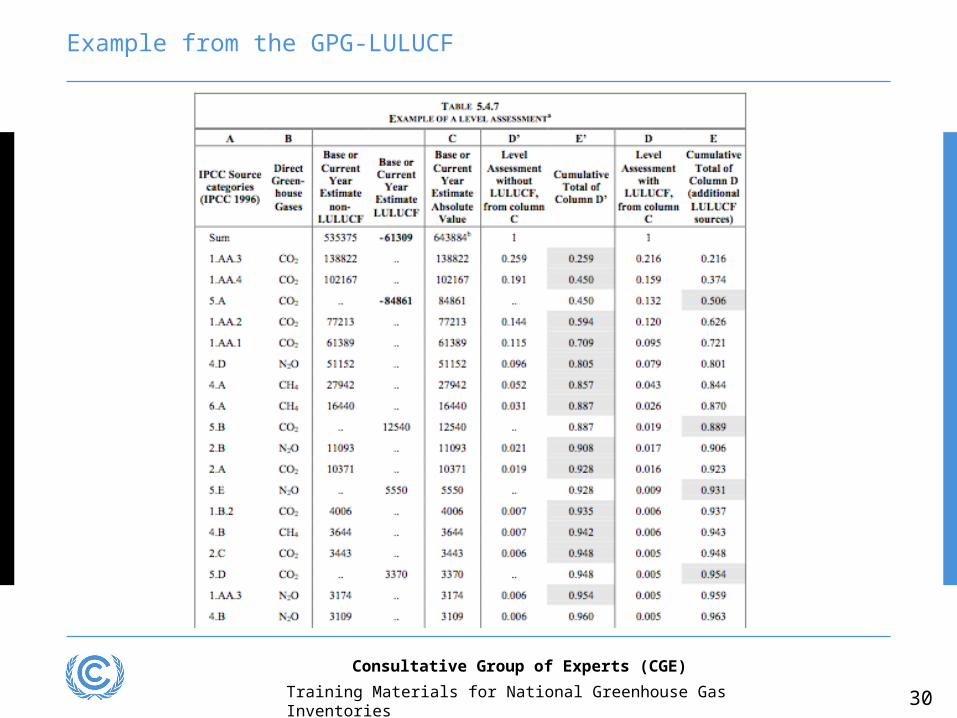
Example from the GPG-LULUCF
30
Consultative Group of Experts (CGE)
Training Materials for National Greenhouse Gas Inventories

Quantitative approach Tier 1: Trend Assessment
31
Categories that may not be large enough to be identified by the level assessment,
but whose trend is significantly different from the trend of the overall inventory.
Categories whose trend diverges most from the total trend should be identified as key, when this difference is weighted by the level of emissions or removals of the category in
the base year.
Consultative Group of Experts (CGE)
Training Materials for National Greenhouse Gas Inventories

Quantitative approach Tier 1: Trend Assessment
32
Example 2: Calculate the % contribution to the trend for the variable below
Refrigeration and air conditioning
Consultative Group of Experts (CGE)
Training Materials for National Greenhouse Gas Inventories
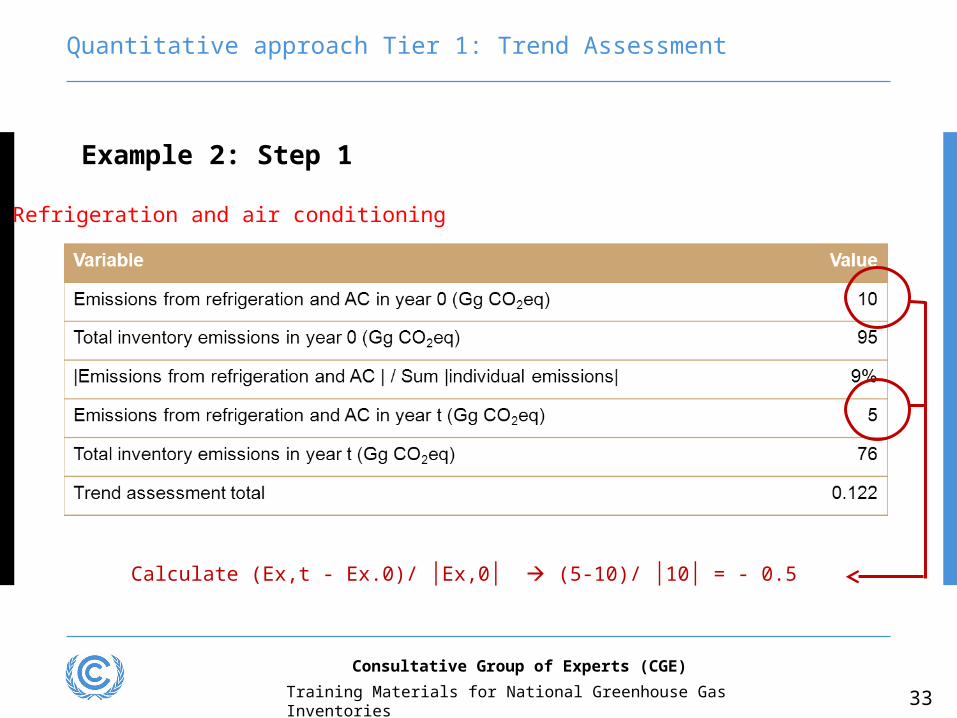
Quantitative approach Tier 1: Trend Assessment
33
Example 2: Step 1
Calculate (Ex,t - Ex.0)/ │Ex,0│ (5-10)/ │10│ = - 0.5
Refrigeration and air conditioning
Consultative Group of Experts (CGE)
Training Materials for National Greenhouse Gas Inventories

Quantitative approach Tier 1: Trend Assessment
34
Example 2: Step 2
Calculate
(Total inventory t - Total inventory 0) / │ Total inventory 0 │ (76-95) / │95│ = - 0.2
Refrigeration and air conditioning
Consultative Group of Experts (CGE)
Training Materials for National Greenhouse Gas Inventories

Quantitative approach Tier 1: Trend Assessment
35
Example 2: Step 3
Calculate the trend assessment for refrigeration and AC
(0.09) * │- 0.5 - (-0.2)│ = 0.0261
Refrigeration and air conditioning
Consultative Group of Experts (CGE)
Training Materials for National Greenhouse Gas Inventories

Quantitative approach Tier 1: Trend Assessment
36
Example 2: Step 4
Refrigeration and air conditioning
Calculate the contribution to the trend from refrigeration and AC 0.0261 / 0.122 = 21.4%
Consultative Group of Experts (CGE)
Training Materials for National Greenhouse Gas Inventories

Quantitative approach Tier 1: Trend Assessment
Example 2: Steps 5, 6 and 7
37
Variable Value
Emissions from refrigeration and AC in year 0 (Gg CO2eq) 10
Total inventory emissions in year 0 (Gg CO2eq) 95
|Emissions from refrigeration and AC | / Sum |individual emissions| 9%
Emissions from refrigeration and AC in year t (Gg CO2eq) 5
Total inventory emissions in year t (Gg CO2eq) 76
Trend assessment total 0.122
(Ex,t – Ex,0)/|Ex,0| -0.5
(Total inventory t – Total inventory 0) / Total inventory 0 -0.2
Trend assessment for refrigeration and AC 0.0261
% contribution to the overall trend 21.4%
Refrigeration and air conditioning
Repeat for all sources and sinks and then …
5. Rank sources according to their contribution to the trend
6. Calculate cumulative contribution
7. Identify sources contributing to 95% of the trend (Key Categories)
Consultative Group of Experts (CGE)
Training Materials for National Greenhouse Gas Inventories

Quantitative approach Tier 2: Level Assessment with uncertainties
38
Key categories are based on uncertainty analysis, level assessment
Results should be sorted according to decreasing order of magnitude.
Key Categories are those that add up to 90 % of the sum of all LUx,t.
They should be added to the KC identified with Tier 1 and can inform inventory improvements.
Consultative Group of Experts (CGE)
Training Materials for National Greenhouse Gas Inventories

Quantitative approach Tier 2: Trend Assessment with uncertainties
39
Key categories are based on uncertainty analysis, trend assessment
Results should be sorted according to decreasing order of magnitude.
Key Categories are those that add up to 90 % of the sum of all TUx,t.
They should be added to the KC identified with Tier 1 and can inform inventory improvements.
Consultative Group of Experts (CGE)
Training Materials for National Greenhouse Gas Inventories

Quantitative approach Tier 2: Level Assessment with uncertainties
Example 3: Identify Key Categories based on Tier 2 (including uncertainty) level
assessment
40
IPCC category GHG Emissions (Gg CO2eq)
/Ext/ (Gg CO2eq)
Lxt
Energy industries: gas CO2 25 25 25%
Manufacturing industries and construction: solid CO2 20 20 20%
Road transport CO2 15 15 15%
Solid waste disposal CH4 15 15 15%
Forest land remaining forest land CO2 -10 10 10%
Direct N2O emissions from managed soils N2O 10 10 10%
Refrigeration and air conditioning HFCs, PFCs 5 5 5%
Consultative Group of Experts (CGE)
Training Materials for National Greenhouse Gas Inventories

Quantitative approach Tier 2: Level Assessment with uncertainties
Example 3: Step 1
41
Add uncertainty data
IPCC category GHG Emissions (Gg CO2eq)
/Ext/ (Gg
CO2eq)
Lxt Ux
Energy industries: gas CO2 25 25 25% 10%Manufacturing industries and construction: solid CO2 20 20 20% 15%Road transport CO2 15 15 15% 10%Solid waste disposal CH4 15 15 15% 25%Forest land remaining forest land CO2 -10 10 10% 40%Direct N2O emissions from managed soils N2O 10 10 10% 50%
Refrigeration and air conditioningHFCs, PFCs 5 5 5% 45%
Consultative Group of Experts (CGE)
Training Materials for National Greenhouse Gas Inventories

IPCC category GHG Emissions (Gg CO2eq)
/Ext/ (Gg CO2eq)
Lxt Ux Lxt * Ux
Energy industries: gas CO2 25 25 25% 10% 2.5%Manufacturing industries and construction: solid CO2 20 20 20% 15% 3.0%
Road transport CO2 15 15 15% 10% 1.5%
Solid waste disposal CH4 15 15 15% 25% 3.8%
Forest land remaining forest land CO2 -10 10 10% 40% 4.0%
Direct N2O emissions from managed soils N2O 10 10 10% 50% 5.0%
Refrigeration and air conditioning HFCs, PFCs 5 5 5% 45% 2.3%
Quantitative approach Tier 2: Level Assessment with uncertainties
Example 3: Step 2
42
Multiply % uncertainty by the % contribution
Consultative Group of Experts (CGE)
Training Materials for National Greenhouse Gas Inventories
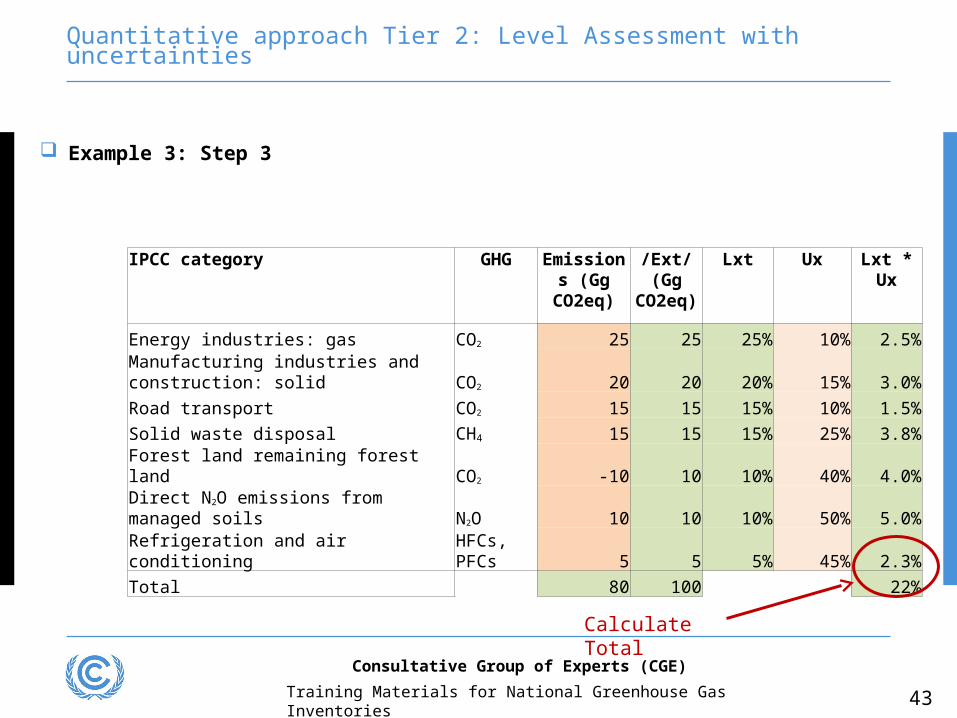
IPCC category GHG Emissions (Gg CO2eq)
/Ext/ (Gg CO2eq)
Lxt Ux Lxt * Ux
Energy industries: gas CO2 25 25 25% 10% 2.5%Manufacturing industries and construction: solid CO2 20 20 20% 15% 3.0%Road transport CO2 15 15 15% 10% 1.5%Solid waste disposal CH4 15 15 15% 25% 3.8%Forest land remaining forest land CO2 -10 10 10% 40% 4.0%Direct N2O emissions from managed soils N2O 10 10 10% 50% 5.0%
Refrigeration and air conditioning HFCs, PFCs 5 5 5% 45% 2.3%Total 80 100 22%
Quantitative approach Tier 2: Level Assessment with uncertainties
Example 3: Step 3
43
Calculate Total
Consultative Group of Experts (CGE)
Training Materials for National Greenhouse Gas Inventories
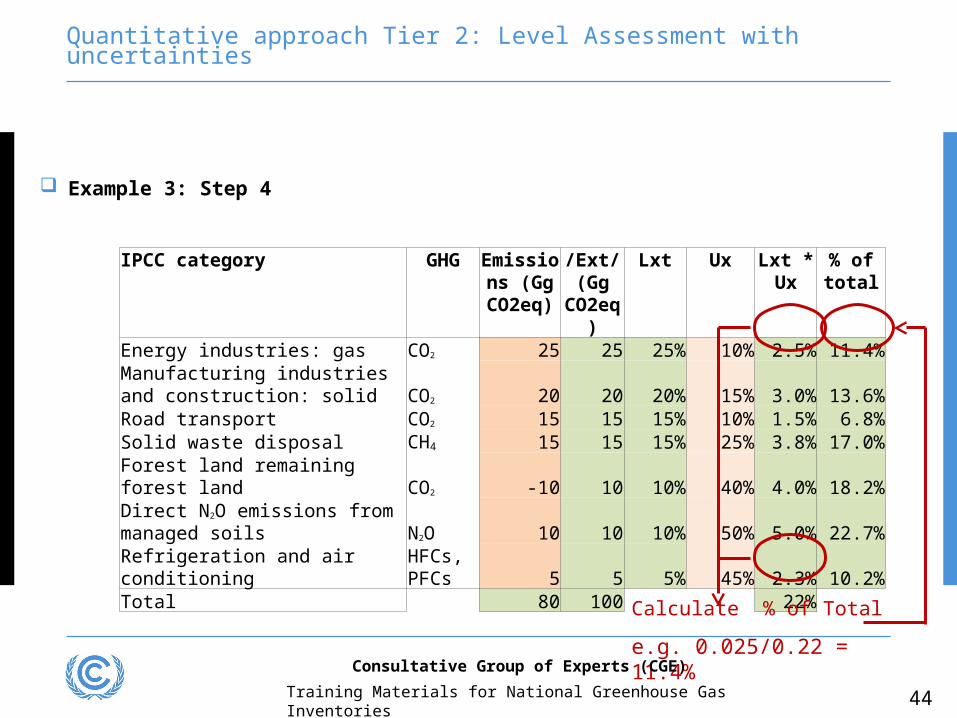
Quantitative approach Tier 2: Level Assessment with uncertainties
Example 3: Step 4
44
IPCC category GHG Emissions (Gg
CO2eq)
/Ext/ (Gg
CO2eq)
Lxt Ux Lxt * Ux
% of total
Energy industries: gas CO2 25 25 25% 10% 2.5% 11.4%Manufacturing industries and construction: solid CO2 20 20 20% 15% 3.0% 13.6%Road transport CO2 15 15 15% 10% 1.5% 6.8%Solid waste disposal CH4 15 15 15% 25% 3.8% 17.0%Forest land remaining forest land CO2 -10 10 10% 40% 4.0% 18.2%Direct N2O emissions from managed soils N2O 10 10 10% 50% 5.0% 22.7%
Refrigeration and air conditioningHFCs, PFCs 5 5 5% 45% 2.3% 10.2%
Total 80 100 22%
Calculate % of Total
e.g. 0.025/0.22 = 11.4%Consultative Group of Experts (CGE)
Training Materials for National Greenhouse Gas Inventories

Quantitative approach Tier 2: Level Assessment with uncertainties
Example 3: Step 5
45
IPCC category GHG Emissions (Gg
CO2eq)
/Ext/ (Gg
CO2eq)
Lxt Ux Lxt * Ux
% of total
Direct N2O emissions from managed soils N2O 10 10 10% 50% 5.0% 22.7%Forest land remaining forest land CO2 -10 10 10% 40% 4.0% 18.2%Solid waste disposal CH4 15 15 15% 25% 3.8% 17.0%Manufacturing industries and construction: solid CO2 20 20 20% 15% 3.0% 13.6%Energy industries: gas CO2 25 25 25% 10% 2.5% 11.4%
Refrigeration and air conditioningHFCs, PFCs 5 5 5% 45% 2.3% 10.2%
Road transport CO2 15 15 15% 10% 1.5% 6.8%Total 80 100 22%
Rank
high
Low
Consultative Group of Experts (CGE)
Training Materials for National Greenhouse Gas Inventories

Quantitative approach Tier 2: Level Assessment with uncertainties
Example 3: Step 6
46
IPCC category GHG Emissions (Gg
CO2eq)
/Ext/ (Gg
CO2eq)
Lxt Ux Lxt * Ux % of total cumulative % of total
Direct N2O emissions from managed soils N2O 10 10 10% 50% 5.0% 22.7% 22.7%Forest land remaining forest land CO2 -10 10 10% 40% 4.0% 18.2% 40.9%Solid waste disposal CH4 15 15 15% 25% 3.8% 17.0% 58.0%Manufacturing industries and construction: solid CO2 20 20 20% 15% 3.0% 13.6% 71.6%Energy industries: gas CO2 25 25 25% 10% 2.5% 11.4% 83.0%
Refrigeration and air conditioningHFCs, PFCs 5 5 5% 45% 2.3% 10.2% 93.2%
Road transport CO2 15 15 15% 10% 1.5% 6.8% 100.0%
Calculate cumulative and identify 90% contribution
Consultative Group of Experts (CGE)
Training Materials for National Greenhouse Gas Inventories

Qualitative Criteria
Mitigation techniques and technologies: If emissions from a category are being
reduced or removals increased through the use of climate change mitigation techniques,
it is good practice to identify these categories as key.
High expected growth of emissions or removals: If the inventory agency expects
emissions or removals from a category to grow significantly in the future, they are
encouraged to identify that category as key. Some of these categories will be identified
by the Trend Assessment or will be identified in the future. Because it is important to
implement a higher tier good practice method as soon as possible, however, early
identification using qualitative criteria is important.
High uncertainty: If the inventory agency is not taking uncertainty explicitly into account
by using the Tier 2 method to identify key categories, they may want to identify the most
uncertain categories as key. This is because the largest reductions in overall inventory
uncertainty can be achieved by improving estimates of highly uncertain categories.
Consultative Group of Experts (CGE)
Training Materials for National Greenhouse Gas Inventories

Qualitative Criteria
Unexpectedly high or low emissions or removals: When emissions or removals are
far higher or lower than would be expected using the methods in the IPCC Guidelines,
these categories should be designated as key. Particular attention to QA/QC.
Large stocks: When a small net flux results from the subtraction of large emissions and
removals, the uncertainty can be very high. Thus, when moving from the Tier 1 to higher
tier estimation methods the order of IPCC Source Categories may change and previously
insignificant categories may become significant.
Deforestation: In the quantitative key category analysis, deforestation is spread out
under the different land- use change categories (e.g., Lands converted to grassland are
considered separately from Lands converted to cropland). To ensure consistency with the
IPCC Guidelines, countries should identify and sum up the emission estimates
associated with forest conversion to any other land category. “Deforestation” should be
considered key if the sum is larger than the smallest category considered key in the
quantitative analysis.
Consultative Group of Experts (CGE)
Training Materials for National Greenhouse Gas Inventories

Qualitative Criteria
Completeness: Neither the Tier 1 nor the Tier 2 approach gives correct results if the
inventory is not complete. The analysis can still be performed, but there may be key
categories among those not estimated. In these cases it is good practice to qualitatively
examine potential key categories applying the qualitative considerations above. The
inventory of a country with similar national circumstances can also often give good
indications on potential key categories.
Consultative Group of Experts (CGE)
Training Materials for National Greenhouse Gas Inventories

Reporting and Documentation
It is good practice to:
Clearly document the results of the KCA in the inventory report
List the criteria by which each category was identified as key
e.g. Level, trend or qualitative
Indicate the method used to undertake quantitative KCA
Tier1 and/or Tier 2
Report results using the IPCC tables
50Consultative Group of Experts (CGE)
Training Materials for National Greenhouse Gas Inventories

Reporting Tables
Consultative Group of Experts (CGE)
Training Materials for National Greenhouse Gas Inventories

Key Category Analysis – Summary/Checklist
If first time, prepare a preliminary inventory for the year of interest applying Tier 1 methods for all
categories
If you already have a GHG inventory, the use the GHG data for the most recent year
List source and sink categories separately
Express emissions in CO2 eq (using the IPCC GWP values)
Sort categories according a decreasing order or magnitude of emissions/captures
Calculate the relative contribution of each category to the total emissions/captures
Calculate the cumulative relative contribuition of categories and draw a threshold level at the point
when 95% of national emissions/capture is reached
Key categories are those that integrate the group of categories that accumulate the upper 95% of
national GHG emissions
52
Consultative Group of Experts (CGE)
Training Materials for National Greenhouse Gas Inventories
Thank you
53
Consultative Group of Experts (CGE)
Training Materials for National Greenhouse Gas Inventories

CASE STUDY: CHILE
54
Consultative Group of Experts (CGE)
Training Materials for National Greenhouse Gas Inventories

Example
2000 GHG inventory of Chile (Gg CO2-equivalent)
Sector/subsectorCO2 Emissions
(Gg/year)CO2 Removal
(Gg/year)CH4
(Gg eq/year)
N2O (Gg eq/year)
Total
Total National 53.623,5 -29.819,20 11.755,8 7.812,0 43.372,11. Energy 48.730,0 0 2.190,3 341,0 51.261,31.A. Fuel Combustion 48.730,0 840,0 341,0 49.911,01.A.1. Energy Industries 15.842,8 6,3 62,0 15.911,11.A.2. Manufacturing, construction and mining
12.142,6 14,7 31,0 12.188,3
1.A.3. Transport 16.013,3 56,7 62,0 16.132,01.A.4. Commercial, Institucional, Residential
4.146,7 18,9 0,0 4.165,6
1.A.5. Fishing 584,7 4,2 0,0 588,91.A.6 Wood and biomass (no-CO2) 741,3 217,0 958,31.B. Fugitive emissions from fuel 1.350,3 0,0 1.350,31.B.1. Solids fuels 71,4 0,0 71,41.B.2. Oil and natural gas 1.278,9 0,0 1.278,92. Industrial processes 4.153,6 0 123,9 155,0 4.432,52.A. Mineral products 2.336,8 0,0 0,0 2.336,82.B. Chemical industry 0 123,9 155,0 278,92.C. Metal production 1.816,8 0,0 0,0 1.816,82.D. Other (Pulp & Paper, Food & Drinks)
NA NA NA NA
2.E. SF6 and PFC production 2.F. SF6 and PFC consumption 2.G. Other (specify) NE NE NE NE3. Solvent use and other product NE 0,0 NE NE
55
Consultative Group of Experts (CGE)
Training Materials for National Greenhouse Gas Inventories

Example
2000 GHG inventory of Chile (Gg CO2-equivalent) cont.4. Agriculture 6.207,6 6.882,0 13.089,64.A. Enteric Fermentation 4.796,4 0,0 4.796,44.B. Manure management 1.241,1 310,0 1.551,14.C. Rice cultivation 115,5 0,0 115,54.D. Agricultural soils 0,0 6.572,0 6.572,0
4.E. Prescribed burning of savannas NO NO NO
4.F. Agricultural residue burning 54,6 31,0 85,6
4.G. Other (specify) NE NE NE5. LULUCF 703,1 -29.819,2 1.331,4 341,0 -27.443,75.B. Changes in forest and other woody biomass stocks.
613,5 0 0,0 0,0 613,5
5.B. Forest and grassland conversion 0 -1.033,6 12,6 0,0 -1.021,0
5.C. Abandonment of managed lands 0 0,0 0,0 0,0
5.D. CO2 Emissions and removals from soils 86,3 -28.785,5 0,0 0,0 -28.699,2
5.E. Other (specify) NE NE NE NE NE6. Waste 36,9 1.902,6 93,0 2.032,5
6.A. Solid waste disposal on land 1.797,6 0,0 1.797,6
6.B. Wastewater treatment 105,0 0,0 105,06.C. Waste incineration 36,9 0,0 0,0 36,9
6.D. Other (N2O indirects emissions) NA 93,0 93,0
7. Other (specify) NE NE NE NE NE
Memo items
International bunkers 3.059,8 2,1 0,0 3.061,9Aviation 1.045,1 2,1 0,0 1.047,2Marine 2.014,7 0,0 0,0 2.014,7CO2 Emissions from biomass 16.721,5 0,0 0,0 16.721,5
56
Consultative Group of Experts (CGE)
Training Materials for National Greenhouse Gas Inventories

Up-down Ranking of Categories
Gas Key categories Sector Emissions (without
LULUCF) Gg/year
CO2 eq
% Cumulative
(without LULUCF)
Emissions (with LULUCF)
Gg/year CO2 eq
% Cumulative
(with LULUCF)
CO2 Forest land remaining forest land
LULUCF 28.784,2 28,0%
CO2 Stationary combustion (Solids) Energy 15.842,8 22,4% 43,4%
CO2Mobile combustion: road transportation
Energy 15.002,3 43,7% 58,0%
CO2Manufacturing, construction and mining
Energy 12.142,6 60,8% 69,8%
N2O
Agricultural soils (direct and indirect)
Agriculture 6.562,5 70,1% 76,2%
CH4
Enteric fermentation Agriculture 4.796,0 76,9% 80,8%
CO2 Other sectors: residential Energy 3.508,8 81,9% 84,3%
CO2 Iron and steel industryIndustrial Processes
1.816,8 84,5% 86,0%
CH4
Solid waste disposal sites Residues 1.796,8 87,0% 87,8%
CO2 Cement productionIndustrial Processes
1.638,4 89,4% 89,4%
CH4
Fugitive emissions from oil and natural gas operations
Energy 1.277,9 91,2% 90,7%
CH4 Manure management Agriculture 1.241,1 93,0% 91,9%
CH4Forest land remaining forest land
LULUCF 93,0% 1.233,1 94,1%
CO2 Land converted to forest land LULUCF 93,0% 1.026,2 94,1%CH4 Other (energy) Energy 741,0 94,0% 94,8%CO2 Mobile Combustion: aviation Energy 663,0 94,9% 95,4%
CO2 Lime productionIndustrial Processes
653,3 95,9%
57
Consultative Group of Experts (CGE)
Training Materials for National Greenhouse Gas Inventories

Significant Subcategories Determination MODULE AGRICULTURE
SUBMODULE METHANE AND NITROUS OXIDE EMISSIONS FROM DOMESTIC LIVESTOCK
ENTERIC FERMENTATION AND MANURE MANAGEMENT
WORKSHEET 4-1
SHEET 1 OF 2 METHANE EMISSIONS FROM DOMESTIC LIVESTOCK ENTERIC
FERMENTATION AND MANURE MANAGEMENT
STEP 1 STEP 2 STEP 3
A B C D E F
Livestock Type Number of
Animals
Emissions Factor for Enteric
Fermentation
Emissions from
Enteric Fermentation
Emissions
Factor for
Manure
Management
Emissions from
Manure Management
Total Annual Emissions
from
Domestic
Livestock
(1000s) (kg/head/yr) (t/yr) (kg/head/yr) (t/yr) (Gg)
C = (A x B) E = (A x D) F =(C + E)/1000
Dairy Cattle 550 81 44.550 19 10.450 55,00
Non-dairy Cattle 2750 49 134.750 13 35.750 170,50
Buffalo 0 55 0 7 0 0,00
Sheep 2500 5 12.500 0,16 400 12,90
Goats 500 5 2.500 0,17 85 2,59
Camels 125 46 5.750 1,9 237,5 5,99
Horses 75 18 1.350 1,6 120 1,47
Mules & Asses 25 10 250 0,9 22,5 0,27
Swine 5030 1 5.030 7 35.210 40,24
Poultry 15000 NE NE 0,018 270 NE
Totals 206.680 82.545 288,96
22%22%
65% SIGN.65% SIGN.
<3%<3%
6%6%
13%13%
43% SIGN.43% SIGN.
<1%<1%
43% SIGN.43% SIGN.
<1%<1%
<1%<1%
<1%<1%
<1%<1%
<3%<3%
<3%<3%
<3%<3%
<3%<3%
<1%<1%
58
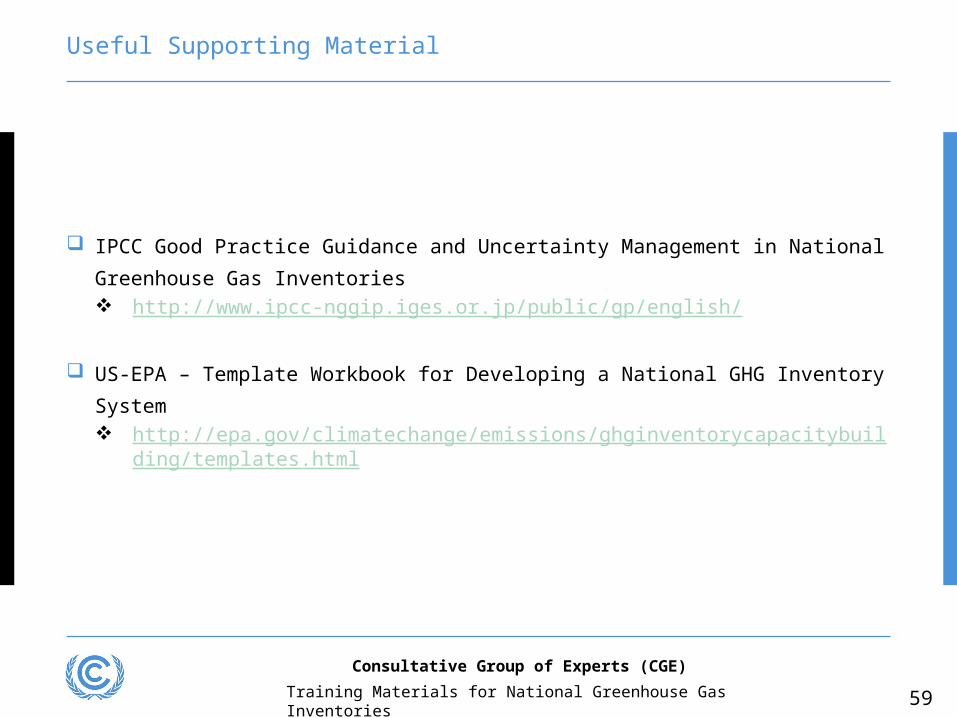
Useful Supporting Material
IPCC Good Practice Guidance and Uncertainty Management in National Greenhouse
Gas Inventories
http://www.ipcc-nggip.iges.or.jp/public/gp/english/
US-EPA – Template Workbook for Developing a National GHG Inventory System
http://epa.gov/climatechange/emissions/ghginventorycapacitybuilding/templates.html
59
Consultative Group of Experts (CGE)
Training Materials for National Greenhouse Gas Inventories