cfd modeling of flow induced vibration mechanism in...
TRANSCRIPT
CFD MODELING OF FLOW INDUCED VIBRATION MECHANISM IN SEA
WATER PIPING ON A REGASIFICATION TERMINAL PLATFORM
AHMAD BIN MORTAZA
A project report submitted in partial fulfilment of
the requirements for the award of the degree of
Masters of Engineering (Mechanical)
Faculty of Mechanical Engineering
Universiti Teknologi Malaysia
JUNE 2015

iii
Dedicated to Ayah & Mak,
Professor Dato’ Dr. Mortaza Mohamed & Datin Siti Aini Suriati Abdul Samad

iv
ACKNOWLEDGEMENT
To my dear wife, Hasliza binti Alias, first and foremost, deserves my utmost
gratitude for continually aiding me and pushing me across the finish line. Her love
and care have given me strength to make all this possible – And to all our children,
the source of my inspiration ~ Iman Hadfina, Iman Hasanah, Iman Humaira &
Muhammad…
I wish to express my u t m o s t sincere appreciation and full respect to my
supervisor, Associate Professor Dr. Kahar bin Osman, for all the encouragement,
sacrifice, guidance, critics and friendship. Without his continuous support and
wisdom, this project report would not have been the same as presented here.
Ahmad bin Mortaza
v
ABSTRACT
Vibration is a common problem in water piping system, particularly when it
involves multiple elbows. One of the sources of vibration is the turbulent flow in the
system. The objective of this project paper is to investigate the mechanisms that leads
to excessive vibration in the sea water discharge piping experienced on floating LNG
platform. The model is developed to simulate the actual conditions experienced at the
platform. The simulations were done using selected turbulent models, because the
Reynolds’s Number at any condition within the operating envelope is more than
4000. Upon completion of the simulations, focus on excitation at the wall is critical to
be done. The major mechanism of vibration is pressure difference within the fluid
flow. Thus, pressure and wall shear stress acting along the pipe wall need to be
analyzed to pin point whether there is any mechanism at work which will induce
vibration. The results show large pressure difference was observed between the inner
and outer elbows thus prompting high inclination to vibration. It was observed that
higher fluctuations of velocity and pressure near the wall as the Reynolds’s number
increases. The amplitudes of the fluctuations for both pressure and velocity were seen
to be close to linear in nature.

vi
ABSTRAK
Getaran adalah masalah biasa dalam sistem paip air, terutamanya apabila ia
melibatkan pelbagai siku. Salah satu sumber getaran adalah aliran gelora di dalam
sistem. Objektif kertas kerja ini adalah untuk menyiasat mekanisma yang membawa
kepada gegaran berlebihan pada sistem perpaipan air laut di atas platform GAC
terapung. Rekabentuk ini dibangunkan untuk membuat simulasi kepada keadaan
sebenar yang dihadapi di atas platform. Simulasi ini dibuat dengan menggunakan
model gelora, kerana nombor Reynolds’s pada apa jua keadaan di dalam rangkuman
operasi adalah lebih dari 4000. Selepas tamat simulasi, focus akan terarah kepada
getaran pada dinding paip. Mekanisma getaran adalah perubahan tekanan di dalam
aliran bendalir. Oleh yang demikian tekanan dan tekanan ricih yang bertindak pada
dinding paip hendaklah dianalisa untuk menentukan sama ada terdapat mekanisma
yang boleh menjadi punca getaran. Keputusan menunjukkan perbezaan tekanan besar
diperhatikan antara siku dalaman dan luaran. Keadaan ini mendorong kecenderungan
tinggi untuk getaran. Diperhatikan bahawa halaju dan tekanan berhampiran dinding
berubah dengan lebih tinggi dengan peningkatan nombor Reynolds. Perubahan pada
amplitude untuk kedua-dua tekanan dan halaju dilihat berkeadaan hampir linear.

vii
TABLE OF CONTENTS
CHAPTER TITLE PAGE
DECLARATION OF ORIGINALITY ii
DEDICATION iii
ACKNOWLEDGEMENTS iv
ABSTRACT v
ABSTRAK vi
TABLE OF CONTENTS vii
LIST OF TABLES ix
LIST OF FIGURES x
LIST OF SYMBOLS xii
1 INTRODUCTION 1
1.1 Background of The Research 2
1.2 Review of The Literature 4
1.3 Statement of Hypothesis 10
1.4 Problem Statement and Limitation 10
1.5 Scope of Research 11
1.6 Theoretical Framework 13
2 METHODOLOGY 14

viii
2.1 Flow Chart 15
2.2 Computational Fluid Dynamics 16
2.3 Boundary and Initial Condition 18
2.4 Simulation Based Modelling 23
2.4.1 Geometry Modelling 23
2.4.2 Mesh Modelling 25
2.4.3 Grid Independent Test 27
2.5 Mathematical Computation 29
3 PRESENTATION AND ANALYSIS OF DATA 31
3.1 Result Validation 31
3.2 Simulation by Standard k-ε Model 35
3.2.1 Typical Demand Simulation Result 35
3.2.2 High Demand Simulation Result 41
3.2.3 Low Demand Simulation Result 45
3.3 Simulation Using 2-equation Turbulent Model 48
4 CONCLUSIONS AND RECOMMENDATIONS 52
4.1 Conclusion 51
4.2 Recommendation 57
REFERENCES 59

ix
LIST OF TABLE
TABLE NO.
TITLE
PAGE
2.1 Flow rate Table 20
2.2 Turbulence Intensity Table 22

x
LIST OF FIGURES
FIGURE NO.
TITLE
PAGE
1.1 Layout of Intermediate Fluid Vaporizer (IFV) System 3
1.2 Computational Domains of Model and Velocity Magnitude
Along y-axis [1]
6
1.3 Velocity image with blue color is low velocity region [2] 7
1.4 Cross section result by T Zhang et al. for Pressure and
Velocity [3]
8
1.5 Model of Sea Water Heat Exchanger Discharge Piping 12
1.6 Theoretical Framework 13
2.1 Work Process Flowchart 15
2.2 Draft of Discharge Piping with Indicative Elbow
Numbering
24
2.3 Geometric Model with Boundary Condition 26
2.4 Geometric Model with 1,200,000 Meshes 27
2.5 Grid Independent Result Plot 29
3.1 Velocity Magnitude Along x-axis between 3rd and 4th
elbow
32
3.2 Velocity Contour Image of the 4th Bend 33
3.3 Velocity Contour of the 4th Elbow with Cross Section A-A 34
3.4 Pressure Contour (Pa) of the 4th, 5thand 6thElbow for Inlet
Velocity 3.7 m/s
36
xi
3.5 Velocity Contour (m/s) of the 4th, 5thand 6thElbow for Inlet
Velocity 3.7 m/s
37
3.6 Order of Tracer Line for Wall Values Analysis 38
3.7 Velocity Plot for Fluid Velocity 3.7 m/s 39
3.8 Pressure Plot for Fluid Velocity 3.7 m/s 40
3.8 Wall Shear Stress Plot for Fluid Velocity 3.7 m/s 41
3.9 Pressure Contour (Pa) of the 4th, 5thand 6thElbow for Inlet
Velocity 5 m/s
42
3.10 Velocity Contour (m/s) of the 4th, 5thand 6thElbow for Inlet
Velocity 5 m/s
43
3.11 Velocity Plot for Fluid Velocity 5 m/s 44
3.12 Pressure Plot for Fluid Velocity 5 m/s 44
3.13 Pressure Contour (Pa) of the 4th, 5thand 6thElbow for Inlet
Velocity 1 m/s
45
3.14 Velocity Contour (m/s) of the 4th, 5thand 6thElbow for Inlet
Velocity 1 m/s
46
3.15 Velocity Plot for Fluid Velocity 1 m/s 47
3.16 Pressure Plot for Fluid Velocity 1 m/s 47
3.17 Plot of Pressure Comparison of 2-Equation Turbulent
Models
49
3.18 Plot of Velocity Comparison of 2-Equation Turbulent
Models
50
3.19 Plot of Wall Shear Stress Comparison of 2-Equation
Turbulent Models
50
4.1 6th Elbow Pressure at inlet velocity 1 m/s (a), 3.7 m/s (b)
and 5 m/s (c)
54
4.2 6th Elbow Velocity at inlet velocity 1 m/s (a), 3.7 m/s (b)
and 5 m/s (c)
55

xii
LIST OF SYMBOLS
D - Diameter
r - Radius Of Curvature
g - Gravity = 9.81 m/s
ε - Turbulent Dissipation Rate
k - Turbulent Kinetic Energy,
l - Turbulent Length
υ - Dynamic Viscosity
P - Pressure
h - Height
NR - Reynolds Number
V, U,v - Velocity
L - Characteristic Length
A - Cross Sectional Area
ρsw - Density

1
CHAPTER 1
INTRODUCTION
Oil, gas and energy are an essential driving force for any modern economy.
The domestic oil and gas industry had contributed significantly to the growth of
Malaysian economy, particularly in peninsula Malaysia. Natural Gas is a natural
resource that eventually will deplete. There is a high likelihood that 1 to 2 percent per
year on average decline is expected in the coming decades if significant efforts in
upstream exploration, development and production were not being made. Due to this
fact, and the growing demand for natural gas by the growing industrialization in the
peninsula, resulted in the instability of the supply and demand from the national gas
supply grid.
In order for Malaysia to sustain and increase the supply for the demand of
natural gas, Malaysia regasification terminal project was officially endorsed on June
10th, 2010 under the 10th Malaysia Plan, under the oil, gas & energy NKEA. The main
reason of commissioning the regasification terminal is to enable Malaysia to import
Liquefied Natural Gas (LNG). This will boost natural gas supply in the national grid,
and avoid reoccurrence of gas curtailment due to process upset in gas processing
plants.
2
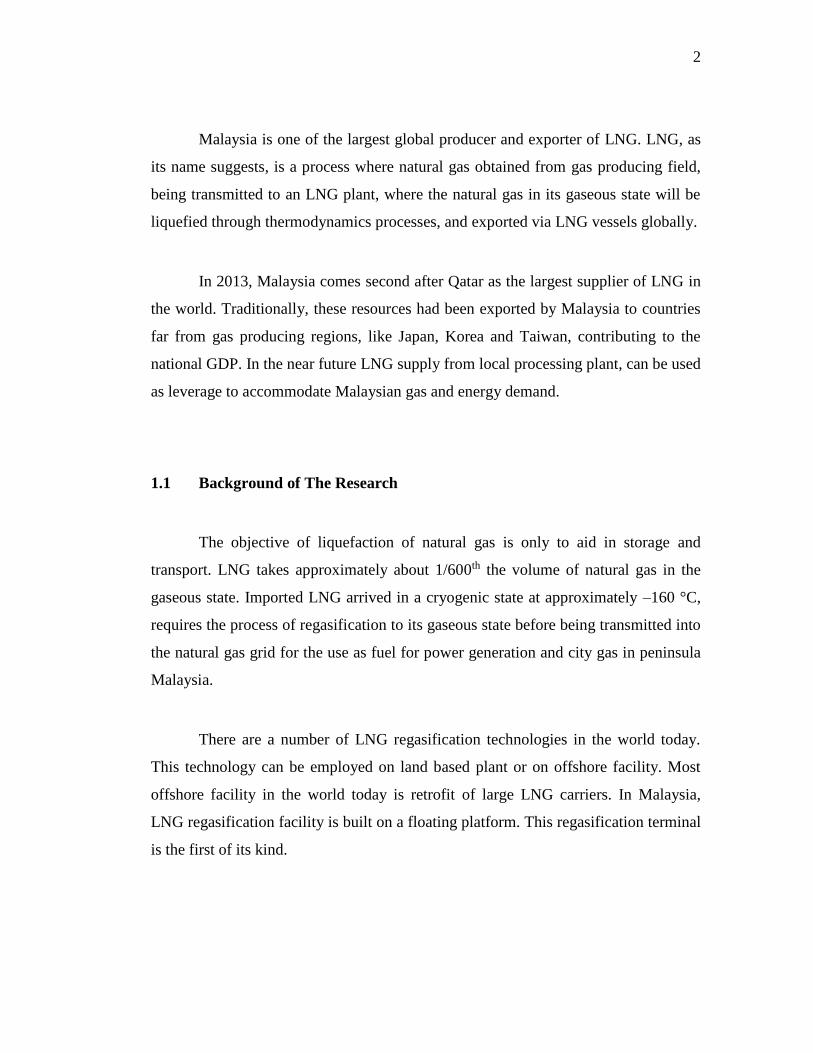
Malaysia is one of the largest global producer and exporter of LNG. LNG, as
its name suggests, is a process where natural gas obtained from gas producing field,
being transmitted to an LNG plant, where the natural gas in its gaseous state will be
liquefied through thermodynamics processes, and exported via LNG vessels globally.
In 2013, Malaysia comes second after Qatar as the largest supplier of LNG in
the world. Traditionally, these resources had been exported by Malaysia to countries
far from gas producing regions, like Japan, Korea and Taiwan, contributing to the
national GDP. In the near future LNG supply from local processing plant, can be used
as leverage to accommodate Malaysian gas and energy demand.
1.1 Background of The Research
The objective of liquefaction of natural gas is only to aid in storage and
transport. LNG takes approximately about 1/600th the volume of natural gas in the
gaseous state. Imported LNG arrived in a cryogenic state at approximately –160 °C,
requires the process of regasification to its gaseous state before being transmitted into
the natural gas grid for the use as fuel for power generation and city gas in peninsula
Malaysia.
There are a number of LNG regasification technologies in the world today.
This technology can be employed on land based plant or on offshore facility. Most
offshore facility in the world today is retrofit of large LNG carriers. In Malaysia,
LNG regasification facility is built on a floating platform. This regasification terminal
is the first of its kind.

3
The technology employed in the local LNG regasification facility is
Intermediate Fluid Vaporizer (IFV) technology, where liquid propane and seawater is
employed as thermal energy source. IFV uses an intermediate heat transfer fluid to
degasify LNG. Propane is used because it’s inherent low flash points that are ideal for
heat transfer and does not require a larger heat transfer surface contact area. This
meant that the design does not require heavier and larger regasification system. This
allows the package to be built on a floating platform.
Figure 1.1 Layout of Intermediate Fluid Vaporizer (IFV) System
Figure 1.1 shows the layout of an IFV system, where A and B are LNG-
Propane and Propane-Seawater heat exchangers respectively. Regasification of LNG
using IFV system, consist of two stages. In the initial stage, LNG is heated by an
intermediate fluid, which is propane in a heat exchanger, where the LNG absorbs the
heat from the propane vapor through plate heat exchanger, and the LNG will convert
4
to its gaseous state. Due to this heat loss, the propane will condense into its liquid
vapor state.
In order to continuously maintain heating of propane, sea water is used as the
thermal medium. The function of sea-water in this facility is only to heat up propane
into its gaseous state. Propane in gas state is also used as the heating medium to bring
the natural gas to ambient temperature required to send it out into the national grid for
use.
In this case study, the area of concern is on the discharge piping of sea-water
used for thermal expansion of propane. Upon operation, the regasification facility
experiences unusual vibration in its sea-water discharge piping, reported particularly
on the final bends. Vibration can occur due to flow turbulence within the piping
system. In order to predict the mechanism which maybe the root cause of the reported
occurrence, numerical approach will be applied on the discharged sea-water system.
1.2 Review of The Literature
It is a common occurrence, if a fluid flow through a piping system with
multiple elbows at high flow rates will result in a condition called “hammering”.
This can even be observed in household water system, where at times the sink faucet
shakes violently when in use. This is due to the fact that turbulent flow in a piping
system, which contains multiple elbows in its fitting, will result in velocity and
pressure fluctuation throughout the system. The vibration, can be amplified
enormously when dealing with large diameter, high flow rate piping system in the
industry.

5
The pressure and velocity profile throughout a pipe is practically impossible
to be measured physically. Further in the industry, where some point of pipes can be
inaccessible by man (e.g. submerged, buried, etc.), further impairs our ability to
determined and measure the required parameters. Thus, to indicate root cause of
problem, mathematical approach can be engaged to indicate approximately the active
parameters acting on any desired point within the system. This is a powerful tool for
the industry to determine the root cause and fix the problem.
The use of navier-stokes equation to make approximation of parameters had
been researched, study and applied widely. With the use of computational fluid
dynamics (CFD), critical parameters can be calculated and the result can almost
predict accurately the actual condition of the system.
Flow behavior in piping system using CFD, particularly in elbows has been
studied by several researchers such as H.P. Rani et al., A. Ono et al. and T. Zhang et
al.by means of CFD modeling and experimentation on test bench. The research is
done exclusively for turbulent flow. The focus is done particularly in the measures of
critical parameters variation at each point within the system, particularly at the region
where fluid is entering and exiting the elbow. In all the research, it was observed that
results obtained from CFD simulation is supports the result obtained from
experimental data.
The study done by H.P. Rani et al. discussed the flow accelerated corrosion in
3D elbows based on actual field problem. The study was conducted on carbon steel
piping, which bears relevance because similar piping material is used for
consideration. Figure 1.2 shows the model and velocity distribution of the study. This
research looks into flow through a three dimensional piping system with dual elbow
at relatively close proximity fitting configuration. The study looks into the velocity

6
profile of the second span vertical limb that plots velocity along the y-axis in the
piping centerline. In this study, realizable k – ε model ANSYS Fluent® (2009) was
used for evaluation. This model was selected because the study looks into the
turbulence kinetic energy and dissipation rate, which can be determined by the stated
model. It was found from the study that, the close proximity and high mass transfer
coefficient rate will result in high intensity of vortex and fluctuation of velocity
gradient and pressure. These conditions will increase flow accelerated corrosion. In
order to minimize the effect of high mass transfer coefficient, it was proposed that
vertical limb to be lengthened (i.e. increase the distance between elbows)[2]. The
study shows, that in close proximity bends, under turbulent flow, fluctuation of
velocity and pressure will occur along the system. Focus on fluctuation of velocity
and pressure on the wall was not emphasized in this study.
Figure 1.2 Computational Domains of Model and Velocity Magnitude Along y-
axis[2]
The research done by A. Ono et al, discussed the influence of elbow curvature
on flow structure at pipe elbow under high Reynolds number condition. The research
7
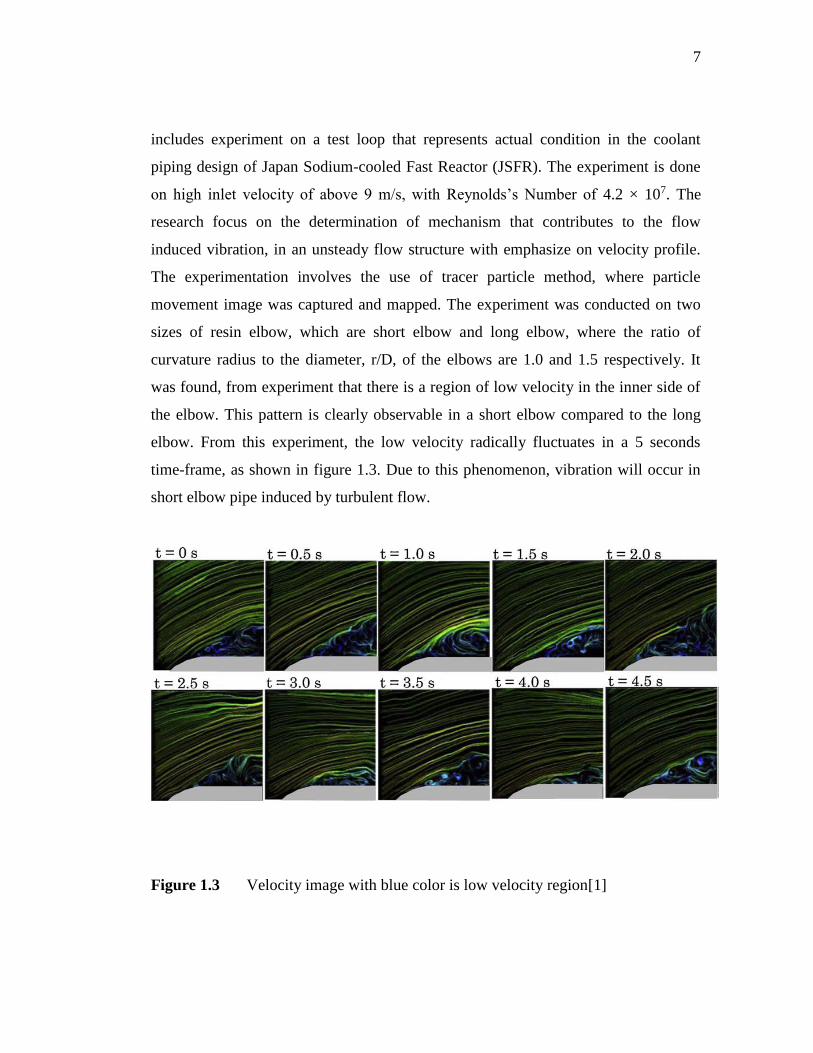
includes experiment on a test loop that represents actual condition in the coolant
piping design of Japan Sodium-cooled Fast Reactor (JSFR). The experiment is done
on high inlet velocity of above 9 m/s, with Reynolds’s Number of 4.2 × 10⁷. The
research focus on the determination of mechanism that contributes to the flow
induced vibration, in an unsteady flow structure with emphasize on velocity profile.
The experimentation involves the use of tracer particle method, where particle
movement image was captured and mapped. The experiment was conducted on two
sizes of resin elbow, which are short elbow and long elbow, where the ratio of
curvature radius to the diameter, r/D, of the elbows are 1.0 and 1.5 respectively. It
was found, from experiment that there is a region of low velocity in the inner side of
the elbow. This pattern is clearly observable in a short elbow compared to the long
elbow. From this experiment, the low velocity radically fluctuates in a 5 seconds
time-frame, as shown in figure 1.3. Due to this phenomenon, vibration will occur in
short elbow pipe induced by turbulent flow.
Figure 1.3 Velocity image with blue color is low velocity region[1]
8
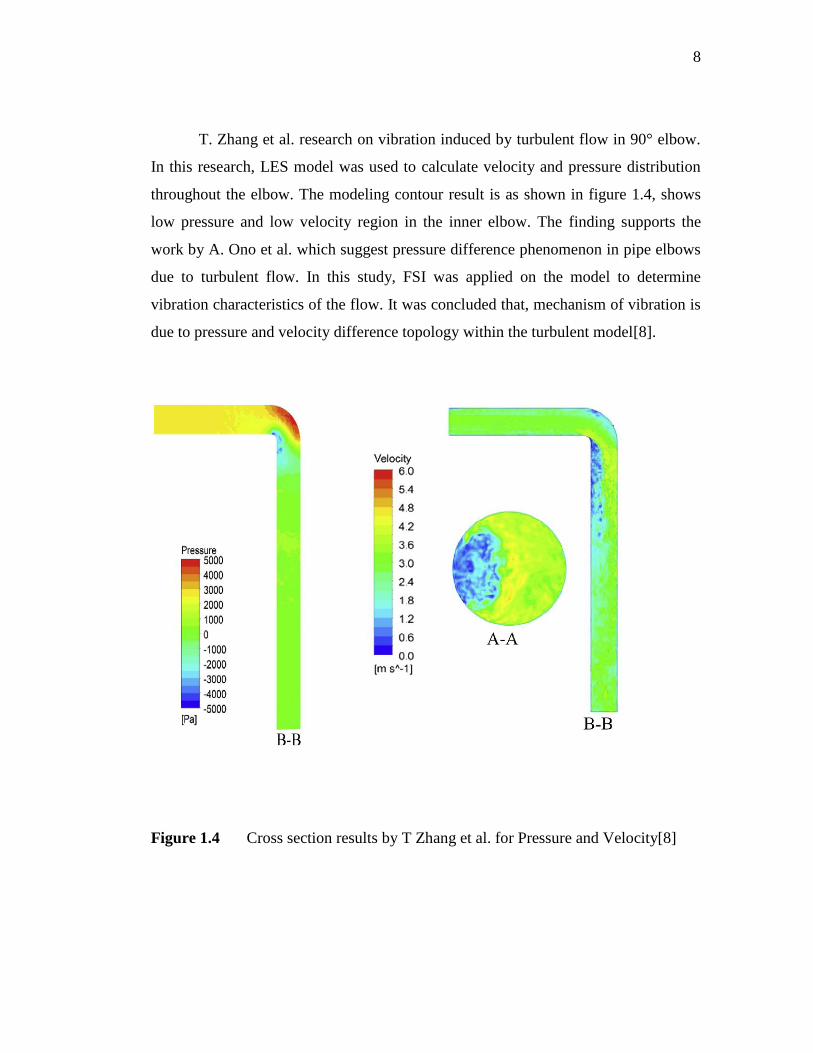
T. Zhang et al. research on vibration induced by turbulent flow in 90° elbow.
In this research, LES model was used to calculate velocity and pressure distribution
throughout the elbow. The modeling contour result is as shown in figure 1.4, shows
low pressure and low velocity region in the inner elbow. The finding supports the
work by A. Ono et al. which suggest pressure difference phenomenon in pipe elbows
due to turbulent flow. In this study, FSI was applied on the model to determine
vibration characteristics of the flow. It was concluded that, mechanism of vibration is
due to pressure and velocity difference topology within the turbulent model[8].
Figure 1.4 Cross section results by T Zhang et al. for Pressure and Velocity[8]

9
Turbulent flow results in fluid borne acoustic power in a 90° elbow’s
turbulent flow as found by S. A. Hambric et al. This research presents the findings on
both fluid dynamic and vibration behavior of an elbow. The model is a long elbow
with r/D value of 1.5. It simulates high velocity and Reynolds’s Number flow. To
model the flow behavior, the two equation SST k – ωmodelwas selected. The study
looks into the wall pressure and the wall shear stress. Velocity distribution was not
considered in this research. It was found that there is large pressure difference
between inner and outer elbow due to the turbulent flow through the model. From the
resulted shear stress contour, obtained it was seen that high shear stress concentrated
at the inner wall of the elbow, while low values of shear stress observed concentrated
at the outer elbow. Based on the obtained CFD model result combined with hydro-
acoustic modeling program, the statistical energy analysis was obtained. It was
suggested that, as the fluid flows through an elbow, strong pressure gradient
developed which generate secondary flow field downstream of the elbow. This
pressure fluctuation will excite the piping walls and emanate noise in the piping.
Based on this analysis, it was concluded that pressure and wall shear stress are the
mechanism that induces acoustic energy, leading to vibration[7].
HidemasaYamano et al. evaluate flow induced vibration methodology for
large diameter piping elbow. Similarly, the study is on turbulent flow, but with
different flow rate (i.e. the author classify by rated power, MWe). Each rated power
has different velocity and Reynolds’s Number, and these values will be higher with
higher rated power classification. Pressure is examined by means of power spectrum
densities (PSD), where it has a correlation[3].
YuzuruEguchi et al. research on high Reynolds’s Number flow for short
elbow pipe. This study favors LES, where flow behavior was modeled using
Smagorinsky-lilly, WALE and DNS and was compared. It was demonstrated that

10
higher separation region produces higher pressure fluctuations. But, the focus on the
study is more concentrated towards the boundary layer, where turbulent fluid
flowresults in varying separation region. Nonetheless, in this study it also shows
turbulent flow in pipe elbow produces pressure fluctuation[10].
While there are many research on turbulent flow through pipe has extensively
done, none have attemptedmodel of multiple bend piping system, and study the
behavior of the flow.
1.3 Statement of Hypothesis
The primary objective of this study is to focus on identifying parameter
variation using numerical approximation using Navier-Stokes equation and describe
discharge flow behavior of sea-water used as a thermal energy source in an LNG
regasification facility, with known fluid volume, inlet velocity and pressure at the
outlet.
Turbulent flow in a system generates flow fields that result in velocity and
pressure fluctuation throughout the system. Based on numerous researches, these
variations will result enough excitation that can generate energy to emanate flexing
on pipe surface.
Comparison will be made between instances of typical, high and low
operation demand. Based on the primary objective, it is to be determined the critical
parameters that affect the pipe walls, particularly on the bends.

11
1.4 Problem Statement and Limitation
Noise and vibration in piping elbow, is always associated with turbulence
flow generated by pressure drop. Generally in the industry solid mild steel pipe is
used to transmit process fluids. Fluid flow behavior inside a solid pipe or duct is
difficult to measure and quantify which will always become a stumbling block in a
Root Cause Analysis processes.
In the industry, vibration is a common norm in any system, which is managed
to avoid catastrophic failures. There is a set standard of critical limits introduced to
govern allowable vibration condition. If these limits were exceeded, review in the
system’s design need to be undertaken, repair and rerouting of piping, bracing of
piping structures, and installation of fittings need to be done, which at most of the
circumstances will be time consuming and costly.
At times due to design constraints, any piping system can have complicated
routing. In this facility, a simple sea-water discharge piping from the header to the
underwater sea level, have eight 90° tight elbows fabricated relatively in close
proximity. Due to these conditions, generation of secondary flow field is expected to
be compounded by the numbers of elbows. This is consistent with what was reported
by the facility of observable alarming vibration condition and unusual gravel sounds
within the piping elbows.
1.5 Scope of Research
12
Noise and vibration induced by developed turbulent flow in piping with elbow
are studied by several researchers such as S.A. Hambric [7], HidemasaYamano
[3]and J.L. Riverin [4]. Most of the research is on turbulent fluid flow in a single
elbow and dual elbow, with water as working fluid. However, the studies of sea water
flow, in multiple elbows in three directions have yet to be explored.
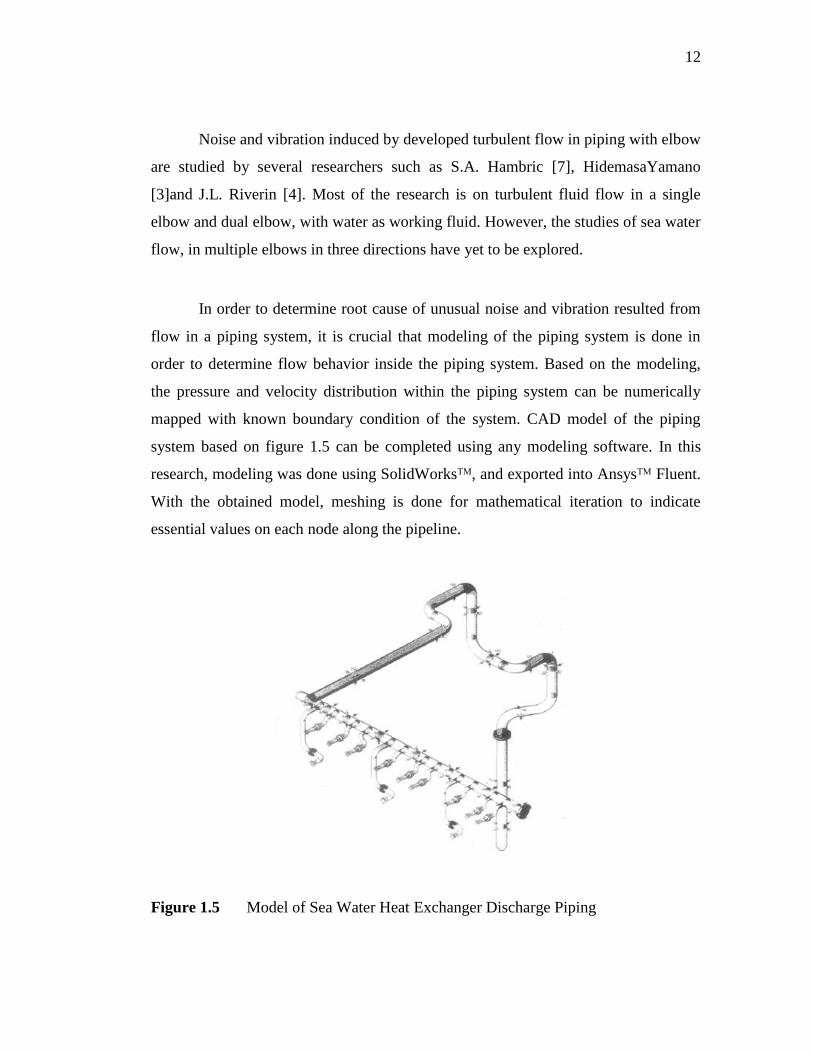
In order to determine root cause of unusual noise and vibration resulted from
flow in a piping system, it is crucial that modeling of the piping system is done in
order to determine flow behavior inside the piping system. Based on the modeling,
the pressure and velocity distribution within the piping system can be numerically
mapped with known boundary condition of the system. CAD model of the piping
system based on figure 1.5 can be completed using any modeling software. In this
research, modeling was done using SolidWorksᵀᴹ, and exported into Ansysᵀᴹ Fluent.
With the obtained model, meshing is done for mathematical iteration to indicate
essential values on each node along the pipeline.
Figure 1.5 Model of Sea Water Heat Exchanger Discharge Piping

13
1.6 Theoretical Framework
The framework of this research is represented by figure 1.6. The critical steps
will involve the development of mathematical and computational of a 3-D model for
the fluid flow in a multiple elbow piping.
Figure 1.6 Theoretical Frameworks
MODELING OF FLUID FLOW
OBJECTIVE
Assess Mechanism of
Vibration / Noise
METHODOLOGY
Mathematical
modeling with
theoretical result CFD
VARIABLE
Designing necessary
parameter / system
RESULT
Data comparison with
other study

60
REFERENCES
[1] A. Ono, N. Kimura, H. Kamide, A. Tobita (2011). Influence of elbow curvature on
flow structure at elbow outlet under high Reynolds number condition. Nuclear
Engineering and Design 241, 4409–4419
[2] H.P. Rani, T. Divya, R.R. Sahaya, VivekanandKain, D.K. Barua (2014). CFD study
of flow accelerated corrosion in 3D elbows. Annals of Nuclear Energy 69, 344–351
[3] HidemasaYamano, Masa-aki Tanaka, Nobuyuki Kimura, Hiroyuki Ohshima, Hideki
Kamide, Osamu Watanabe (2011) Development of flow-induced vibration
evaluation methodology for large-diameter piping with elbow in Japan sodium-
cooled fast reactor. Nuclear Engineering and Design 241, 4464–4475
[4] J.L. Riverin, E. de Langre, M.J. Pettigrew (2006) Fluctuating forces caused by
internal two-phase flow on bends and tees. Journal of Sound and Vibration 298,
1088–1098
[5] Mostafa H. Sharqawy, John H. Lienhard V, Syed M. Zubair (2009) Thermophysical
properties of seawater: a review of existing correlations and data.Desalination and
Water Treatment 16, 354–380
[6] Pope, S. B., (2003).Turbulent Flows. Cambridge: Cambridge University Press
[7] S.A. Hambric, D.A.Boger, J.B.Fahnline, R.L.Campbell (2010) Structure- and fluid-
borne acoustic power sources induced by turbulent flow in 90° piping elbows.
Journal ofFluidsandStructures26, 121–147
61
[8] T. Zhang, Y.O. Zhang, H. Ouyang (2014). Structural vibration and fluid-borne noise
induced by turbulent flow through a 90° piping elbow with/without a guide
vane.International Journal of Pressure Vessels and Piping, 1 – 12
[9] Versteeg, H.K., and Malalasekera, W., (2007). An Introduction to Computational
Fluid Dynamics: The Finite Volume Method, 2nd ed., Pearson Education Limited,
London, England.
[10] YuzuruEguchi, Takahiro Murakami, Masaaki Tanaka, HidemasaYamano (2010) A
finite element LES for high-Re flow in a short-elbow pipe with undisturbed inlet
velocity. Nuclear Engineering and Design 241, 4368–4378