cfd-based development, design, and installation of cost ...€¦ · cfd modeling in the design and...
TRANSCRIPT

CFD-based Development, Design, and Installation of Cost-effective NOx Control Strategies for Coal-fired Boilers Paper # Marc Cremer, James Valentine, Hong-Shig Shim, Kevin Davis, Bradley Adams Reaction Engineering International 77 West 200 South, Suite 210 Salt Lake City, UT 84101 J. J. Letcavits AEP Pro Serv Scott Vierstra SAVvy Engineering
ABSTRACT CFD modeling has found increasing use among combustion engineers in the design and evaluation of utility boiler retrofits, combustion optimization and NOx reduction technologies. This paper reviews three recent examples of combustion engineers using CFD modeling in the design and implementation of NOx reduction technologies. All three examples involve the staging of furnace combustion through the use of overfire air (OFA) to reduce NOx emissions. The first is for a 265 MWg B&W opposed-wall pulverized coal furnace, the second for a 530 MWg B&W opposed wall cyclone-fired boiler, and the third for a 500 MWg B&W supercritical pulverized coal furnace fired with burners on all four walls. Furnace simulations identified locations of highest flue gas mass flows and highest CO and O2 concentrations and were used by the combustion engineers to identify OFA port placement for maximum NOx reduction with lowest increases in unburned carbon in fly ash and CO emission. For the first two units, simulations with OFA additions predicted 34% and 80% reductions in NOx emissions, respectively, with minimal changes in CO concentration and unburned carbon. Plant CEM data for these units confirmed the accuracy of the modeling results for pre-retrofit and post-retrofit operation. For the third unit, potential overfire air configurations resulting in NOx reductions ranging from 24% to 43% are presented and impacts on CO emissions and carbon-in-fly ash are discussed.
INTRODUCTION The electric utility industry is facing aggressive NOx reduction requirements in coal-fired furnaces. Proven NOx control technologies are available that provide a range of performance over a range of operating and capital costs. For example, Selective Catalytic Reduction (SCR) has been proven to reliably achieve 75-85% NOx reduction in a substantial number of coal fired units. However, these reductions come at high capital and operating cost. In many existing units, application of SCR is cost prohibitive and, as a result, utilities are keenly interested in more cost-effective technologies. Often the selection and application of NOx control technologies requires careful consideration of the specific unit and system-wide objectives.

CFD modeling has found increasing use in the design and evaluation of utility boiler retrofits, combustion optimization and NOx reduction technologies. For example, over the past eight years Reaction Engineering International (REI) has used in-house software created specifically for fossil-fired boilers to perform CFD simulations of more than 100 utility boilers. Engineering evaluations have been completed to describe the performance and impact of NOx reduction technologies such as staging and overfire air, low NOx burners, visciated air and air preheating, co-firing of opportunity fuels, fuel blending, Rich Reagent Injection (RRI), Selective Non-catalytic Reduction (SNCR), gas reburning, and Fuel Lean Gas Reburning (FLGR). Boilers modeled range in size from 34 MW to 1300 MW and include cyclone, tangential, wall, vertical and stoker firing systems. Figure 1 shows the unit size distribution of cyclone, tangential and wall-fired units modeled by REI over the past eight years. The majority of these units were coal-fired, requiring modeling software capable of accounting for turbulent two-phase mixing, equilibrium (e.g., CO2, O2) and finite-rate (e.g., NOx) gas-phase chemical reactions, heterogeneous coal particle reactions (devolatilization and char oxidation) and radiant and convective heat transfer.
Figure 1. Distribution of utility boilers modeled by REI.
REI Utility Boiler M odeling
02468
1012141618
<200 MW 201-400 MW >400 MW
Unit Size (MW)
# of
Uni
ts
Cyclone T-Fired Wall-Fired
AEP Pro Serv has had experience in the design and installation of over 30 NOx reduction retrofits in various types of coal fired furnaces. These NOx reduction systems include OFA, burner alterations, and water injection schemes. AEP has developed a strong experience base with CFD analysis and has found it to be an effective tool in evaluating vendor claims, guiding system design and equipment integration, as well as for unit troubleshooting. In the hands of experienced combustion and CFD engineers, CFD modeling provides a valuable tool to evaluate impacts of potential burner and furnace alterations on NOx emissions, unburned carbon in fly ash, CO emissions and waterwall corrosion. It is
particularly useful in the evaluation of “one-of-a-kind” systems in which the experience base is limited. This paper describes how CFD modeling has been utilized in this manner to evaluate and design cost effective NOx reduction strategies applied to three coal-fired utility boilers.
Approach The evaluation described here requires the construction of a CFD model description of a unit under “baseline” operation, representative of typical full load operating conditions. Confidence in input descriptions and model validity is achieved by comparing these results with observations of unit performance that can include NOx and CO emissions, unburned carbon in ash, steam-side heat transfer, local temperatures and deposition patterns. Parametric simulations are then completed to evaluate impacts of burner alterations, combustion air optimization, and water injection. The simulations were carried out in series so that simulation results could be utilized to make incremental improvements to the designs. Based on the results of all simulations, specific burner modifications, OFA port arrangements, and water injection designs are recommended. The following two sections describe this approach in additional detail. A description of the CFD model is first given followed by a discussion of the approach used to develop a CFD model of each unit.
CFD Model The REI combustion models1 employ a combination of Eulerian and Lagrangian reference frames. The flow field is assumed to be a steady-state, turbulent, reacting continuum field that can be described locally by general conservation equations. The governing equations for gas-phase fluid mechanics, heat transfer, thermal radiation and scalar transport are solved in an Eulerian framework. The governing equations for particle-phase mechanics are solved in a Lagrangian reference frame. The overall solution scheme is based on a particle-in-cell approach.2 Gas properties are determined through local mixing calculations and are assumed to fluctuate randomly according to a statistical probability density function (PDF), which is characteristic of the turbulence. Turbulence is typically modeled with a two-equation k-ε model.3 Gas-phase reactions involving major species are assumed to be controlled by mixing rates and local chemical equilibrium - as opposed to pollutant species such as NOx and CO, which require appropriate descriptions of finite rate chemistry. Particle mechanics are computed by following the mean path for a discretized group of particles, or particle cloud, in a Lagrangian reference frame. Particle reaction processes include coal devolatilization, char oxidation, and gas-particle interchange. The dispersion of particles within the cloud and cloud expansion are based on statistics gathered from the turbulent flow field. Heat, mass, and momentum transfer effects are included for each particle cloud. The properties of the particle cloud are computed from a statistical average over the particles within the cloud. The properties of the local gas field are computed with an analogous ensemble averaging procedure. Particle mass and momentum sources are converted from a Lagrangian to an Eulerian reference frame by considering the residence time of each particle cloud within the computational cells.
The radiative intensity field and surface heat fluxes are calculated using the discrete ordinates method. Effects of variable surface properties and participating media (gas, soot and particles) are included. This paper reviews three recent examples of CFD modeling used in the design and implementation of OFA systems for an opposed-wall PC unit, a cyclone-fired unit, and a four-wall-fired PC unit.
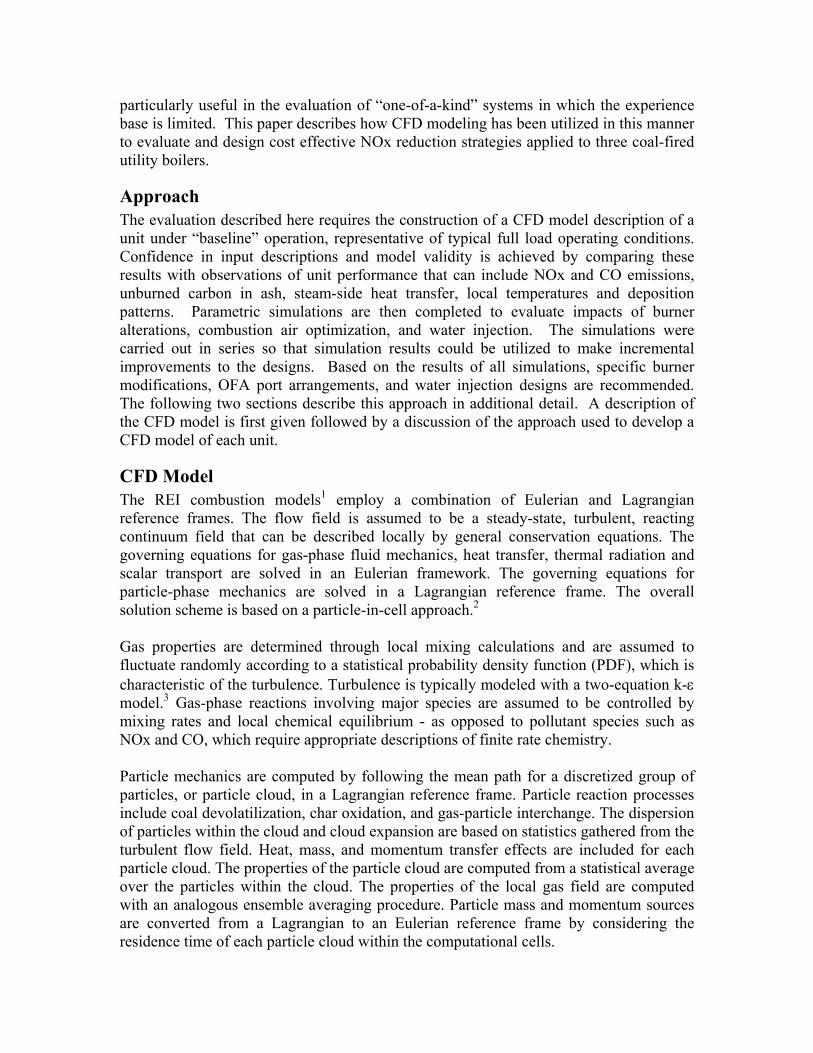
OPPOSED WALL-FIRED PC-FIRED BOILER OFA STUDY CFD modeling was used to provide a conceptual design and to evaluate NOx reduction performance of an overfire air (OFA) system in a 265 MWg B&W, subcritical, opposed-wall, pulverized coal-fired furnace. The furnace is fitted with eighteen Babcock Power (formerly Riley Stoker) CCV low NOx burners and baseline NOx emissions are approximately 0.6 lb/MMBtu. It was expected that OFA ports would be installed on both the furnace front and rear walls. Making use of symmetry, a 650,000 computational cell half-furnace model was developed. Basic features of the model are shown in Figure 2. Only three of the six front wall burners (for the half furnace model) are directly opposed by rear wall burners. Figure 2. Schematic of half furnace model for opposed wall fired boiler showing OFA port elevations.
OFA port elevation, rear wall
OFA port elevation, front wall
Superheat Pendants
Partial division wall at symmetry plane
Furnace exit
The goal of the CFD modeling study was the optimization of the overall OFA system design to minimize NOx emissions without increasing CO emissions or carbon in fly ash.

OFA system design considerations were the horizontal plane OFA port placement, port geometry, air jet velocity, appropriate burner size adjustments, and the level of furnace staging. Before beginning modeling evaluations, AEP Pro Serv engineering worked with modeling engineers to identify feasible locations for the OFA ports on the unit. An initial baseline simulation was performed to model the current operating condition and to verify the accuracy of the model. The baseline simulation predicted a furnace full load NOx emission of 0.58 lb/MMBtu, unburned carbon in fly ash (UBC) of 8%, and a model exit CO of 85 ppm. The CO level can be expected to decrease through the convective pass. With the exception of the unburned carbon level, which was a few percent higher than plant measurements, these values compared favorably with observed furnace operation. Based on consideration of residence time and construction constraints, an elevation ten feet above the top row of burners was selected for an initial OFA height. AEP Pro Serv engineers then examined simulation descriptions of CO concentration and upward flue gas flow to arrive at an effective port configuration. In this evaluation, the placement of the ports was the only variable used to bias the air injection and effectively target the pockets of fuel rich flow above the burner. Although practical limitations prevented a more involved analysis in this situation, port geometry and flowrate are also options for tailoring OFA implementations. Figure 3 shows the location of high CO concentrations and upward flue gas mass flux, respectively, at the proposed OFA port elevation ten feet above top burners. High CO is present near the rear wall and near the furnace center. The two lobes nearest the front wall originate from the top front wall burners below. The upward flue gas flow is highest in the rear half of the furnace, at least partially since there are no upper rear wall burners opposing the upper front wall burners. In the region above the upper front wall burners, the burner swirl results in downward mass flow at this elevation. Although the flow field shown in Figure 3 is for an unstaged furnace and could be expected to change somewhat with furnace staging, it provides a reasonable basis for locating OFA ports. Based on the predicted flow field information above, AEP Pro Serv engineers determined a preliminary OFA port layout. The preliminary design is shown in Figure 4. Since high CO regions are nearer the rear wall than the front wall and the upward mass flow is higher in the rear half of the furnace than in the front half, more ports were located on the rear wall than on the front. In addition, it was felt that no OFA port was necessary in the center of the front wall where the predicted flue gas flow is downward, as this would result in the introduction of oxygen rich air into the burner zone. Ports were sized for an OFA jet velocity of 170 ft/s with the lower furnace staged to 0.9. Interlaced ports as in Figure 4 rather than directly opposed OFA jets often help penetration.

Figure 3. Plots of CO concentration (left) and upward flue gas mass flux (right) at proposed OFA elevation.
Figure 4. Schematic of proposed OFA port locations on front and rear walls.
A portion of the secondary burner air was diverted to the OFA ports and consequently, the diameters of the primary coal pipe and secondary air inlet were altered to achieve a
specific OEM-recommended secondary to primary air velocity ratio for the CCV burners in this furnace. A summary of predicted results for the baseline and initial OFA cases is shown in Table 1. Key parameters included are the level of furnace staging in the burner zone, burner alterations made to retain recommended air velocity ratios, and predicted NOx, UBC and CO concentrations. NOx reductions greater than 30% were predicted with OFA, but UBC and CO concentrations also increased significantly. Note that the NOx, UBC and CO concentrations are at the exit of the computational model, approximately after the first section of superheat pendants and directly above the rear wall of the radiant furnace. NOx chemistry is substantially frozen beyond this point due to the low flue gas temperature and unburned carbon will decrease very little. However, CO concentrations can be expected to decrease significantly through the back pass of the boiler. A second OFA simulation was performed in order to find a configuration that would produce less of an increase in carbon in fly ash. In the second OFA configuration, the level of furnace staging was decreased to a stoichiometric ratio of 0.95 from 0.90 in the initial OFA simulation. This time only the primary burner diameter was altered to maintain the recommended secondary to primary air velocity ratio and the OFA ports were downsized to maintain a velocity of 170 ft/s. Predicted NOx remained low, at 0.38 lb/MMBtu, with only a moderate increase in carbon in fly ash - from 8% in the baseline simulation up to 13%. Although the simulations indicated that implementation of this configuration in the actual furnace would result in an increase in unburned carbon, the baseline UBC prediction appeared somewhat high suggesting that the final level could be lower than the prediction also, allowing the UBC to remain within acceptable levels. Results from these three CFD simulations of this furnace were used by AEP Pro Serv engineering to select an appropriate OFA system design. An overall summary of the simulations is shown in Table 1. Although NOx is reduced to the same level for both OFA configurations, the increase in carbon in fly ash is less severe for the revised OFA configuration. The furnace is less deeply staged in the revised OFA configuration, but burner alterations also have some impact on NOx. Although CO increased for both OFA configurations, much of the CO can be expected to burn to completion in the convective pass.
Table 1. Summary of simulation results showing the effect of different OFA designs.
Baseline Initial OFA Revised OFA
Furnace Staging None 0.90 0.95
Burner Alterations None Prim. & Sec. Primary
Predicted NOx (lb/MMBtu) 0.58 0.39 0.38
Predicted Carbon in Fly Ash 8% 20% 13%
Predicted CO (furnace exit) 85 ppm 801 ppm 1000 ppm

The installation of the OFA design, as modeled, was completed in the Spring of 2002. Although AEP Pro Serv has not yet fully optimized the system, the NOx emission rates are in agreement with the modeling effort and both stack CO emissions (<50 ppm) and unburned carbon in flyash levels (5-10%) are within acceptable ranges. A comparison of the NOx emission rates, prior to and after the OFA retrofit is illustrated in Figure 5.
Figure 5. Comparison of predicted and reported NOx emission rates before and after OFA retrofit.
CYCLONE FURNACE OFA STUDY CFD modeling was used by AEP Pro Serv engineering to provide a conceptual design and to evaluate NOx reduction performance of an overfire air (OFA) system in a 530 MWg B&W, supercritical, opposed-wall, cyclone-fired furnace. The furnace is fitted with eleven 10-foot diameter cyclones with radial primary burners. The cyclones are oriented 2 over 3 on the furnace front wall and 3 over 3 on the rear wall. The baseline NOx emissions were dependent upon the fuel source and the usage of water injection within the cyclone barrels. The CFD modeling effort was performed utilizing a current typical coal blend of 60% sub-bituminous PRB coal and 40% eastern bituminous coal. The baseline full load NOx emission for this fuel blend is approximately 1.8 to 1.9 lb/MMBtu. Prior to the application of OFA, this unit utilized water injection in the cyclone barrels to control visible opacity levels otherwise due to elevated NO2 levels at the stack. Limited data was available with the specified fuel blend and without water injection. The range of OFA elevation options were significantly greater than those limiting the OFA application for the previously discussed pulverized coal fired boiler, while still

having sufficient residence times to achieve burnout above the OFA level. The selection of modeled OFA options was determined by practical limitations created by buckstay elevations. Two OFA elevation options, approximately nineteen and twenty-six feet above the top cyclone centerlines, were considered. These options would provide adequate residence time above the ports for completion of combustion. Normal operation of a cyclone furnace results in a layer of slag on the cyclone’s barrel surfaces and the burning of nearly all of the coal on the surface of the slag layer. As such, the model study was conducted in two phases. First, the cyclone barrels were modeled with combusting particles. The cyclone barrel model consisted of ~350,000 computational cells. Secondly, the output of the cyclone barrel model, which included negligible organic solids, was applied to a full furnace model as 100% gas phase. A 750,000 computational cell full-furnace model was developed. Basic features of the models are shown in Figure 6. The goal of the CFD modeling study was the optimization of the overall OFA system design to maximize the reduction in furnace NOx emission while minimizing adverse effects such as increased CO emissions and increased carbon in fly ash. OFA system design considerations were the horizontal plane OFA port placement, port geometry, air jet velocity, appropriate cyclone combustion airflow distribution adjustments, and the level of staging within the cyclone barrels.
Figure 6. Illustrations of cyclone barrel and full furnace models.

An initial baseline simulation was performed to model the current operating condition and to verify the accuracy of the model. The baseline simulation predicted a furnace full load NOx emission of 1.96 lb/MMBtu and a model exit CO of 217 ppm. The CO level can be expected to decrease through the convective pass. Because the furnace model considers only gas phase flows, no unburned carbon in ash predictions were provided. The predicted emission values were in line with observed furnace operation. The staged cyclone barrel simulations were performed at a stoichiometric combustion air ratio of 0.9, while maintaining the flow in the primary burner at the same rates used under normal baseline, unstaged conditions. A comparison of the barrel model results is illustrated in Table 2. Notable are the predicted 13% reduction in the cyclone barrel NOx production and the 97% increase in the CO concentration at the barrel exit plane. These results were then applied to the furnace model under each of three OFA port arrangements and OFA jet velocities of 300 ft/sec. The baseline furnace model mass flow distributions actually suggested that this front to rear wall port arrangement should be reversed; however, furnace structural concerns with such a configuration resulted in the ports being located above the cyclone barrel centerlines. The staggered OFA pattern was also incorporated to achieve deeper jet penetrations and improved mixing patterns. Table 2. Cyclone Barrel Model Results for Baseline and Staged Operation.
Baseline Staged (SR = 0.9)
Barrel Exit Temperature (oF) 2897 2930
Barrel Exit CO (ppm) 36,680 72,214
O2 (%, wet) 5.49 4.01
Burnout (%) 98 98
NO ppm @ 3% O2 508 440
lb NOx / MMBtu 0.68 0.59 The results of the baseline and the staged furnace firing OFA options are presented in Table 3. The predicted average furnace exit NOx concentration for the baseline case was 1.96 lb-NOx/MMBtu. The initial staged furnace case (OFA Case1) resulted in a significant decrease in NOx emissions (~80%), but also a two-order of magnitude increase in predicted furnace exit CO concentrations. Note that this is not the expected furnace CO emission as the CO will continue to oxidize through the boiler backpass, but is significantly higher than the predicted baseline furnace CO levels. Staging also resulted in a predicted decrease in average flue gas temperature at the furnace exit.

Table 3. Cyclone Furnace Model Exit Predictions
Baseline OFA Case1 OFA Case 2 OFA Case 3
Temperature (oF) 2438 2299 2340 2364
CO (dry, ppm) 217 2093 413 324
O2 (dry, %) 2.79 2.93 2.80 2.80
NO @ 3% O2 (ppm) 1467 264 277 355
lb NOx / MMBtu 1.96 0.35 0.37 0.47 Figure 7 shows NOx concentration profiles in the furnace for the baseline and initial OFA (OFA Case 1) operations. Under the unstaged baseline conditions, NOx concentration continues to increase as a function of furnace height from the barrel inlet region in the lower furnace to the nose region. This is due to the continued formation of thermal NO as the fuel lean, high temperature combustion products mix in the lower furnace. The highly stratified species concentrations present at the barrel exit mix in the lower furnace, providing a flue gas with more uniform characteristics, although some species concentration gradients continue to exist due to non-uniform flow patterns in the furnace. NOx formation rates are greatest in the lower regions of the furnace where temperatures are highest. As heat is extracted through the furnace walls, gas temperatures decrease resulting in lower thermal NO formation rates. In the NOx concentration profiles for OFA Case 1 in Figure 7, high NOx concentrations are evident in the lower portion of the boiler consistent with the concentrations exiting the cyclone barrels. However unlike the baseline case where NOx concentrations increased in the furnace, NOx concentrations in the staged case drop rapidly in the lower furnace. This is due to two factors. The first is that the fuel rich environment in the lower furnace inhibits NOx formation. The second is that the fuel rich environment also allows for reburning conditions to exist that reduce NOx formed in the cyclone barrels. The combination of these two effects results in a significant drop in NOx concentrations at the furnace exit. It is interesting to note that the same high temperatures that contribute to NOx formation under fuel lean conditions also enhance the high NOx reduction rates under fuel rich conditions.
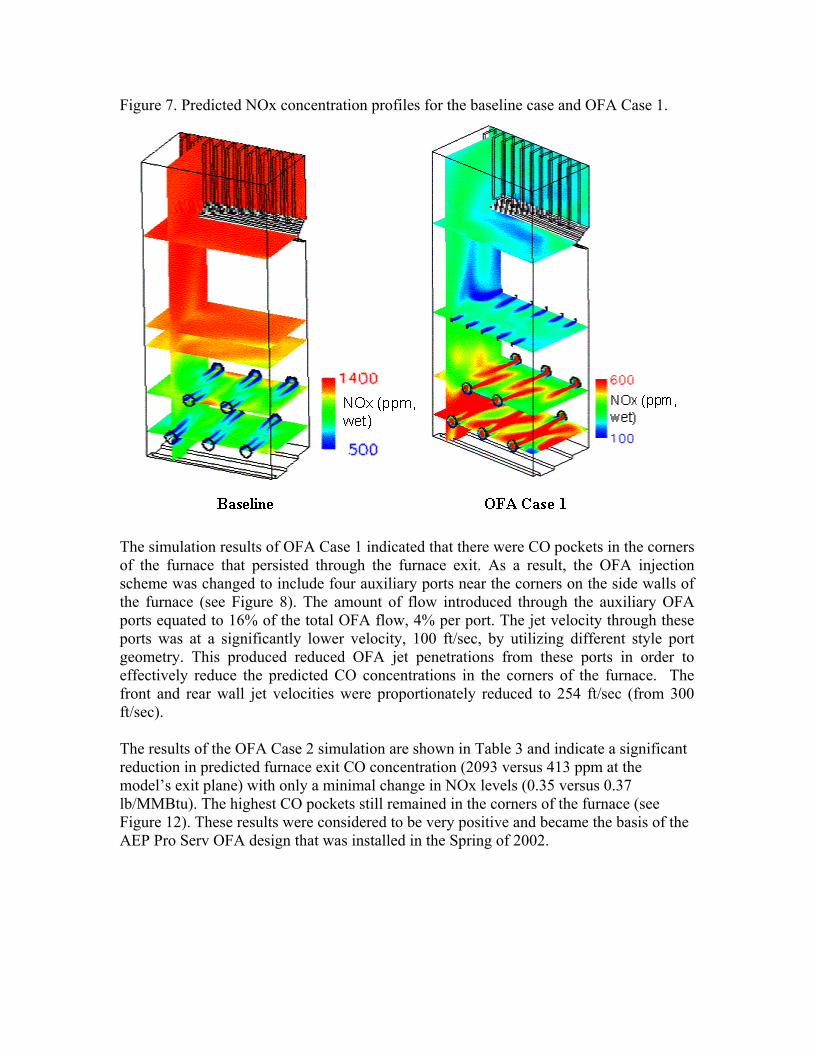
Figure 7. Predicted NOx concentration profiles for the baseline case and OFA Case 1.
The simulation results of OFA Case 1 indicated that there were CO pockets in the corners of the furnace that persisted through the furnace exit. As a result, the OFA injection scheme was changed to include four auxiliary ports near the corners on the side walls of the furnace (see Figure 8). The amount of flow introduced through the auxiliary OFA ports equated to 16% of the total OFA flow, 4% per port. The jet velocity through these ports was at a significantly lower velocity, 100 ft/sec, by utilizing different style port geometry. This produced reduced OFA jet penetrations from these ports in order to effectively reduce the predicted CO concentrations in the corners of the furnace. The front and rear wall jet velocities were proportionately reduced to 254 ft/sec (from 300 ft/sec). The results of the OFA Case 2 simulation are shown in Table 3 and indicate a significant reduction in predicted furnace exit CO concentration (2093 versus 413 ppm at the model’s exit plane) with only a minimal change in NOx levels (0.35 versus 0.37 lb/MMBtu). The highest CO pockets still remained in the corners of the furnace (see Figure 12). These results were considered to be very positive and became the basis of the AEP Pro Serv OFA design that was installed in the Spring of 2002.

Figure 8. Schematic of OFA Case 2 showing main and auxiliary OFA ports (left) and predicted CO concentration (left).
In order to assess the sensitivity of the unit CO and NOx concentrations, a third OFA design was also modeled. In OFA Case 3, the same OFA configuration used in OFA Case 2 was implemented at a lower elevation. The results summarized in Table 3 indicate that the lower port configuration did further reduce furnace exit CO levels (413 versus 324 ppm), but at the expense of increased NOx levels (0.37 versus 0.47 lb/MMBtu). AEP Pro Serv engineering determined not to pursue this design in favor of the OFA Case2 design. Figure 9 illustrates CEM data representative of operation before and after the installation of the OFA system. While the modeling results had indicated surprisingly good performance for the OFA design, the resultant full load NOx emissions on the unit under design conditions have validated the model predictions. This design has also resulted in stack CO concentrations of generally less than 50 ppm and average carbon in flyash levels on the order of 10% or less.

Figure 9. Comparison of predicted and reported NOx emission rates before and after OFA retrofit.
The actual OFA system was designed to achieve slightly deeper staging levels than the modeled 0.9 stoichiometric combustion air ratio. Firing under such conditions in the field has demonstrated some additional NOx control without adverse CO or carbon in ash effects.
FOUR WALL FIRED PC-FIRED BOILER OFA STUDY This four-wall-fired furnace is a 500 MW, B&W, supercritical, double reheat steam generator. The unit has a total of thirty circular burners, distributed among all four furnace walls, utilizing Babcock Power CCV low NOx burner technology. The original secondary air diverters have been replaced with Babcock Power’s updated flame stabilizing rings. The burners are distributed symmetrically between the front and rear walls with nine burners on both walls (4 over 5). Similarly there are six burners on each side wall (3 over 3). The unit was designed with flue gas recirculation (FGR). A schematic of the lower furnace with the proposed OFA port elevation is shown in Figure 10. Baseline NOx emissions and CO emissions are approximately 0.37 lb/MMBtu and 3,630 ppm, respectively. The goal of the CFD modeling study was the optimization of an OFA system design to maximize the reduction in furnace NOx emission while minimizing adverse effects such as increased CO emissions and increased carbon in fly ash. OFA system design considerations included the horizontal plane OFA port placement, port geometry, and air jet velocity. Before beginning modeling evaluations, AEP Pro Serv and SAVvy Engineering worked with modeling engineers to identify feasible locations for the OFA ports on the unit. Figure 10: Schematic of the four-wall-fired boiler showing proposed OFA elevation.

It was expected that OFA ports would be installed on both the furnace front and rear walls. An elevation 638’-10” was suggested for OFA port horizontal centerline; this would provide adequate residence time above the ports for completion of combustion. An initial baseline simulation was performed to model the current operating condition and to verify the accuracy of the model. The baseline simulation predicted a furnace full load NOx emission of 0.37 lb/MMBtu, unburned carbon in fly ash (UBC) of 12.5%, and a model exit CO of 3,630 ppm. The CO level can be expected to decrease as it moves through the convective pass. With the exception of the unburned carbon level, which was a few percent higher than plant measurements, these values were in line with observed furnace operation. To evaluate placement of OFA ports in the horizontal plane at an elevation 638’-10”, AEP Pro Serv considered the baseline CO concentration and upward flue gas flow. If the CO and flue gas flow fields are not uniform at this elevation, OFA air will be most effective if concentrated in higher CO and flue gas mass flow regions. Figure 11 (a) and (b) show the location of high CO concentrations and upward flue gas mass flux at the proposed OFA port elevation. High CO is present near the furnace center and left side wall. Similarly, high upward mass flux is present near the furnace center. Upon air and fuel injection, uniformly distributed mass flows from the burners at all four side walls meet at the furnace center and are pushed upward. In addition, hopper injection of FGR enhances this chimney effect. This results in a relatively stratified flow pattern as shown in the plot of O2 distribution (Figure 11 (c)). Although the flow field shown in Figure 11 is for an unstaged furnace and could be expected to change somewhat with furnace staging, it provides a reasonable basis for locating OFA ports.

Figure 11. CO concentrations (a) and upward flue gas mass flux (b) at proposed OFA elevation, and O2 distribution (c) at various horizontal and vertical planes in the furnace.
Based on the predicted flow field information above, AEP Pro Serv engineering determined a preliminary OFA port layout (OFA1) at a proposed elevation 638’-10”. The preliminary design is shown in Figure 12. Since CO concentration and upward mass flow peak in the center of the furnace, ports were located only on the front and rear walls to minimize the number of ports and to achieve more effective penetration to the furnace center. In addition, the ports were offset more from one side wall than the other to improve mixing. A jet angle of 73.58 degrees was used. Ports were sized for an OFA jet velocity of 185 ft/s with a lower furnace stoichiometric ratio of 0.92.

Figure 12: Schematic of proposed OFA port locations on front and rear walls (OFA1).
A summary of predicted results for the baseline and OFA cases is shown in Table 4. Key parameters included are the level of burner stoichiometry, and predicted NOx, UBC and CO concentrations. NOx reductions over 35% were predicted with OFA1, but UBC and CO concentrations also increased significantly from the baseline results (55% and 161%, respectively). Note that the NOx, UBC and CO concentrations are at the exit of the computational model. NOx concentrations will not change much beyond this point due to low flue gas temperatures. Unburned carbon can decrease slightly, but CO concentrations can be expected to decrease significantly through the back pass of the boiler.
Table 4. Summary of simulation results showing the effect of different OFA designs.
Baseline OFA1 OFA2 OFA3* OFA4+
Burner Stoichiometry 1.14 0.92 0.92 0.92 0.92
Predicted NOx (lb/MMBtu) 0.37 0.24 0.27 0.21 0.28
Predicted Carbon in Fly Ash 12.5% 19.4% 16.2% 20.6% 9.6%
Predicted CO (ppm, at furnace exit) 3,630 9,490 4,808 11,488 2,991
* In OFA3, flow rate of flue gas recirculation was reduced by half while the other operating conditions were the same as in OFA2. + In OFA4, 30 º coal spreader was implemented in the simulation. The additional OFA port configurations shown in Figure 13 were also investigated. A second OFA simulation (OFA2) was performed in order to find a configuration that would produce less of an increase in CO emission while limiting NOx emission. In OFA2 configuration, a combination of port location as well as biased air jet velocities through the ports were utilized and straight injection was employed. Three different sizes of ports

were located alternately with smaller ports at the wing on the front and rear walls (1 is smallest and 3 is largest port size). Interlaced arrangement such as OFA2 often provides effective mixing. Predicted NOx remained low (0.27 lb/MMBtu) with a slight increase from OFA1, but the predicted increase in carbon in fly ash was moderate by 30% over the baseline. Although the simulations indicated that implementation of this configuration in the actual furnace would result in an increase in unburned carbon, the baseline UBC prediction appeared somewhat high suggesting that the final level could be lower than the prediction also. Figure 14 shows the plots of CO concentration at the horizontal exit plane. Baseline, OFA1, and OFA2 consistently show high CO concentration in the center of the furnace where the high upward mass flux exists. Upward mass flux is high since flows from burners located at all four walls meet at the center and are pushed upward. In addition, up-fired FGR helps push mass upward faster, which hinders effective mixing of OFA. To better understand the effect of FGR, OFA3 case used half of the original FGR flow rate with the same OFA arrangement as in OFA2. Predicted NOx was even lower at 0.21 lb/MMBtu, because with reduced upward mass flux, longer residence time exists in fuel-rich region that helps limit NOx production. However, longer residence time in fuel-rich region resulted in significantly higher CO concentration and UBC at the furnace exit. In OFA4, the wing OFA ports were removed from both front and rear walls, as shown in Figure . By concentrating air flow to the center of the furnace, OFA can be utilized more efficiently for CO oxidation, since there is not much CO concentration near side walls at the exit as shown in Figure . In addition, 30º coal spreader was implemented to help reduce UBC. Predicted NOx remained low (0.28 lb/MMBtu), while CO emission and UBC were also reduced as shown in Table 4.
Figure 13: Proposed OFA lay outs for OFA2, OFA3, and OFA4.

Figure 14: Plot of CO concentration at the horizontal exit plane.
As illustrated by these results, AEP Pro Serv engineering and REI have been able to use CFD tools to select an effective OFA system design. For the final OFA configuration (OFA4), key parameters including NOx, UBC, and CO emission were reduced by 24%, 23%, and 18%, respectively, from the pre-retrofit configuration.
CONCLUSIONS Three examples have been cited to illustrate the approach and effectiveness of using CFD in the design and implementation of the overfire air NOx reduction technology in coal-fired utility boilers. Both studies were conducted using REI’s in-house CFD software specifically developed to account for all relevant combustion processes during coal combustion, including the formation and destruction of nitrogen oxides. CFD simulations of a 265 MWg B&W opposed-wall fired pulverized coal furnace fitted with Babcock Power CCV low NOx burners have been used by AEP Pro Serv to identify an OFA system design that will maximize the reduction in furnace NOx emissions while minimizing adverse effects such as increased CO emissions and increased carbon in fly ash. Modeling results showed NOx reductions over 30% could be achieved with either of two OFA designs, one with the boiler operating at a stoichiometric ratio of 0.90, the other at 0.95. Although NOx is reduced to the same level for both OFA configurations, the increase in carbon in fly ash is less severe for the higher stoichiometric ratio OFA configuration. The furnace is less deeply staged in this case, but burner alterations also have some impact on NOx and appear to compensate for the difference in furnace staging. Although predicted furnace exit CO increased for both OFA configurations over

the baseline, much of this CO has been shown through field data to be oxidized in the boiler convective pass. CFD simulations of a 530 MWg B&W opposed-wall, cyclone-fired furnace with eleven 10 foot diameter cyclones have been used by AEP Pro Serv to identify an OFA system design that will significantly reduce in furnace NOx emission while minimizing adverse effects such as increased CO emission and increased carbon in fly ash. Modeling results showed NOx reductions over 75% could be achieved with the resultant OFA design with a 20% difference between two OFA elevation options. Although predicted furnace exit CO increased for the OFA configuration over the baseline, much of this CO differential has been shown through field data to be oxidized in the boiler convective pass. CFD simulations of a 500 MW B&W, supercritical, four wall-fired pulverized coal furnace fitted with Babcock Power CCV low NOx burners have been used by AEP Pro Serv to identify an OFA system design that will maximize the reduction in furnace NOx emission while minimizing adverse effects such as increased CO emission and increased carbon in fly ash. Modeling results showed NOx reduction over 20% could be achieved while carbon in fly ash and CO emissions were reduced by 23% and 18%, respectively, with OFA4 design. Although NOx is reduced more in OFA1, OFA2, and OFA3 configurations, the increases in carbon in fly ash and in exit CO over the baseline are severe showing 30 – 65% and 32 – 216% increases, respectively. However, much of the predicted furnace exit CO would be oxidized in the boiler convective pass. For the first two examples, field-testing and optimization performed by AEP Pro Serv engineering confirmed the CFD predictions of NOx reduction and demonstrated the importance and value of accurate CFD modeling when combined with combustion engineering expertise to successful in-furnace NOx control designs. The CFD modeling results were shown to be very reliable, and are considered essential to optimal design development. OFA systems for the third example are not yet implemented.
ACKNOWLEDGMENTS The OFA modeling work described herein was supported by funding from American Electric Power (AEP). AEP Pro Serv provided engineering management, technical direction and optimization of the implemented OFA design. Some of the modeling results presented here for the pc-unit were previously published in an ASME paper4 and are used here with permission of ASME.
REFERENCES 1. Bockelie, M.J., Adams, B.R., Cremer, M.A., Davis, K.A., Eddings, E.G., Valentine,
J.R., Smith, P.J., Heap, M.P., Computational Simulations of Industrial Furnaces, Computational Technologies For Fluid/Thermal/Chemical Systems with Industrial Applications, PVP-Vol. 377-2, ASME, 1998, pp. 117-124.
2. Crowe, C.T., and Sharma, M.D., and Stock, D.E., Journal of Fluids Engineering, 1977, 99, pp. 325-332.
3. Mathematical Models of Turbulence, Launder, B.E., and Spaulding, D.B., Academic Press: London, 1972.

4. Adams, B., Cremer, M., Valentine, J., Bhamidipati, V., Letcavits, J., O’Connor, D., and Vierstra, S., Use of CFD Modeling for Design of NOx Reduction Systems in Utility Boilers, Proceedings of the 2002 International Joint Power Generation Conference, ASME, Phoenix, AZ, June, 2002.
KEY WORDS CFD Modeling OFA NOx CO