cfd analysis of ozone reaction with human surface
TRANSCRIPT

The Pennsylvania State University
The Graduate School
College of Engineering
CFD ANALYSIS OF OZONE REACTION WITH HUMAN SURFACE: INFLUENCE
OF INDOOR AIR FLOW CONDITIONS AND SURFACE REACTIVITY
A Thesis in
Aerospace Engineering
by
Sagar Sangameswaran Ananthanarayanan
2016 Sagar Sangameswaran Ananthanarayanan
Submitted in Partial Fulfillment
of the Requirements for the Degree of
Master of Science
August 2016

ii
The thesis of Sagar Sangameswaran Ananthanarayanan was reviewed and approved* by the
following:
Donghyun Rim Assistant Professor of Architectural Engineering Thesis Co-Advisor Susan Stewart Senior Research Associate and Associate Professor of Aerospace Engineering &
Architectural Engineering
Thesis Co-Advisor
George A. Lesieutre
Professor of Aerospace Engineering
Head of the Department of Aerospace Engineering
*Signatures are on file in the Graduate School
iii
ABSTRACT Ozone reaction with the human body surface can significantly influence breathing zone ozone
concentrations. Human exposure to ozone and its reaction products may also adversely affect
health and comfort. Ozone uptake to indoor surfaces has been characterized for many building
materials; however, limited information is available on how ozone reaction with human surface is
influenced by human surface reactivity and airflow around human body. The objectives of this
study are 1) to investigate ozone reaction with human surfaces depending on indoor ventilation
conditions; 2) to examine the breathing zone concentration of ozone considering reactivity of
human skin oil and clothing; and 3) to explore the effect of reaction probability on ozone mass
transfer rate.
A computational fluid dynamics (CFD) simulation was verified and validated with previously
published chamber experiments. The validated CFD models were applied further to examine the
ozone reaction with the human surface in varying airflow conditions. Effects of varying degrees
of human surface reactivity on the breathing zone concentration were examined.
For typical indoor environments with air change rate < 5 h-1, the ozone mass transfer rate
(deposition velocity) was in the range of 8-10 m/h with perfect sink condition. Parametric analysis
results reveal that surface reactivity of the human body has a larger influence than air change rate
and ventilation pattern. The breathing zone ozone concentration is also strongly influenced by
surface reactivity. With a supply ozone concentration of 100 ppb and a transport-limited rate at the
human surface (such as human skin oil), the breathing zone concentrations are in the range of 81-
97 ppb, while the range is 96-99 ppb with lower surface reaction rate.
These results imply that the reaction probability of the human surface has a significant impact on
human exposure to ozone and reaction byproducts.

iv
TABLE OF CONTENTS
List of Figures ............................................................................................................ v
List of Tables ............................................................................................................. vi
List of Appendix Figures ........................................................................................... vii
Acknowledgments ..................................................................................................... viii
Nomenclature ............................................................................................................. ix
Chapter 1 Introduction ................................................................................................. 1
Ozone and health effects ............................................................................... 1 Indoor exposure to ozone: building and aircraft cabin ................................. 1 Breathing zone concentration ........................................................................ 2 Ozone mass transfer rate ............................................................................... 2 Objectives ...................................................................................................... 3
Chapter 2 Methods ....................................................................................................... 4
CFD model description.................................................................................. 4 Grid sensitivity analysis and model validation .............................................. 5 Simulation of ozone-surface reaction depending on airflow condition......... 9 Surface reaction probability .......................................................................... 11
Chapter 3 Results and discussion ................................................................................. 13
Air flow distribution, temperature and age of air in the vicinity of human
body ............................................................................................................... 13
Deposition velocity ........................................................................................ 16
Effects of surface reactivity on deposition velocity ...................................... 18
Breathing zone ozone concentrations ................................................................. 21
Chapter 4 Conclusions and future work ........................................................................ 24
References .................................................................................................................... 26
Appendix A Mesh for different grid sizes .................................................................. 29
Appendix B Transient ozone concentration ................................................................ 30

v
LIST OF FIGURES
Figure 2-1: (a) CFD model of ventilated room (b) mesh ............................................. 5
Figure 2-2: Simulation with ventilation rate of 1 h-1 and perfect sink condition at
human surface: vertical (z-axis) velocity profile 25 cm above head for grids of
cell sizes (a) 50k (b) 80k (c) 120k (d) 150k; and (e) mass transfer coefficients .. 6
Figure 2-3: (a) floor air supply (b) ceiling air supply .................................................. 9
Figure 3-1: Velocity distribution (a) buoyancy-driven flow (b) momentum-driven
flow; temperature distribution (c) buoyancy-driven flow (d) momentum-driven
flow ....................................................................................................................... 14
Figure 3-2: Age of air (a) buoyancy-driven flow (b) momentum-driven flow ............ 16
Figure 3-3: Deposition velocity as a function of ventilation rate (1-10 h-1) and surface
reactivity (ozone concentration at the occupant surface from 0 to 80 ppb) under
(a) buoyancy-driven flow (b) momentum-driven flow......................................... 17
Figure 3-4: Effects of surface reactivity on deposition velocity: (a) buoyancy-driven
flow (b) momentum-driven flow. ......................................................................... 18
Figure 3-5: Breathing zone concentration as a function of ventilation rate (1-10 h-1)
and surface reactivity (ozone concentration at the occupant surface from 0 to 80
ppb): (a) buoyancy-driven flow (b) momentum-driven flow ............................... 22
Figure 3-6: Ozone concentration near the breathing zone (a) buoyancy-driven flow
at 1 h-1; (b) momentum-driven flow at 1 h-1; (c) buoyancy-driven flow at 3 h-1;
(d) momentum-driven flow at 3 h-1; (e) buoyancy-driven flow at 5 h-1;
(f) momentum-driven flow at 5 h-1. ...................................................................... 23
vi
LIST OF TABLES
Table 2-1: Results from literature ................................................................................ 8
Table 2-2: Boundary conditions .................................................................................. 10
Table 3-1: Summary .................................................................................................... 20

vii
LIST OF APPENDIX FIGURES
Figure A-1: Mesh contours around the human body for grid sizes: (a) 50k (b) 80k
(c) 120k and (d) 150k cells ........................................................................................ 29
Figure B-1: Ambient ozone concentration vs physical time at two surface conditions:
(a) buoyancy-driven flow at 3 ACH (b) momentum-driven flow at 3 ACH (c)
buoyancy-driven flow at 10 ACH (d) momentum-driven flow at 10 ACH ......... 30

viii
ACKNOWLEDGEMENTS
I express my heartfelt gratitude to my co-advisor, Dr. Donghyun Rim, for his prized guidance,
expertise and support through every phase of my research.
I wish to record my gratefulness to my co-advisor, Dr. Susan Stewart, for her kindness and valuable
assistance during times of need.
I would also like to thank Dr. George A. Lesieutre, for providing the opportunity to earn Master
of Science degree in Aerospace Engineering at the Pennsylvania State University.

ix
NOMENCLATURE
Abbreviations
CFD Computational fluid dynamics
UV Ultraviolet
VOCs Volatile organic compounds
U.S. EPA United States Environmental Protection Agency
ORPHS Ozone reaction products associated with human surfaces
SST Shear stress transport
ppb Parts per billion
ppm Parts per million
ACH Air changes per hour
Symbols
𝑣𝑑 Deposition velocity m/h
𝐶𝑠 Supply concentration ppb
𝐶𝑒𝑥 Exhaust concentration ppb
𝐶𝑏 Bulk/ambient concentration ppb
𝑄 Volumetric flow rate m3/h
𝐴ℎ Area of human surface m2
𝐴𝑖 Age of air at location 𝑖 min
𝐶𝑖 Concentration at location 𝑖 ppb

x
vt Transport-limited deposition velocity cm/s
Reaction probability
⟨𝑣⟩ Boltzmann velocity cm/s

1
Chapter 1
Introduction
Ozone and health effects
Ozone is a colorless and odorless gas, which serves as a protective shield against the sun's harmful
ultraviolet (UV) radiation in the stratosphere (Devlin et al., 1997). However, in the troposphere,
the very same compound can act as a pollutant with a multitude of potential associated adverse
health effects. The majority of ground-level ozone is formed when nitrogen oxides (NOx), carbon
monoxide (CO), and volatile organic compounds (VOCs) comprised mainly of hydrocarbons react
in the presence of UV radiation from the sun (Comrie, 1990; Devlin et al., 1997). Even low levels
(20 ppb) of ozone exposure can cause adverse health symptoms such as coughing, chest pain,
shortness of breath, wheezing, throat irritation, airway inflammation and asthma (Lippmann, 1989;
U.S. EPA, 1996; Devlin et al., 1997).
Indoor exposure to ozone: building and aircraft cabin
Ozone transport from outdoors to indoors via ventilation and infiltration can be emitted by indoor
sources such as photocopiers, laser printers, electrostatic precipitators or air filtering devices
(Devlin et al., 1997; Weschler, 2000; Poppendieck et al., 2014) such as ozone generators and
ionizers. The other important domain of ozone exposure is commercial aircrafts that typically
cruise at an altitude of 39,000 ft. In the heights of the upper troposphere or lower stratosphere
(Spengler et al., 204), ozone concentrations range from hundreds of ppb to ppm. In addition to

2
the direct impact of inhalation of ozone, it is also important to consider the effects of ozone derived
products on the cabins’ occupants. A number of studies have shown that ozone reactions with
indoor surfaces and hydrocarbon contaminants (e.g., cleaning/scenting agents) can form
formaldehyde, other aldehydes, ketones, and organic acids (National Research Council, 2002).
Other than formaldehyde, which is both a carcinogen and a respiratory and ocular irritant, the
potential adverse health effects of such compounds include irritations to airway passage, skin and
eyes (Clausen et al., 2001; Anderson et al., 2007).
Breathing zone concentration
Concentration of ozone in the breathing zone can be significantly lesser than that in the ambient
zone of the room due to the chemical reactions between ozone and human skin and clothing
surfaces. Contrariwise, an increase in concentration of ozone reaction products associated with
human surfaces (ORPHS) in the breathing zone, relative to the concentration in the ambient zone
is predicted (Rim et al., 2009). Mass transfer rate of ozone in the human surface boundary layer
strongly depends on indoor airflow and surface reactivity (Nazaroff et al., 1993). Such parameters
also influence the rate formation of ozone reaction byproducts.
Ozone mass transfer rate
In addition to evaluating the breathing zone concentration, the ozone-human reaction can be
quantified by another term called mass transfer rate or deposition velocity. A number of studies

3
pertaining to building as well as aircraft cabin domains have been conducted to record the values
of deposition velocity. Such values are recorded in an experimental setup over a range of
ventilation rates (Rai et al. (2014), Wisthaler and Weschler (2010), Pandrangi and Morrison
(2008), and Tamas et al. (2006)). Rim et al. (2009) and Rai et al. (2012) used computational solvers
to find the ozone mass transfer rates in building and aircraft cabin geometries respectively.
The present study uses these measurements to validate the CFD model and conduct a quantitative
analysis on the influence of ventilation and surface conditions on ozone uptake to the human
surface.
Objectives
Based on this background, the objectives of the present study are 1) to investigate ozone reaction
with human surfaces depending on indoor ventilation conditions; 2) to examine the breathing zone
concentration of ozone considering reactivity of human skin oil and clothing; and 3) to explore the
effect of reaction probability on ozone mass transfer rate. Considering the range of indoor
environment conditions, the present study examines the effects of indoor airflow and surface
reactivity on ozone-surface reaction dynamics.

4
Chapter 2
Methods
Computational fluid dynamics (CFD) simulation is used that is verified and validated by previous
ozone model. Grid sensitivity analysis has been performed, using the validated CFD model,
deposition velocities and reaction probabilities were calculated for different ventilation conditions
and varying degrees of reaction probability. Independent variables included ozone supply
concentration and human surface reactivity. The characteristics of ozone reaction with human
surface are examined under two representative indoor air flow patterns: momentum-driven flow
and buoyancy-driven flow.
CFD model description
A commercial CFD solver, Star-CCM+ is used to construct the geometry and perform the analysis.
The dimensions of the room are 4m x 4m x 3.63m (Figure 2-1). Human geometry of area 1.583
m2 is incorporated into the setup in a seated posture and it represents an ozone sink. This study
uses the human geometry modeled by Nilsson et al. (2007).

5
Figure 2-1: (a) CFD model of ventilated room (b) mesh
Grid sensitivity analysis and model validation
To perform the grid sensitivity analysis, impact of computational grid resolution was studied by
comparing four different cell counts cases (50,000, 80,000, 120,000 and 150,000 cells). A
polyhedral mesher was used as it can predict local velocity gradient with a reasonable accuracy
and handle re-circulating indoor airflow better than tetrahedral mesh. For all the four cases, the
human body is of very fine mesh size down to around 10 mm to capture the detailed airflow around
the body. The velocities that represent the upward thermal plume are the largest and are measured
at eight point probes covering a horizontal circular area of diameter 0.25 m above the head. A
surface averaged velocity is also calculated to avoid inaccuracy that occurs due to large velocity
gradients within the plume (Rim and Novoselac, 2009). Figure 2-2 shows that grid resolution has
a minimal influence on vertical velocity above the head.
4 m
4 m
3.63 m
Air
supply
Air
supply4 m
4 m
3.63 m
Exhaust Exhaust
(a) (b)

6
0.00
0.05
0.10
0.15
0.20
0.25
0.00 0.05 0.10 0.15 0.20 0.25 0.30
Hei
ght
(m)
Vertical velocity (m/s)
(a)
Range of
point
velocities
0.00
0.05
0.10
0.15
0.20
0.25
0.00 0.05 0.10 0.15 0.20 0.25 0.30
Vertical velocity (m/s)
(b)
Surface
averaged
velocity
Range of
point
velocities
Surface
averaged
velocity
0.00
0.05
0.10
0.15
0.20
0.25
0.00 0.05 0.10 0.15 0.20 0.25 0.30
Hei
gh
t (m
)
Vertical velocity (m/s)
(c)
Surface
averaged
velocity
Range of
point
velocities
0.00
0.05
0.10
0.15
0.20
0.25
0.00 0.05 0.10 0.15 0.20 0.25 0.30
Vertical velocity (m/s)
(d)
Surface
averaged
velocity
Range of
point
velocities

7
Figure 2-2: Simulation with ventilation rate of 1 h-1 and perfect sink condition at human surface:
vertical (z-axis) velocity profile 25 cm above head for grids of cell sizes (a) 50k (b) 80k (c) 120k
(d) 150k; and (e) mass transfer coefficients
With regard to mass transfer coefficient, the ozone deposition velocity is calculated. It is
determined from Equation (1).
𝑣𝑑 = (𝐶𝑠−𝐶𝑒𝑥) ×𝑄
𝐶𝑏 × 𝐴ℎ (1)
In Equation (1), 𝑣𝑑 = deposition velocity (m/h), 𝐶𝑠 = supply ozone concentration (ppb), 𝐶𝑒𝑥 =
exhaust ozone concentration, 𝐶𝑏 = bulk/ambient ozone concentration, 𝑄 = volumetric flow rate
(m3/h), and 𝐴ℎ = area of human surface (m2). Note that 𝐶𝑏 is calculated as the surface averaged
ozone concentration over a hollow cuboid in a vertical plane 1 m away from the occupant on all
four sides.
It ranged from 7.36 m/h to 7.73 m/h for the four grid sizes, with the gradient decaying beyond
120,000 cell size. The calculated range of values agrees well with other experimental and
6
6.5
7
7.5
8
Grid 1: 50k Grid 2: 80k Grid 3: 120k Grid 4: 150k
Dep
osi
tio
n v
elo
city
(m
/h)
(e)

8
computational studies under somewhat similar ventilation and occupancy conditions, in particular,
Rai et al. (2014), Rim et al. (2009) and Pandrangi and Morrison (2008) as shown in Table 2-1.
Table 2-1: Results from literature
Based on the grid sensitivity analysis, the total mesh count of 120,000 with base cell sizes of 0.01
m for human surface and 0.1 m for ambient region was adopted. Using this mesh condition, steady
state simulations were performed to capture the effects of buoyancy and thermal stratification. The
transport of a mixture of air and ozone was solved based on a balance of heat and mass in each
cell. Considering the variation of pressure and flow velocity in the indoor space due to turbulence,
the SST k-w turbulence model was used. Gilani et al. (2016) reported that the SST k-w turbulence
model produces the appropriate results that match with the experimental data for indoor air
ventilation applications. Also, it captures the thermal stratification and reproduces the turbulent
thermal plume better than k-ε models.

9
Simulation of ozone-surface reaction depending on airflow condition
The validated CFD model revealed dynamic behavior of ozone in the human surface boundary
layer under two representative indoor airflow conditions: floor air supply vs. ceiling air supply.
For the floor supply case (Figure 2-3a), conditioned air is supplied at floor level with a low
momentum, driven to the upper zone by the occupant thermal plume, and exhausted at ceiling
height. The flow is thus buoyancy-driven. This type of ventilation is prevalent in residential
buildings. For the ceiling supply case (Figure 2-3b), conditioned air is supplied at the ceiling level
with a high momentum to achieve good air mixing in the room. Hence, it is a momentum-driven
ventilation strategy. Aircraft cabins and office spaces commonly employ this ventilation type.
Figure 2-3: (a) floor air supply (b) ceiling air supply
The two representative indoor air flow patterns were analyzed with four different air change rates
(1, 3, 5 and 10) and three cases of ozone concentrations at the human surface (0 ppb, 20 ppb and
Floor
supply
Ceiling
supply
Manikin Manikin
ExhaustExhaust(b) (a)

10
80 ppb), thereby making a total of 24 cases. Air change rate is defined as the rate that room air is
replaced with the supply air per hour. The three values of ozone concentrations at the human
surface simulate varying degrees of surface reactivity for human and clothing surfaces. For
example, the condition of clothes and human skin after an intense workout would correspond to a
perfect sink for the ozone to react since the uptake of ozone to skin and clothing coated with skin
oils is nearly transport limited (Cano-Ruiz et al., 1993; Pandrangi & Morrison, 2008). The
concentration of ozone at those human related surfaces is expected to be very low (0 ppb) as ozone
reacts significantly with human skin oils (Pandrangi and Morrison, 2008; Wisthaler and Weschler,
2010). Similarly, an ozone concentration of 80 ppb at the human surface simulates a situation
where there is less organic molecules on the body and clothes.
For the total 24 cases, temperature and air flow distribution, age-of-air, breathing zone
concentration, and ozone deposition velocity were examined.
Table 2-2: Boundary conditions
Supply ozone concentration (ppb) 100
Area of human surface (m2) 1.583
Room volume (m3) 58.08 (4x4x3.63)
Supply area (m2) 0.48 (floor supply); 0.12 (ceiling supply)
Supply air temperature (°C) 17
Convective heat transfer from the body (W) 38
Radiative heat transfer from the body (W) 30
Ozone concentration at the human surface
(ppb)
0, 20, 80

11
Age of air is one of the parameters used for evaluating ventilation effectiveness and indoor air
quality. Age of air is defined as the time it takes for outdoor air to reach a particular location within
the indoor environment (Sandberg, 1981). To quantify the age of air, sulfur hexafluoride (SF6) was
used in this simulation as the tracer-gas. With a continuous and uniform emission rate of 1.0E-07
kg/m3.s, tracer gas concentration at a given point reveals the freshness of the air. Age of air was
calculated based on Equation (2) defined below.
For a room with single pair of supply and exhaust systems with uniform and continuous
contaminant generation, Equation (2) gives the calculation for age of air (Kato and Yang, 2008).
𝐴𝑖 = 𝐶𝑖 × 60
𝐶𝑒𝑥 × 𝐴𝐶𝐻 (2)
In Equation (2), 𝐴𝑖 = age of air in minutes at location 𝑖, 𝐶𝑖 = mole fraction of SF6 at location 𝑖,
𝐶𝑒𝑥 = mole fraction of SF6 at the exhaust, and 𝐴𝐶𝐻 is the air exchange rate per hour.
The air coming from the inlet would be entirely fresh; therefore age of air at the supply diffuser is
zero. However, age of air in any stagnant zone can be higher than ambient zone, representing a
polluted zone.
Surface reaction probability The deposition velocity was further parameterized through resistance-uptake theory that models
ozone uptake to a surface as the sum of serial resistances describing two governing processes:
transport to the surface and surface reaction kinetics, as shown in Equation (3) (Cano-Ruiz et al.,
1993).

12
1
𝑣𝑑=
1
𝑣𝑡+
4
𝛾⟨𝑣⟩ (3)
In Equation (3), vt = transport-limited deposition velocity (cm/s), = reaction probability, and ⟨𝑣⟩
is the Boltzmann velocity for ozone (3.61×104 cm/s and 3.64 ×104 cm/s for 22 °C and 28 °C,
respectively).
In this study, the transport-limited deposition velocity (vt) was evaluated by treating the human
surface as a perfect ozone sink (zero concentration at the surface). Based on the assumption that
ozone uptake to the human surface is limited by external mass-transfer, the deposition velocity of
ozone to the perfect ozone sink surface (vd) can be equated to the mass-transport-limited deposition
velocity (vt). According to Equation (3), the deposition velocity varies with the surface reaction
probability, . This reaction probability is defined as the fractional likelihood of a reaction given
a collision between a surface and ozone. In this study, reaction probabilities were calculated for
three surface conditions (0, 20, and 80 ppb ozone concentrations at the human surface). Under the
same indoor airflow condition, for 0 ppb at the surface would simulate ozone sink condition
thereby yielding the highest reaction probability while for 80 ppb at the surface will have the
lowest reaction probability.

13
Chapter 3
Results and discussion
This section is organized into four subsections. I present 1) the air flow distribution, temperature
and age of air in the vicinity of human body at 5 ACH and 2) deposition velocity. The next
subsection presents 3) the effects of surface reactivity on deposition velocity followed by 4)
breathing zone ozone concentration.
Air flow distribution, temperature and age of air in the vicinity of human body
Since heat and mass transfer around human body strongly depend on indoor air flow pattern, it is
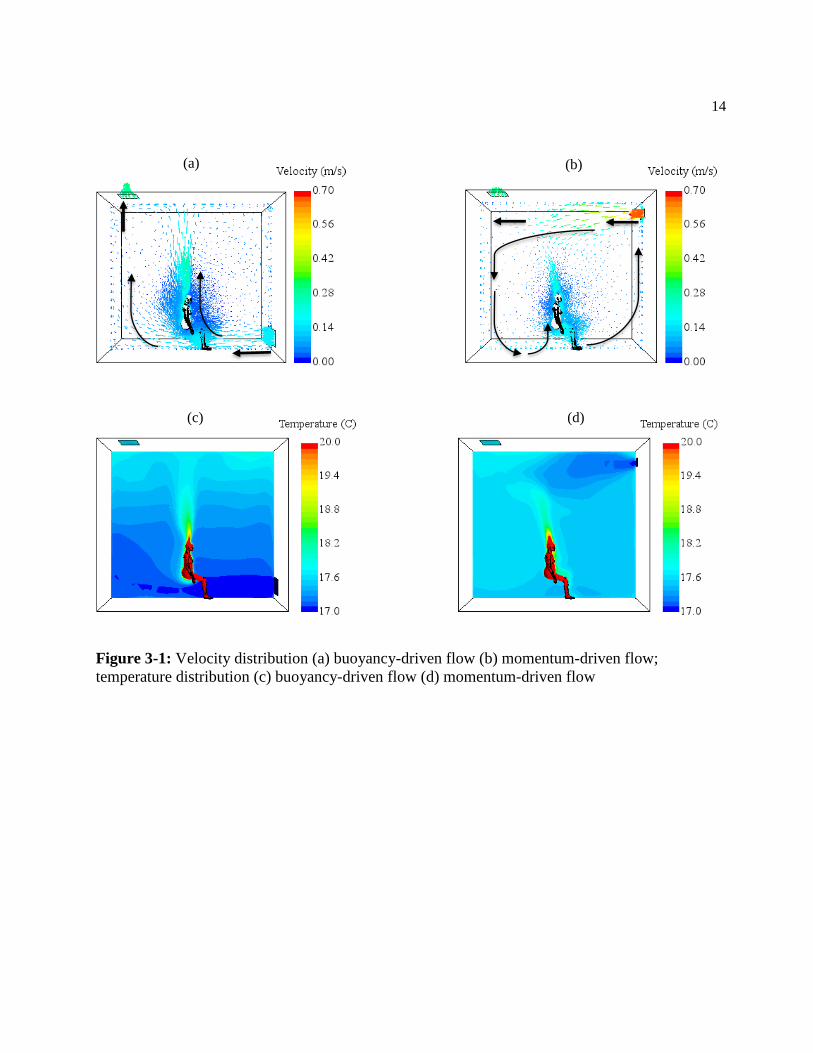
important to compare air velocity distribution (Figures 3-1a and 3-1b). In the case of buoyancy-
driven ventilation, the thermal plume is dominant. Based on Figure 3-1a, it is evident that the air
velocity is the highest above the head of the simulated occupant, which is up to 0.24-0.28 m/s and
higher than incoming supply air velocity (0.17 m/s) or ambient velocity (0.02-0.07 m/s).
14
Figure 3-1: Velocity distribution (a) buoyancy-driven flow (b) momentum-driven flow;
temperature distribution (c) buoyancy-driven flow (d) momentum-driven flow
(a) (b)
(c) (d)

15
In the case of momentum-driven flow (Figure 3-1b), the supply air velocity is the highest (0.67
m/s) and it flows along the wall surfaces. This air circulating pattern promotes efficient mixing in
the room. The air velocity is almost constant at an average value of 0.10 m/s throughout the
occupied zone owing to air mixing caused by the incoming supply jets. These simulated results
agree with airflow characteristics observed in several experimental and numerical studies (Cheng
et al., 2015; Rim et al., 2009).
The effects of air flow distribution are fittingly observed in the thermal gradient contours (Figures
3-1c and 3-1d). The dominant plume generates stratified thermal layers owing to buoyancy effects
(Figure 3-1c). The surface averaged ambient temperature is about 17.2 °C. Figure 3-1d shows that
the thermal plume is deflected, although not disrupted entirely. However, because of well-mixing
characteristic of momentum-driven ventilation, temperature is uniform around the occupant with
a slightly higher average ambient temperature of 17.6 °C.
Figure 3-2 shows distribution of age of air in the two airflow patterns. It reveals that in the
breathing zone, air is fresher (9-10 min) in buoyancy driven flow compared to momentum-driven
flow (13-14 min) at the same air change rate of 5 h-1. This pattern agrees with the finding by Zhang
et al. (2005) that air is fresher in the breathing zone with displacement ventilation (buoyancy-
driven) than mixing ventilation (momentum-driven). The thermal plume from the human body
draws fresh air supplied at the floor level to the breathing zone.

16
Figure 3-2: Age of air (a) buoyancy-driven flow (b) momentum-driven flow
Deposition velocity
Figure 3-3 shows ozone deposition velocity for the reactive human surface under two ventilation
strategies. Figures 3-3a and 3-3b demonstrate that ozone mass transfer rate (or deposition velocity)
varies with ventilation rate and surface reactivity. Ventilation strategy has a marginal influence on
the ozone deposition velocity due to reactive human surface. Overall, surface reactivity has a
greater effect on the mass transfer compared to ventilation rate. With the perfect ozone sink
condition (0 ppb at the occupant surface), ozone deposition velocity ranges between 8 and 10 m/h.
This pattern is robust over a wide range of ventilation rates (1-10 h-1) under both buoyancy-driven
flow and momentum-driven flow. However, ozone deposition velocity is only about 2 m/h with a
reduced surface reactivity at the 80 ppb ozone concentration at the human surface. This trend
suggests that surface reactivity has significant impact on the rate of ozone mass transfer,
accordingly the ozone consumption and formation of reaction products
(a) (b)

17
Figure 3-3: Deposition velocity as a function of ventilation rate (1-10 h-1) and surface
reactivity (ozone concentration at the occupant surface from 0 to 80 ppb) under (a) buoyancy-
driven flow (b) momentum-driven flow
Also, several previous studies reported ozone deposition velocity comparable to the results
produced in this study. Tamás et al. (2006) studied ozone deposition velocity for passengers and
for T-shirts soiled with human skin oils (proxy for passengers) in a simulated aircraft cabin. The
calculated deposition velocities were in the range of 7.2 – 8.3 m/h for the passengers and 6.8 – 9.7
m/h for the soiled T-shirts. Wisthaler and Weschler (2010) reported deposition velocities between
14.4 – 18 m/h for two occupants in a simulated office environment. According to the study by Rai
et al. (2014), deposition velocity for a soiled T-shirt varied from 5.4 – 10.4 m/h in an experimental
chamber under typical indoor conditions. An increase in deposition velocity was also found with
increasing soiling level and ventilation rate. According to the study by Rim et al. (2009), ozone
deposition velocity for a human simulator with surface ozone sink was 6.98 m/h, at an air exchange
rate of 0.8 h-1. The deposition velocity of ozone for passengers in a section of Boeing-767 cabin,
at an outdoor airflow rate of 8.8/h, computed by Rai et al. (2012) was 11.88 m/h. Pandrangi and
Morrison (2008) obtained an estimate of the ozone deposition velocity to the human surface for a
0
2
4
6
8
10
12
1 2 3 4 5 6 7 8 9 10
Dep
osi
tion v
eloci
ty (
m/h
)
Air changes per hour
0 ppb (perfect sink)
20 ppb
80 ppb
0
2
4
6
8
10
12
1 2 3 4 5 6 7 8 9 10
Air changes per hour
0 ppb (perfect sink)
20 ppb
80 ppb
(a) (b)

18
range of reaction probabilities expected for skin and soiled clothing. It ranged from 6.6 m/h – 30
m/h.
Effects of surface reactivity on deposition velocity
In reality, the ozone deposition velocity varies over the human surface condition depending on the
amount of skin oil and availability of reactive sites on a given surface. Figure 3-4 exhibits reaction
probability for the occupant surface with respect to the ozone concentration at the surface (0 ppb,
20 ppb, and 80 ppb) at an air exchange rate of 5 h-1. Transport-limited deposition velocity (vt) is
based on the 0 ppb ozone concentration at the surface. 20 ppb at the surface represents the condition
limited by transport through the boundary layer, while 80 ppb at the surface indicates the condition
limited by the surface reaction.
Figure 3-4: Effects of surface reactivity on deposition velocity: (a) buoyancy-driven flow (b)
momentum-driven flow. Reaction probabilities are calculated based on Equation (3). Note the
ventilation rate is 5 h-1.
0.00
0.05
0.10
0.15
0.20
0.25
0.30
1.0E-07 1.0E-06 1.0E-05 1.0E-04 1.0E-03 1.0E-02
Dep
osi
tion v
eloci
ty (
v d, cm
/s)
Reaction probability (ϒ)
vt = 0.23 cm/s
20 ppb:
vd = 0.19 cm/s
ϒ = 1.02x10-480 ppb:
vd = 0.05 cm/s
ϒ = 6.43x10⁻⁶
0.00
0.05
0.10
0.15
0.20
0.25
0.30
1.0E-07 1.0E-06 1.0E-05 1.0E-04 1.0E-03 1.0E-02Reaction probability (ϒ)
20 ppb:
vd = 0.23 cm/s
ϒ = 1.52x10-480 ppb:
vd = 0.06 cm/s
ϒ = 7.72x10⁻⁶
vt = 0.28 cm/s
(b) (a)

19
Pandrangi and Morrison (2008) reported that ozone flux to human surface is mainly limited by
transport through the boundary layer surrounding the body and reactive sites available on the
surface alter the deposition velocity. In their work, the initial and final follicle reaction probability
values for hair samples were (13 ± 8) x 10-5 and (1.0 ± 1.3) x 10-5. The present study found reaction
probabilities of (8.3 - 15.2) x 10-5 for 20 ppb and (0.52 - 0.76) x 10-5 for 80 ppb ozone
concentrations at the surface. Coleman et al. (2008) reported a range of 1 x 10⁻⁴ – 4 x 10⁻⁴ for skin,
hair and soiled clothing. However, the values calculated for laundered clothing in their study
ranged from 1.5 x 10⁻⁵ – 8 x 10⁻⁵.
20
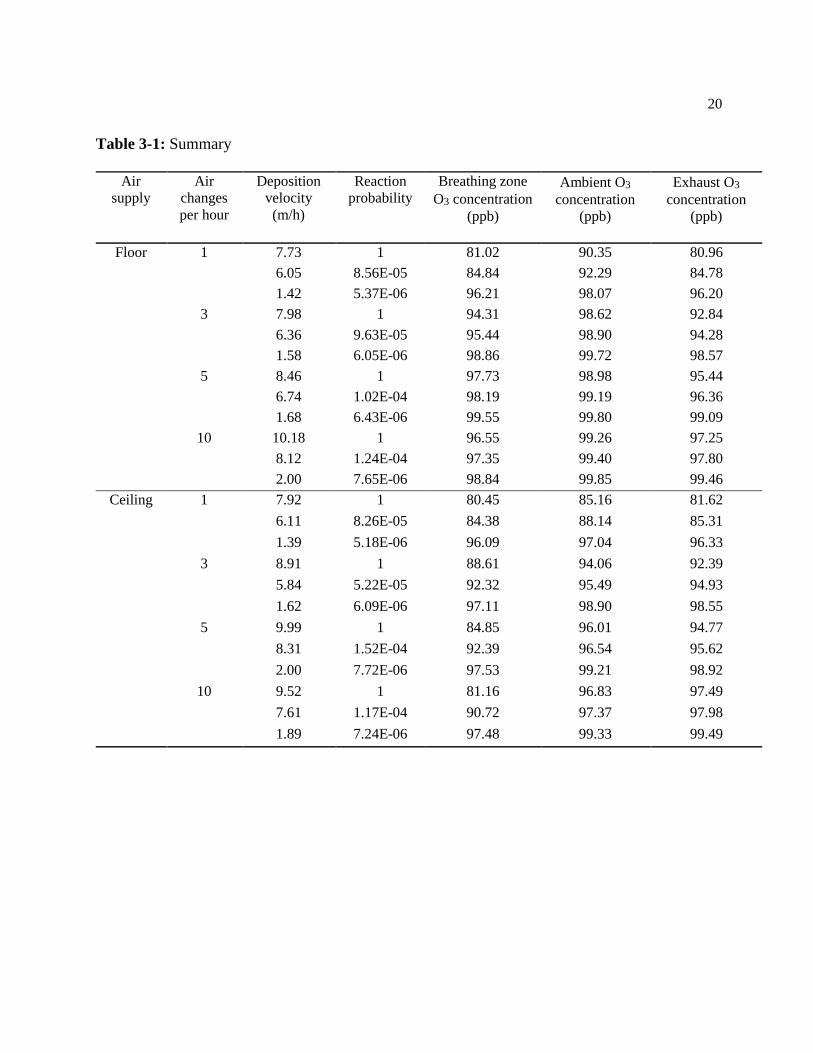
Table 3-1: Summary
Air
supply
Air
changes
per hour
Deposition
velocity
(m/h)
Reaction
probability
Breathing zone
O3 concentration
(ppb)
Ambient O3
concentration
(ppb)
Exhaust O3
concentration
(ppb)
Floor 1 7.73 1 81.02 90.35 80.96
6.05 8.56E-05 84.84 92.29 84.78
1.42 5.37E-06 96.21 98.07 96.20
3 7.98 1 94.31 98.62 92.84
6.36 9.63E-05 95.44 98.90 94.28
1.58 6.05E-06 98.86 99.72 98.57
5 8.46 1 97.73 98.98 95.44
6.74 1.02E-04 98.19 99.19 96.36
1.68 6.43E-06 99.55 99.80 99.09
10 10.18 1 96.55 99.26 97.25
8.12 1.24E-04 97.35 99.40 97.80
2.00 7.65E-06 98.84 99.85 99.46
Ceiling 1 7.92 1 80.45 85.16 81.62
6.11 8.26E-05 84.38 88.14 85.31
1.39 5.18E-06 96.09 97.04 96.33
3 8.91 1 88.61 94.06 92.39
5.84 5.22E-05 92.32 95.49 94.93
1.62 6.09E-06 97.11 98.90 98.55
5 9.99 1 84.85 96.01 94.77
8.31 1.52E-04 92.39 96.54 95.62
2.00 7.72E-06 97.53 99.21 98.92
10 9.52 1 81.16 96.83 97.49
7.61 1.17E-04 90.72 97.37 97.98
1.89 7.24E-06 97.48 99.33 99.49
21
Breathing zone ozone concentrations
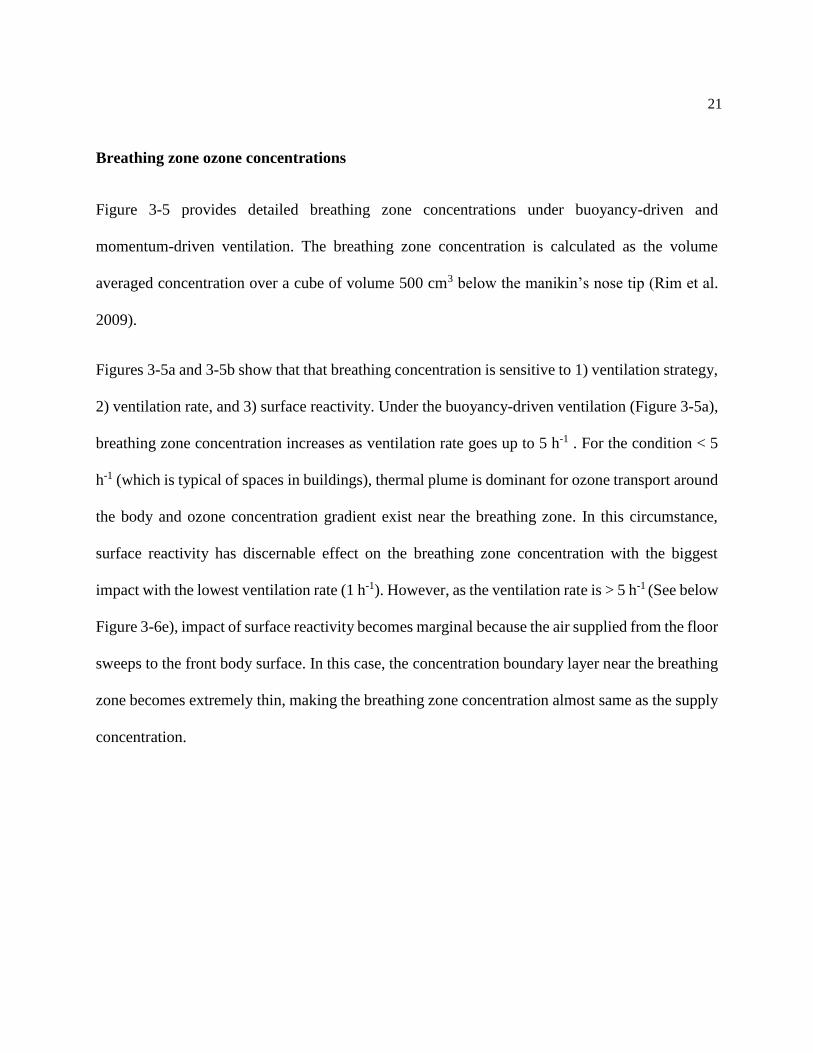
Figure 3-5 provides detailed breathing zone concentrations under buoyancy-driven and
momentum-driven ventilation. The breathing zone concentration is calculated as the volume
averaged concentration over a cube of volume 500 cm3 below the manikin’s nose tip (Rim et al.
2009).
Figures 3-5a and 3-5b show that that breathing concentration is sensitive to 1) ventilation strategy,
2) ventilation rate, and 3) surface reactivity. Under the buoyancy-driven ventilation (Figure 3-5a),
breathing zone concentration increases as ventilation rate goes up to 5 h-1 . For the condition < 5
h-1 (which is typical of spaces in buildings), thermal plume is dominant for ozone transport around
the body and ozone concentration gradient exist near the breathing zone. In this circumstance,
surface reactivity has discernable effect on the breathing zone concentration with the biggest
impact with the lowest ventilation rate (1 h-1). However, as the ventilation rate is > 5 h-1 (See below
Figure 3-6e), impact of surface reactivity becomes marginal because the air supplied from the floor
sweeps to the front body surface. In this case, the concentration boundary layer near the breathing
zone becomes extremely thin, making the breathing zone concentration almost same as the supply
concentration.

22
Figure 3-5: Breathing zone concentration as a function of ventilation rate (1-10 h-1) and surface
reactivity (ozone concentration at the occupant surface from 0 to 80 ppb): (a) buoyancy-driven
flow (b) momentum-driven flow. Note that the supply ozone concentration is 100 ppb
Under the momentum-driven ventilation (Figures 3-6b, 3-6d and 3-6f), coandă effect occurs and
the supply airflow follows the ceiling and wall surfaces. This circulated airflow moves toward the
back of the occupant. In this case, the concentration boundary layer near the back of the occupant
is very thin; however, near the breathing zone ozone concentration gradient exists. It seems that
for the momentum-driven ventilation, surface reactivity plays a significant role on the breathing
zone concentration (Figure 3-5b) compared to the buoyancy-driven ventilation. The perfect ozone
sink (0 ppb) condition yields notably the lowest breathing zone concentration. This trend suggests
that under momentum-driven, circulating airflow, surface reactivity and ventilation rate are equally
effective in the breathing zone concentration. Lower breathing zone ozone concentration can occur
due to combined effects of surface reactivity and airflow characteristic. This trend agrees well with
Rim et al. (2009) where a decrease in breathing zone ozone concentration was reported as
80
85
90
95
100
1 2 3 4 5 6 7 8 9 10
Air changes per hour
80 ppb
20 ppb
0 ppb (perfect sink)
80
85
90
95
100
1 2 3 4 5 6 7 8 9 10
Bre
ath
ing
zo
ne
O3
con
c. (
pp
b)
Air changes per hour
80 ppb
20 ppb
0 ppb (perfect sink)
(b) (a)

23
ventilation rate increases higher than 5 h-1, although they simulated a different posture of manikin
(standing) with a perfect ozone sink condition.
Figure 3-6: Ozone concentration near the breathing zone (a) buoyancy-driven flow at 1 h-1; (b)
momentum-driven flow at 1 h-1; (c) buoyancy-driven flow at 3 h-1; (d) momentum-driven flow at
3 h-1; (e) buoyancy-driven flow at 5 h-1; (f) momentum-driven flow at 5 h-1. Note that ozone
concentration at the human surface is zero representing perfect ozone sink.
(f) (e)
(d) (c)
(b) (a)
Breathing
zone
Breathing
zone
Breathing
zone
Breathing
zone
Breathing
zone
Breathing
zone

24
Chapter 4
Conclusions and future work
This study developed a CFD model to study the influence of indoor air flow conditions and surface
reactivity on ozone reaction with human surface thereby acquiring new information with the
following conclusions:
• Ozone deposition velocity in an indoor environment (at ventilation rates < 5 h-1) is 8-10 m/h
with a perfect sink condition
Surface reactivity of the human body has a larger influence than air change rate and ventilation
pattern on ozone mass transfer rate
Breathing zone concentration increases with ventilation rate in indoor environment (at
ventilation rates < 5 h-1)
Breathing zone concentration is in the range of 81-97 ppb under transport-limited condition
(human skin oil), while the range is 96-99 ppb with lower surface reaction rate
Breathing zone concentration is approximately equal to supply ozone concentration beyond
five ACH in buoyancy-driven ventilation
While this study provides a detailed parametric analysis on ozone-human reaction under a range
of ventilation and surface conditions, the results are greatly affected by the boundary conditions
assumed. It is important to remember that heat sources play a significant role in influencing the
airflow around the human body and subsequently the concentration of ozone. Hence, any

25
addition of heat source in the room such as lighting fixture or computer can alter the measurements.
Future work can revolve around this study and explore outcomes in an environment that more
closely represents an office setup. Also, the position of supply and exhaust diffusers or orientation
and posture of the occupant can produce different results. Hence, these factors need to be kept in
mind while using this study for validation of any new model.

26
References
Anderson, S.E., Wells, J.R., Fedorowicz, A., Butterworth, L.F., Meade, B.J. and Munson,
A.E. 2007) Evaluation of the contact and respiratory sensitization potential of
volatile organic compounds generated by simulated indoor air chemistry, Toxicol.
Sci., 97, 355–363.
Cano-Ruiz, J. A., et al. "Removal of reactive gases at indoor surfaces: Combining mass
transport and surface kinetics." Atmospheric Environment. Part A. General
Topics 27.13 (1993): 2039-2050.
Cheng, Y., and Z. Lin. "Experimental study of airflow characteristics of stratum ventilation
in a multi‐occupant room with comparison to mixing ventilation and displacement
ventilation." Indoor air 25.6 (2015): 662-671.
Clausen, P., Wilkins, C.K., Wolkoff, P. and Nielsen, G.D. (2001) Chemical and biological
evaluation of a reaction mixture of R-(+)-limonene/ozone - Formation of strong airway
irritants, Environ. Int., 26, 511–522.
Coleman, B. K., Destaillats, H., Hodgson, A. T., & Nazaroff, W. W. (2008). Ozone
consumption and volatile byproduct formation from surface reactions with aircraft
cabin materials and clothing fabrics. Atmospheric environment,42(4), 642-654.
Comrie, Andrew C. "The climatology of surface ozone in rural areas: a conceptual
model." Progress in Physical Geography 14.3 (1990): 295-316.
Devlin, Robert B., James A. Raub, and Lawrence J. Folinsbee. "Health effects of
ozone." Science and Medicine 4 (1997): 8-17.
Gilani, Sara, Hamid Montazeri, and Bert Blocken. "CFD simulation of stratified indoor
environment in displacement ventilation: Validation and sensitivity
analysis." Building and Environment 95 (2016): 299-313.
Kato, Shinsuke, and Jeong-Hoon Yang. "Study on inhaled air quality in a personal air-
conditioning environment using new scales of ventilation efficiency." Building and
Environment 43.4 (2008): 494-507.

27
Lippmann, Morton. "Health effects of ozone a critical review." Japca 39.5 (1989): 672-
695.
Lin, Zhang, et al. "Comparison of performances of displacement and mixing ventilations.
Part II: indoor air quality." International Journal of Refrigeration28.2 (2005): 288-
305.
Nazaroff, William W., Ashok J. Gadgil, and Charles J. Weschler. "Critique of the use of
deposition velocity in modeling indoor air quality." Modeling of indoor air quality
and exposure. ASTM International, 1993.
Nilsson, H., H. Brohus, and P. V. Nielsen. "Benchmark test for a computer simulated
person–Manikin heat loss for thermal comfort evaluation." Aalborg University
Denmark & Gavle University Sweden (2007).
NRC (National Research Council), Committee on Air Quality in Passenger Cabins of
Commercial Aircraft. (2002) “The Airliner Cabin Environment and the Health of
Passengers and Crew”, Washington DC: National Academy Press.
Pandrangi, Lakshmi S., and Glenn C. Morrison. "Ozone interactions with human hair:
Ozone uptake rates and product formation." Atmospheric Environment 42.20
(2008): 5079-5089.
Poppendieck, Dustin G., Donghyun Rim, and Andrew K. Persily. "Ultrafine particle
removal and ozone generation by In-duct electrostatic precipitators."Environmental
science & technology 48.3 (2014): 2067-2074.
Rai, A. C., Guo, B., Lin, C. H., Zhang, J., Pei, J., & Chen, Q. (2014). Ozone reaction with
clothing and its initiated VOC emissions in an environmental chamber. Indoor
air, 24(1), 49-58.
Rai, Aakash C., and Qingyan Chen. "Simulations of ozone distributions in an aircraft cabin
using computational fluid dynamics." Atmospheric Environment54 (2012): 348-
357.
Rim, D., & Novoselac, A. (2009). Transport of particulate and gaseous pollutants in the
vicinity of a human body. Building and Environment, 44(9), 1840-1849.

28
Rim, D., Novoselec, A., Morrison, G., 2009. The influence of chemical interactions at the
human surface on breathing zone levels of reactants and products. Indoor Air 19,
324-334.
Sandberg, M. (1981). What is ventilation efficiency?. Building and environment, 16(2),
123-135.
Spengler, J. D., S. Ludwig, and R. A. Weker. "Ozone exposures during trans‐continental
and trans‐pacific flights." Indoor Air 14.s7 (2004): 67-73.
Tamas, G., Weschler, C. J., Bako-Biro, Z., Wyon, D. P., & Strøm-Tejsen, P. (2006). Factors
affecting ozone removal rates in a simulated aircraft cabin
environment. Atmospheric Environment, 40(32), 6122-6133.
U.S. EPA. 1996. Air Quality Criteria for Ozone and Related Photochemical Oxidants.
EPA/600/P-93/004a-cF. Washington, DC:U.S. Environmental Protection Agency
Weschler, C.J. 2000. Ozone in indoor environments: concentration and chemistry. Indoor
Air 10, 269-288.
Wisthaler, Armin, and Charles J. Weschler. "Reactions of ozone with human skin lipids:
sources of carbonyls, dicarbonyls, and hydroxycarbonyls in indoor
air." Proceedings of the National Academy of Sciences 107.15 (2010): 6568-6575.
29
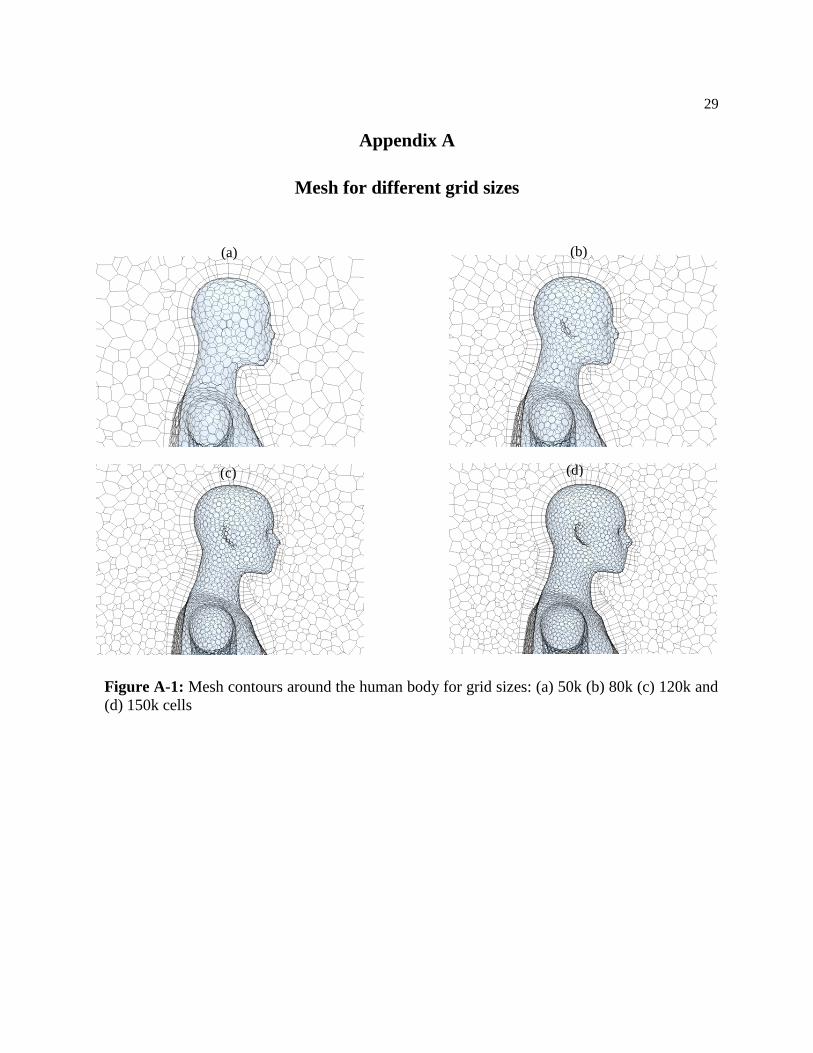
Appendix A
Mesh for different grid sizes
Figure A-1: Mesh contours around the human body for grid sizes: (a) 50k (b) 80k (c) 120k and
(d) 150k cells
(a) (b)
(c) (d)

30
Appendix B
Transient ozone concentration
A time-varying simulation is run to compare its results with steady-state simulation. Figure B-1
shows good agreement between the values for bulk ozone concentration observed in the transient
case and in Table 3-1.
Figure B-1: Ambient ozone concentration vs physical time at two surface conditions: (a)
buoyancy-driven flow at 3 ACH (b) momentum-driven flow at 3 ACH (c) buoyancy-driven
flow at 10 ACH (d) momentum-driven flow at 10 ACH
90
91
92
93
94
95
96
97
98
99
100
0 2000 4000 6000
Ozo
ne
con
cen
trat
ion
(p
pb
)
Physical time (s)
80 ppb
0 ppb (Perfect Sink)
90
91
92
93
94
95
96
97
98
99
100
0 5000 10000 15000 20000Physical time (s)
80 ppb
0 ppb (Perfect Sink)
95
96
97
98
99
100
0 1000 2000 3000 4000
Ozo
ne
con
cen
trat
ion
(p
pb
)
Physical time (s)
80 ppb
0 ppb (Perfect Sink)
95
96
97
98
99
100
0 1000 2000 3000Physical time (s)
80 ppb
0 ppb (Perfect Sink)
(a) (b)
(c) (d)