cfa submission team b
TRANSCRIPT

CFA Institute Research Challenge
Hosted by the
CFA Society of St. Louis Team B

Team B
This Page Intentionally Left Blank

Team B
This report is published for educational purposes only by students competing in the CFA Institute Research Challenge Huttig Building Products, Inc.
Date: January 15th, 2016
Ticker: NASDAQ HBP
Sector/Industry: Building Material/Wholesale
Current Price: $3.16 Target Price: $4.41 (40% upside) Recommendation: BUY
In millions of USD (except per share data) 2012 2013 2014 2015E 2016E 2017E 2018E
Net sales 521.1 561.5 623.7 682,8 751.0 814.7 843.0
Cost of sales 420.4 450.4 501.1 546.2 600.0 671.9 671.9
Operating expenses 98.4 104.8 114.3 122.9 135.0 145.2 149.4
Operating income 2.3 6.3 8.3 13.7 15.9 19.3 21.8
Interest expense, net 2.9 2.6 2.5 3.1 3.3 3.3 3.3
Income from continuing operations before income taxes (0.1) 3.6 5.8 10.6 12.7 16.0 18.4
Earnings per share 0.00 0.16 0.25 1.16 0.40 0.48 0.53
Market Profile
52-Week Range $2.70-5.45
Shares Out. (mm) 24.1
Market Cap (mm) $78.6
ROE 2014 9.05%
ROIC 2014 9.36%
ROA 2014 3.7%
Current P/E 7.0x
Current P/B 1.6x
Book Value/Sh. $2.16
F/Y Ends December
Average Volume 13,000
$100 Investment in Huttig vs XHB Index
XHB Homebuilders Index is Developed by
State Street Inc.
HBP: Constructive Solutions Since 1885
We are initiating coverage of Huttig Building Products, Inc. with a BUY recommendation. The summary of our recommendation is as follows:
Improving Revenue Drivers
Leading indicators of revenue growth for Huttig have shown improvement with average monthly housing starts increasing steadily from a low of under 600k in 2009 to over 1mm in 2014. Housing starts are projected to increase to nearly 1.4mm by 2017. (Appx. 18A) The S&P/Case Schiller National Home Price Index has shown consistent growth from approximately 135 in 2012 to more than 175 in 2015. (Appx. 16A) The Leading Indicator of Remodeling Activity projects remodeling activity to increase by nearly 7% in 2016. (Appx.
15A) Optimistic Performance Outlook
Earnings for Huttig became positive in 2013 after a seven-year period of losses. In the first three quarters of 2015, the firm reported its highest gross and operating margins since 2005. This improved performance resulted from effective reinvestment in current capital outlay and a favorable product mix moving towards millwork. Leverage of current capital outlay has resulted in improved fixed asset turnover from 13.0x to 19.0x over the past three fiscal years.
Scalable Operational Advantage
Huttig competes primarily with local building product distributers. The company employs a unique two-part value-add strategy to gain market share. By utilizing large purchase orders and a real-time, nationwide information network, the company competes with local distributors on price. Huttig also provides post-purchase processing of materials into job-specific configurations.
Attractive Valuation
Huttig Building Products currently trades at nearly 7x adjusted price to earnings. For comparison, the average P/E for the selected peer group of Huttig is approximately 18x. This multiple is 13x on a 1-year forward basis. Application of the average forward P/E ratio of the peer group to our projected 2016 earnings for Huttig yields a valuation of $4.68. Our discounted cash flow model produces a target price of $4.41. These price targets represent 48% and 40% upside, respectively, from the current price of $3.16.
Key Concerns
Concentrated Revenues
38% of Huttig’s revenues are generated from their ten largest customers, many of which are among the top ten largest pro-dealers by sales. Over the past year, there have been two large mergers among entities within the top ten pro-dealers. Increased consolidation of revenues, in conjunction with a lack of contract agreements, exposes Huttig to large sales risk.
Low Liquidity
Lack of coverage and trading volume has likely been a factor in the depressed trading multiple of Huttig in comparison to its peers. This is likely driven by the company’s low market capitalization. Huttig’s average daily share turnover over the prior 240 days is 0.05%. For comparison, the peer group average is 0.44%.
$0
$100
$200
$300
$400
$500
$600
$700
HBP XHB

Team B
Historical Share Price
Source: Bloomberg
Revenues (mm) by Housing Starts (mm)
Source: US Census Bureau & Company Data Change in Median Single Family Home Price by
Region (2011 – 2014)
Source: Federal Reserve Bank of Dallas
Annual US Foreclosures (mm)
Source: CoreLogic
Investment Summary:
We are initiating coverage of Huttig Building Products, Inc. with a Buy rating at a
current fair value of $4.41 for a 40% upside from the closing price of $3.16 on January 15th, 2016. We use a discounted cash flow model as our primary valuation
technique. The projection period for the model is from 2015 to 2019 with a continuing value based on 2020 projected net operating profits less adjusted taxes. A 10% discount was applied our estimate of equity value to account for low trading volume. This model results in a predicted equity value of approximately $119mm ($4.41 on a per share basis). Positives
Accelerating Revenue Growth Huttig Building Products has seen steady top-line growth as housing starts rebounded following the housing crisis. The CAGR of revenues from 2009 to present is slightly over 5.0%, and the CAGR of revenues over the past three years is nearly 7.5%. Over the last 12 months, the firm has seen double-digit percentage growth in revenues, which is likely attributable to the 10% growth in housing starts over the same period. Bloomberg’s aggregate projection for housing starts, across 30 economists, implies a 10% CAGR over 24 months. (Appx. 18A) Improving Operating Performance
In 2014, Huttig’s management implemented a strategic plan focused on accelerating growth and performance in operations through 2018. This plan is based on continued investment in staff and existing capital to increase performance and improve margins. Margin expansion should also be supplemented by low commodity prices, notably lumber. (Appx. 22A) This initiative has shown positive results with the highest gross and operating margins since 2005 reported YTD in 2015. Year to date gross margins are 20.1% and year to date operating margins are 2.6%.
Positive Market Outlook Huttig Operates 27 distribution centers serving 41 states. Granular analysis of each distribution center’s surrounding metropolitan statistical area (MSA) provides a positive outlook on building product demand. Of the 27 MSAs housing a Huttig distribution center, 25 saw increases in overall population, with the remaining two decreasing by less than 1% (Appx. 12A). Home Price index values also increased on a nationwide level since 2010 (Appx. 16A). Census data on building permits granted for the construction of new private single and multi-family homes shows a double-digit percentage CAGR in 17 of the 27 MSAs (Appx. 14A) The weighted average CAGR, in which weights are determined by population, is 13% across all areas. (Appx. 14A) Acquisition Upside
Huttig is currently the largest distributor of millwork in the U.S. IBIS World predicts revenue of millwork sales to increase by 2.3% each year through 2020. This growth in revenue is expected to be driven by increased construction going forward. In 2015, there were two large mergers between four of the top ten pro-dealers by sales in the U.S., possibly driven by the relatively low market valuation of the acquired firms. With a nationwide millwork distribution network and relatively low market valuation, Huttig could be a potential acquisition target for a larger distribution firm looking to expand millwork operations. Negatives
Secondary Housing Downturn With all else held constant in our DCF model, if housing starts were to decrease to the low levels seen during the previous housing decline, our projected price per share of Huttig would decrease to $1.55 per share. This scenario represents approximately a 50% downside from the current price per share of $3.16. Accelerated Repayment of Credit
Huttig receives financing through a revolving credit facility, which requires Huttig to maintain a fixed charge coverage ratio of 1.05. This requirement is tested if Huttig’s excess borrowing capacity falls within the range of $12.5mm to $20mm. Huttig currently has approximately $73mm borrowing capacity available before entering this range. If another housing downturn forces Huttig to use more of this borrowing capacity and its fixed charge coverage ratio is not above the required threshold, Huttig may be forced to accelerate its debt repayment. If the accelerated payment cannot be met, Huttig’s assets may be subject to claim by the originators of the credit.
$0
$1
$2
$3
$4
$5
$6
$0
$500
$1,000
$1,500
$2,000
0
0.5
1
1.5
Revenues
Monthly Housing Starts
15.2%
24.1%
32.0%
52.4%
2.82 2.87
1.88 1.84
1.361.12

Team B
Growth Rate in New Housing Starts Nationally
Source: U.S. Census Bureau
Concentrated Revenues Huttig’s revenues are relatively concentrated, with 38% of 2014 revenues derived from their ten largest customers. There has recently been merger activity among some of the largest pro-dealers operating in the United States. Given a lack of contracts, a merger between two pro-dealers could result in a large loss of sales for Huttig or decreased bargaining power. If a customer of Huttig is acquired, we cannot be certain that the acquiring company will choose to continue purchasing from Huttig. Further concentration among customers will also result in increased negotiating power for the buyers, placing downward pressure on Huttig’s prices. Changing Housing Consumption Behavior Historically, empirical observations suggest that the mid-cycle average monthly starts is near 1.5mm, and the peak of the cycle is near 2mm (U.S. Census). Faster growth in multi-family building units in comparison to single family units in the 27 MSAs in which Huttig operates, however, could be indicative of a shift towards renting and lower peak single family housing starts within these observed areas. Such a shift could negatively impact Huttig’s revenue growth given that firm sales are more closely tied to single family units.
0%
10%
20%
30%
40%
2012 2013 2014 2015
Multi Family Single Family
Huttig Timeline
Year Notable Event
1885 Huttig Sash and Door
Company founded
1913 Incorporated in
Delaware
1968 Acquired by Crane
Co.
1999
Huttig Spun off to
Shareholders
Ticker: HBP.PI
2007 Housing market
downturn
2014 Listed on NASDAQ
Ticker: HBP
Sales by Segment in 2014
Source: Company Data
Business Description:
History Huttig Building Products is a wholesale distributer of a variety of building products, such as doors, windows, columns, decking, fasteners, connectors, roofing, siding, and housewrap. Founded in 1885 in the St. Louis area as Huttig Sash and Door Company, the firm grew from 27 employees to approximately 300 over the next 25 years. In 1913, Huttig was incorporated in the state of Delaware, and by 1926 the company had expanded operations to include eight additional branches. In 1968, Huttig was acquired by Crane Co. as a means for Crane Co. to expand operations beyond steel into woodworking and housing products. In 1999, Huttig was spun off from Crane Co. to the shareholders, establishing Huttig Building Products Incorporated as a publicly traded firm, under the ticker HBPI. At the time of its IPO, Huttig’s products were distributed through 76 distribution centers, serving 45 states. From 1999 to 2009, the number of centers distributing Huttig’s products was reduced to 36, serving 44 states. Huttig is currently traded on the NASDAQ as Huttig Building Products, ticker HBP.
Operations Huttig’s products are currently distributed through 27 centers, serving 41 states. These products are generally used for residential construction, home improvement, and home repair. Huttig’s products fall under one of three categories: millwork, general building products, and wood products. Huttig sources their raw materials and other intermediate goods, both fabricated and prefabricated, from over 700 unique suppliers. These items are disaggregated or modified to add value and then resold to Huttig’s customers, which are comprised primarily of large retailers and private contractors. Value-Added Strategy The value added from Huttig’s operations is generated through economies of scale, job-specific services, and customer support. These features are utilized in two segments of their operations; (1). bulk purchasing and disaggregation of products and inputs (2). the specialty services. To capitalize on transfer of bulk purchasing cost reduction, Huttig employs a nationwide, scalable information network that allows the firm to track inventory and analyze demand at the local level in real time. Huttig has stock inventories from well-known brands such as Therma-Tru® and Masonite® and notes an ability to provide timely and special delivery to any location using their proprietary, side-loading trailers. Huttig also provides customers with specialty services such as installation of pre-hung doors and other fabrication services. Historically, Huttig has generated the majority of revenues from the sale of millwork products. These millwork products, such as pre-hung doors and window fixtures, are generally finished within a Huttig distribution center.
48%
11%
41%
Millwork Wood Specialty
Team B
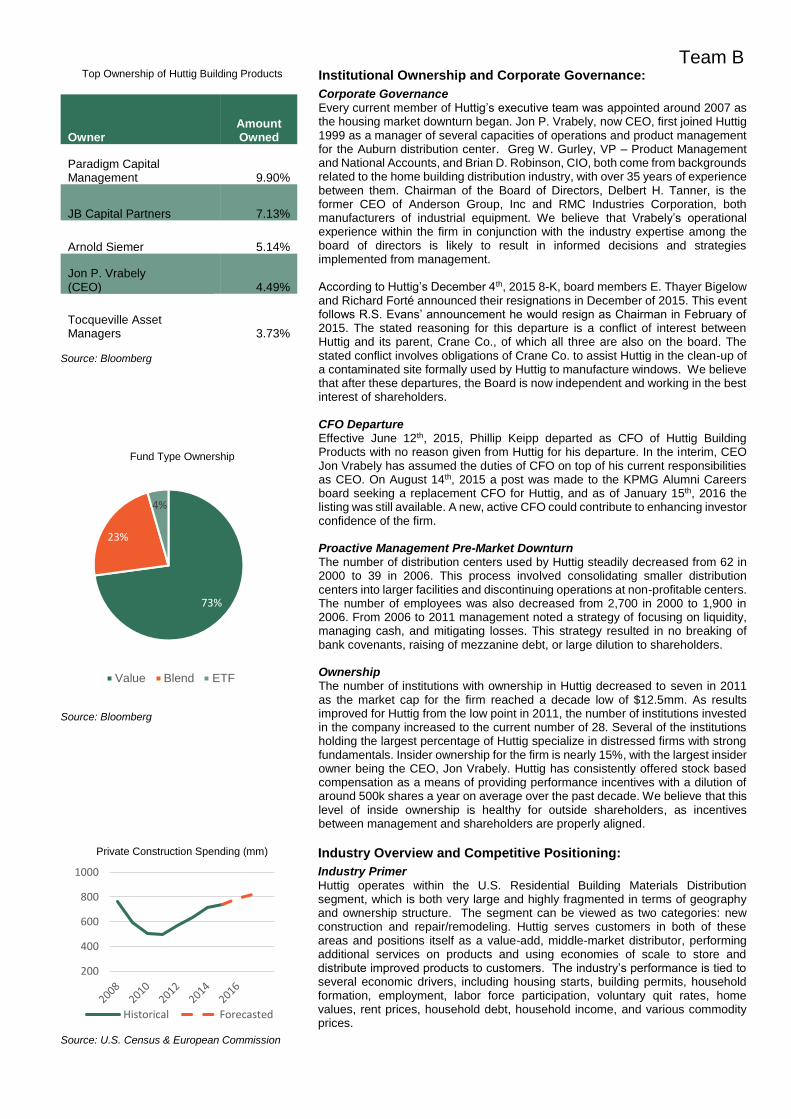
Top Ownership of Huttig Building Products
Source: Bloomberg
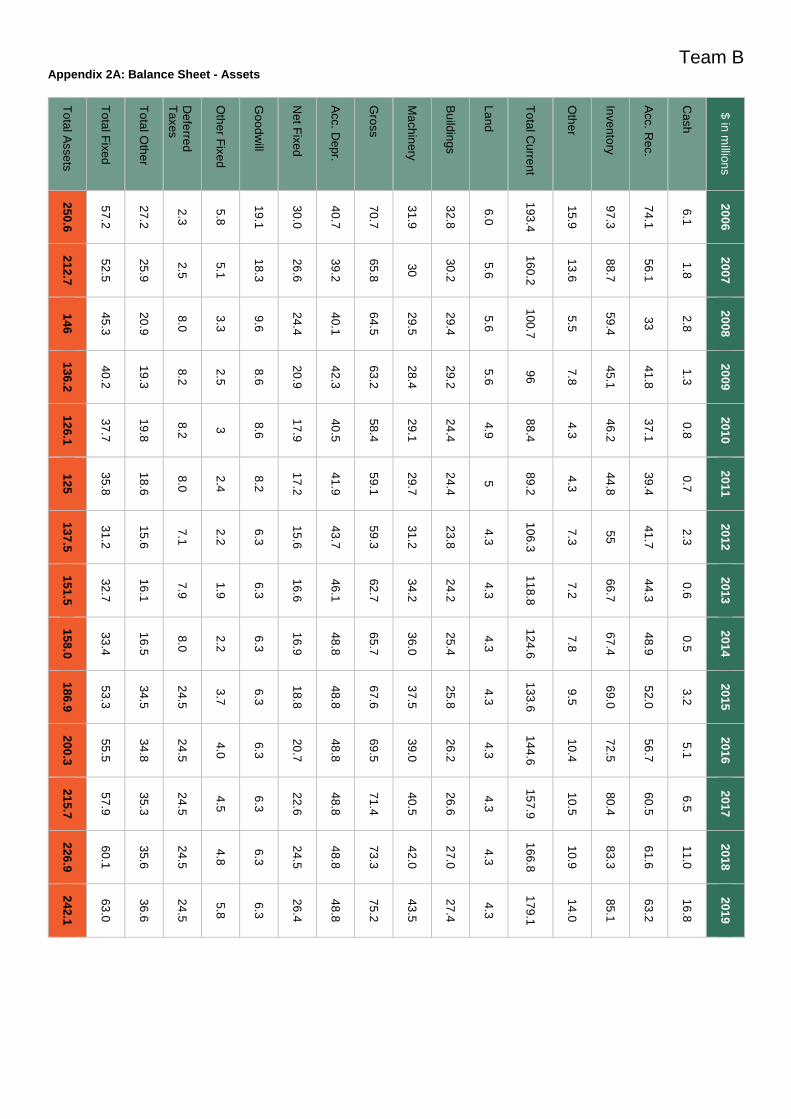
Fund Type Ownership
Source: Bloomberg
Owner Amount Owned
Paradigm Capital Management 9.90%
JB Capital Partners 7.13%
Arnold Siemer 5.14%
Jon P. Vrabely (CEO) 4.49%
Tocqueville Asset Managers 3.73%
Institutional Ownership and Corporate Governance:
Corporate Governance Every current member of Huttig’s executive team was appointed around 2007 as the housing market downturn began. Jon P. Vrabely, now CEO, first joined Huttig 1999 as a manager of several capacities of operations and product management for the Auburn distribution center. Greg W. Gurley, VP – Product Management and National Accounts, and Brian D. Robinson, CIO, both come from backgrounds related to the home building distribution industry, with over 35 years of experience between them. Chairman of the Board of Directors, Delbert H. Tanner, is the former CEO of Anderson Group, Inc and RMC Industries Corporation, both manufacturers of industrial equipment. We believe that Vrabely’s operational experience within the firm in conjunction with the industry expertise among the board of directors is likely to result in informed decisions and strategies implemented from management. According to Huttig’s December 4th, 2015 8-K, board members E. Thayer Bigelow and Richard Forté announced their resignations in December of 2015. This event follows R.S. Evans’ announcement he would resign as Chairman in February of 2015. The stated reasoning for this departure is a conflict of interest between Huttig and its parent, Crane Co., of which all three are also on the board. The stated conflict involves obligations of Crane Co. to assist Huttig in the clean-up of a contaminated site formally used by Huttig to manufacture windows. We believe that after these departures, the Board is now independent and working in the best interest of shareholders. CFO Departure Effective June 12th, 2015, Phillip Keipp departed as CFO of Huttig Building Products with no reason given from Huttig for his departure. In the interim, CEO Jon Vrabely has assumed the duties of CFO on top of his current responsibilities as CEO. On August 14th, 2015 a post was made to the KPMG Alumni Careers board seeking a replacement CFO for Huttig, and as of January 15th, 2016 the listing was still available. A new, active CFO could contribute to enhancing investor confidence of the firm. Proactive Management Pre-Market Downturn The number of distribution centers used by Huttig steadily decreased from 62 in 2000 to 39 in 2006. This process involved consolidating smaller distribution centers into larger facilities and discontinuing operations at non-profitable centers. The number of employees was also decreased from 2,700 in 2000 to 1,900 in 2006. From 2006 to 2011 management noted a strategy of focusing on liquidity, managing cash, and mitigating losses. This strategy resulted in no breaking of bank covenants, raising of mezzanine debt, or large dilution to shareholders. Ownership The number of institutions with ownership in Huttig decreased to seven in 2011 as the market cap for the firm reached a decade low of $12.5mm. As results improved for Huttig from the low point in 2011, the number of institutions invested in the company increased to the current number of 28. Several of the institutions holding the largest percentage of Huttig specialize in distressed firms with strong fundamentals. Insider ownership for the firm is nearly 15%, with the largest insider owner being the CEO, Jon Vrabely. Huttig has consistently offered stock based compensation as a means of providing performance incentives with a dilution of around 500k shares a year on average over the past decade. We believe that this level of inside ownership is healthy for outside shareholders, as incentives between management and shareholders are properly aligned.
73%
23%
4%
Value Blend ETF
Private Construction Spending (mm)
Source: U.S. Census & European Commission
Industry Overview and Competitive Positioning:
Industry Primer
Huttig operates within the U.S. Residential Building Materials Distribution segment, which is both very large and highly fragmented in terms of geography and ownership structure. The segment can be viewed as two categories: new construction and repair/remodeling. Huttig serves customers in both of these areas and positions itself as a value-add, middle-market distributor, performing additional services on products and using economies of scale to store and distribute improved products to customers. The industry’s performance is tied to several economic drivers, including housing starts, building permits, household formation, employment, labor force participation, voluntary quit rates, home values, rent prices, household debt, household income, and various commodity prices.
200
400
600
800
1000
Historical Forecasted

Team B
Growth in Building Permits for MSAs (thousands)
Source: US Census
Unemployment vs. “Quit” Rate
Source: Bureau of Labor Statistics
2014 ProSales 100 Top Ten
# Company Revenues
(mm)
1 ABC Supply $4,941
2 ProBuild $3,870
3 Beacon Roofing Supply
$2,279
4 Allied Building Products
$2,090
5 84 Lumber $1,821
6 Builders Firstsource
$1,490
7 L & W Supply $1,232
8 BMC $1,140
9 Stock Building Supply
$1,137
10 SRS Distribution $940
Source: ProSales Magazine
Labor Trends & Aggregate Demand U.S. population has grown by nearly 4% since 2010. An analysis of the 27 Metropolitan Statistical Areas (MSA) containing a Huttig distribution center shows a weighted-average population growth of 6% (Appx. 12A). The higher growth rate within these 27 MSAs supports Huttig’s strategic placement of distribution centers in terms of capturing population growth. U.S. housing starts have grown since 2009 and are currently at levels just over 1mm per month. This level is still below the historical 30-year average of 1.4mm and far below previous cycle peak levels (the two most recent being approximately 2.0mm and 1.8mm). From 2011 to 2015, housing starts grew at a CAGR of 13%. An analysis of growth in building permits issued for single and multi-family residences within the 27 MSAs over the same period yields a CAGR of 27%, with single-family permits growing at a CAGR of 13%. (Appx. 13A) This figure suggests that the areas in which Huttig operates are growing faster than the national average. Since 2010, the U.S. unemployment rate has fallen from 10% to 5%. However, this figure does not imply an increase in the employment rate, as the labor participation rate is at a 38-year low of 62%. This decline directly reduces the unemployment rate. Historically, there has been an inverse relation between unemployment and quit rates, and voluntary quit rates are correlated with wage growth. Current data suggests an environment for future wage growth. Although wage increases will affect Huttig’s operating expenses in aggregate, this cost will be offset by increased consumer demand for housing. Aggregate Supply
From 2009 to 2015, the U.S. vacancy rate has decreased from 2.8% to 1.1%. This trend suggests that supply of available housing is decreasing for home buyers, which could stimulate demand for new houses. This notion is supported by the concurrent increase in housing starts. Over the same period, the number of housing starts doubled from 554 to 1110 average starts per month. This trend is expected to continue as the housing market recovers. Huttig states that new housing drives the majority of their business, therefore more housing starts will likely result in higher revenues. In December of 2015, the Federal Reserve increased the Federal Funds rate from 0.25% to 0.5%. The Federal Funds rate is an important determinant of mortgage rates, and the S&P 500 Index has declined 6% YTD in 2016. The current market environment could, therefore, make the Fed less likely to continue rate hikes, keeping mortgage rates down for buyers. Pro-Dealer Consolidation In 2015, four of the top ten firms listed on the 2014 ProSales 100 List engaged in merger transactions with Builders Firstsource acquiring ProBuild, and Stock Building Supply acquiring a majority stake in SRS Distribution. The number six firm, Builders FirstSource, is set to acquire the number two firm, ProBuild, for approximately $1.6b, or about 36% of ProBuild’s 2014 revenues. This merger will create a national pro-dealer with combined 2014 revenues of $6.1b, greater than the 2014 revenues of the current largest pro-dealer ABC Supply. The increased purchasing power and economies of scale of this large pro-dealer could intensify competition with Huttig. BMC, the 9th largest pro-dealer by revenues, announced on June 3rd, 2015 that they have signed an agreement with Stock Building Supply to purchase 60% of the current ownership and allow the current CEO of BMC to oversee operations of Stock Building Supply. Following this pattern of consolidation, Huttig, with it’s nationwide millwork distribution network and relatively low market valuation, could be a potential acquisition target for a larger distribution firm looking to expand millwork operations.
Competitive Positioning Huttig notes there is little competition with large retailers such as Lowe’s® and Home Depot®, who sell products with little differentiation. Instead Huttig competes with local and regional distributors who are more aware of local demand. Huttig competes with these firms by utilizing an internal and external salesforce who interpret market demand at a local level. Huttig then distributes their large selection of SKUs using a real-time, nationwide information network. Huttig’s size and purchasing power allows them to make larger purchases than local distributors, resulting in savings through economies of scale that can be passed on to the customer.
0
20
40
60
80
100
120
140
Multi Single
0.0
0.5
1.0
1.5
2.0
2.5
3.0
0.0
2.0
4.0
6.0
8.0
10.0
12.0
Quit
Unem
ply
ment
Unemployment Quit

Team B
Porter’s Five Forces, 5 is favorable
Source: Team Estimates
Peer Group Market Capitalization
Ticker Price per
Share Market Cap
(mm)
HBP 3.16 79.4
BXC 0.34 31.3
BCC 19.36 755.5
BLDR 8.17 833.7
UFPI 66.65 1,300.0
Source: Bloomberg
Customer Feedback
As a means to verify Huttig’s claimed competitive strategy, we contacted several of the known customers of Huttig on the ProSales 100 list. We received two responses. BMC, the 8th largest pro-dealer, stated that their decision to purchase from Huttig was driven by their availability, customer service, and timeliness of delivery. 84 Lumber, the 5th largest dealer, stated Huttig’s widespread distribution network and diverse inventory of quality brands such as Therma-Tru® and Masonite®, were the reasons for choosing to purchase supplies from Huttig. This customer feedback supports Huttig’s stated competitive advantages. Benchmarking Selection Group Huttig is the largest nationwide millwork distributor in the U.S. The majority of Huttig’s competition is from regional millwork distributors. We selected a peer group for Huttig consisting of firms that have similar economic drivers, are publically listed, and offer products purchased for new residential construction. The selected peer group is as follows: Bluelinx Holdings (NYSE : BXC), Boise Cascade Company (NYSE : BCC), Builders Firstsource (NASDAQ : BLDR), and Universal Forest Products (NASDAQ : UFPI). It should be noted that we do not view these firms as perfectly analogous to Huttig. Some differentiating characteristics are market capitalization, geographic range, and product mix.
0
1
2
3
4
5New Entrants
Power of Buyers
Threat ofSubstitutes
Power of Suppliers
Competition
Percentage of Revenues 2014 Fiscal Year
Source: Bloomberg
Financial Analysis:
Revenue Huttig primarily generates revenues through three product categories: millwork, specialty building products, and wood products. Historically, approximately 50% of revenues have been generated from the sale of millwork products, with a slight decline in this percentage since 2006. Over the course of 2006 to 2014, there was a shift away from regular wood products and millwork toward specialty building products, with wood products decreasing from over 14% of total revenues to 11%, and specialty building products increasing from 32% to 40%. Revenues for the firm are closely tied to housing starts, with peak revenues of over $1.1b occurring in 2006 when housing starts averaged over 1.8mm monthly. Revenues decreased to $455mm in 2009 as monthly housing starts in the U.S. dropped to 554mm on average. As housing starts approached an average of 1.5mm per month, revenues have climbed to $632mm over the 2014 fiscal year and are nearly $650mm over the last 12 months.
Revenue Projections Notable drivers for Huttig’s revenues are wages, housing starts, and home price index value. We used data on projected housing starts sourced from Bloomberg to model sales in each of Huttig’s primary product segments going forward to 2020. Huttig’s revenues in the 2014 fiscal year were approximately $624mm. Our projection period has total revenues growing at a 10% CAGR to $909mm by 2020.
Margin Expansion Gross profit margins for the period of 2007 through 2010 averaged 18.5%, and 19.3% for the period of 2011 to 2014. This trend suggests improvement in the cost of inventory for Huttig. These margins could be the result of improved negotiations of large purchase orders or the low relative cost of lumber in recent years. (Appx. 22A) Given current prices of lumber futures and projections of fuel prices going
0%
10%
20%
30%
40%
50%
60%
70%
80%
90%
100%
HBP BXC BCC BLDR UFPI
Operating Income
Operating Expenses
Cost of Goods Sold
New Entrants (4) – Huttig employs a nationwide
distribution network. High capital costs could provide
barrier to entry at a similar scale.
Power of Buyers (2) – Huttig has thousands of
customers. 38% of their revenues, however, come from
just ten large customers.
Threat of Substitutes (2) – Huttig’s products have low
levels of differentiation. Large retailers provide many
substitutes.
Power of Suppliers (5) – Huttig has over 700 suppliers
and a vast inventory.
Competition (4) – Huttig competes mostly with local
dealers by using economies of scale.

Team B
Peer Group Inventory Turnover
Source: Bloomberg
As Reported Earnings Per Share
Source: Bloomberg
Total Debt by Year
Source: Company Filings
ROE Decomposition
Item 2014 2015E
Tax Burden
1 1
Interest Burden
26.5% 62.2%
Operating Margin
1.33% 1.24%
Asset Turnover
3.95 3.95
Leverage Ratio
6.14 5.38
Return on Equity
8.56% 16.39%
Source: Company Filings & Team Estimates
forward, we anticipate gross margins to expand to 20.5% by 2020. Operating margins have been poor since 2006, only becoming positive in the 2012 fiscal year. Currently, operating margins are just over 1.0%. Based on performance from recent initiatives in reinvestment of current capital and employees, we project improvement in operating performance that will result in operating margins of just over 3.0% by 2020. Quality of Earnings Reported net income from continuing operations per share for the first three quarters of 2015 was $1.14. This figure is up over 350% from $0.25 over the same period in 2014. This increase is largely due to the recognition of a tax asset valued at $17.4mm. Earnings from continuing operations before income taxes in the first three quarters of 2015 were $5.8mm. Management notes that foreseeable positive earnings in future periods and reconciliation of expenses incurred through agreements with the Department of Environmental Quality were the catalysts for recognizing the income tax benefit. Higher reported earnings from the tax asset has resulted in a P/E ratio of nearly 3.0x. This figure is approximately five times lower than the same period P/E in 2014 of nearly 15.0x. Earnings were analyzed using a Beneish M-Score model to test the effects of current period reporting in comparison to previous years. Analysis of the 2014 fiscal year period using the eight variable Beneish Model resulted in a score that was considered satisfactory.(Appx. 8A) Analysis of the last twelve months ended September 2015 in comparison with the same period in 2014 yielded a score of -1.73, higher than the maximum threshold of -2.22. The increase in score is due largely to a change in the asset quality index, driven by an increase from $16.1mm to $32.6mm in intangible assets from the tax asset. Due to the irregularity of the recognition of this tax asset, we predict earnings will be of high quality going forward.
Improving Asset Efficiency From 2006 to 2009, Huttig’s gross PP&E decreased by only 10.6%. In the trough of the market downturn, Huttig maintained 3.2mm square feet of warehouse space across it’s 27 distribution centers. From 2011 to 2014, fixed asset turnover increased from 13.0x to 19.0x with our projections increasing this figure to over 25.0x by 2019. This increase is driven by Huttig’s leverage of their current capital outlay. Inventory turnover is expected to remain near its historical average of 8.0x and total asset turnover is projected to improve from 4.0x to 4.3x. Capital Structure
The firm’s debt to equity ratio increased from 1.28 in 2006 to 5.14 in 2014, as losses decreased the value of retained earnings. We believe that the issuance of debt was necessary for Huttig to maintain operations during the housing downturn and does not suggest poor financial management for the firm. Total liabilities as a margin of sales remained less variable, as total liabilities equaled 12% of sales in 2006 and 22% of sales in 2014. Our future projections have this margin decreasing to 17% by 2019. Contributed capital has increased from 35.7mm in 2006 to 40.6mm in 2014. This increase is due solely to incentive based stock compensation and not primary offerings to the public as a means to raise capital. Solvency The current ratio for Huttig has improved from 1.7 in 2011 to 1.9 in 2014 driven mostly by increases in accounts receivable and inventory. The quick ratio, however, remains nearly constant from 2011 to 2014, which implies that inventory was the larger driver of the increased current ratio. Cash coverage ratios have improved from 1.7 in 2012 to over 5 in 2014 with little growth in interest expense compared to cash generated from operations. Huttig has historically generated an Altman Z Score greater than 3, which implies that the firm is at low risk of bankruptcy. (Appx. 7A) In 2011 the Altman Z Score was 3.86, whereas in 2014 this metric increased to 4.85. Return on Equity From the period 2006 to 2012, Huttig has generated negative returns on owner’s equity. As dilution of equity shares has remained fairly low with the number of shares outstanding increasing by 22.8% over the nine-year period from the end of 2006 to the end of 2015, we expect return on equity to remain in double-digits percentage returns over the projection period, increasing from the 2014 ROE of 14.4% to 26.8% in 2019. This increase is driven mostly by the following factors: (1). steady investment rate in capital and increasing cash flow from operations will likely result in low pressure to issue more shares in the future, (2). increasing asset efficiency as Huttig leverages the current outlay of distribution centers and
7.346.62
8.96
5.96
8.82
HBP BXC BCC BLDR UFPI
-$0.80-$0.60-$0.40-$0.20$0.00$0.20$0.40$0.60$0.80$1.00$1.20
40
45
50
55
60
65
70

Team B
Peer Group Share Turnover
Source: Bloomberg
Target Prices
Method Price
Discounted Cash Flow
$4.41
Forward P/E $4.68
EV/EBITDA $4.25
P/B $4.98
Peer Group Price to Earnings
Ticker Current
P/E Forward
P/E
HBP 7.2x -
BXC - -
BCC 12.4x 12.0x
BLDR 21.2x 10.0x
UFPI 18.6x 17.0x
Source: Bloomberg
Peer Group Relative Multiples
Ticker Price to
Book NTM
EV/EBITDA
BXC 30.00x -
BCC 1.41x 4.7x
BLDR 5.36x 6.5x
UFPI 1.75x 7.1x
equipment, and (3). lowering burden from interest as the times interest earned improves. We anticipate return on total debt to improve less substantially as debt is projected to be a source of increases in asset base. Return on debt was just under 5% in 2014 and is projected to increase to 7% in 2019.
Trading volume
Due to Huttig’s small market cap and lack of coverage, trading volume is lower than most of the comparables. However, general increases in volume occur in the summer and winter months of every fiscal year, as is to be expected with a cyclical firm. As of January 3rd, 2016, Huttig's 240-day accumulated daily average volume is slightly above 13,000 shares, or 0.05% of shares outstanding. This figure is fairly low compared to Huttig’s peers. Builder's Firstsource has 240-day average share turnover of about 0.68%, Universal Forest Product's share turnover is about 0.4%, and BlueLinx has a share turnover of about 0.617%. Boise Cascade has the lowest 240-day share turnover of about 0.04%. We believe that Huttig's low share turnover is another factor in its low valuation. Potential to Expand Operations Huttig currently operates in 41 states within the U.S. The company owns 13 of their 27 distribution centers with the remaining balance leased. Operating cash flow has been positive since 2012 and interest coverage has improved threefold as well. Huttig also is party to a $160mm revolving credit agreement of which not more than $67mm has been utilized. Given this information, it is likely that Huttig will have the capacity to expand operations should beneficial opportunities arise.
Valuation:
Methodologies We use the discounted cash flow method (DCF) as our primary valuation approach in arriving at a target price of $4.41. This method involved calculating and forecasting free cash flow to the firm, defined as net operating profit less adjusted taxes (NOPLAT) less the required investment in capital. We complement our DCF model with three relative valuation methods. These approaches allow us to evaluate how expensive HBP is trading relative to the selected peer group. The multiples we used were price to earnings (P/E), price to book (P/B), and enterprise value to EBITDA (EV/EBITDA) with the multiples based on HBP’s historical relation to a group of comparable companies. These four approaches resulted in a price target range of $4.25 - $4.98 per share, or an upside range of approximately 35% - 58%.
Huttig Building Products has yet to issue any dividends to shareholders. Without a reasonable expectation that dividends will be issued in the future, dividends were not considered in any future projections. Price to Earnings Huttig currently has the lowest P/E ratio of the peer group at approximately 7x. The average for the peer group is around 18x. The average forward P/E (NTM) for the peer group is 13x. Applying this multiple to our projected 2016 earnings per share for Huttig results in a target price of $4.68, after incorporating a 10% liquidity discount. Enterprise Value to EBITDA The current average forward EV/EBITDA multiple for the peer group is 6.1x based on data from Bloomberg. According to data from the NYU Stern School of Business the current average for building supplies is approximately 11.4x and for homebuilding is 13.7x. Therefore, we applied the average a multiple of 9.0x to the 2016 projected EBITDA to estimate an enterprise value of approximately $178mm. After adding back excess cash and deducting the value of debt, we arrive at an equity value of approximately $114mm. After applying the liquidity discount the resulting per share value is $4.25. Price to Book
The current price to book multiple for Huttig is approximately 1.6x. Comparables for Huttig have a wide range of price to book multiples from approximately 1.4x to over 30.0x. Therefore, we examined historical price to book values for Huttig over the prior five years to arrive at our applied price to book multiple. These multiples range from a low of 0.2x in October of 2011 to 7.3x in June of 2014, with an average of 2.4x. Applying this historical average multiple for Huttig results in a per share value of $4.98.
0.05%
0.62%
0.04%
0.68%
0.40%

Team B
Free Cash Flow (mm)
DCF Model Summary
Component Value
Present Value FCF $19.7
Discounted Continuing Value
$233.3
Value of Operations $253.0
Excess Cash $0.0
Debt $67.0
Op. Leases $68.0
Equity Value $118.1
Shares Outstanding 24.1
Price Per Share $4.41
Note: A liquidity discount of 10% is applied to the price per share
WACC Components
Component Value
Beta 1.5
Risk Premium 6.0%
Risk Free Rate 2.0%
Debt Weight 47.0%
Equity Weight 53.0%
Cost of Equity 10.8%
Cost of Debt 7.0%
After Tax Cost of Debt 4.6%
Total WACC 7.8%
Free Cash Flow We projected HBP’s free cash flows for the next five years using our revenue and margin forecasts discussed in the Financial Analysis section. (Appx 4A) NOPLAT was computed through projections of operating profits less an estimated tax rate of 37.5%. Huttig notes a net operating tax loss carry forward of $29.8mm of which $17.4mm was recognized in 2015 and applied to net income.
WACC We computed the weighted average cost of capital using the relative weights of equity and debt to capital structure and the respective costs of capital. (Appx. 3A) There are no preferred shares outstanding to consider. This calculation results in a WACC of 7.87%. Cost of equity was estimated using a capital asset pricing model. The beta used for Huttig was computed by analyzing weekly price adjustments in HBP against the S&P 500 Index, which results in a beta of approximately 1.5. The cost of debt utilized for the WACC measure was 8.0%, an industry segment average. The 10-k for Huttig notes a weighted average cost of debt, acquired through the revolving credit facility, of nearly 2.25%. Given the projected changes in interest rates and industry specific volatility we felt a more prudent measure would be the industry average. Debt to equity for the firm is slightly over 1.
Continuing Value We computed a continuing value using a constant growth, perpetuity model. (Appx. 3B) A 3.0% growth rate was selected as a conservative measure historically seen in average overall economic growth. This perpetuity was forecasted for the end of 2019 year. The total value of operations is estimated to be $253mm
Operating Leases Huttig Building Products currently leases 14 of their 27 distribution centers in addition to their corporate headquarters located in St. Louis. Operating lease expenses going forward are sourced from company reports. These expenses are then discounted to the current year using the cost of debt as the discount rate. Huttig currently does not capitalize any lease agreements.
Target Price After taking the sum of the discounted, projected free cash flow and the continuing value we arrive at an overall value of operations of $253 mm. The value of outstanding debt and present value of operating leases is then deducted from the value of operations to arrive at a residual value for shareholders of approximately $118mm. Dividing this amount by the current shares outstanding of 24.1mm results in a value per share of $4.90. We then discounted this value by 10% to account for liquidity risk. This gives us a target price of $4.41 per share.
Valuation Summary:
We are most confident in our DCF valuation approach to developing a target price for Huttig. This view is based on the following reasons: (1). Huttig does not have a perfectly analogous competitor operating in similar markets on a similar scale, (2). The building materials segment is highly cyclical with comparable firms receiving revenues from a different mix of building products. Cycle effects could adversely affect some firms’ ratios more than others, and (3). With restructuring activity occurring in a segment recovering from a large downturn, some firms are reporting earnings that are less reliable predictors of future earnings. The range of price targets from comparables is $4.68 for forward P/E valuation, $4.98 for the price to book and $4.25 for the EV/EBITDA multiple. Our DCF model yields a price per share of $4.41, which is within the $4.25 -$4.98 range generated form relative valuation.
$0.0$1.0$2.0$3.0$4.0$5.0$6.0$7.0$8.0

Team B
Sensitivity Analysis: Operating Margin Expansion by Long-Term Economic Growth Rate
0.0% 0.5% 1.0% 1.5% 2.0%
1.0% 2.53 3.42 4.30 5.19 6.08
2.0% 2.57 3.46 4.35 5.24 6.13
3.0% 2.62 3.51 4.41 5.31 6.20
4.0% 2.70 3.60 4.51 5.41 6.32
5.0% 2.83 3.75 4.67 5.59 6.51 Operating margin expansion: X axis
Target Price Sensitivity to Beta
Beta Target Price
1.3 $5.70
1.4 $4.89
1.5 $4.41
1.6 $3.56
1.7 $3.01
Target Price sensitivity to Debt/Equity Ratio
Debt/Equity Target Price
0.67 $3.52
0.75 $3.88
0.89 $4.41
1.00 $4.85
1.12 $5.32 Target Price Sensitivity to WACC
WACC Target Price
6.75% $7.32
7.35% $5.47
7.79% $4.41
8.35% $3.32
8.75% $2.67
Risks:
Housing Market Downturn Although the number of housing starts per year has been increasing since 2009, this trend cannot be guaranteed to continue. The housing market is highly cyclical, and should the housing market’s recovery slow or even reverse, Huttig will likely see adverse effects on its revenue. Many of the factors that influence demand for housing, such as employment, interest rates, and immigration patterns, are beyond Huttig’s control, and it will be up to management to foresee such headwinds and preemptively prepare.
Environmental Regulation With the increasing emphasis of environmental protection in the political arena, any new legislation could result in significant compliance costs for the company. Huttig has recently been ordered by the state of Montana to clean up contamination from a site previously used by Huttig to construct windows. Huttig estimates the cleanup cost of this site to be $8.2mm. Huttig notes that they have current and former distribution centers located in areas potentially facing contamination. Costs of clean up, should Huttig be found to be responsible, could be significant.
Unionized Employees
A sizable percentage of Huttig’s employees are unionized, with about 13% of employees belonging to one of four unions. As of 2014, Huttig has eight collective bargaining agreements, and four of the union contracts are scheduled for renegotiation in 2015. Should these negotiations require Huttig to put forth additional resources, operating costs could increase. Although Huttig states they have not historically experienced any strikes or work interruptions, any future strikes could negatively impact earnings and investor confidence. Huttig believes their employee relations to be generally favorable.
Financial Risk Part of Huttig’s debt structure is the inclusion of financial covenants. As a part of Huttig’s revolving credit facility, a fixed charge coverage ratio of at least 1.05/1 must be maintained. In December of 2014, Huttig’s FCCR exceeded 1.05/1. If the firm is unable to maintain this ratio in the future, Huttig’s lenders have the right to terminate these credit agreements. In addition, Huttig has posted certain assets as collateral, and if this covenant is not met, lenders have the right to foreclose on these assets.
Sales Risk
Huttig’s revenues come from a concentrated group of customers. In 2014, Huttig’s top ten customers account for 38% of revenues, and one customer alone represents 12% of Huttig’s sales. Huttig believes that customer relations are strong, but without fixed contracts, there can be no guarantee that these customers will continue to do business with Huttig in the future. Should Huttig lose one or more of these customers, sales, cash flows, and liquidity would likely be negatively affected.
Suppliers Huttig’s business model relies on purchasing raw materials from suppliers. Huttig states that more than 50% of their purchases come from 10 companies. Although Huttig believes that supplier relationships are strong, there are no contracts to guarantee these suppliers will be willing to conduct business in the future. If one or more of these suppliers were to shut down, Huttig may encounter search costs of finding new suppliers, and the shortage of materials may affect relationships with their customers.
Huttig’s suppliers are also exposed to fluctuations in commodity prices. If the price of lumber, an important input in housing construction, were to increase, the cost of sales for Huttig would also likely increase putting downward pressure on margins. As Huttig is a wholesaler, it is possible that the price of these materials could decrease the purchase from the supplier.

Team B
Disclosures: Ownership and material conflicts of interest:
The author(s), or a member of their household, of this report does not hold a financial interest in the securities of this company.
The author(s), or a member of their household, of this report does not know of the existence of any conflicts of interest that might bias the
content or publication of this report.
Receipt of compensation:
Compensation of the author(s) of this report is not based on investment banking revenue.
Position as a officer or director:
The author(s), or a member of their household, does not serve as an officer, director or advisory board member of the subject company.
Market making:
The author(s) does not act as a market maker in the subject company’s securities.
Disclaimer:
The information set forth herein has been obtained or derived from sources generally available to the public and believed by the author(s) to
be reliable, but the author(s) does not make any representation or warranty, express or implied, as to its accuracy or completeness. The
information is not intended to be used as the basis of any investment decisions by any person or entity. This information does not constitute
investment advice, nor is it an offer or a solicitation of an offer to buy or sell any security. This report should not be considered to be a
recommendation by any individual affiliated with CFA Society of St. Louis, CFA Institute or the CFA Institute Research Challenge with regard to
this company’s stock.
CFA Institute Research Challenge

Team B
Appendix 1A: Income Statement
Ea
rnin
gs P
er S
ha
re ($
)
We
ighte
d A
ve
rag
e
Sh
are
s O
uts
tan
din
g
(tho
usa
nds)
Ne
t Inco
me fro
m
Co
ntin
uin
g O
pe
ratio
ns
Ta
x E
xp
ense
Ea
rnin
gs B
efo
re T
axe
s
Inte
rest E
xp
ense
, Ne
t
Re
po
rted O
pe
ratin
g
Incom
e
Ga
in o
n D
ispo
sal
Go
od
will Im
pa
irme
nt
Op
era
ting
Incom
e
Oth
er O
pe
ratin
g
Exp
enses
Sto
ck B
ase
d
Co
mp
ensa
tion
De
pre
cia
tion
Co
st o
f Go
ods S
old
Re
ve
nue
s
$ m
illion
s, e
xce
pt p
er
sh
are
data
(0.3
5)
20
,270
-7.1
-2.3
-9.4
5.3
-4.1
0.0
0.0
-4.1
20
2.9
1.8
5.2
89
6.9
11
02
.7
20
06
(0.4
3)
20
,570
-8.8
-3.7
-12
.5
4.2
-8.3
-2.4
0.8
-9.9
16
9.2
1.6
4.1
70
9.8
87
4.8
20
07
(1.6
8)
20
,922
-35
.2
-4.0
-39
.2
2.6
-36
.6
-1.0
8.7
-28
.9
14
6.2
1.3
3.8
54
8.6
67
1.0
20
08
(0.9
3)
21
,190
-19
.8
-2.8
-22
.6
1.5
-21
.1
-1.5
1.0
-21
.6
10
1.3
0.9
3.5
37
1.1
45
5.2
20
09
(0.9
0)
21
,547
-19
.4
-0.4
-19
.8
2.1
-17
.7
-0.4
0.0
-18
.1
99
.4
0.8
3.1
38
2.5
46
7.7
20
10
(0.5
7)
22
,160
-12
.7
-0.3
-13
.0
2.8
-10
.2
0.0
0.4
-9.8
95
.8
0.5
2.7
39
0.1
47
9.3
20
11
0.0
0
22
,892
-0.1
0.0
-0.1
2.9
2.8
-2.4
1.9
2.3
95
.0
0.8
2.6
42
0.4
52
1.1
20
12
0.1
6
22
,800
3.6
0.1
3.7
2.6
6.3
0.0
0.0
6.3
10
1.1
1.0
2.7
45
0.4
56
1.5
20
13
0.2
5
23
,500
5.8
0.0
5.8
2.5
8.3
0.0
0.0
8.3
10
9.9
1.4
3.0
50
1.1
62
3.7
20
14
1.1
6
24
,100
28
.0
-17
.4
10
.6
3.1
13
.7
0.0
0.0
13
.7
11
7.4
1.8
3.7
54
6.2
68
2.8
20
15
0.4
0
24
,550
9.4
2.5
12
.7
3.3
15
.9
0.0
0.0
15
.9
12
9.3
1.8
3.9
60
0.8
75
1.0
20
16
0.4
8
25
,000
12
.0
4.0
16
.0
3.3
19
.3
0.0
0.0
19
.3
13
9.5
1.8
3.9
65
0.2
81
4.7
20
17
0.5
3
25
,450
13
.5
4.9
18
.4
3.3
21
.8
0.0
0.0
21
.8
14
3.5
1.8
4.1
67
1.9
84
3.0
20
18
0.5
1
25
,900
13
.2
7.9
21
.1
3.4
24
.4
0.0
0.0
24
.4
14
8.1
1.8
4.2
69
6.9
87
5.5
20
19
Team B
Appendix 2A: Balance Sheet - Assets
To
tal A
sse
ts
To
tal F
ixe
d
To
tal O
the
r
De
ferre
d
Ta
xes
Oth
er F
ixe
d
Go
od
will
Ne
t Fix
ed
Acc. D
ep
r.
Gro
ss
Ma
ch
inery
Bu
ildin
gs
La
nd
To
tal C
urre
nt
Oth
er
Inven
tory
Acc. R
ec.
Ca
sh
$ in
millio
ns
25
0.6
57
.2
27
.2
2.3
5.8
19
.1
30
.0
40
.7
70
.7
31
.9
32
.8
6.0
19
3.4
15
.9
97
.3
74
.1
6.1
20
06
21
2.7
52
.5
25
.9
2.5
5.1
18
.3
26
.6
39
.2
65
.8
30
30
.2
5.6
16
0.2
13
.6
88
.7
56
.1
1.8
20
07
14
6
45
.3
20
.9
8.0
3.3
9.6
24
.4
40
.1
64
.5
29
.5
29
.4
5.6
10
0.7
5.5
59
.4
33
2.8
20
08
13
6.2
40
.2
19
.3
8.2
2.5
8.6
20
.9
42
.3
63
.2
28
.4
29
.2
5.6
96
7.8
45
.1
41
.8
1.3
20
09
12
6.1
37
.7
19
.8
8.2
3
8.6
17
.9
40
.5
58
.4
29
.1
24
.4
4.9
88
.4
4.3
46
.2
37
.1
0.8
20
10
12
5
35
.8
18
.6
8.0
2.4
8.2
17
.2
41
.9
59
.1
29
.7
24
.4
5
89
.2
4.3
44
.8
39
.4
0.7
20
11
13
7.5
31
.2
15
.6
7.1
2.2
6.3
15
.6
43
.7
59
.3
31
.2
23
.8
4.3
10
6.3
7.3
55
41
.7
2.3
20
12
15
1.5
32
.7
16
.1
7.9
1.9
6.3
16
.6
46
.1
62
.7
34
.2
24
.2
4.3
11
8.8
7.2
66
.7
44
.3
0.6
20
13
15
8.0
33
.4
16
.5
8.0
2.2
6.3
16
.9
48
.8
65
.7
36
.0
25
.4
4.3
12
4.6
7.8
67
.4
48
.9
0.5
20
14
18
6.9
53
.3
34
.5
24
.5
3.7
6.3
18
.8
48
.8
67
.6
37
.5
25
.8
4.3
13
3.6
9.5
69
.0
52
.0
3.2
20
15
20
0.3
55
.5
34
.8
24
.5
4.0
6.3
20
.7
48
.8
69
.5
39
.0
26
.2
4.3
14
4.6
10
.4
72
.5
56
.7
5.1
20
16
21
5.7
57
.9
35
.3
24
.5
4.5
6.3
22
.6
48
.8
71
.4
40
.5
26
.6
4.3
15
7.9
10
.5
80
.4
60
.5
6.5
20
17
22
6.9
60
.1
35
.6
24
.5
4.8
6.3
24
.5
48
.8
73
.3
42
.0
27
.0
4.3
16
6.8
10
.9
83
.3
61
.6
11
.0
20
18
24
2.1
63
.0
36
.6
24
.5
5.8
6.3
26
.4
48
.8
75
.2
43
.5
27
.4
4.3
17
9.1
14
.0
85
.1
63
.2
16
.8
20
19

Team B
Appendix 2B: Balance Sheet – Liabilities and Owners Equity
To
tal L
iab
. +
Eq
uity
To
tal E
qu
ity
Le
ss: T
rea
su
ry
Sh
are
s
Re
tain
ed
Ea
rnin
gs
Co
ntrib
ute
d
Ca
pita
l
To
tal L
iab
.
To
tal L
ong
-
Te
rm L
aib
.
Oth
er L
ong
-
Te
rm L
iab.
Lo
ng
-Te
rm
Le
ss C
urre
nt
Cu
rren
t
Lia
bilitie
s
Oth
er A
ccru
ed
Accru
ed
Co
mp
ensa
tion
De
ferre
d
Incom
e T
axes
Accou
nts
Pa
ya
ble
Cu
rren
t Lo
ng
-
Te
rm D
eb
t
$ in
millio
ns
25
0.6
10
9.7
-2.0
76
.0
35
.7
14
0.9
46
.8
4.0
42
.8
94
.1
16
.8
7.8
4.5
62
.1
2.9
20
06
21
2.7
10
4.3
-0.2
68
.2
36
.3
10
8.4
29
.6
4.2
25
.4
78
.8
15
.9
6.3
5.3
50
.1
1.2
20
07
14
6
70
.3
0.0
32
.8
37
.5
75
.7
26
.2
2.5
23
.7
49
.5
14
.4
4.3
6.9
23
.5
0.4
20
08
13
6.2
50
.7
0.0
12
.3
38
.4
85
.5
36
.8
2.0
34
.8
48
.7
12
.4
1.6
8.2
25
.9
0.6
20
09
12
6.1
32
.6
0.0
-6.6
39
.2
93
.5
43
.5
1.6
41
.9
50
13
.2
2.3
8.2
26
.1
0.2
20
10
12
5
19
.9
0.0
-19
.8
39
.7
10
5.1
53
.3
1.1
52
.2
51
.8
13
.6
1.5
8.0
28
.3
0.4
20
11
13
7.5
19
.1
0.0
-20
.3
39
.4
11
8.4
61
.1
1.9
59
.2
57
.3
14
.3
4.1
7.1
31
.2
0.6
20
12
15
1.5
22
.9
0.0
-17
.1
40
12
8.6
62
.1
1.3
60
.8
66
.5
13
.1
3.5
7.9
40
.8
1.2
20
13
15
8
25
.7
0.0
-14
.9
40
.6
13
2.3
66
.2
3.8
62
.4
66
.1
13
.4
4.0
8.0
39
.4
1.3
20
14
18
6.9
30
.9
0.0
-9.7
40
.6
13
5.5
66
.2
4.2
62
.0
70
.7
17
.4
3.9
6.0
42
.0
1.5
20
15
20
0.3
38
.0
0
-2.6
40
.6
14
2.3
64
.1
2.5
61
.6
78
.0
18
.8
4.4
6.0
47
.1
1.7
20
16
21
5.7
46
.9
0
6.3
40
.6
14
7.5
61
.4
1.6
59
.8
84
.8
19
.9
5.2
6.0
51
.9
1.9
20
17
22
6.9
57
.8
0
17
.2
40
.6
15
1.6
55
.7
1.0
54
.7
88
.5
20
.7
5.1
6.0
54
.3
2.3
20
18
24
2.1
68
.8
0
28
.2
40
.6
16
0.0
56
.1
4.4
51
.7
89
.7
21
.0
5.3
6.0
55
.0
2.4
20
19

Team B
Appendix 3A: Weighted Average Cost of Capital Calculation
Beta 1.47 Cost of Equity 10.8%
Risk Premium 6.0% Cost of Debt 8.0%
Risk Free Rate
2.0% After-Tax Cost of Debt
4.6%
Weight Equity 53.0%
Weight Debt 47.0% WACC 7.8%
Risk Free Rate was estimated using current returns on 10 Year Treasury Bonds
Cost of Equity was calculated using the Capital Asset Pricing Model: Re = Rf + β(Rm – Rf)
Appendix 3B: Discounted Cash Flow Valuation
$ in millions, except per share
data 2015 (Q4) 2016 2017 2018 2019
Free Cash Flow 2.37 1.22 3.80 8.55 8.81
Present Value Factor
0.98 0.91 0.84 0.78 0.72
Present Value of Free Cash Flow
2.33 1.11 3.21 6.70 6.41
Continuing Value 321.00 NOPLAT (2020) 24.60
Present Value of Continuing Value
233.36 Return on Invested Capital
8.0%
Value of Operations
253.11 Perpetual Growth Rate
3.0%
Debt 67.00
Operating Lease Value
68.02
Equity Value 118.09
Shares Outstanding
24.10
Price Per Share 4.41
Present Value Factor computed using the formula 1/(1 + WACC)n

Team B
Appendix 4A: Free Cash Flow
Fre
e C
as
h
Flo
w
Ch
an
ge
in
Investe
d C
ap
ital
NO
PL
AT
Ad
j. Taxes
Imp
lied
Inte
rest
from
Op
era
ting
L
ea
se
s
EB
IT
$ in
millio
ns
52
.1
-48
.0
4.2
-3.7
8.8
-8.3
20
07
28
.3
-54
.0
-25
.6
-4
6.7
-36
.6
20
08
16
.8
-29
.7
-13
.0
-2.8
5.3
-21
.1
20
09
-3.6
-10
.0
-13
.7
-0.4
3.6
-17
.7
20
10
-5.6
-0.5
-6.2
-0.3
3.7
-10
.2
20
11
-6.2
12
.9
6.6
0
3.8
2.8
20
12
-0.1
10
.4
10
.3
0.1
4.1
6.3
20
13
1.5
11
.3
12
.8
0
4.5
8.3
20
14
9.5
9.3
18
.7
(0.1
)
5.0
13
.7
20
15
1.2
17
.2
18
.4
2.8
5.2
15
.9
20
16
3.8
17
.5
21
.3
4.0
6.0
19
.3
20
17
8.6
14
.8
23
.3
4.9
6.5
21
.8
20
18
8.8
14
.7
23
.5
7.9
7.0
24
.4
20
19

Team B
Appendix 5A: Net Operating Working Capital
Ne
t Op
era
ting
Wo
rkin
g
Ca
pita
l
Op
era
ting
Cu
rren
t
Lia
bilitie
s
Oth
er A
ccru
ed
Lia
bilitie
s
Accru
ed
C
om
pe
nsa
tion
Tra
de
Accou
nts
Pa
ya
ble
Op
era
ting
Cu
rren
t Asse
ts
Oth
er C
urre
nt
Inven
tory
Tra
de
Accou
nts
R
ece
iva
ble
,
ne
t
Wo
rkin
g C
ash
$ in
millio
ns
10
6.7
86
.7
16
.8
7.8
62
.1
19
3.4
15
.9
97
.3
74
.1
6.1
20
06
87
.9
72
.3
15
.9
6.3
50
.1
16
0.2
13
.6
88
.7
56
.1
1.8
20
07
58
.5
42
.2
14
.4
4.3
23
.5
10
0.7
5.5
59
.4
33
.0
2.8
20
08
56
.1
39
.9
12
.4
1.6
25
.9
96
.0
7.8
45
.1
41
.8
1.3
20
09
46
.8
41
.6
13
.2
2.3
26
.1
88
.4
4.3
46
.2
37
.1
0.8
20
10
45
.8
43
.4
13
.6
1.5
28
.3
89
.2
4.3
44
.8
39
.4
0.7
20
11
56
.7
49
.6
14
.3
4.1
31
.2
10
6.3
7.3
55
.0
41
.7
2.3
20
12
61
.4
57
.4
13
.1
3.5
40
.8
11
8.8
7.2
66
.7
44
.3
0.6
20
13
67
.8
56
.8
13
.4
4.0
39
.4
12
4.6
7.8
67
.4
48
.9
0.5
20
14
70
.5
59
.4
16
.8
3.9
42
.0
13
3.6
9.5
69
.0
52
.0
3.2
20
15
73
.5
65
.3
13
.6
4.4
47
.2
14
3.8
9.5
72
.6
56
.7
5.1
20
16
80
.9
70
.9
13
.9
5.2
51
.9
15
7.7
10
.4
80
.4
60
.5
6.5
20
17
89
.8
73
.6
14
.1
5.1
54
.3
16
6.4
10
.5
83
.3
61
.6
11
.0
20
18
10
0.2
74
.7
14
.4
5.3
55
.0
17
5.9
10
.9
85
.1
63
.2
16
.8
20
19

Team B
Appendix 5B: Invested Capital
Re
turn
on
Inv
es
ted
Ca
pita
l
Investe
d
Ca
pita
l
Oth
er N
on
-
Cu
rren
t
Lia
bilitie
s
Oth
er A
sse
ts
Op
era
ting
Le
ase
s
Pro
pe
rty, P
lan
t
an
d
Eq
uip
me
nt, n
et
Accum
ula
ted
De
pre
cia
tion
Gro
ss P
lan
t,
Pro
pe
rty a
nd
Eq
uip
me
nt
Ma
ch
inery
Bu
ildin
gs
La
nd
Ne
t Op
era
ting
Wo
rkin
g
Ca
pita
l
$ in
millio
ns
25
8.8
4.0
5.8
12
0.3
30
.0
40
.7
70
.7
31
.9
32
.8
6.0
10
6.7
20
06
1.8
%
21
0.8
4.2
5.1
95
.4
26
.6
39
.2
65
.8
30
.0
30
.2
5.6
87
.9
20
07
-13
.9%
15
6.9
2.5
3.3
73
.2
24
.4
40
.1
64
.5
29
.5
29
.4
5.6
58
.5
20
08
-9.1
%
12
7.1
2.0
2.5
49
.6
20
.9
42
.3
63
.2
28
.4
29
.2
5.6
56
.1
20
09
-11
.2%
11
7.1
1.6
3.0
51
.0
17
.9
40
.5
58
.4
29
.1
24
.4
4.9
46
.8
20
10
-5.3
%
11
6.6
1.1
2.4
52
.3
17
.2
41
.9
59
.1
29
.7
24
.4
5.0
45
.8
20
11
5.4
%
12
9.4
1.9
2.2
56
.8
15
.6
43
.7
59
.3
31
.2
23
.8
4.3
56
.7
20
12
7.7
%
13
9.8
1.3
1.9
61
.2
16
.6
46
.1
62
.7
34
.2
24
.2
4.3
61
.4
20
13
8.8
%
15
1.1
3.8
2.2
68
.0
16
.9
48
.8
65
.7
36
.0
25
.4
4.3
67
.8
20
14
11
.9%
16
4.2
4.2
3.6
71
.7
18
.8
48
.8
67
.6
37
.5
25
.8
4.3
74
.2
20
15
10
.3%
18
2.7
2.5
4.1
81
.9
20
.7
48
.8
69
.5
39
.0
26
.2
4.3
78
.6
20
16
11
.1%
20
1.1
1.6
4.5
88
.9
22
.6
48
.8
71
.4
40
.5
26
.6
4.3
86
.8
20
17
11
.1%
21
6.5
1.0
4.8
95
.3
24
.5
48
.8
73
.3
42
.0
27
.0
4.3
92
.9
20
18
10
.4%
23
1.1
4.4
5.8
10
2.1
26
.4
48
.8
75
.2
43
.5
27
.4
4.3
10
1.2
20
19

Team B
Appendix 6A: Accounting Ratios
Liq
uid
ity
Op
era
tion
s
Pro
fitab
ility
Qu
ick R
atio
Cu
rren
t
Ra
tio
Fix
ed
Asse
t T
urn
ove
r
Inven
tory
T
urn
ove
r
To
tal A
sse
t T
urn
ove
r
Accou
nts
Re
ce
iva
ble
Tu
rnove
r
Re
turn
on
Eq
uity
Re
turn
on
Asse
ts
Ne
t Pro
fit
Ma
rgin
Op
era
ting
Pro
fit Ma
rgin
NO
I/EB
ITD
A
0.9
1.7
13
.0
8.6
3.8
12
.5
-63
.8%
-10
.2%
-2.6
%
-2.0
%
13
6.0
%
20
11
0.9
1.9
15
.6
7.4
4.0
12
.9
-0.5
%
-0.1
%
0.0
%
0.4
%
51
.9%
20
12
0.8
1.8
17
.6
6.5
3.9
13
.1
15
.7%
2.4
%
0.6
%
1.1
%
70
.0%
20
13
0.9
1.9
18
.9
7.1
4.0
13
.4
22
.6%
3.7
%
0.9
%
1.3
%
73
.5%
20
14
0.9
1.9
19
.3
7.5
4.1
13
.3
68
.9%
3.1
%
4.0
%
2.0
%
68
.9%
20
15
0.9
1.9
21
.5
7.8
4.3
14
.1
24
.4%
3.9
%
1.3
%
2.1
%
74
.6%
20
16
1.0
2.0
23
.1
7.8
4.3
13
.9
29
.6%
4.6
%
1.5
%
2.4
%
78
.5%
201
7
1.0
2.0
24
.6
7.8
4.3
14
.1
33
.3%
5.2
%
1.6
%
2.6
%
81
.1%
201
8
1.1
2.1
25
.3
7.9
4.3
14
.2
29
.2%
4.8
%
1.5
%
2.8
%
83
.1%
201
9

Team B
Appendix 7A: Altman Z Score (Historical)
2011 2012 2013 2014
Working Capital/ Total Assets
0.37 0.41 0.41 0.43
Retained Earnings/ Total Assets
-0.16 -0.15 -0.11 -0.09
EBIT/ Total Assets -0.08 0.02 0.04 0.05
Market Cap/ Total Liabilities
0.11 0.30 0.66 0.58
Sales/ Total Assets 3.83 3.79 3.71 3.95
Altman Z Score 3.86 4.31 4.57 4.85
A Z Score < 1.6 indicates a high risk of bankruptcy, a Z Score between 1.6 and 3 is considered cautious, > 3 is considered
satisfactory
Appendix 8A: 8 Variable Beneish M Score (9 months ended Sept. 30th)
Year 2014 2015 Days Sales in Receivables Index 0.989
Net Sales 478.5 504.2 Gross Margin Index 1.024
Cost of Goods 384.6 402.9 Asset Quality Index 1.808
Net Receivables 71.1 74.1 Sales Growth Index 1.054
Current Assets 149.6 154.1 Depreciation Index 0.918
Property, Plant and Equipment
16.8 17.7 Sales, General and Administrative Expenses Index
0.981
Depreciation 2.3 2.2 Leverage Index 0.071
Total Assets 182.5 204.4 Total Accruals to Total Assets 0.845
SGA Expense 85.8 88.7
Net Income 2.7 25.6
Cash Flow from Operations
-10.3 -0.9 8 Variable M Score -1.73
Current Liabilities 79.7 75.4 A score greater than -2.22 indicates earnings
manipulation
Long-term Debt 79.7 75.4
8 variable equation: M = -4.84 + .920 DSRI + .528 GMI + .404 AQI + .892 SGI + .115 DEPI -.172 SGAI + 4.679 Accrual to TA -
.327 Leverage

Team B
Appendix 9A: Consumer Confidence Index
The Consumer Confidence Index is developed and issued monthly by the independent economic research organization The
Conference Board.
Appendix 10A: Average Annual Fixed Mortgage Rate (15 year, Historical)
Source: Freddie Mac
0%
1%
2%
3%
4%
5%
6%
7%
8%
9%
94
95
96
97
98
99
100
101
102
Jan-09 Jan-10 Jan-11 Jan-12 Jan-13 Jan-14 Jan-15

Team B
Appendix 11A: Sales by Segment
Wo
od
Pro
du
cts
Bu
ildin
g
Pro
du
cts
Millw
ork
To
tal
Wo
od
Pro
du
cts
Bu
ildin
g
Pro
du
ct
Millw
ork
($ in
millio
ns
)
14
.5%
31
.9%
53
.6%
11
02
.5
15
9.3
35
1.7
59
1.5
20
06
13
.3%
36
.8%
49
.9%
87
4.8
11
6.2
32
1.7
43
6.9
20
07
11
.3%
43
.2%
45
.5%
67
1
75
.6
28
9.9
30
5.5
20
08
9.1
%
45
.9%
44
.9%
45
5.2
41
.5
20
9.1
20
4.6
20
09
10
.6%
41
.4%
48
.0%
46
7.7
49
.6
19
3.7
22
4.4
20
10
11
.1%
43
.9%
44
.9%
47
8.7
53
.3
21
0.3
21
5.1
20
11
11
.3%
42
.1%
46
.5%
52
0.5
58
.8
21
9.4
24
2.3
20
12
12
.1%
38
.4%
49
.5%
56
1.5
68
21
5.4
27
8.1
20
13
11
.6%
39
.4%
49
.0%
62
3.7
72
.1
24
5.7
30
5.9
20
14
11
.9%
38
.8%
49
.3%
68
2.8
81
.0
26
4.7
33
7.0
20
15
12
.2%
38
.1%
49
.7%
75
1.0
91
.6
28
6.3
37
3.1
20
16
12
.5%
37
.6%
49
.9%
81
4.7
10
1.7
30
6.0
40
7.0
20
17
12
.7%
37
.1%
50
.2%
84
3.0
10
6.3
31
4.7
42
2.1
20
18
13
.0%
36
.6%
50
.4%
87
5.5
11
1.6
32
4.5
43
9.4
20
19
13
.2%
36
.2%
50
.6%
90
9.0
11
7.2
33
4.6
45
7.3
20
20

Team B
Appendix 12A: Population Change by Distribution Center MSA
City State MSA 2014 2010 % Change
Auburn WA Seattle-Tacoma-Bellevue, WA Metropolitan
Statistical Area 3,671,478 3,439,809 7%
Tigard OR Portland-Vancouver-Hillsboro, OR-WA Metropolitan
Statistical Area 2,348,247 2,226,009 5%
Medford OR Medford, OR Metropolitan Statistical Area 210,287 203,206 3%
Sacramento CA Sacramento–Roseville–Arden-Arcade, CA
Metropolitan Statistical Area 2,244,397 2,149,127 4%
Rancho Cucamonga
CA Oxnard-Thousand Oaks-Ventura, CA Metropolitan
Statistical Area 846,178 823,318 3%
Phoenix AZ Phoenix-Mesa-Scottsdale, AZ Metropolitan
Statistical Area 4,489,109 4,192,887 7%
Albuquerque NM Albuquerque, NM Metropolitan Statistical Area 904,587 887,077 2%
Dallas TX Dallas-Fort Worth-Arlington, TX Metropolitan
Statistical Area 6,954,330 6,426,214 8%
Cape Girardeau MO Cape Girardeau, MO-IL Metropolitan Statistical
Area 97,929 96,275 2%
Elkhart IN Elkhart-Goshen, IN Metropolitan Statistical Area 201,971 197,559 2%
Nashville TN Nashville-Davidson–Murfreesboro–Franklin, TN
Metropolitan Statistical Area 1,792,649 1,670,890 7%
Jackson MS Jackson, MS Metropolitan Statistical Area 577,564 567,122 2%
Columbus OH Columbus, OH Metropolitan Statistical Area 1,994,536 1,901,974 5%
Lancaster PA Lancaster, PA Metropolitan Statistical Area 533,320 519,445 3%
Selkirk NY Albany-Schenectady-Troy, NY Metropolitan
Statistical Area 880,167 870,716 1%
Augusta ME Bangor, ME Metropolitan Statistical Area 153,414 153,923 −0.33%
Saco ME Portland-South Portland, ME Metropolitan Statistical
Area 523,552 514,098 2%
Hooksett NH Manchester-Nashua, NH Metropolitan Statistical
Area 405,184 400,721 1%
Taunton MA Providence-Warwick, RI-MA Metropolitan Statistical
Area 1,609,367 1,600,852 1%
Newington CT Hartford-West Hartford-East Hartford, CT
Metropolitan Statistical Area 1,214,295 1,212,381 0%
Wolkes-Barre PA Scranton–Wilkes-Barre–Hazleton, PA Metropolitan
Statistical Area 559,679 563,631 −0.70%
Rocky Mount NC Raleigh-Cary, NC Metropolitan Statistical Area 1,242,974 1,130,490 10%
Greenville SC Greenville-Anderson-Mauldin, SC Metropolitan
Statistical Area 862,463 824,112 5%
Jacksonville FL Jacksonville, FL Metropolitan Statistical Area 1,419,127 1,345,596 5%
Davenport FL Lakeland-Winter Haven, FL Metropolitan Statistical
Area 634,638 602,095 5%
Fort Myers FL Cape Coral-Fort Myers, FL Metropolitan Statistical
Area 679,513 618,754 10%
Riviera Beach FL Miami-Fort Lauderdale-West Palm Beach, FL
Metropolitan Statistical Area 5,929,819 5,564,635 7%
Total [Average] 42,980,774 40,702,916 [6%]

Team B
Appendix 13A: Building Permits Issued (Single Family Residences)
City State 2010 2011 2012 2013 2014 2015E
Auburn WA 5,907 6,004 8,087 8,711 8,559 8,740
Tigard OR 3,366 3,147 4,447 5,617 5,337 7,339
Medford OR 290 265 365 554 530 508
Sacramento CA 2,139 1,880 2,863 3,586 3,589 5,001
Rancho Cucamonga CA 204 193 267 349 435 233
Phoenix AZ 7,331 7,494 11,821 12,770 11,742 17,132
Albuquerque NM 1,559 1,354 1,881 1,547 1,693 2,132
Dallas TX 14,472 13,965 17,627 20,821 22,627 29,224
Cape Girardeau MO 68 89 132 129 121 0
Elkhart IN 166 149 218 279 266 257
Nashville TN 3,915 4,033 5,339 7,024 9,030 10,952
Jackson MS 1,349 1,058 1,408 1,535 1,524 1,784
Columbus OH 2,889 2,403 2,918 3,502 3,480 3,373
Lancaster PA 792 500 622 628 619 75
Selkirk NY 727 573 764 871 895 1,116
Augusta ME 121 104 107 127 87 103
Saco ME 1,035 757 1,032 1,237 1,287 1,131
Hooksett NH 356 271 358 435 376 312
Taunton MA 233 256 390 748 31 951
Newington CT 816 659 754 877 910 759
Wolkes-Barre PA 168 113 141 123 115 45
Rocky Mount NC 4,645 4,735 6,390 7,973 7,714 8,657
Greenville SC 1,486 1,636 2,188 2,553 3,466 3,769
Jacksonville FL 3,385 3,216 4,589 6,268 6,309 7,209
Davenport FL 1,145 1,016 1,373 1,978 2,556 2,616
Fort Myers FL 1,115 1,204 1,750 2,523 3,109 4,011
Riviera Beach FL 3,162 4,182 4,948 4,948 5,694 7,271
Auburn WA 5,907 6,004 8,087 8,711 8,559 8,740
Tigard OR 3,366 3,147 4,447 5,617 5,337 7,339
Total 62,841 61,256 82,779 97,713 102,101 124,700
Year over Year Growth in Total -2.5% 35.1% 18.0% 4.5% 22.1%

Team B
Appendix 14A: Percentage of Issued Building Permits that are Single Family Residences
City State 2010 2011 2012 2013 2014 2015E Change
Auburn WA 69.8% 62.6% 56.7% 56.7% 48.8% 32.9% -36.9%
Tigard OR 80.0% 67.5% 67.4% 59.3% 49.2% 58.2% -21.8%
Medford OR 67.0% 77.3% 79.7% 97.9% 80.1% 90.9% 24.0%
Sacramento CA 82.6% 76.7% 86.5% 92.7% 92.0% 81.7% -0.9%
Rancho Cucamonga
CA 45.4% 36.6% 55.2% 45.6% 58.5% 33.4% -12.0%
Phoenix AZ 90.5% 90.4% 82.1% 77.9% 61.4% 69.8% -20.8%
Albuquerque NM 91.1% 86.7% 86.7% 69.5% 81.0% 90.9% -0.2%
Dallas TX 84.0% 67.8% 63.9% 64.5% 59.7% 56.3% -27.8%
Cape Girardeau MO 75.6% 79.5% 66.7% 57.1% 69.1% 0.0% -75.6%
Elkhart IN 70.3% 100.0% 100.0% 99.3% 100.0% 100.0% 29.7%
Nashville TN 84.8% 87.5% 72.3% 72.1% 64.9% 70.6% -14.2%
Jackson MS 99.9% 95.0% 88.9% 97.4% 99.5% 100.0% 0.1%
Columbus OH 66.1% 53.3% 51.2% 48.1% 60.4% 48.7% -17.4%
Lancaster PA 87.8% 80.1% 71.9% 87.2% 97.2% 82.4% -5.5%
Selkirk NY 88.3% 62.0% 61.7% 69.5% 69.5% 30.5% -57.8%
Augusta ME 70.3% 89.7% 69.9% 90.1% 86.1% 24.3% -46.1%
Saco ME 98.0% 88.7% 87.2% 85.3% 84.8% 67.9% -30.1%
Hooksett NH 59.2% 46.6% 81.7% 91.6% 67.1% 64.6% 5.4%
Taunton MA 68.5% 90.5% 92.2% 97.7% 63.3% 97.5% 29.0%
Newington CT 80.2% 80.8% 72.6% 77.3% 69.0% 52.4% -27.8%
Wolkes-Barre PA 94.9% 98.3% 97.2% 90.4% 96.6% 45.9% -49.0%
Rocky Mount NC 91.4% 75.4% 53.5% 70.6% 73.0% 69.0% -22.4%
Greenville SC 93.8% 93.6% 92.6% 92.0% 76.1% 58.4% -35.3%
Jacksonville FL 94.9% 84.0% 81.0% 86.9% 82.1% 74.2% -20.8%
Davenport FL 88.1% 100.0% 98.6% 98.1% 99.5% 96.7% 8.5%
Fort Myers FL 89.8% 78.7% 91.8% 83.8% 79.2% 53.8% -36.0%
Riviera Beach FL 67.7% 62.7% 46.4% 46.4% 39.8% 35.3% -32.4%
Auburn WA 69.8% 62.6% 56.7% 56.7% 48.8% 32.9% -36.9%
Tigard OR 80.0% 67.5% 67.4% 59.3% 49.2% 58.2% -21.8%

Team B
Appendix 15A: Leading Indicator of Remodeling Activity
USD in Billions Fourth Quarter Moving Total Fourth-Quarter Moving Rate
2013:Q1 $129.3 7.2%
2013:Q2 $130.8 8.0%
2013:Q3 $132.7 8.9%
2013:Q4 $133.1 5.6%
2014:Q1 $132.1 2.2%
2014:Q2 (e) $138.7 6.1%
2014:Q3 (e) $146.0 10.0%
2014:Q4 (e) $143.4 7.7%
2015:Q1 (e) $140.7 6.5%
2015:Q2 (e) $144.7 4.3%
2015:Q3 (e) $149.4 2.4%
2015:Q4 (p) $148.3 3.4%
2016:Q1 (p) $146.9 4.4%
2016:Q2 (p) $154.5 6.8%
The Leading Indicator of Remodeling Activity is developed by the Harvard Joint Center for Housing Studies
(e) denotes expected values where (p) denotes projected values

Team B
Appendix 16A: S&P/ Case Schiller Home Price Index
Date Value Date Value
Jan-2011 139.05 Jun-2013 156.5
Feb-2011 137.74 Jul-2013 158.4
Mar-2011 137.79 Aug-2013 159.5
Apr-2011 139.15 Sep-2013 159.8
May-2011 140.68 Oct-2013 159.7
Jun-2011 141.93 Nov-2013 159.5
Jul-2011 142.33 Dec-2013 159.4
Aug-2011 141.77 Jan-2014 159.5
Sep-2011 140.15 Feb-2014 160.0
Oct-2011 138.39 Mar-2014 161.3
Nov-2011 136.65 Apr-2014 163.1
Dec-2011 135.16 May-2014 164.8
Jan-2012 134.17 Jun-2014 166.3
Feb-2012 134.02 Jul-2014 167.2
Mar-2012 135.9 Aug-2014 167.6
Apr-2012 138.51 Sep-2014 167.4
May-2012 141.09 Oct-2014 167.0
Jun-2012 143.21 Nov-2014 166.8
Jul-2012 144.31 Dec-2014 166.6
Aug-2012 144.74 Jan-2015 166.4
Sep-2012 144.39 Feb-2015 166.8
Oct-2012 144.01 Mar-2015 168.3
Nov-2012 144.01 Apr-2015 170.2
Dec-2012 143.92 May-2015 172.1
Jan-2013 144.36 Jun-2015 173.7
Feb-2013 145.2 Jul-2015 174.7
Mar-2013 148.01 Aug-2015 175.3
Apr-2013 151.03 Sep-2015 175.5
May-2013 153.93 Oct-2015 175.7
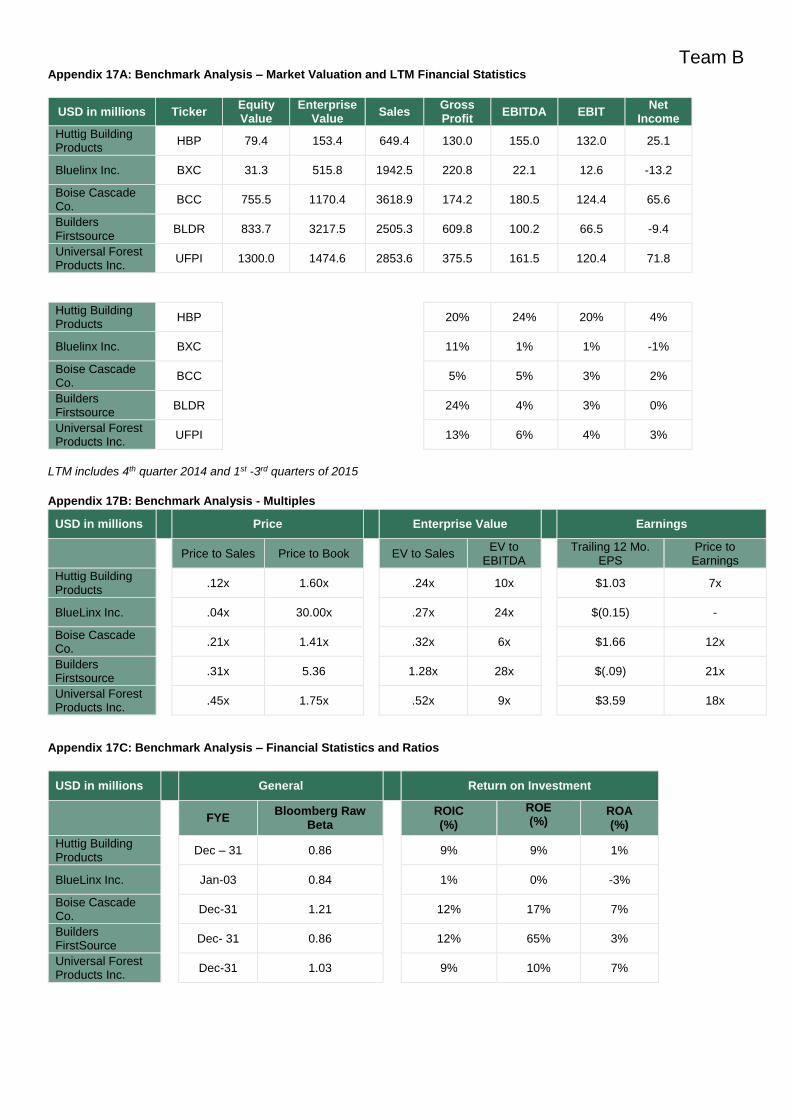
Team B
Appendix 17A: Benchmark Analysis – Market Valuation and LTM Financial Statistics
USD in millions Ticker Equity Value
Enterprise Value
Sales Gross Profit
EBITDA EBIT Net
Income
Huttig Building Products
HBP 79.4 153.4 649.4 130.0 155.0 132.0 25.1
Bluelinx Inc. BXC 31.3 515.8 1942.5 220.8 22.1 12.6 -13.2
Boise Cascade Co.
BCC 755.5 1170.4 3618.9 174.2 180.5 124.4 65.6
Builders Firstsource
BLDR 833.7 3217.5 2505.3 609.8 100.2 66.5 -9.4
Universal Forest Products Inc.
UFPI 1300.0 1474.6 2853.6 375.5 161.5 120.4 71.8
Huttig Building Products
HBP
20% 24% 20% 4%
Bluelinx Inc. BXC 11% 1% 1% -1%
Boise Cascade Co.
BCC 5% 5% 3% 2%
Builders Firstsource
BLDR 24% 4% 3% 0%
Universal Forest Products Inc.
UFPI 13% 6% 4% 3%
LTM includes 4th quarter 2014 and 1st -3rd quarters of 2015
Appendix 17B: Benchmark Analysis - Multiples
USD in millions Price Enterprise Value Earnings
Price to Sales Price to Book EV to Sales EV to
EBITDA
Trailing 12 Mo. EPS
Price to Earnings
Huttig Building Products
.12x 1.60x .24x 10x $1.03 7x
BlueLinx Inc. .04x 30.00x .27x 24x $(0.15) -
Boise Cascade Co.
.21x 1.41x .32x 6x $1.66 12x
Builders Firstsource
.31x 5.36 1.28x 28x $(.09) 21x
Universal Forest Products Inc.
.45x 1.75x .52x 9x $3.59 18x
Appendix 17C: Benchmark Analysis – Financial Statistics and Ratios
USD in millions General Return on Investment
FYE Bloomberg Raw
Beta
ROIC (%)
ROE (%)
ROA (%)
Huttig Building Products
Dec – 31 0.86 9% 9% 1%
BlueLinx Inc. Jan-03 0.84 1% 0% -3%
Boise Cascade Co.
Dec-31 1.21 12% 17% 7%
Builders FirstSource
Dec- 31 0.86 12% 65% 3%
Universal Forest Products Inc.
Dec-31 1.03 9% 10% 7%

Team B
Appendix 17C: Benchmark Analysis – Financial Statistics and Ratios (cont)
USD in millions LTM Leverage Ratios
LTM Coverage Ratios
Debt/ Tot.
Cap. Debt/
EBITDA Net Debt/ EBITDA
EBITDA / Int. Exp.
EBITDA-Cpx/ Int EBIT/ Int. Exp.
Huttig Building Products
57% 4.4x 4.2x
0.0x 0.0x 55.8x
BlueLinx Inc. 108% 21.2x 20.9x
1.5x 1.5x 1.2x
Boise Cascade Co.
40% 2.0x 0.8x
9.6x 5.2x 7.1x
Builders FirstSource
93% 20.2x 19.2x
0.0x 0.0x 0.0x
Universal Forest Products Inc.
10% 0.2x 0.2x
50.0x 41.7x 40.1x

Team B
Appendix 18A: New Private Housing Starts, Historical and Projected
Housing starts in ‘000s
Source: St. Louis Fed.
0
200
400
600
800
1,000
1,200
1,400
1,600
1,800
2,000
2006 2007 2008 2009 2010 2011 2012 2013 2014 2015 2016 2017 2018 2019 2020
Historical Projected

Team B
Appendix 19A: Executive Officers
Officer Title Ownership Experience Summary
Jon P. Vrabely President and CEO
4.49%
Jon Vrabely joined Huttig in 1999 as a general manager of the Auburn distribution center. In November of 2005, Vrabely was appointed as Chief Operating Officer of Huttig. Vrabley served as COO through January of 2009, and was subsequently elected as CEO. Before joining Huttig, he worked as a manager for WESCO, a firm specializing in the distribution of electrical equipment. Vrabely has also been a Director for Huttig since 2007. He earned his MBA from the University of Redlands.
Gregory W. Gurley
Vice President - Product Management and National Accounts
1.14%
Gregory Gurley was appointed as VP of Product Management and National Accounts in January of 2007. Gurley has over 20 years of experience in the millwork industry, including service as Vice President of Residential Business Development for Therma-Tru Doors (currently a Huttig supplier), and Head of Sales and Marketing for Benchmark Doors.
Brian D. Robinson
Vice President – Chief Operating Officer
1.84%
Brian D. Robinson was appointed CIO in July of 2006. Robinson previously served as CIO for RMC USA, Inc, directing infrastructure of a heavy building materials. From September of 2005 to July of 2006, Robinson was the Owner and Operator of BDR Holdings, Inc., a residential and commercial painting business. Robinson also served as Vice President of Information Technology for The Rose Group Corporation.
Appendix 19B: Board of Directors
Board Member Ownership Experience
Delbert H. Tanner .5%
Delbert Tanner was appointed as Huttig’s Chairman of the Board in April of 2015, following the resignation of R.S. Evans. Tanner has extensive leadership experience, including service as CEO of RMC, USA Inc., CEO of Anderson Group Inc., and CEO of Channel Partners Inc. He also serves as a Director of Monroc Inc. Tanner has an MBA from Arizona State University.
Donald L. Glass .5%
Donald Glass has served as a Director of Huttig since September of 2004. Previously, Glass spent almost 30 years at in sales and executive leadership at Georgia-Pacific Corp. He also served as President and CEO of The Timber Company. Glass graduated from West Virginia University with a B.S. in Business Management.
James Hibberd .05%
James Hibberd has been a Director of Huttig since June of 2015. Hibberd also serves as Senior Vice President and General Manager of Gexpro at Rexel Holdings USA Corp. Hibberds’s experience is primarily in distribution and sales leadership. Hibbered holds a B.S. in Finance from San Jose State University.
Patrick Larmon .05%
Patrick Larmon has been a Director of Huttig since June of 2015. He also serves as President and CEO of North American operations of Bunzl plc. He earned MBA from Loyola University of Chicago and is a Certified Public Accountant.
J Keith Matheney .34% J. Keith Matheney has been a Director since 2004. Matheney was previously Executive Vice President of Louisiana Pacific Corporation.
Gina G. Hoagland No information Gina Hoagland joined Huttig’s Board of Directors in January of 2016. Hoagland is co-owner, CEO, and President of Collaborative Strategies.
Jon P. Vrabely 4.49% See Appendix 19A.

Team B
Appendix 21A: Distribution Centers
Distribution Center
Parcel Number Lot Size (acres)
Land Value Improvement Value
Total Assessed Value
Listed Owner
Auburn, WA 1321049080 5.8 2,036,800 7,355,200 9,392,000 Huttig
Tigard, OR 2S101CB00100 7.6 1,856,250 3,060,050 4,350,610 Huttig
Medford, OR 170526-1 0.5 432,700 232,940 665,640 Huttig
Sacramento, CA
6100100470000 11.7 1,300,474 3,391,433 4,691,907 Aitchison 3 LLC
Southern, CA 020914305P001 N/A N/A 310,339 1,103,933 Huttig
Phoenix, AZ 10802065 13.9 573,342 3,093,558 3,666,900 Huttig
Albuquerque, NM
101706412118830000 2.3 1,285,300 3,034,400 4,319,700 G E WPW LLC
Dallas, TX 99902140000018400 N/A N/A N/A 5,151,010 Huttig
Jackson, MS 902102 1.9 179,343 1,455,429 1,634,772 Huttig
Cape Girardeau, MO
209012600009000000 10.3 103,000 1,347,000 1,450,000 Huttig
Fort Myers, FL 304425P20040C0010 6.2 N/A N/A 1,223,559 Myersburg Associates
Riviera Beach 434230140040000 N/A N/A N/A 12,462,309 Reef Am. REIT II Corp.
Central Florida 262601999965000000 10.3 709,244 11,310,270 12,019,514 AP Highway 27 LLC
Jacksonville, FL
488850020 6.9 254,170 743,430 997,600 Dornoch Associates
Greenville, SC WG60610102406 7.6 N/A N/A 920,500 Huttig
Risky Mount, NC
386210367374 12.7 317,000 1,874,770 2,191,770 Huttig
Columbus, OH 15200050600 16.5 316,680 1,705,100 2,021,780 Par Prop. of Ohio
Elkhart, IN 200503226002000000 5.0 118,500 355,800 474,300 Huttig
Lancaster, PA 3003911500000 2.7 639,000 2,810,600 3,449,600 Kinsley Equities
Wilkes-Barre, PA
25J9S100114A000 7.5 144,100 1,159,800 1,303,900 Huttig
Selkirk, NY 120581 1.0 256,000 1,364,000 1,620,000 Huttig
Newington, CT 11533 14.3 1,775,780 6,721,320 8,497,100 Newington Business Park LLC
Taunton, MA 83805010 2.4 771,200 3,334,100 4,105,300 Huttig
Saco, ME 73025000000 2.0 296,700 4,351,100 4,647,800 OLP Main LLC
Hooksett, NH N/A 3.6 1,121,300 5,161,200 6,282,500 BGH Hooksett
Augusta, ME N/A 1.1 211,400 1,165,900 1,377,300 Huttig
Total 153.8 100,021,304

Team B
Appendix 22A: Lumber Futures Prices
Source: Bloomberg
0
20
40
60
80
100
120
140
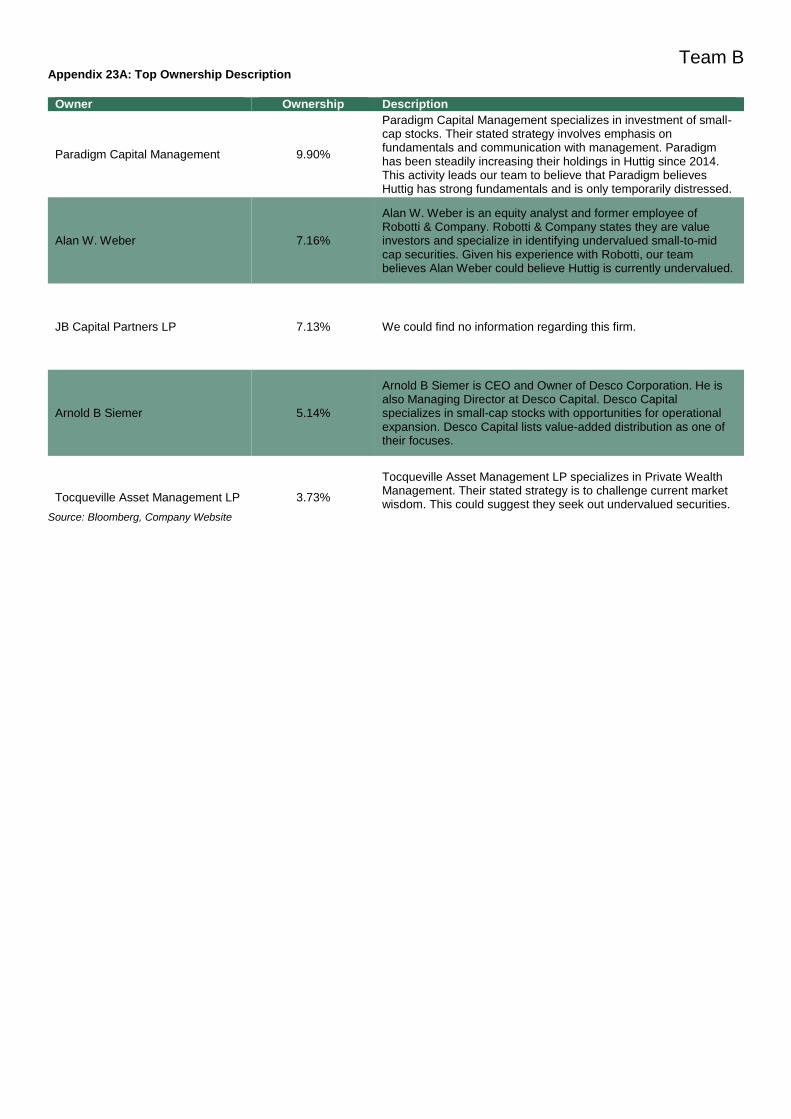
Team B
Appendix 23A: Top Ownership Description
Owner Ownership Description
Paradigm Capital Management 9.90%
Paradigm Capital Management specializes in investment of small-cap stocks. Their stated strategy involves emphasis on fundamentals and communication with management. Paradigm has been steadily increasing their holdings in Huttig since 2014. This activity leads our team to believe that Paradigm believes Huttig has strong fundamentals and is only temporarily distressed.
Alan W. Weber 7.16%
Alan W. Weber is an equity analyst and former employee of Robotti & Company. Robotti & Company states they are value investors and specialize in identifying undervalued small-to-mid cap securities. Given his experience with Robotti, our team believes Alan Weber could believe Huttig is currently undervalued.
JB Capital Partners LP 7.13% We could find no information regarding this firm.
Arnold B Siemer 5.14%
Arnold B Siemer is CEO and Owner of Desco Corporation. He is also Managing Director at Desco Capital. Desco Capital specializes in small-cap stocks with opportunities for operational expansion. Desco Capital lists value-added distribution as one of their focuses.
Tocqueville Asset Management LP
3.73%
Tocqueville Asset Management LP specializes in Private Wealth Management. Their stated strategy is to challenge current market wisdom. This could suggest they seek out undervalued securities.
Source: Bloomberg, Company Website