cfa institute research challenge - ucema · cfa institute research challenge ... (kfc; pizza hut...
TRANSCRIPT
Arcos Dorados Holdings Inc.
CFA Research Challenge - UCEMA
CFA Institute Research Challenge
Hosted by
CFA Society of Argentina and Uruguay Universidad del CEMA

Arcos Dorados Holdings Inc.
CFA Research Challenge - UCEMA
Page 1
“Lovin´ it again requires both better macro and execution”
We are initiating ARCO with a HOLD recommendation and a Price
Target of USD 12.00. The company is the master franchisee of
McDonald’s in Latin America since 2007 and the leader in the quick service restaurant (“QSR”) industry in the region with a 9.9% market
share. It is the world’s largest McDonald franchisee in terms of
systemwide sales and number of restaurants. Given the low penetration of the QSR industry in Latin and Central America, about 1/3 of the
USA, ARCO has significant growth potential with room to double its
store base over the long term. On the other hand, its attractive growth profile is currently being offset by negative macro conditions in the
region, such as inflation, currency devaluation, capital controls, labor
regulation, and lower economic growth, which are beyond the
company’s control and put pressure on margins and cash flows. Furthermore, upon analyzing sales trends on new restaurant openings,
we see evidence that sales of new restaurant openings in key markets
such as Brazil are running below the system average indicating that ROIC at the restaurant level has been decreasing. Competitive pressures
have been rising as well. These require that the company starts executing
a better balance between rapid growth and restaurant productivity, a factor within the company’s control.
ARCO’s stock price reached a high of $28.50 on September 2011, when
the macro environment was very favorable for US dollar investors as
most local currencies were appreciating and Brazil was experiencing stronger economic growth. Since then, the stock price has lost
approximately 58% of its value reflecting macro headwinds which
impacted its sales growth and compressed its operating margins. Y/Y sales growth decreased from 21.2% in 2011 to just 3.8% in 2012, even
though the company opened more than 100 restaurants during that
period. EBITDA1 margins have been decreasing 140bps since 2010 to
8.5% as of June 2013 (LTM). Margin pressure is also due to the fact that a significant part of its cost structure is dollar-linked; therefore,
currency volatility has a high impact on margins. As of June 2013,
Revenues and EBITDA for the LTM were $3,938mm and $333.6mm respectively. High levels of inflation and capital controls have been
particularly negative in Venezuela and Argentina which account for
approximately 25% of revenue and 30% of EBITDA combined. Currency devaluation in Argentina is significantly mitigated as the
country is the cost center of the whole company; therefore, it has a net
short currency exposure as corporate expenses are higher than the
Argentinean EBITDA.
1 Throughout the report EBITDA equals Adj. EBITDA as defined and calculated by the company.
STOCK PRICE PERFORMANCE
Source: S&P Capital IQ
Sales Growth Adj. EBITDA Margin EPS
2009 0.9% 10.0% 0.33
2010 13.2% 9.9% 0.44
2011 21.2% 9.3% 0.54
2012 3.8% 9.0% 0.55
Source: Company Reports
Company Data
Price (USD) 12.11
Date of price 22-Oct-13
52 week range (USD) 15.52 - 10.45
Average Daily Volume (3m) 1,054,150
Market Cap (USD mm) 2,540.1
Fiscal Year End Dec
Shares Diluted (USD mm) 209.5
Current PE 32.12
Float 60%Source: S&P Capital IQ
Arcos Dorados Holdings, Inc. Recommendation
NYSE: ARCO HOLD
LA&C - Food - QSR Target Price
12.00

Arcos Dorados Holdings Inc.
CFA Research Challenge - UCEMA
Page 2
As of June 2013, total restaurants were 1971, an increase of 24% since 2007. We still see considerable scope for the company to grow and
diversify its store base around its current footprint which is mostly
concentrated in urban areas. Rapid population growth and the emergence of a middle class throughout the region point to significant opportunities
for the company’s products and services. But growth needs to be
profitable to add shareholder value; therefore, it needs to be balanced with better execution at the restaurant level, especially under current
macro conditions. Due to the company’s pricing power, it has managed
to increase ticket prices along with inflation but we would like to see
more traffic improvement reflected in same store sales (“SSS”). See Exhibit 1for an explanation of SSS calculation.
If macro conditions start to stabilize, better execution at the restaurant
level should improve EBITDA margins and ROIC, which might be the catalysts for a multiple expansion, resulting in significant upside to the
current stock price. Evidence of these happening would make us
consider a rerating of our current HOLD recommendation and price target.
BUSINESS DESCRIPTION
Arcos Dorados Holdings Inc. (NYSE:ARCO) is the master franchisee of
McDonald’s (NYSE:MCD) in Latin America since August 2007. It is
the world’s largest McDonald’s franchisee in terms of systemwide sales and number of restaurants, operating in 20 countries of Latin America
and the Caribbean (LA&C). It has the exclusive right to own, operate
and sub-franchise McDonald’s restaurants in the region. ARCO
represented 5.6% of McDonald’s global sales and 7% of McDonald’s total franchised restaurants as of December 2012.
The company operates McDonald’s-branded restaurants under two
different operating formats: company-owned restaurants (~75%) and franchised restaurants (~25%). As of June 2013, Arcos Dorados had
1,971 McDonald’s-branded restaurants, 2,057 Dessert Centers, and 340
McCafé2 with over 94,000 employees serving approximately 4.3 million
customers a day. The company enjoys a significant real estate portfolio throughout the region with key strategic locations.
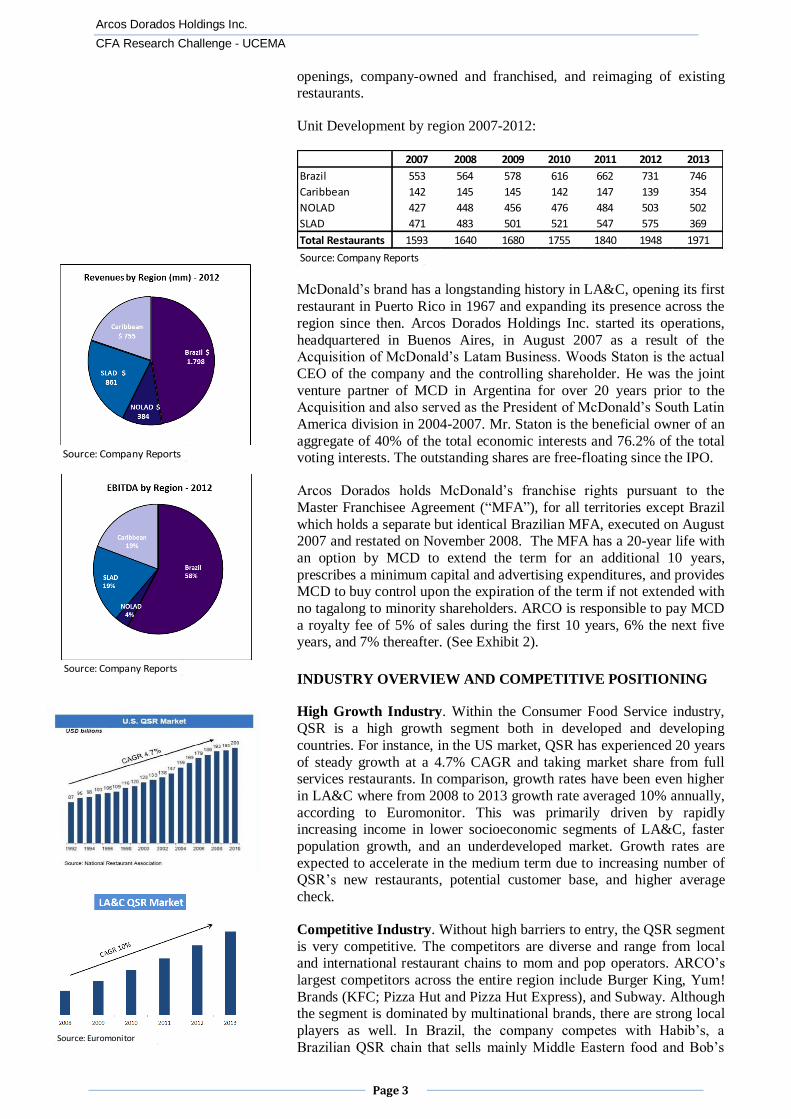
Iconic Brand, Key Locations, Diversified Market. The company’s
operations are classified into four geographical regions as of June 2013:
1. Brazil, which is the largest division.
2. The Caribbean: Aruba, Colombia, Curaçao, French Guyana,
Guadeloupe, Martinique, Puerto Rico, Trinidad and Tobago, St. Croix, St. Thomas and Venezuela.
3. NOLAD (North Latin America Division): Mexico, Costa Rica
and Panama.
4. SLAD (South Latin America Division): Argentina, Chile, Ecuador, Peru and Uruguay.
As of today, 38% of the restaurants are located in Brazil, 19% in SLAD,
25% in NOLAD and 18% in the Caribbean region. The Company top-line growth comes from an increase in same stores sales, new restaurants
2 McCafe locations are areas within restaurants where customers can purchase various customized beverages, including lattes, cappuccinos and others. At Dessert Centers customers can buy dessert items such as Mc Flurry and soft-serve ice cream.
Source: Company Reports
Arcos Dorados Holdings Inc.
CFA Research Challenge - UCEMA
Page 3
openings, company-owned and franchised, and reimaging of existing restaurants.
Unit Development by region 2007-2012:
McDonald’s brand has a longstanding history in LA&C, opening its first
restaurant in Puerto Rico in 1967 and expanding its presence across the
region since then. Arcos Dorados Holdings Inc. started its operations,
headquartered in Buenos Aires, in August 2007 as a result of the Acquisition of McDonald’s Latam Business. Woods Staton is the actual
CEO of the company and the controlling shareholder. He was the joint
venture partner of MCD in Argentina for over 20 years prior to the Acquisition and also served as the President of McDonald’s South Latin
America division in 2004-2007. Mr. Staton is the beneficial owner of an
aggregate of 40% of the total economic interests and 76.2% of the total voting interests. The outstanding shares are free-floating since the IPO.
Arcos Dorados holds McDonald’s franchise rights pursuant to the
Master Franchisee Agreement (“MFA”), for all territories except Brazil
which holds a separate but identical Brazilian MFA, executed on August 2007 and restated on November 2008. The MFA has a 20-year life with
an option by MCD to extend the term for an additional 10 years,
prescribes a minimum capital and advertising expenditures, and provides MCD to buy control upon the expiration of the term if not extended with
no tagalong to minority shareholders. ARCO is responsible to pay MCD
a royalty fee of 5% of sales during the first 10 years, 6% the next five years, and 7% thereafter. (See Exhibit 2).
INDUSTRY OVERVIEW AND COMPETITIVE POSITIONING
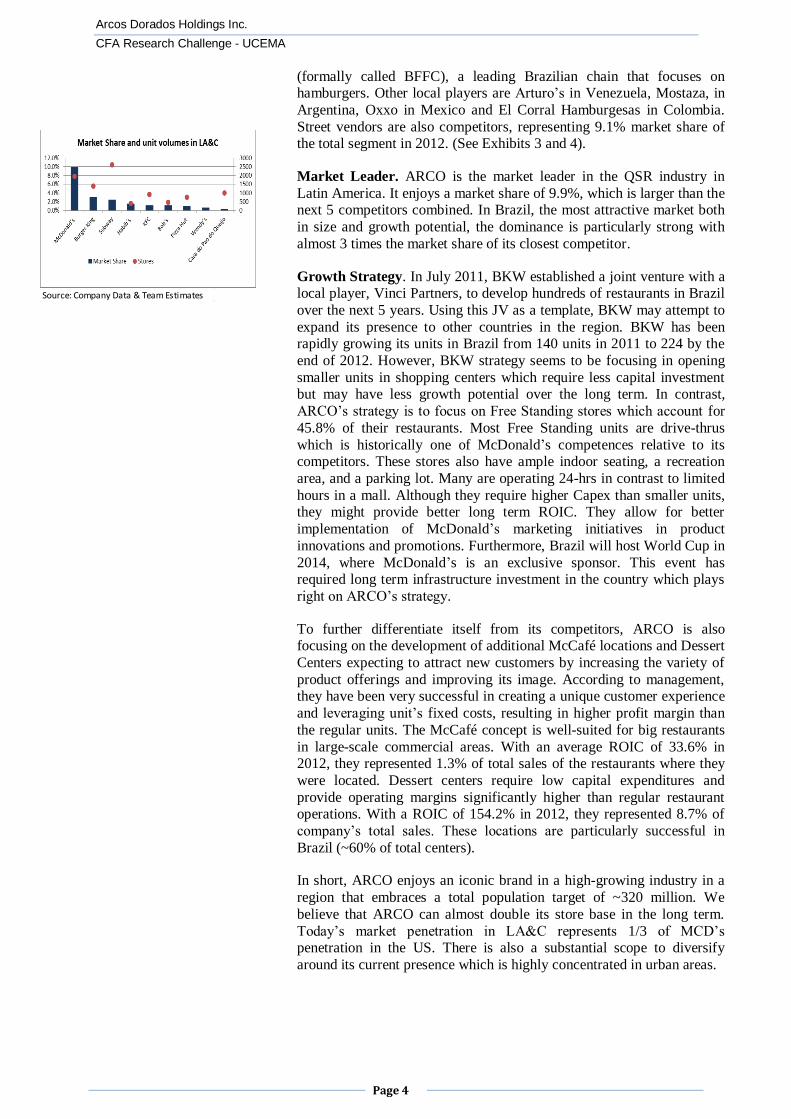
High Growth Industry. Within the Consumer Food Service industry,
QSR is a high growth segment both in developed and developing
countries. For instance, in the US market, QSR has experienced 20 years
of steady growth at a 4.7% CAGR and taking market share from full services restaurants. In comparison, growth rates have been even higher
in LA&C where from 2008 to 2013 growth rate averaged 10% annually,
according to Euromonitor. This was primarily driven by rapidly increasing income in lower socioeconomic segments of LA&C, faster
population growth, and an underdeveloped market. Growth rates are
expected to accelerate in the medium term due to increasing number of QSR’s new restaurants, potential customer base, and higher average
check.
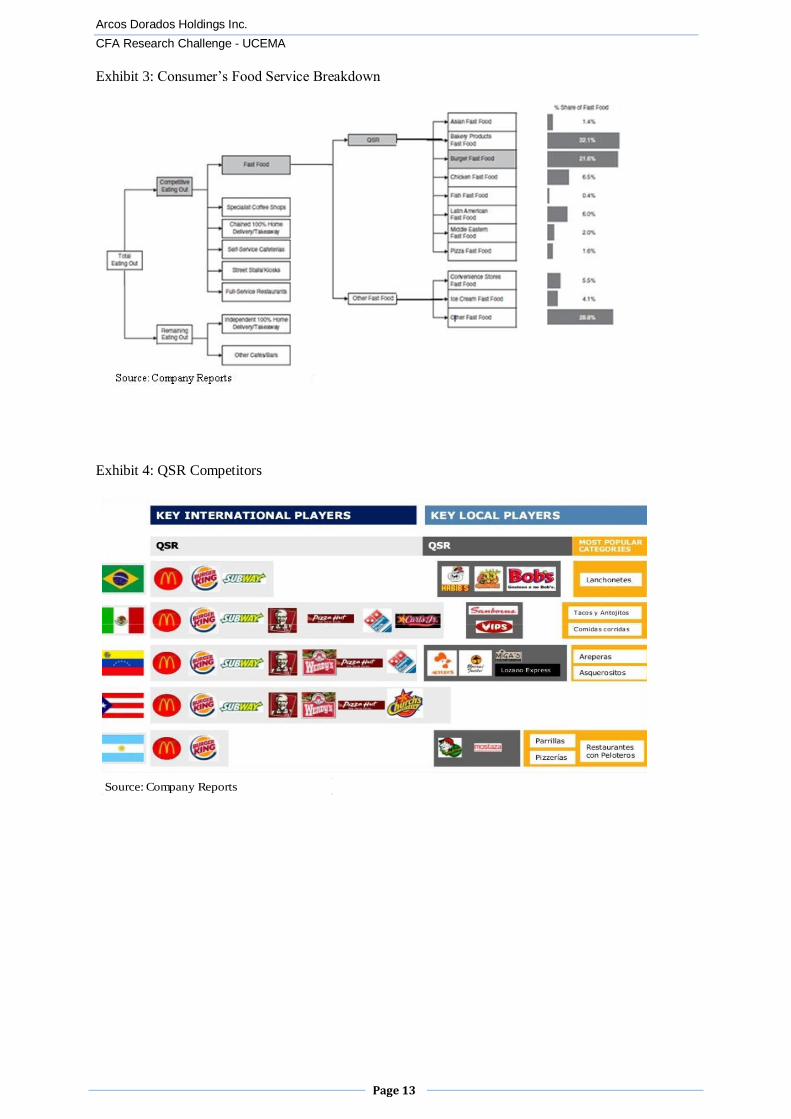
Competitive Industry. Without high barriers to entry, the QSR segment
is very competitive. The competitors are diverse and range from local and international restaurant chains to mom and pop operators. ARCO’s
largest competitors across the entire region include Burger King, Yum!
Brands (KFC; Pizza Hut and Pizza Hut Express), and Subway. Although the segment is dominated by multinational brands, there are strong local
players as well. In Brazil, the company competes with Habib’s, a
Brazilian QSR chain that sells mainly Middle Eastern food and Bob’s
2007 2008 2009 2010 2011 2012 2013
Brazil 553 564 578 616 662 731 746
Caribbean 142 145 145 142 147 139 354
NOLAD 427 448 456 476 484 503 502
SLAD 471 483 501 521 547 575 369
Total Restaurants 1593 1640 1680 1755 1840 1948 1971
Source: Company Reports
Source: Euromonitor
Source: Company Reports
Source: Company Reports
Arcos Dorados Holdings Inc.
CFA Research Challenge - UCEMA
Page 4
(formally called BFFC), a leading Brazilian chain that focuses on hamburgers. Other local players are Arturo’s in Venezuela, Mostaza, in
Argentina, Oxxo in Mexico and El Corral Hamburgesas in Colombia.
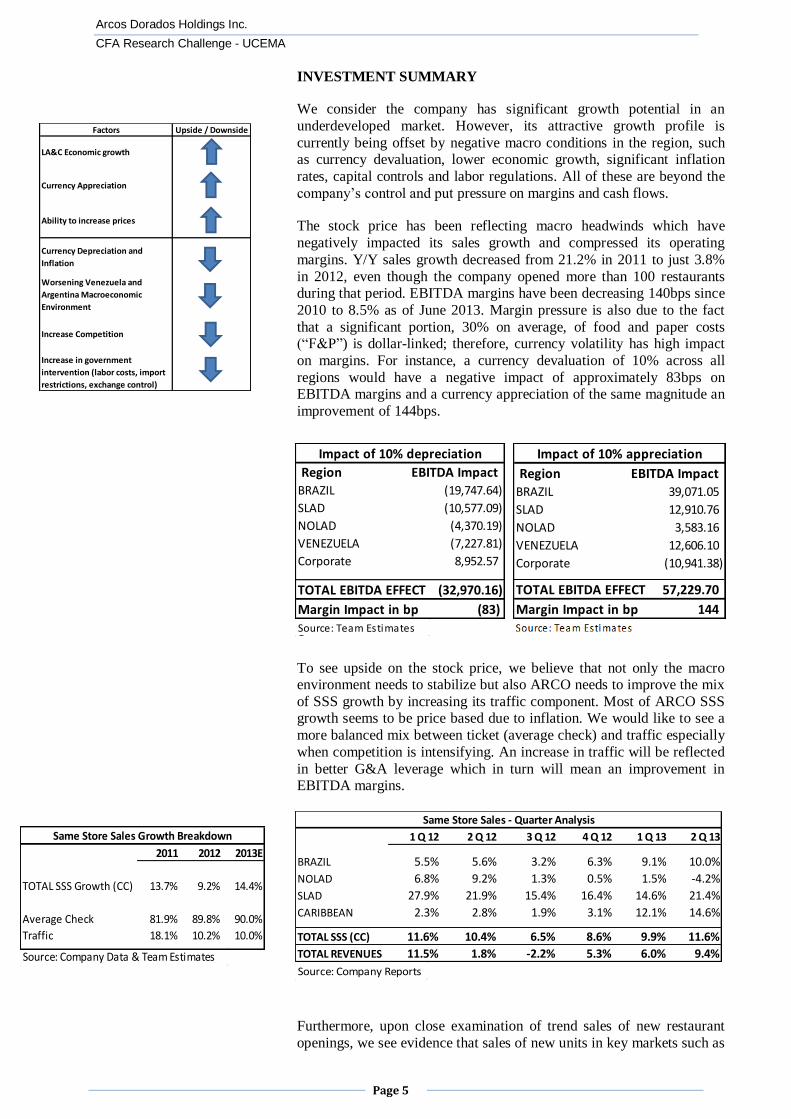
Street vendors are also competitors, representing 9.1% market share of the total segment in 2012. (See Exhibits 3 and 4).
Market Leader. ARCO is the market leader in the QSR industry in
Latin America. It enjoys a market share of 9.9%, which is larger than the next 5 competitors combined. In Brazil, the most attractive market both
in size and growth potential, the dominance is particularly strong with
almost 3 times the market share of its closest competitor.
Growth Strategy. In July 2011, BKW established a joint venture with a local player, Vinci Partners, to develop hundreds of restaurants in Brazil
over the next 5 years. Using this JV as a template, BKW may attempt to
expand its presence to other countries in the region. BKW has been rapidly growing its units in Brazil from 140 units in 2011 to 224 by the
end of 2012. However, BKW strategy seems to be focusing in opening
smaller units in shopping centers which require less capital investment but may have less growth potential over the long term. In contrast,
ARCO’s strategy is to focus on Free Standing stores which account for
45.8% of their restaurants. Most Free Standing units are drive-thrus
which is historically one of McDonald’s competences relative to its competitors. These stores also have ample indoor seating, a recreation
area, and a parking lot. Many are operating 24-hrs in contrast to limited
hours in a mall. Although they require higher Capex than smaller units, they might provide better long term ROIC. They allow for better
implementation of McDonald’s marketing initiatives in product
innovations and promotions. Furthermore, Brazil will host World Cup in
2014, where McDonald’s is an exclusive sponsor. This event has required long term infrastructure investment in the country which plays
right on ARCO’s strategy.
To further differentiate itself from its competitors, ARCO is also focusing on the development of additional McCafé locations and Dessert
Centers expecting to attract new customers by increasing the variety of
product offerings and improving its image. According to management, they have been very successful in creating a unique customer experience
and leveraging unit’s fixed costs, resulting in higher profit margin than
the regular units. The McCafé concept is well-suited for big restaurants
in large-scale commercial areas. With an average ROIC of 33.6% in 2012, they represented 1.3% of total sales of the restaurants where they
were located. Dessert centers require low capital expenditures and
provide operating margins significantly higher than regular restaurant operations. With a ROIC of 154.2% in 2012, they represented 8.7% of
company’s total sales. These locations are particularly successful in
Brazil (~60% of total centers).
In short, ARCO enjoys an iconic brand in a high-growing industry in a
region that embraces a total population target of ~320 million. We
believe that ARCO can almost double its store base in the long term.
Today’s market penetration in LA&C represents 1/3 of MCD’s penetration in the US. There is also a substantial scope to diversify
around its current presence which is highly concentrated in urban areas.
Source: Company Data & Team Estimates
Arcos Dorados Holdings Inc.
CFA Research Challenge - UCEMA
Page 5
INVESTMENT SUMMARY
We consider the company has significant growth potential in an
underdeveloped market. However, its attractive growth profile is
currently being offset by negative macro conditions in the region, such as currency devaluation, lower economic growth, significant inflation
rates, capital controls and labor regulations. All of these are beyond the
company’s control and put pressure on margins and cash flows.
The stock price has been reflecting macro headwinds which have
negatively impacted its sales growth and compressed its operating
margins. Y/Y sales growth decreased from 21.2% in 2011 to just 3.8%
in 2012, even though the company opened more than 100 restaurants during that period. EBITDA margins have been decreasing 140bps since
2010 to 8.5% as of June 2013. Margin pressure is also due to the fact
that a significant portion, 30% on average, of food and paper costs (“F&P”) is dollar-linked; therefore, currency volatility has high impact
on margins. For instance, a currency devaluation of 10% across all
regions would have a negative impact of approximately 83bps on EBITDA margins and a currency appreciation of the same magnitude an
improvement of 144bps.
T
To see upside on the stock price, we believe that not only the macro environment needs to stabilize but also ARCO needs to improve the mix
of SSS growth by increasing its traffic component. Most of ARCO SSS growth seems to be price based due to inflation. We would like to see a
more balanced mix between ticket (average check) and traffic especially
when competition is intensifying. An increase in traffic will be reflected
in better G&A leverage which in turn will mean an improvement in EBITDA margins.
Furthermore, upon close examination of trend sales of new restaurant
openings, we see evidence that sales of new units in key markets such as
BRAZIL (19,747.64)
SLAD (10,577.09)
NOLAD (4,370.19)
VENEZUELA (7,227.81)
Corporate 8,952.57
TOTAL EBITDA EFFECT (32,970.16)
Impact of 10% depreciation
Margin Impact in bp (83)
Region EBITDA Impact
BRAZIL 39,071.05
SLAD 12,910.76
NOLAD 3,583.16
VENEZUELA 12,606.10
Corporate (10,941.38)
TOTAL EBITDA EFFECT 57,229.70
Margin Impact in bp 144
Impact of 10% appreciation
Region EBITDA Impact
Source: Team Estimates
Factors Upside / Downside
LA&C Economic growth
Currency Appreciation
Ability to increase prices
Currency Depreciation and
Inflation
Worsening Venezuela and
Argentina Macroeconomic
Environment
Increase Competition
Increase in government
intervention (labor costs, import
restrictions, exchange control)
Source: Company Reports
1 Q 12 2 Q 12 3 Q 12 4 Q 12 1 Q 13 2 Q 13
BRAZIL 5.5% 5.6% 3.2% 6.3% 9.1% 10.0%
NOLAD 6.8% 9.2% 1.3% 0.5% 1.5% -4.2%
SLAD 27.9% 21.9% 15.4% 16.4% 14.6% 21.4%
CARIBBEAN 2.3% 2.8% 1.9% 3.1% 12.1% 14.6%
TOTAL SSS (CC) 11.6% 10.4% 6.5% 8.6% 9.9% 11.6%
TOTAL REVENUES 11.5% 1.8% -2.2% 5.3% 6.0% 9.4%
Same Store Sales - Quarter Analysis
Source: Company Data & Team Estimates
2011 2012 2013E
TOTAL SSS Growth (CC) 13.7% 9.2% 14.4%
Average Check 81.9% 89.8% 90.0%
Traffic 18.1% 10.2% 10.0%
Same Store Sales Growth Breakdown
Arcos Dorados Holdings Inc.
CFA Research Challenge - UCEMA
Page 6
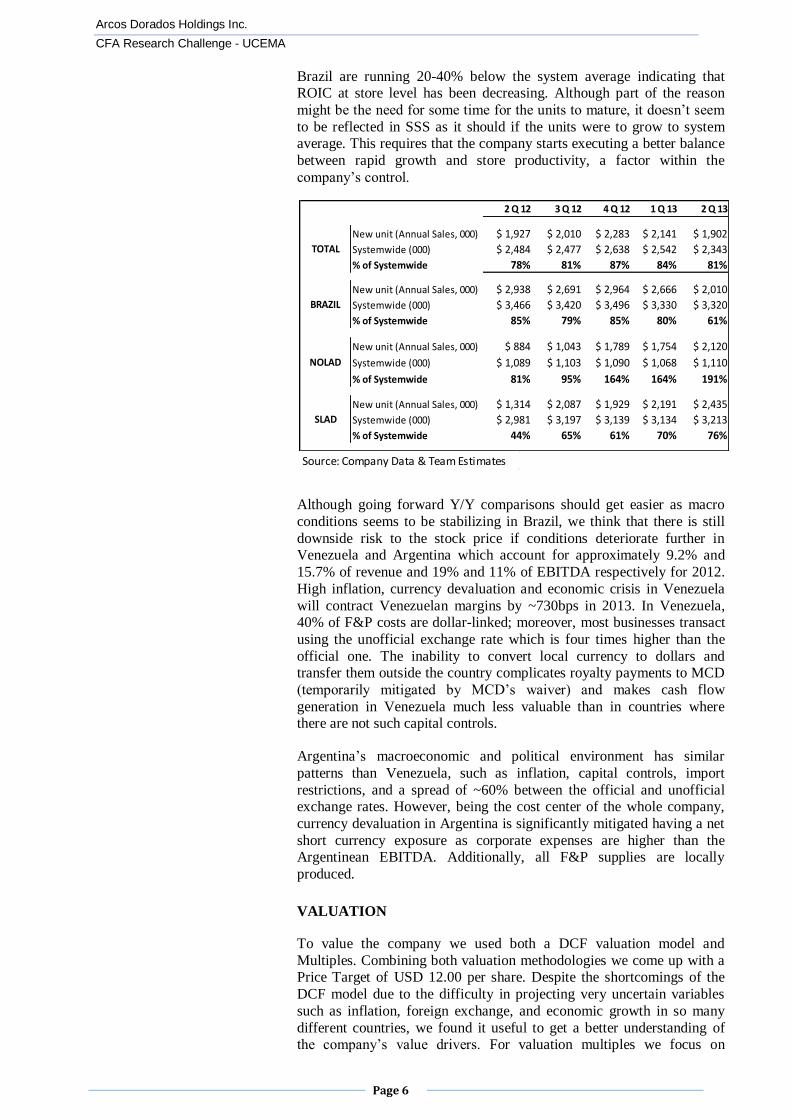
Brazil are running 20-40% below the system average indicating that ROIC at store level has been decreasing. Although part of the reason
might be the need for some time for the units to mature, it doesn’t seem
to be reflected in SSS as it should if the units were to grow to system average. This requires that the company starts executing a better balance
between rapid growth and store productivity, a factor within the
company’s control.
Although going forward Y/Y comparisons should get easier as macro
conditions seems to be stabilizing in Brazil, we think that there is still
downside risk to the stock price if conditions deteriorate further in Venezuela and Argentina which account for approximately 9.2% and
15.7% of revenue and 19% and 11% of EBITDA respectively for 2012.
High inflation, currency devaluation and economic crisis in Venezuela
will contract Venezuelan margins by ~730bps in 2013. In Venezuela, 40% of F&P costs are dollar-linked; moreover, most businesses transact
using the unofficial exchange rate which is four times higher than the
official one. The inability to convert local currency to dollars and transfer them outside the country complicates royalty payments to MCD
(temporarily mitigated by MCD’s waiver) and makes cash flow
generation in Venezuela much less valuable than in countries where there are not such capital controls.
Argentina’s macroeconomic and political environment has similar
patterns than Venezuela, such as inflation, capital controls, import
restrictions, and a spread of ~60% between the official and unofficial exchange rates. However, being the cost center of the whole company,
currency devaluation in Argentina is significantly mitigated having a net
short currency exposure as corporate expenses are higher than the Argentinean EBITDA. Additionally, all F&P supplies are locally
produced.
VALUATION
To value the company we used both a DCF valuation model and
Multiples. Combining both valuation methodologies we come up with a Price Target of USD 12.00 per share. Despite the shortcomings of the
DCF model due to the difficulty in projecting very uncertain variables
such as inflation, foreign exchange, and economic growth in so many
different countries, we found it useful to get a better understanding of the company’s value drivers. For valuation multiples we focus on
2 Q 12 3 Q 12 4 Q 12 1 Q 13 2 Q 13
New unit (Annual Sales, 000) $ 1,927 $ 2,010 $ 2,283 $ 2,141 $ 1,902
Systemwide (000) $ 2,484 $ 2,477 $ 2,638 $ 2,542 $ 2,343
% of Systemwide 78% 81% 87% 84% 81%
New unit (Annual Sales, 000) $ 2,938 $ 2,691 $ 2,964 $ 2,666 $ 2,010
Systemwide (000) $ 3,466 $ 3,420 $ 3,496 $ 3,330 $ 3,320
% of Systemwide 85% 79% 85% 80% 61%
New unit (Annual Sales, 000) $ 884 $ 1,043 $ 1,789 $ 1,754 $ 2,120
Systemwide (000) $ 1,089 $ 1,103 $ 1,090 $ 1,068 $ 1,110
% of Systemwide 81% 95% 164% 164% 191%
New unit (Annual Sales, 000) $ 1,314 $ 2,087 $ 1,929 $ 2,191 $ 2,435
Systemwide (000) $ 2,981 $ 3,197 $ 3,139 $ 3,134 $ 3,213
% of Systemwide 44% 65% 61% 70% 76%
TOTAL
BRAZIL
NOLAD
SLAD
Source: Company Data & Team Estimates

Arcos Dorados Holdings Inc.
CFA Research Challenge - UCEMA
Page 7
EBITDA as EPS are negatively impacted by depreciation charges which seem to have a high growth component and to better compare companies
with different capital structures.
For DCF analysis we used a WACC of 11.9% which includes a weighted average of country risk of the territories where ARCO
operates. We projected cash flows until 2024 to assess the impact of the
increase in royalty payments of 1% both in 2018 and 2023. We estimated continuing negative impact from currency devaluation in 2013
getting somewhat better in 2014. After 2014, we estimated steady
revenue growth of 8.8% and EBITDA margins improving and
stabilizing at a ~9.4% level due to stable macro conditions and positive leverage of G&A. We estimated an average annual SSS growth of 10%
after 2014, 80% of it explained by ticket (average check) and 20% by
traffic. There is scope for margin improvement to our model if the traffic component of SSS increases. McCafé and Dessert Centers can also
improve sales and margins by improving the product mix. EBITDA is
expected to fall -3.5% in 2013 to $328mm, increase to $363 in 2014 and to $409 in 2015, resulting in an annual growth rate of 11.6%. For further
details of DCF assumptions and projections please see Exhibits 5 to 8.
Although there are many global QSR companies, some master
franchisees and local players, none has both the same business model than ARCO (75% company owned/25% franchised) and/or operate in
the same region. Nevertheless valuation multiples of the industry
provides a good proxy for ARCO’s valuation allowing for adjustment to reflect growth potential, risks, and current macro headwinds. ARCO is
trading at 9.3x EV/EBITDA, which is somewhat lower than the industry
average of 12.3x, but in our opinion correctly reflects current macro
conditions, downside risks from Venezuela and Argentina, and uncertainty about the future.
CompanyTEV/
EBITDA
%
Franchised
2012
unit
growth
2012
SSS
Growth
EBITDA
MarginP/E
Total
Debt/
EBITDA
11.8x 78.9% 5.10% 5.0% 20.6% 27.9x 1.1x
16.4x 96% 10.2% 5.2% 18.0% 28.5x 4.8x
9.3x 76% 2.6% 3.4% 14.9% 24.8x 1.7x
12.0x 78.2% -0.5% 1.7% 14.1% 34.1x 4.2x
14.8x 96.8% 3.9% 3.2% 43.0% 44.6x 4.8x
10.4x 80.9% 2.9% 3.1% 36.0% 17.2x 1.3x
6.5x 92.2% 17.8% 5.3% 16.1% 11.3x 0.6x
12.5x 99.5% 6.2% 3.7% 24.3% 22.7x 0.7x
McDonalds
Japan
franchisee9.5x NA NA NA 11.2% 32.7x 0.2x
17.8x 22.0% 10.8% 10.5% 12.5% 50.8x 2.7x
Average 12.1x 80% 6.6% 4.6% 21% 29.5x 2.2x
9x-10x 25.4% 5.9% 9.2% 8.5% 30.6x 2.1x
Source: S&P Capital IQ & Team Estimates
Risk Free Rate 3%
Market Premium 5.50%
Beta 1.25
Country Risk Premium 4.10%
Cost of Equity 14.0%
Cost of Debt 6.3%
Tax Rate 30.0%
Cost of Equity 14.0%
Debt / EV 22.0%
WACC 11.9%
Cost of Equity
WACC
Firm Value 3,050,220,551$
Net Debt 560,000,000$
Equit Value 2,490,220,551$
Common Shares 209,529,412$
Value per Share 11.88$
TARGET PRICE (DCF)
EBITDA 2013 E 328,674,698$
EBITDA MULTIPLE 9.5x
Firm Value 3,122,409,634$
Net Debt 560,000,000$
Equit Value 2,562,409,634$
Common Shares 209,529,412$
Value per Share 12.23$
TARGET PRICE
Arcos Dorados Holdings Inc.
CFA Research Challenge - UCEMA
Page 8
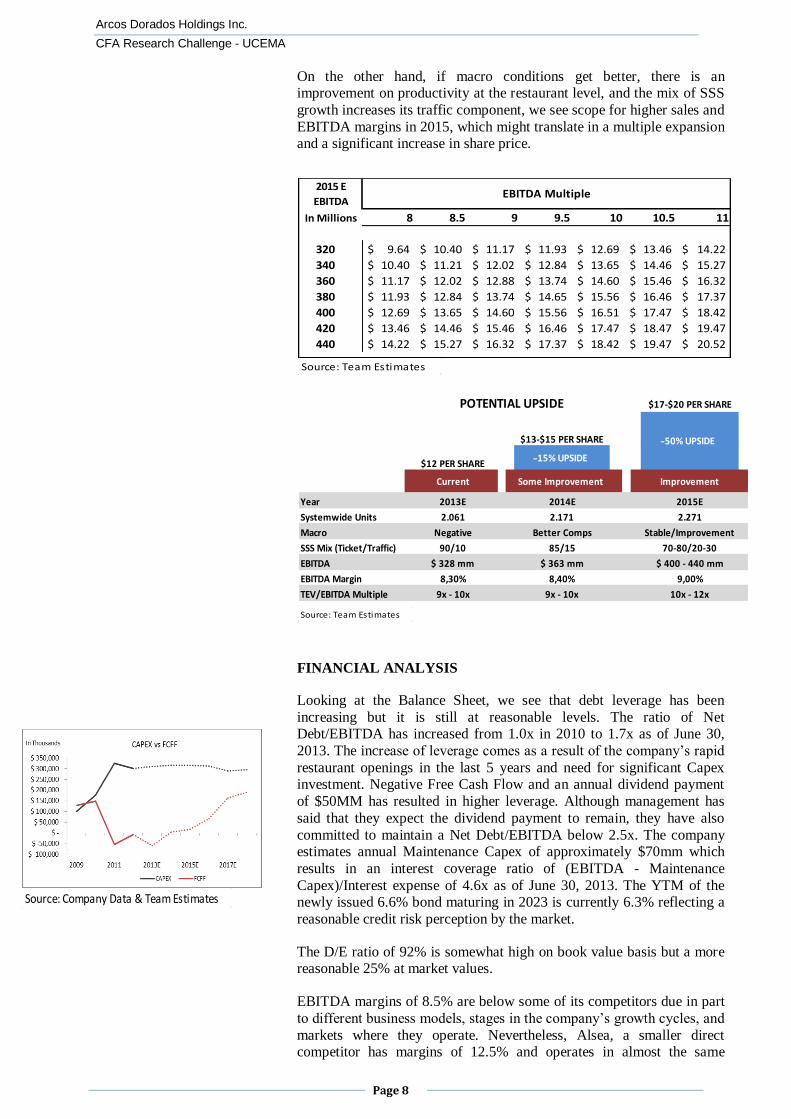
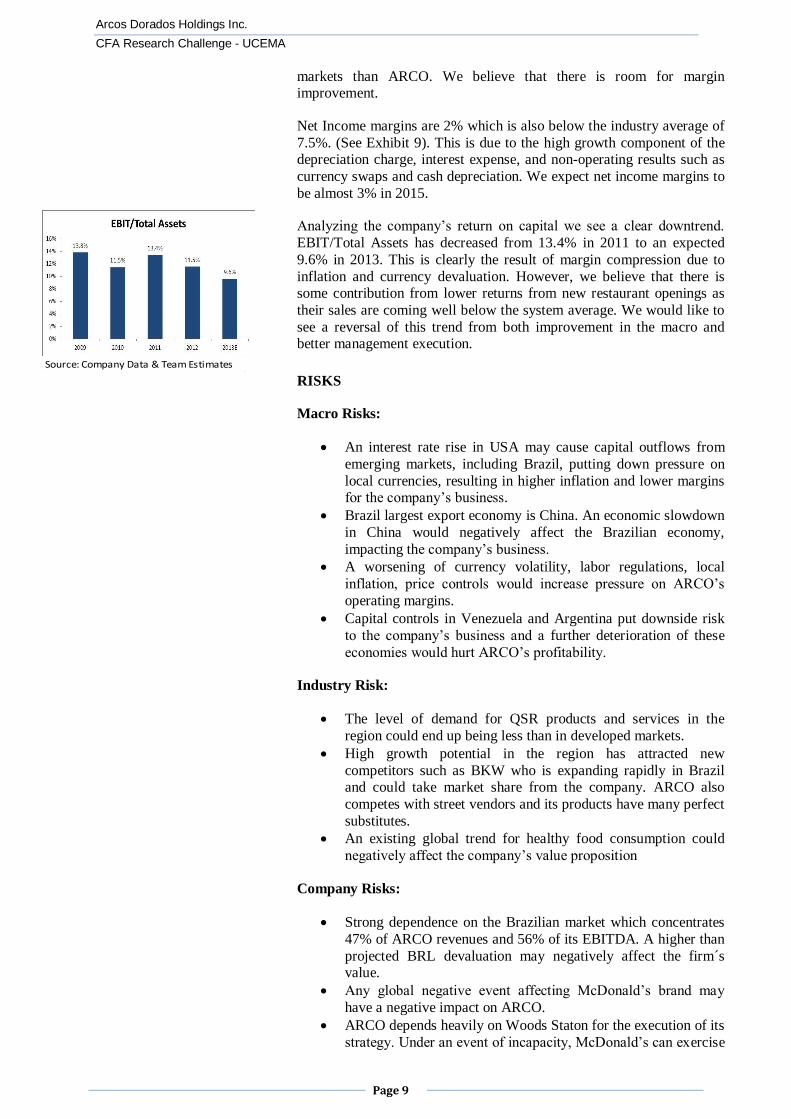
On the other hand, if macro conditions get better, there is an improvement on productivity at the restaurant level, and the mix of SSS
growth increases its traffic component, we see scope for higher sales and
EBITDA margins in 2015, which might translate in a multiple expansion and a significant increase in share price.
FINANCIAL ANALYSIS
Looking at the Balance Sheet, we see that debt leverage has been
increasing but it is still at reasonable levels. The ratio of Net Debt/EBITDA has increased from 1.0x in 2010 to 1.7x as of June 30,
2013. The increase of leverage comes as a result of the company’s rapid
restaurant openings in the last 5 years and need for significant Capex investment. Negative Free Cash Flow and an annual dividend payment
of $50MM has resulted in higher leverage. Although management has
said that they expect the dividend payment to remain, they have also
committed to maintain a Net Debt/EBITDA below 2.5x. The company estimates annual Maintenance Capex of approximately $70mm which
results in an interest coverage ratio of (EBITDA - Maintenance
Capex)/Interest expense of 4.6x as of June 30, 2013. The YTM of the newly issued 6.6% bond maturing in 2023 is currently 6.3% reflecting a
reasonable credit risk perception by the market.
The D/E ratio of 92% is somewhat high on book value basis but a more reasonable 25% at market values.
EBITDA margins of 8.5% are below some of its competitors due in part
to different business models, stages in the company’s growth cycles, and
markets where they operate. Nevertheless, Alsea, a smaller direct competitor has margins of 12.5% and operates in almost the same
Source: Team Estimates
8 8.5 9 9.5 10 10.5 11
320 9.64$ 10.40$ 11.17$ 11.93$ 12.69$ 13.46$ 14.22$
340 10.40$ 11.21$ 12.02$ 12.84$ 13.65$ 14.46$ 15.27$
360 11.17$ 12.02$ 12.88$ 13.74$ 14.60$ 15.46$ 16.32$
380 11.93$ 12.84$ 13.74$ 14.65$ 15.56$ 16.46$ 17.37$
400 12.69$ 13.65$ 14.60$ 15.56$ 16.51$ 17.47$ 18.42$
420 13.46$ 14.46$ 15.46$ 16.46$ 17.47$ 18.47$ 19.47$
440 14.22$ 15.27$ 16.32$ 17.37$ 18.42$ 19.47$ 20.52$
EBITDA Multiple2015 E
EBITDA
In Millions
Source: Company Data & Team Estimates
Source: Team Estimates
$17-$20 PER SHARE
$13-$15 PER SHARE
$12 PER SHARE
Current Some Improvement Improvement
Year 2013E 2014E 2015E
Systemwide Units 2.061 2.171 2.271
Macro Negative Better Comps Stable/Improvement
SSS Mix (Ticket/Traffic) 90/10 85/15 70-80/20-30
EBITDA $ 328 mm $ 363 mm $ 400 - 440 mm
EBITDA Margin 8,30% 8,40% 9,00%
TEV/EBITDA Multiple 9x - 10x 9x - 10x 10x - 12x
15% UPSIDE
50% UPSIDE
POTENTIAL UPSIDE
Arcos Dorados Holdings Inc.
CFA Research Challenge - UCEMA
Page 9
markets than ARCO. We believe that there is room for margin improvement.
Net Income margins are 2% which is also below the industry average of
7.5%. (See Exhibit 9). This is due to the high growth component of the depreciation charge, interest expense, and non-operating results such as
currency swaps and cash depreciation. We expect net income margins to
be almost 3% in 2015.
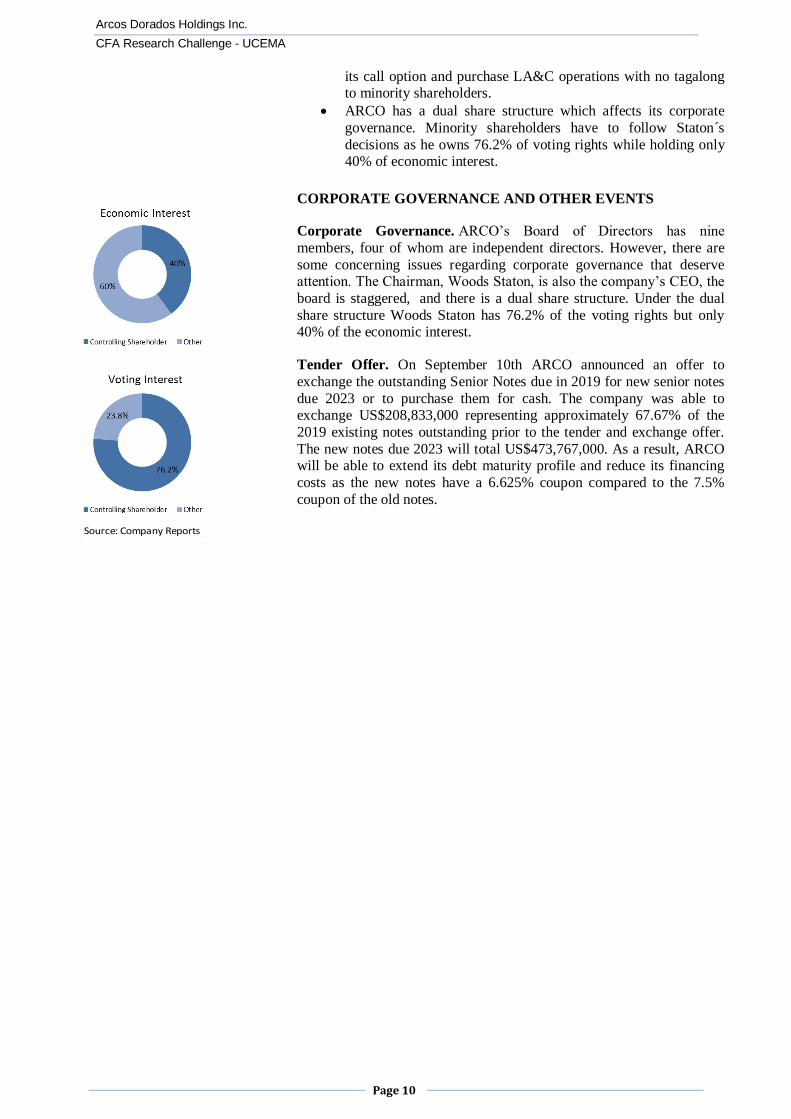
Analyzing the company’s return on capital we see a clear downtrend.
EBIT/Total Assets has decreased from 13.4% in 2011 to an expected
9.6% in 2013. This is clearly the result of margin compression due to
inflation and currency devaluation. However, we believe that there is some contribution from lower returns from new restaurant openings as
their sales are coming well below the system average. We would like to
see a reversal of this trend from both improvement in the macro and better management execution.
RISKS
Macro Risks:
An interest rate rise in USA may cause capital outflows from
emerging markets, including Brazil, putting down pressure on
local currencies, resulting in higher inflation and lower margins for the company’s business.
Brazil largest export economy is China. An economic slowdown
in China would negatively affect the Brazilian economy,
impacting the company’s business.
A worsening of currency volatility, labor regulations, local
inflation, price controls would increase pressure on ARCO’s
operating margins.
Capital controls in Venezuela and Argentina put downside risk
to the company’s business and a further deterioration of these
economies would hurt ARCO’s profitability.
Industry Risk:
The level of demand for QSR products and services in the
region could end up being less than in developed markets.
High growth potential in the region has attracted new
competitors such as BKW who is expanding rapidly in Brazil and could take market share from the company. ARCO also
competes with street vendors and its products have many perfect
substitutes.
An existing global trend for healthy food consumption could
negatively affect the company’s value proposition
Company Risks:
Strong dependence on the Brazilian market which concentrates
47% of ARCO revenues and 56% of its EBITDA. A higher than
projected BRL devaluation may negatively affect the firm´s value.
Any global negative event affecting McDonald’s brand may
have a negative impact on ARCO.
ARCO depends heavily on Woods Staton for the execution of its
strategy. Under an event of incapacity, McDonald’s can exercise
Source: Company Data & Team Estimates
Arcos Dorados Holdings Inc.
CFA Research Challenge - UCEMA
Page 10
its call option and purchase LA&C operations with no tagalong to minority shareholders.
ARCO has a dual share structure which affects its corporate
governance. Minority shareholders have to follow Staton´s
decisions as he owns 76.2% of voting rights while holding only 40% of economic interest.
CORPORATE GOVERNANCE AND OTHER EVENTS
Corporate Governance. ARCO’s Board of Directors has nine
members, four of whom are independent directors. However, there are
some concerning issues regarding corporate governance that deserve attention. The Chairman, Woods Staton, is also the company’s CEO, the
board is staggered, and there is a dual share structure. Under the dual
share structure Woods Staton has 76.2% of the voting rights but only 40% of the economic interest.
Tender Offer. On September 10th ARCO announced an offer to
exchange the outstanding Senior Notes due in 2019 for new senior notes
due 2023 or to purchase them for cash. The company was able to exchange US$208,833,000 representing approximately 67.67% of the
2019 existing notes outstanding prior to the tender and exchange offer.
The new notes due 2023 will total US$473,767,000. As a result, ARCO will be able to extend its debt maturity profile and reduce its financing
costs as the new notes have a 6.625% coupon compared to the 7.5%
coupon of the old notes.
Source: Company Reports
Arcos Dorados Holdings Inc.
CFA Research Challenge - UCEMA
Page 11
Glossary
Acquisition: Arcos purchased Latam business in August 2007. ARP: Argentinean Peso
BFFC: Brazil Fast Food Corporation
BKW: Burger King Worldwide
Bps: Basis Points BRL: Brazilean Real
CAGR: Compound Annual Growth Rate
CAPEX: Capital Expenditures CC: Constant Currency
CEO: Chief Executive Officer
CFO: Chief Financial Officer
COGS: Cost of goods Sold COP: Colombian Peso
DCF: Discount Cash Flow
EBIT: Earnings before interest and tax EBITDA: For purpose of this report, EBITDA equals Adjusted EBITDA as defined by the company.
Adjusted EBITDA is defined as operating income plus depreciation and amortization plus/minus the
following losses/gains included within other operating expenses, net and within general and administrative expenses in the statement of income: compensation expense related to a special award
granted to the CEO, incremental compensation expense related to the 2008 long-term incentive plan,
gains from sale of property and equipment, write-off of property and equipment, contract termination
losses, impairment of long-lived assets and goodwill, stock-based compensation related to the special awards under the 2011 Equity Incentive Plan and bonuses granted in connection with the initial public
offering.
EPS: Earnings per Share EV: Enterprise Value
F&P: Food and Paper
FCFF: Free Cash Flow to the Firm
FX: Foreign Exchange G&A: General and Administrative Expenses
Hrs: Hours
IPO: Initial Public Offering JV: Joint Venture
KFC: Kentucky Fried Chicken
LA&C: Latin America and the Caribbean LATAM: Latin America
LTM: Last Twelve Months
MCD: McDonald´s Corporation
MFA: Master Franchise Agreement mm: Millions
MXP: Mexican Peso
NM: Net Margin NOLAD: North Latin America Division
PT: Price Target
QSR: Quick Service Restaurants ROIC: Return on Invested Capital
SLAD: South Latin America Division
SSS: Same Store Sales
US: United States USA: Unites States of America
USD: United States Dollars
VEF: Venezuela Bolivar Fuerte Vs: versus
WACC: Weighed Average Cost of Capital
Arcos Dorados Holdings Inc.
CFA Research Challenge - UCEMA
Page 12
Appendix
Rating information
We rate companies as either: BUY, HOLD or SELL. A BUY rating is given when the security is
expected to deliver total returns of 15-20% or greater over the next twelve months and recommends
that investors take a position above the security's weight in the S&P 500, or any other relevant index.
A SELL rating is given when the security is expected to deliver negative returns over the next twelve
month period, while a HOLD rating implies flat returns over the next twelve months.
Exhibit 1: Same Store Sales Calculation
Same Store Sales growth or Systemwide Comparable Sales Growth refers to the change in ARCO´s
restaurant sales in one period for restaurats that have been open for thirteen months or longer.
Systemwide Comparable Sales growth is provided and analyzed on a constant currency basis, which
means it is calculated using the same exchange rate over the periods under comparison to remove the
effects of currency fluctuations from this trend analysis. The company believes this way of calculating
SSS provides a more meaningful analysis of the business by identifying the underlying business trend,
without distortion from the effect of foreign currency movements.
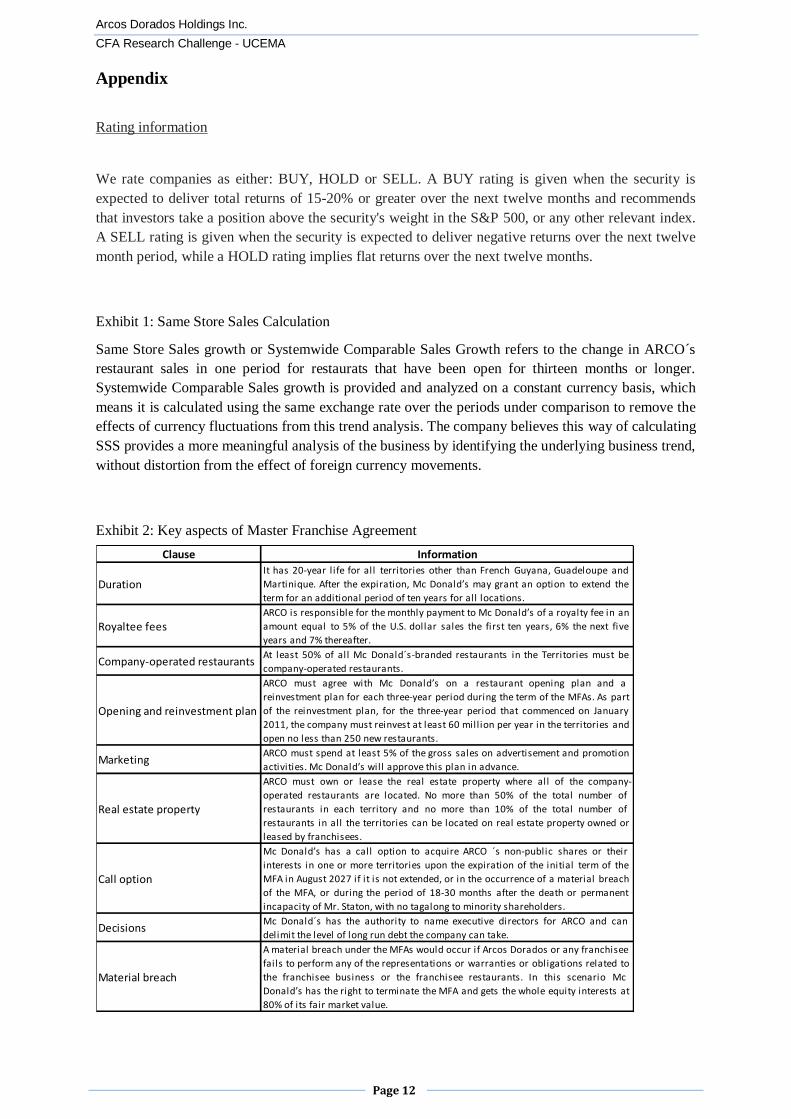
Exhibit 2: Key aspects of Master Franchise Agreement
Clause Information
DurationIt has 20-year life for all territories other than French Guyana, Guadeloupe and
Martinique. After the expiration, Mc Donald’s may grant an option to extend the
term for an additional period of ten years for all locations.
Royaltee feesARCO is responsible for the monthly payment to Mc Donald’s of a royalty fee in an
amount equal to 5% of the U.S. dollar sales the first ten years, 6% the next five
years and 7% thereafter.
Company-operated restaurantsAt least 50% of all Mc Donald´s-branded restaurants in the Territories must be
company-operated restaurants.
Opening and reinvestment plan
ARCO must agree with Mc Donald’s on a restaurant opening plan and a
reinvestment plan for each three-year period during the term of the MFAs. As part
of the reinvestment plan, for the three-year period that commenced on January
2011, the company must reinvest at least 60 million per year in the territories and
open no less than 250 new restaurants.
MarketingARCO must spend at least 5% of the gross sales on advertisement and promotion
activities. Mc Donald’s will approve this plan in advance.
Real estate property
ARCO must own or lease the real estate property where all of the company-
operated restaurants are located. No more than 50% of the total number of
restaurants in each territory and no more than 10% of the total number of
restaurants in all the territories can be located on real estate property owned or
leased by franchisees.
Call option
Mc Donald’s has a call option to acquire ARCO ´s non-public shares or their
interests in one or more territories upon the expiration of the initial term of the
MFA in August 2027 if it is not extended, or in the occurrence of a material breach
of the MFA, or during the period of 18-30 months after the death or permanent
incapacity of Mr. Staton, with no tagalong to minority shareholders.
DecisionsMc Donald´s has the authority to name executive directors for ARCO and can
delimit the level of long run debt the company can take.
Material breach
A material breach under the MFAs would occur if Arcos Dorados or any franchisee
fails to perform any of the representations or warranties or obligations related to
the franchisee business or the franchisee restaurants. In this scenario Mc
Donald’s has the right to terminate the MFA and gets the whole equity interests at
80% of its fair market value.
Arcos Dorados Holdings Inc.
CFA Research Challenge - UCEMA
Page 13
Exhibit 3: Consumer’s Food Service Breakdown
Exhibit 4: QSR Competitors
Source: Company Reports
Arcos Dorados Holdings Inc.
CFA Research Challenge - UCEMA
Page 14
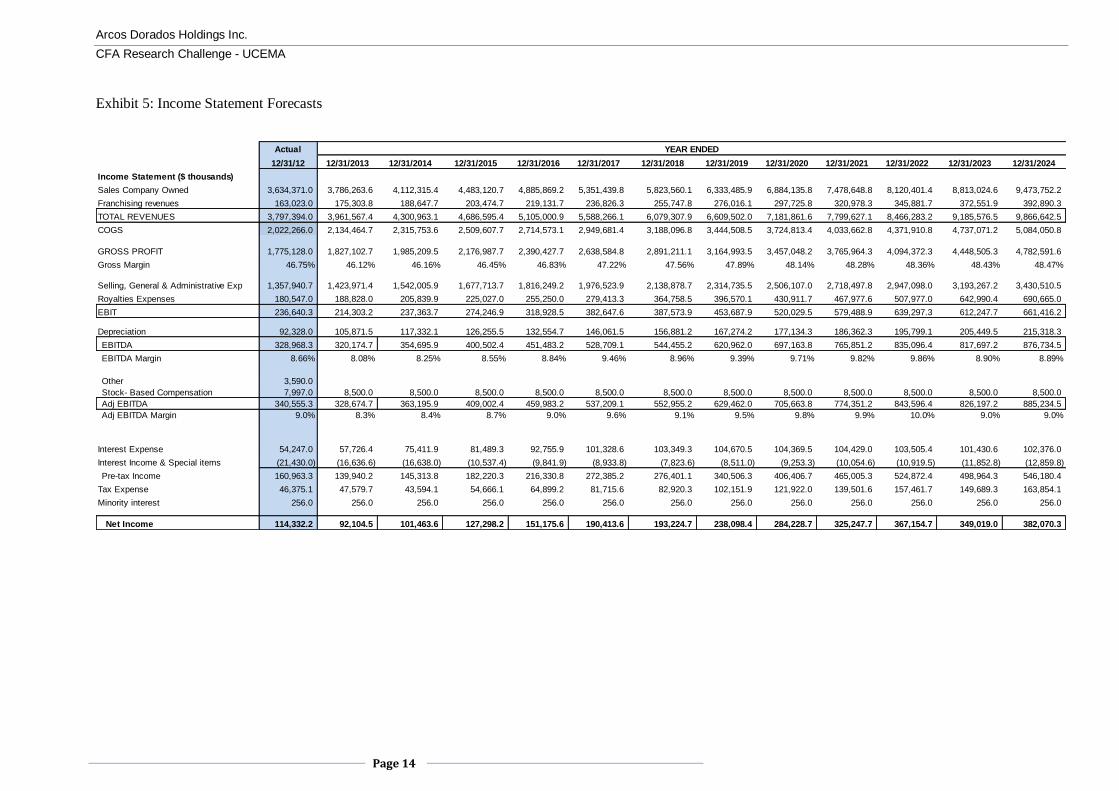
Exhibit 5: Income Statement Forecasts
Actual
12/31/12 12/31/2013 12/31/2014 12/31/2015 12/31/2016 12/31/2017 12/31/2018 12/31/2019 12/31/2020 12/31/2021 12/31/2022 12/31/2023 12/31/2024
Income Statement ($ thousands)
Sales Company Owned 3,634,371.0 3,786,263.6 4,112,315.4 4,483,120.7 4,885,869.2 5,351,439.8 5,823,560.1 6,333,485.9 6,884,135.8 7,478,648.8 8,120,401.4 8,813,024.6 9,473,752.2
Franchising revenues 163,023.0 175,303.8 188,647.7 203,474.7 219,131.7 236,826.3 255,747.8 276,016.1 297,725.8 320,978.3 345,881.7 372,551.9 392,890.3
TOTAL REVENUES 3,797,394.0 3,961,567.4 4,300,963.1 4,686,595.4 5,105,000.9 5,588,266.1 6,079,307.9 6,609,502.0 7,181,861.6 7,799,627.1 8,466,283.2 9,185,576.5 9,866,642.5
COGS 2,022,266.0 2,134,464.7 2,315,753.6 2,509,607.7 2,714,573.1 2,949,681.4 3,188,096.8 3,444,508.5 3,724,813.4 4,033,662.8 4,371,910.8 4,737,071.2 5,084,050.8
GROSS PROFIT 1,775,128.0 1,827,102.7 1,985,209.5 2,176,987.7 2,390,427.7 2,638,584.8 2,891,211.1 3,164,993.5 3,457,048.2 3,765,964.3 4,094,372.3 4,448,505.3 4,782,591.6
Gross Margin 46.75% 46.12% 46.16% 46.45% 46.83% 47.22% 47.56% 47.89% 48.14% 48.28% 48.36% 48.43% 48.47%
Selling, General & Administrative Exp 1,357,940.7 1,423,971.4 1,542,005.9 1,677,713.7 1,816,249.2 1,976,523.9 2,138,878.7 2,314,735.5 2,506,107.0 2,718,497.8 2,947,098.0 3,193,267.2 3,430,510.5
Royalties Expenses 180,547.0 188,828.0 205,839.9 225,027.0 255,250.0 279,413.3 364,758.5 396,570.1 430,911.7 467,977.6 507,977.0 642,990.4 690,665.0
EBIT 236,640.3 214,303.2 237,363.7 274,246.9 318,928.5 382,647.6 387,573.9 453,687.9 520,029.5 579,488.9 639,297.3 612,247.7 661,416.2
Depreciation 92,328.0 105,871.5 117,332.1 126,255.5 132,554.7 146,061.5 156,881.2 167,274.2 177,134.3 186,362.3 195,799.1 205,449.5 215,318.3
EBITDA 328,968.3 320,174.7 354,695.9 400,502.4 451,483.2 528,709.1 544,455.2 620,962.0 697,163.8 765,851.2 835,096.4 817,697.2 876,734.5
EBITDA Margin 8.66% 8.08% 8.25% 8.55% 8.84% 9.46% 8.96% 9.39% 9.71% 9.82% 9.86% 8.90% 8.89%
Other 3,590.0
Stock- Based Compensation 7,997.0 8,500.0 8,500.0 8,500.0 8,500.0 8,500.0 8,500.0 8,500.0 8,500.0 8,500.0 8,500.0 8,500.0 8,500.0
Adj EBITDA 340,555.3 328,674.7 363,195.9 409,002.4 459,983.2 537,209.1 552,955.2 629,462.0 705,663.8 774,351.2 843,596.4 826,197.2 885,234.5
Adj EBITDA Margin 9.0% 8.3% 8.4% 8.7% 9.0% 9.6% 9.1% 9.5% 9.8% 9.9% 10.0% 9.0% 9.0%
Interest Expense 54,247.0 57,726.4 75,411.9 81,489.3 92,755.9 101,328.6 103,349.3 104,670.5 104,369.5 104,429.0 103,505.4 101,430.6 102,376.0
Interest Income & Special items (21,430.0) (16,636.6) (16,638.0) (10,537.4) (9,841.9) (8,933.8) (7,823.6) (8,511.0) (9,253.3) (10,054.6) (10,919.5) (11,852.8) (12,859.8)
Pre-tax Income 160,963.3 139,940.2 145,313.8 182,220.3 216,330.8 272,385.2 276,401.1 340,506.3 406,406.7 465,005.3 524,872.4 498,964.3 546,180.4
Tax Expense 46,375.1 47,579.7 43,594.1 54,666.1 64,899.2 81,715.6 82,920.3 102,151.9 121,922.0 139,501.6 157,461.7 149,689.3 163,854.1
Minority interest 256.0 256.0 256.0 256.0 256.0 256.0 256.0 256.0 256.0 256.0 256.0 256.0 256.0
Net Income 114,332.2 92,104.5 101,463.6 127,298.2 151,175.6 190,413.6 193,224.7 238,098.4 284,228.7 325,247.7 367,154.7 349,019.0 382,070.3
YEAR ENDED
Arcos Dorados Holdings Inc.
CFA Research Challenge - UCEMA
Page 15
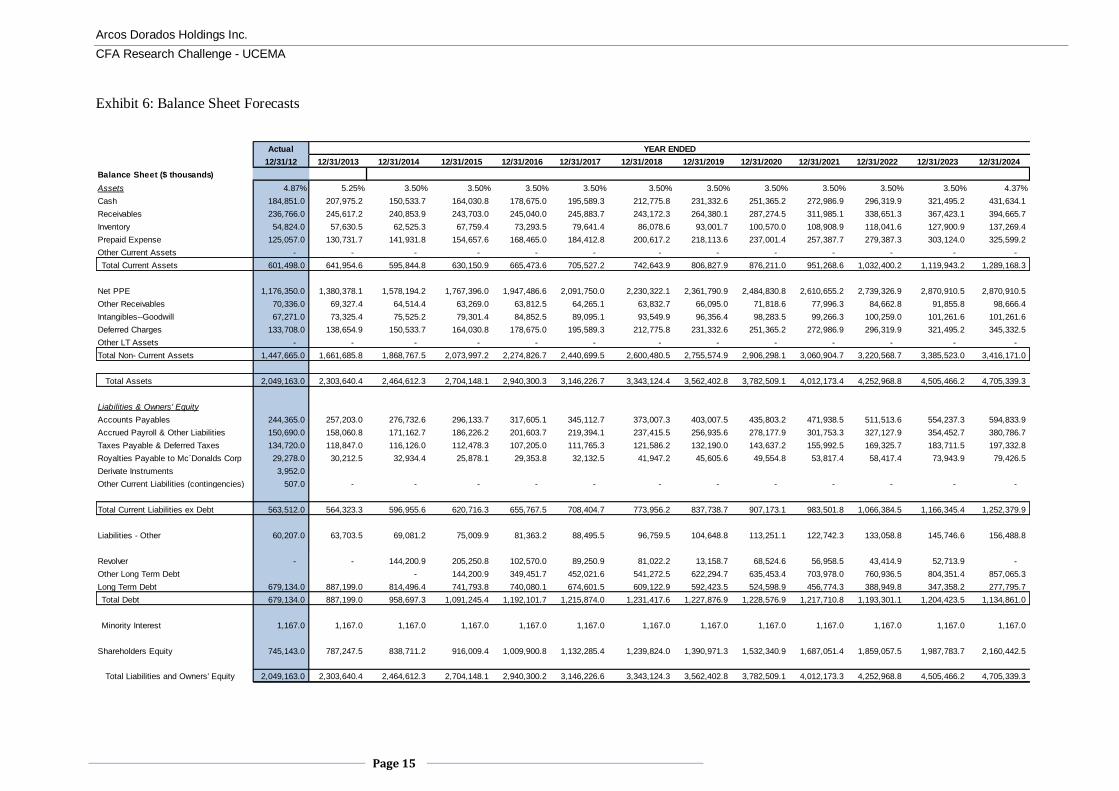
Exhibit 6: Balance Sheet Forecasts
Actual
12/31/12 12/31/2013 12/31/2014 12/31/2015 12/31/2016 12/31/2017 12/31/2018 12/31/2019 12/31/2020 12/31/2021 12/31/2022 12/31/2023 12/31/2024
Balance Sheet ($ thousands)
Assets 4.87% 5.25% 3.50% 3.50% 3.50% 3.50% 3.50% 3.50% 3.50% 3.50% 3.50% 3.50% 4.37%
Cash 184,851.0 207,975.2 150,533.7 164,030.8 178,675.0 195,589.3 212,775.8 231,332.6 251,365.2 272,986.9 296,319.9 321,495.2 431,634.1
Receivables 236,766.0 245,617.2 240,853.9 243,703.0 245,040.0 245,883.7 243,172.3 264,380.1 287,274.5 311,985.1 338,651.3 367,423.1 394,665.7
Inventory 54,824.0 57,630.5 62,525.3 67,759.4 73,293.5 79,641.4 86,078.6 93,001.7 100,570.0 108,908.9 118,041.6 127,900.9 137,269.4
Prepaid Expense 125,057.0 130,731.7 141,931.8 154,657.6 168,465.0 184,412.8 200,617.2 218,113.6 237,001.4 257,387.7 279,387.3 303,124.0 325,599.2
Other Current Assets - - - - - - - - - - - - -
Total Current Assets 601,498.0 641,954.6 595,844.8 630,150.9 665,473.6 705,527.2 742,643.9 806,827.9 876,211.0 951,268.6 1,032,400.2 1,119,943.2 1,289,168.3
Net PPE 1,176,350.0 1,380,378.1 1,578,194.2 1,767,396.0 1,947,486.6 2,091,750.0 2,230,322.1 2,361,790.9 2,484,830.8 2,610,655.2 2,739,326.9 2,870,910.5 2,870,910.5
Other Receivables 70,336.0 69,327.4 64,514.4 63,269.0 63,812.5 64,265.1 63,832.7 66,095.0 71,818.6 77,996.3 84,662.8 91,855.8 98,666.4
Intangibles--Goodwill 67,271.0 73,325.4 75,525.2 79,301.4 84,852.5 89,095.1 93,549.9 96,356.4 98,283.5 99,266.3 100,259.0 101,261.6 101,261.6
Deferred Charges 133,708.0 138,654.9 150,533.7 164,030.8 178,675.0 195,589.3 212,775.8 231,332.6 251,365.2 272,986.9 296,319.9 321,495.2 345,332.5
Other LT Assets - - - - - - - - - - - - -
Total Non- Current Assets 1,447,665.0 1,661,685.8 1,868,767.5 2,073,997.2 2,274,826.7 2,440,699.5 2,600,480.5 2,755,574.9 2,906,298.1 3,060,904.7 3,220,568.7 3,385,523.0 3,416,171.0
Total Assets 2,049,163.0 2,303,640.4 2,464,612.3 2,704,148.1 2,940,300.3 3,146,226.7 3,343,124.4 3,562,402.8 3,782,509.1 4,012,173.4 4,252,968.8 4,505,466.2 4,705,339.3
Liabilities & Owners' Equity
Accounts Payables 244,365.0 257,203.0 276,732.6 296,133.7 317,605.1 345,112.7 373,007.3 403,007.5 435,803.2 471,938.5 511,513.6 554,237.3 594,833.9
Accrued Payroll & Other Liabilities 150,690.0 158,060.8 171,162.7 186,226.2 201,603.7 219,394.1 237,415.5 256,935.6 278,177.9 301,753.3 327,127.9 354,452.7 380,786.7
Taxes Payable & Deferred Taxes 134,720.0 118,847.0 116,126.0 112,478.3 107,205.0 111,765.3 121,586.2 132,190.0 143,637.2 155,992.5 169,325.7 183,711.5 197,332.8
Royalties Payable to Mc´Donalds Corp 29,278.0 30,212.5 32,934.4 25,878.1 29,353.8 32,132.5 41,947.2 45,605.6 49,554.8 53,817.4 58,417.4 73,943.9 79,426.5
Derivate Instruments 3,952.0
Other Current Liabilities (contingencies) 507.0 - - - - - - - - - - - -
Total Current Liabilities ex Debt 563,512.0 564,323.3 596,955.6 620,716.3 655,767.5 708,404.7 773,956.2 837,738.7 907,173.1 983,501.8 1,066,384.5 1,166,345.4 1,252,379.9
Liabilities - Other 60,207.0 63,703.5 69,081.2 75,009.9 81,363.2 88,495.5 96,759.5 104,648.8 113,251.1 122,742.3 133,058.8 145,746.6 156,488.8
Revolver - - 144,200.9 205,250.8 102,570.0 89,250.9 81,022.2 13,158.7 68,524.6 56,958.5 43,414.9 52,713.9 -
Other Long Term Debt - 144,200.9 349,451.7 452,021.6 541,272.5 622,294.7 635,453.4 703,978.0 760,936.5 804,351.4 857,065.3
Long Term Debt 679,134.0 887,199.0 814,496.4 741,793.8 740,080.1 674,601.5 609,122.9 592,423.5 524,598.9 456,774.3 388,949.8 347,358.2 277,795.7
Total Debt 679,134.0 887,199.0 958,697.3 1,091,245.4 1,192,101.7 1,215,874.0 1,231,417.6 1,227,876.9 1,228,576.9 1,217,710.8 1,193,301.1 1,204,423.5 1,134,861.0
Minority Interest 1,167.0 1,167.0 1,167.0 1,167.0 1,167.0 1,167.0 1,167.0 1,167.0 1,167.0 1,167.0 1,167.0 1,167.0 1,167.0
Shareholders Equity 745,143.0 787,247.5 838,711.2 916,009.4 1,009,900.8 1,132,285.4 1,239,824.0 1,390,971.3 1,532,340.9 1,687,051.4 1,859,057.5 1,987,783.7 2,160,442.5
Total Liabilities and Owners' Equity 2,049,163.0 2,303,640.4 2,464,612.3 2,704,148.1 2,940,300.2 3,146,226.6 3,343,124.3 3,562,402.8 3,782,509.1 4,012,173.3 4,252,968.8 4,505,466.2 4,705,339.3
YEAR ENDED

Arcos Dorados Holdings Inc.
CFA Research Challenge - UCEMA
Page 16
Exhibit 7: Cash Flow Forecasts
12/31/2013 12/31/2014 12/31/2015 12/31/2016 12/31/2017 12/31/2018 12/31/2019 12/31/2020 12/31/2021 12/31/2022 12/31/2023 12/31/2024
Free Cash Flow Calculation ($ in thousands)
EBIT 214,303.2 237,363.7 274,246.9 318,928.5 382,647.6 387,573.9 453,687.9 520,029.5 579,488.9 639,297.3 612,247.7 661,416.2
Stock Compensation 8,500.0 8,500.0 8,500.0 8,500.0 8,500.0 8,500.0 8,500.0 8,500.0 8,500.0 8,500.0 8,500.0 8,500.0
Plus Depreciation 105,871.5 117,332.1 126,255.5 132,554.7 146,061.5 156,881.2 167,274.2 177,134.3 186,362.3 195,799.1 205,449.5 215,318.3
Decrease (increase) in receivables (8,851.2) 4,763.2 (2,849.0) (1,337.1) (843.7) 2,711.4 (21,207.8) (22,894.4) (24,710.6) (26,666.2) (28,771.7) (27,242.6)
Decrease (increase) in inventory (2,806.5) (4,894.8) (5,234.1) (5,534.1) (6,347.9) (6,437.2) (6,923.1) (7,568.2) (8,338.9) (9,132.7) (9,859.3) (9,368.4)
Decrease (increase) in prepaid expenses (5,674.7) (11,200.1) (12,725.9) (13,807.4) (15,947.8) (16,204.4) (17,496.4) (18,887.9) (20,386.3) (21,999.6) (23,736.7) (22,475.2)
Decrease (increase) in other current assets - - - - - - - - - - - -
Increase (decrease) in Accounts Payables 12,838.0 19,529.6 19,401.2 21,471.4 27,507.7 27,894.6 30,000.2 32,795.7 36,135.4 39,575.0 42,723.8 40,596.6
Increase (decrease) in Accrued Payroll & Other Liabilities 7,370.9 13,101.8 15,063.6 15,377.4 17,790.5 18,021.4 19,520.1 21,242.2 23,575.4 25,374.6 27,324.8 26,334.0
Increase (decrease) in Taxes Payable & Deferred Taxes (15,873.0) (2,721.0) (3,647.7) (5,273.3) 4,560.3 9,820.8 10,603.9 11,447.2 12,355.3 13,333.1 14,385.9 13,621.3
Royalties Payable to Mc´Donalds Corp 934.5 2,721.9 (7,056.3) 3,475.6 2,778.8 9,814.7 3,658.3 3,949.3 4,262.6 4,599.9 15,526.5 5,482.6
Less Capital Expenditures (309,899.6) (315,148.2) (315,457.3) (312,645.4) (290,324.8) (295,453.4) (298,742.9) (300,174.3) (312,186.7) (324,470.9) (337,033.1) (215,318.3)
Decrease (increase) in intangibles -- goodwill (6,054.4) (2,199.8) (3,776.3) (5,551.1) (4,242.6) (4,454.8) (2,806.5) (1,927.1) (982.8) (992.7) (1,002.6) -
Decrease (increase) in Deferred Charges (4,946.9) (11,878.8) (13,497.1) (14,644.2) (16,914.3) (17,186.5) (18,556.8) (20,032.6) (21,621.8) (23,333.0) (25,175.3) (23,837.3)
Taxes paid (47,579.7) (43,594.1) (54,666.1) (64,899.2) (81,715.6) (82,920.3) (102,151.9) (121,922.0) (139,501.6) (157,461.7) (149,689.3) (163,854.1)
Decrease (increase) in other receivables 1,008.6 4,813.0 1,245.4 (543.5) (452.5) 432.3 (2,262.3) (5,723.6) (6,177.7) (6,666.6) (7,192.9) (6,810.7)
WORKING CAPITAL (23,063.3) 7,222.0 (14,321.6) (5,822.7) 8,341.0 23,980.1 (3,208.1) (1,875.8) 288.2 758.5 11,415.3 3,110.9
Free Cash Flow available to the firm (50,859.4) 16,488.5 25,802.9 76,072.5 173,057.1 198,993.9 223,096.8 275,968.2 316,773.5 355,755.7 343,697.3 502,362.3
FCFF Growth -132.42% 56.49% 194.82% 127.49% 14.99% 12.11% 23.70% 14.79% 12.31% -3.39% 46.16%
Cash dividends paid to equity holders 50,000.0 50,000.0 50,000.0 57,284.2 68,029.0 85,686.1 86,951.1 142,859.1 170,537.2 195,148.6 220,292.8 209,411.4
Interest Income & Special items (16,636.6) (16,638.0) (10,537.4) (9,841.9) (8,933.8) (7,823.6) (8,511.0) (9,253.3) (10,054.6) (10,919.5) (11,852.8) (12,859.8)
Interest Expense (57,726.4) (75,411.9) (81,489.3) (92,755.9) (101,328.6) (103,349.3) (104,670.5) (104,369.5) (104,429.0) (103,505.4) (101,430.6) (102,376.0)
Liabilities - Other 3,496.5 5,377.7 5,928.7 6,353.3 7,132.3 8,264.0 7,889.4 8,602.3 9,491.2 10,316.4 12,687.8 10,742.3
Stock Compensation & Other (8,756.0) (8,756.0) (8,756.0) (8,756.0) (8,756.0) (8,756.0) (8,756.0) (8,756.0) (8,756.0) (8,756.0) (8,756.0) (8,756.0)
variation in Derivate instruments (3,952.0) - - - - - - - - - - -
Variation in Other Current Liabilities (contingencies) (507.0) - - - - - - - - - - -
Original Change in cash (184,940.8) (128,939.7) (119,051.0) (86,212.1) (6,858.0) 1,642.9 22,097.5 19,332.6 32,487.9 47,742.6 14,052.9 179,701.4
Fiscal Year Ended

Arcos Dorados Holdings Inc.
CFA Research Challenge - UCEMA
Page 17
Exhibit 8: DCF Assumptions
Local currencies will depreciate at the exact inflation rate as from 2015, therefore stabilizing
real exchange rates for all countries.
World Bank real GDP annual growth estimates by country as from 2015: Brazil 4,16%,
Argentina 3%, Mexico 3.3%, Venezuela 2.6% and Puerto Rico 2.5%.
Franchised restaurants pay 12% of their sales as royalty to ARCO. 2% is kept by the
company, 5% represents marketing expenses and the resulting 5% is the royalty payable to
MCD.
Imported COGS by division: 20% for Brazil, 18% for NOLAD, 12% for SLAD, 40% for
Venezuela and 90% for Caribbean.
Temporary Waiver for Venezuela is expected to be renewed annually until 2015.
The net cost of opening a restaurant is estimated in USD 1,6mm for 2013. As from 2014, net
costs rise at USA´s Inflation rate.
Minimum cash is established in 3.5% of total sales
In 2016, 2019 and 2023 we have estimated a roll-over of LT Notes maturing on such years.
Cash needs at the end of every year are covered with revolver debt.
Interest / LT Debt is established in 8.5% as from 2014 as revolver debt has a substantially
higher cost than the 6.625% and 7.5% the company pays as coupons for the USD-nominated
Notes.
Effective Tax rate is estimated 34% for 2013, and 30% from 2014 onwards.
Dividends Payment ratio is expected to be 45% of Net Income (the ratio the company used in
2011 and 2012) until 2020. As from that year, such ratio rises to 60%.
Arcos Dorados Holdings Inc.
CFA Research Challenge - UCEMA
Page 18
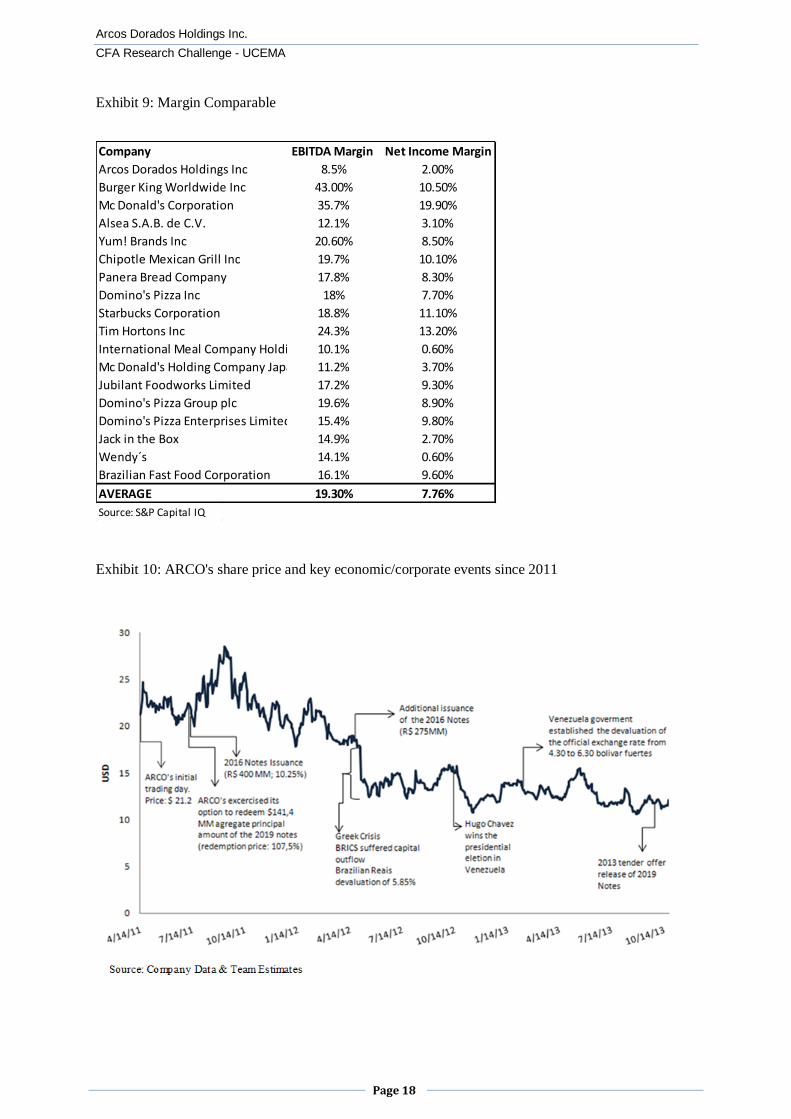
Exhibit 9: Margin Comparable
Exhibit 10: ARCO's share price and key economic/corporate events since 2011
Company EBITDA Margin Net Income Margin
Arcos Dorados Holdings Inc 8.5% 2.00%
Burger King Worldwide Inc 43.00% 10.50%
Mc Donald's Corporation 35.7% 19.90%
Alsea S.A.B. de C.V. 12.1% 3.10%
Yum! Brands Inc 20.60% 8.50%
Chipotle Mexican Grill Inc 19.7% 10.10%
Panera Bread Company 17.8% 8.30%
Domino's Pizza Inc 18% 7.70%
Starbucks Corporation 18.8% 11.10%
Tim Hortons Inc 24.3% 13.20%
International Meal Company Holdings S.A.10.1% 0.60%
Mc Donald's Holding Company Japan 11.2% 3.70%
Jubilant Foodworks Limited 17.2% 9.30%
Domino's Pizza Group plc 19.6% 8.90%
Domino's Pizza Enterprises Limited 15.4% 9.80%
Jack in the Box 14.9% 2.70%
Wendy´s 14.1% 0.60%
Brazilian Fast Food Corporation 16.1% 9.60%
AVERAGE 19.30% 7.76%
Source: S&P Capital IQ
Arcos Dorados Holdings Inc.
CFA Research Challenge - UCEMA
Page 19
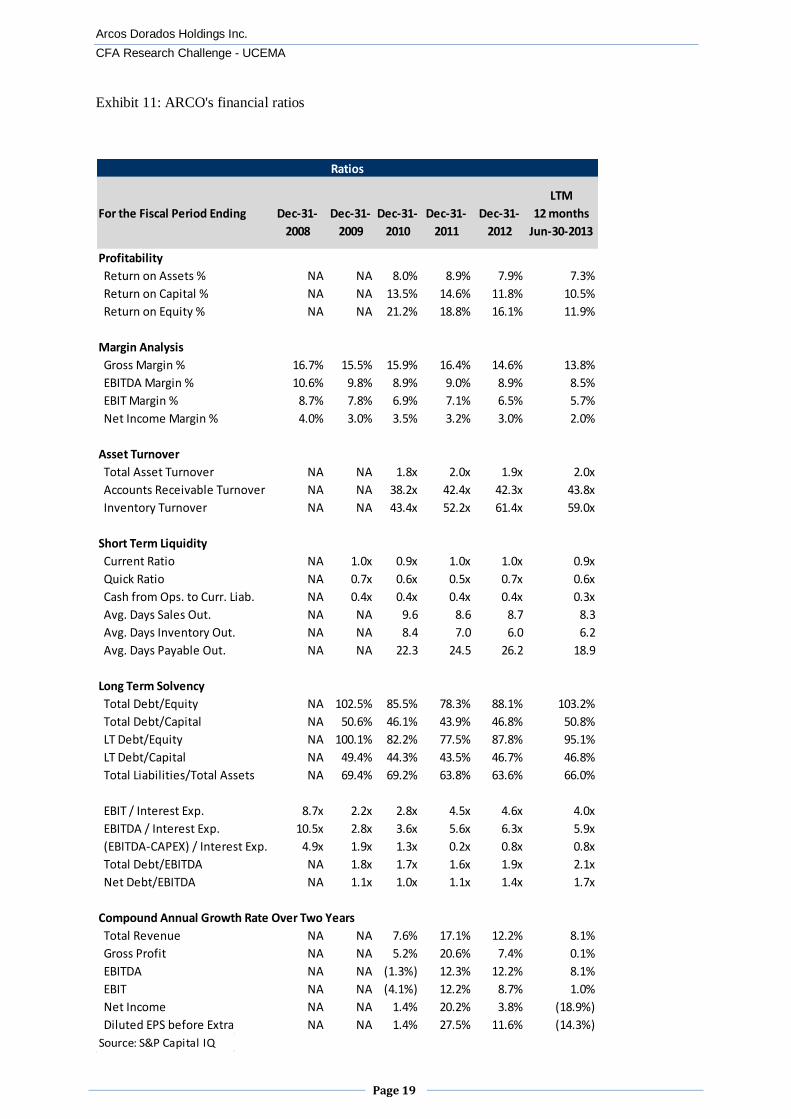
Exhibit 11: ARCO's financial ratios
Source: S&P Capital IQ
For the Fiscal Period Ending Dec-31-
2008
Dec-31-
2009
Dec-31-
2010
Dec-31-
2011
Dec-31-
2012
LTM
12 months
Jun-30-2013
Profitability
Return on Assets % NA NA 8.0% 8.9% 7.9% 7.3%
Return on Capital % NA NA 13.5% 14.6% 11.8% 10.5%
Return on Equity % NA NA 21.2% 18.8% 16.1% 11.9%
Margin Analysis
Gross Margin % 16.7% 15.5% 15.9% 16.4% 14.6% 13.8%
EBITDA Margin % 10.6% 9.8% 8.9% 9.0% 8.9% 8.5%
EBIT Margin % 8.7% 7.8% 6.9% 7.1% 6.5% 5.7%
Net Income Margin % 4.0% 3.0% 3.5% 3.2% 3.0% 2.0%
Asset Turnover
Total Asset Turnover NA NA 1.8x 2.0x 1.9x 2.0x
Accounts Receivable Turnover NA NA 38.2x 42.4x 42.3x 43.8x
Inventory Turnover NA NA 43.4x 52.2x 61.4x 59.0x
Short Term Liquidity
Current Ratio NA 1.0x 0.9x 1.0x 1.0x 0.9x
Quick Ratio NA 0.7x 0.6x 0.5x 0.7x 0.6x
Cash from Ops. to Curr. Liab. NA 0.4x 0.4x 0.4x 0.4x 0.3x
Avg. Days Sales Out. NA NA 9.6 8.6 8.7 8.3
Avg. Days Inventory Out. NA NA 8.4 7.0 6.0 6.2
Avg. Days Payable Out. NA NA 22.3 24.5 26.2 18.9
Long Term Solvency
Total Debt/Equity NA 102.5% 85.5% 78.3% 88.1% 103.2%
Total Debt/Capital NA 50.6% 46.1% 43.9% 46.8% 50.8%
LT Debt/Equity NA 100.1% 82.2% 77.5% 87.8% 95.1%
LT Debt/Capital NA 49.4% 44.3% 43.5% 46.7% 46.8%
Total Liabilities/Total Assets NA 69.4% 69.2% 63.8% 63.6% 66.0%
EBIT / Interest Exp. 8.7x 2.2x 2.8x 4.5x 4.6x 4.0x
EBITDA / Interest Exp. 10.5x 2.8x 3.6x 5.6x 6.3x 5.9x
(EBITDA-CAPEX) / Interest Exp. 4.9x 1.9x 1.3x 0.2x 0.8x 0.8x
Total Debt/EBITDA NA 1.8x 1.7x 1.6x 1.9x 2.1x
Net Debt/EBITDA NA 1.1x 1.0x 1.1x 1.4x 1.7x
Compound Annual Growth Rate Over Two Years
Total Revenue NA NA 7.6% 17.1% 12.2% 8.1%
Gross Profit NA NA 5.2% 20.6% 7.4% 0.1%
EBITDA NA NA (1.3%) 12.3% 12.2% 8.1%
EBIT NA NA (4.1%) 12.2% 8.7% 1.0%
Net Income NA NA 1.4% 20.2% 3.8% (18.9%)
Diluted EPS before Extra NA NA 1.4% 27.5% 11.6% (14.3%)
Ratios
Arcos Dorados Holdings Inc.
CFA Research Challenge - UCEMA
Page 20
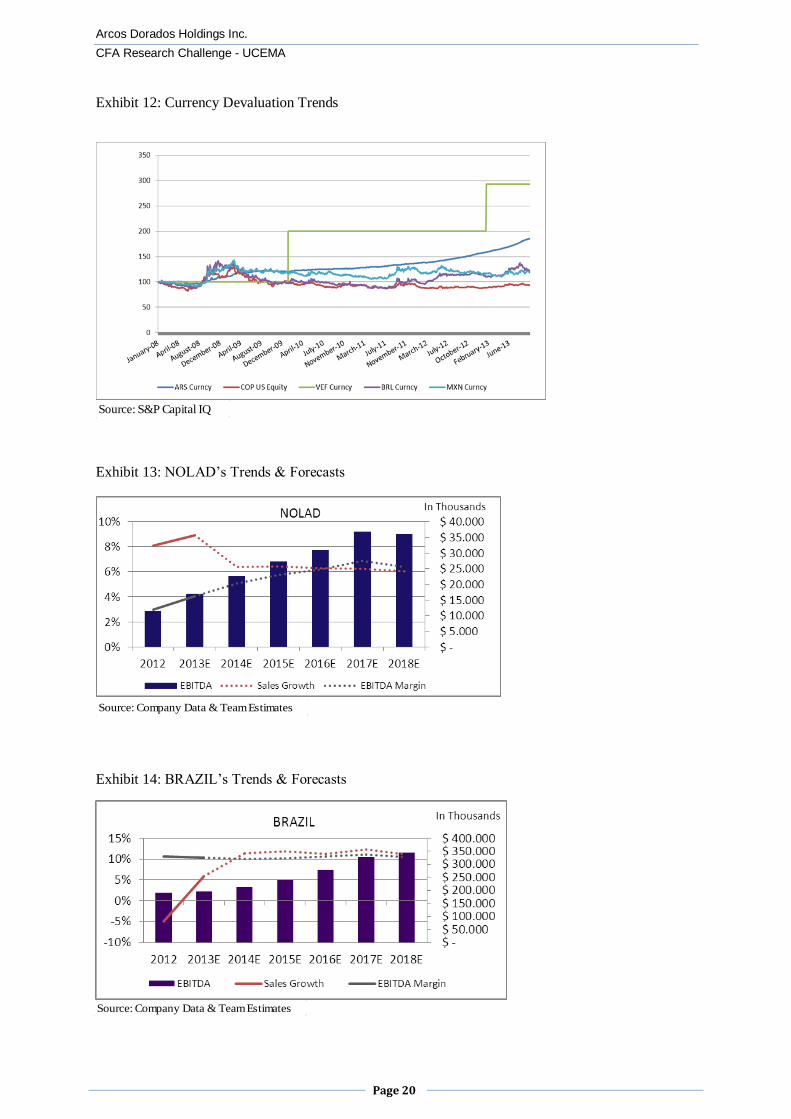
Exhibit 12: Currency Devaluation Trends
Exhibit 13: NOLAD’s Trends & Forecasts
Exhibit 14: BRAZIL’s Trends & Forecasts
Source: Company Data & Team Estimates
Source: Company Data & Team Estimates
Source: S&P Capital IQ
Arcos Dorados Holdings Inc.
CFA Research Challenge - UCEMA
Page 21
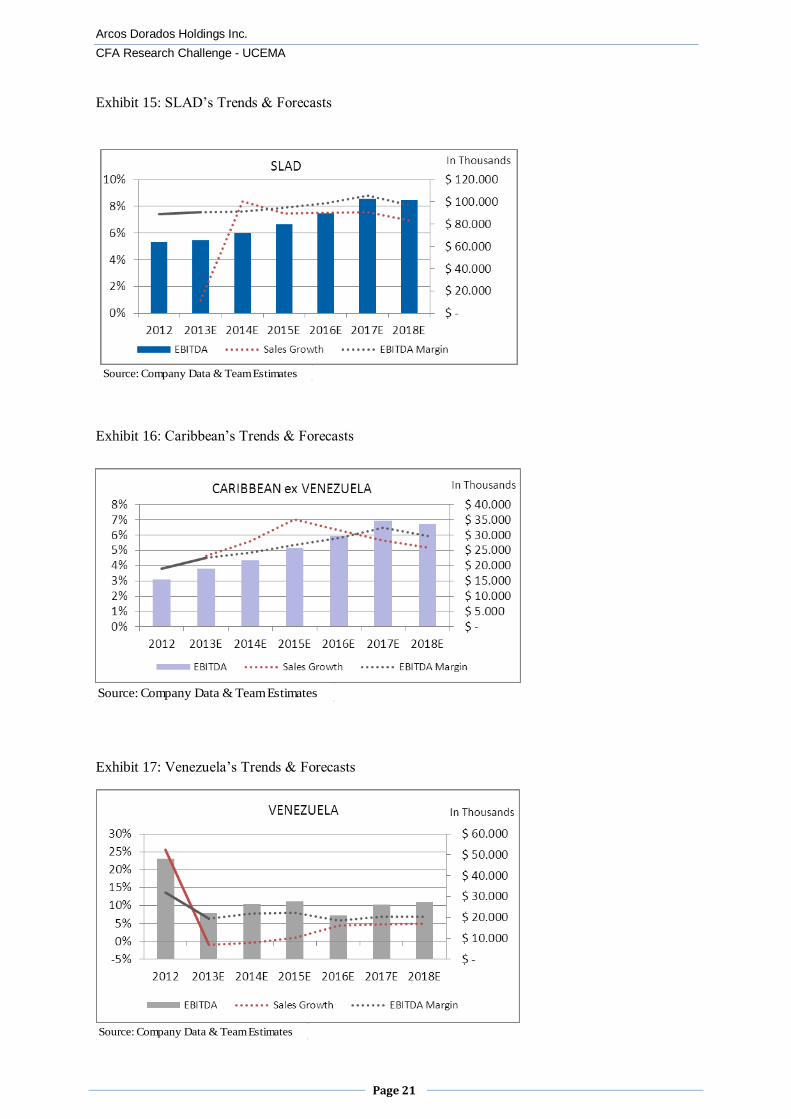
Exhibit 15: SLAD’s Trends & Forecasts
Exhibit 16: Caribbean’s Trends & Forecasts
Exhibit 17: Venezuela’s Trends & Forecasts
Source: Company Data & Team Estimates
Source: Company Data & Team Estimates
Source: Company Data & Team Estimates

Arcos Dorados Holdings Inc.
CFA Research Challenge - UCEMA
Page 22
Exhibit 18: Debt’s Trends & Forecasts
Exhibit 19: Profit Margin’s Trends & Forecasts
Exhibit 20: Expenses & EBITDA Breakdown
Source: Company Data & Team Estimates
Source: Company Data & Team Estimates
Source: Company Data & Team Estimates
Arcos Dorados Holdings Inc.
CFA Research Challenge - UCEMA
Page 23
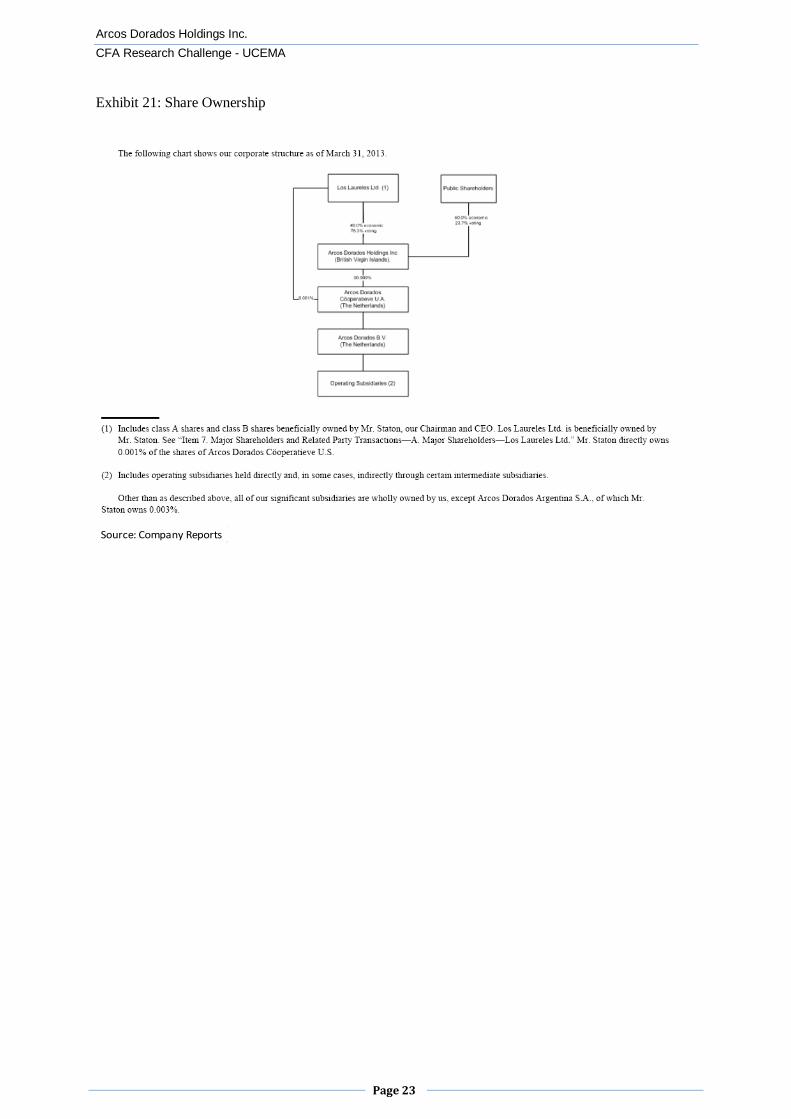
Exhibit 21: Share Ownership
Source: Company Reports
Arcos Dorados Holdings Inc.
CFA Research Challenge - UCEMA
Page 24
Disclosures: Ownership and material conflicts of interest: The author(s), or a member of their household, of this report does not hold a financial interest in the securities of this company. The author(s), or a member of their household, of this report does not know of the existence of any conflicts of interest that might bias the content or publication of this report.
Receipt of compensation: Compensation of the author(s) of this report is not based on investment banking revenue.
Position as a officer or director: The author(s), or a member of their household, does not serve as an officer, director or advisory board member of the subject company.
Market making: The author(s) does not act as a market maker in the subject company’s securities.
Disclaimer: The information set forth herein has been obtained or derived from sources generally available to the public and believed by
the author(s) to be reliable, but the author(s) does not make any representation or warranty, express or implied, as to its
accuracy or completeness. The information is not intended to be used as the basis of any investment decisions by any person
or entity. This information does not constitute investment advice, nor is it an offer or a solicitation of an offer to buy or sell
any security. This report should not be considered to be a recommendation by any individual affiliated with CFA Society of
Argentina and Uruguay, CFA Institute or the CFA Institute Research Challenge with regard to this company’s stock.
Disclosures: Ownership and material conflicts of interest: The author(s), or a member of their household, of this report does not hold a financial interest in the securities of this company. The author(s), or a member of their household, of this report does not know of the existence of any conflicts of interest that might bias the content or publication of this report.
Receipt of compensation: Compensation of the author(s) of this report is not based on investment banking revenue.
Position as a officer or director: The author(s), or a member of their household, does not serve as an officer, director or advisory board member of the subject company.
Market making: The author(s) does not act as a market maker in the subject company’s securities.
Disclaimer: The information set forth herein has been obtained or derived from sources generally available to the public and believed by the author(s) to be
reliable, but the author(s) does not make any representation or warranty, express or implied, as to its accuracy or completeness. The information is not intended to be used as the basis of any investment decisions by any person or entity. This information does not constitute investment advice, nor is it an offer or a solicitation of an offer to buy or sell any security. This report should not be considered to be a recommendation by any individual affiliated with CFA Society of Argentina and Uruguay, CFA Institute or the CFA Institute Research Challenge with regard to this company’s stock.
CFA Institute Research Challenge