cfa institute research challenge 2017 reporte pe&oles_final
TRANSCRIPT

CFA Institute Research Challenge Hosted by
CFA Society Mexico

Executive Summary Industrias Peñoles S.A.B. de C.V. is a Mexican mining group, holder of Fresnillo PLC and part
of Grupo BAL S.A. de C.V., a privately held diversified consortium of independent Mexican
companies. The company integrates the following operations: exploration, extraction, smelting,
refining and selling of both Precious metals and Base/Non-ferrous metals. The company is
divided in four segments: Precious Metals, Base Metals, Metallurgical and Others.
Investment Recommendation
We issue a Buy recommendation on Industrias Peñoles with a 12-month target price of MXN
$566.0 per share, with a projected total return (including dividends) of 17.90% from its
January 20, 2017 closing price of MXN $488.24 per share. Our target price is calculated by
using a tailored valuation approach. Our recommendation is driven by our:
Investment Thesis and Outline
Backed by (1) a positive outlook on precious metals, (2) a strong US Dollar (USD) and weak
Mexican Peso (MXN), (3) an attractive pipeline of growth projects coming in the following
years, and (4) a positive trend in the Base Metals and Metallurgical segments EBITDA margin,
Industrias Peñoles is well positioned for both revenues and earning margins further growth. The
result of the valuation suggests that PE&OLES* shares are presently undervalued, and this
represents an opportunity to invest. After determining Peñoles’ exposure to investment risks
and evaluating the corresponding impacts on valuation, we arrived to a Buy recommendation
(Figure 1).
Strong Precious Metals Outlook – Per our forecast, gold and silver spot prices (the most
important drivers of Peñoles’ revenues and stock prices, see Figure 2 and 10) will improve
marginally in 2017, and continue that upward trend thereafter. Our forecast is based on an
analysis of the main drivers of gold and silver prices, including investor demand for haven
assets, the US Treasury Bond yields, and the US equity markets.
Favorable USD/MXN Outlook – Peñoles benefits from a strong US Dollar and a weak
Mexican Peso. The main drivers of these two exchange rates support a positive outlook for
the USD and a negative one for MXN.
Competitive Positioning – Peñoles is the world’s top producer of refined silver, metallic
bismuth, and sodium sulfate, and it is the Latin America’s leading producer of refined gold
and lead. Furthermore, the company has an important pipeline of projects ahead that should
allow it to maintain and improve its current positioning.
Valuation – We derived our target price using a tailored valuation approach, employing
Discounted Cash Flow and Multiples Valuation methodologies.
Investment Risks – Quantifiable risks such as market and operational risks, qualitative
risks like country risk, and other risks were assessed for impact and likelihood and ranked
in a risk matrix, and subsequently modelled through a Monte Carlo simulation (Figure 3).
The simulation results show: 58.3% of the simulations support a buy recommendation,
39.1% support a hold recommendation, and 2.6% support a sell recommendation.
Figure 1: Summary of Market, Financial and Valuation Data
Market Data
PE&OLES*
Ordinary Shares
Closing Price (MXN$) $488.24
Shares Outstanding (millions) 397.48
Avg. Volume 436,390.00
Market Cap. (MXN$ mm) $190.81
Enterprise Value (MXN$ mm) $223.28
EV/EBITDA (LTM) 11.35
EV/Reserves (FY2015) 4.00
Financial Data
2011 2012 2013 2014 2015
Gross
Margin
34.54% 29.48% 27.74% 26.11% 20.59%
EBITDA
Margin
32.63% 26.64% 23.85% 22.13% 20.58%
EPS
(MXN$)
32.09 25.24 11.98 3.02 (2.18)
Capex/
Sales
9.93 11.74 16.36 14.76 17.7
ROE 38.24% 24.19% 11.38% 2.71% -1.75%
ROA 18.72% 12.40% 5.47% 1.25% -8.30%
Interest
Coverage
60.33x 40.19x 13.2x 5.6x 3.49x
Debt/
Equity
15.82 18.45 35.75 39.88 37.3
Valuation Results
($MXN)
Price from Relative Valuation 524.18
Weight of Relative Valuation 40%
Price from Intrinsic Valuation
(DCF)
593.89
Weight of Intrinsic Valuation (DCF) 60%
12-Month Target Price 566.00
Price Per Share (January 20,
2017)
488.24
Annual Dividend 9.62
Total Return 17.90%
Source: Bloomberg, Thomson Reuters, Team Estimates
This report is published for educational purposes only by students
competing in The CFA Institute Research Challenge.
Date: 20-Jan-2017
Ticker: PE&OLES*
Closing Price: $488.24
MXN$1.00:US$0.0465
Recommendation: Buy (17.9% Total Return)
Target Price: $566.00 (US$26.32)
Figure 2: PE&OLES Stock and Gold Spot Prices Since U.S. Election
Day:
Source: Thomson Reuters
1110
1130
1150
1170
1190
1210
1230
1250
1270
1290
350
400
450
500
550
600
11
/8/2
016
11
/15/2
01
6
11
/22/2
01
6
11
/29/2
01
6
12
/6/2
016
12
/13/2
01
6
12
/20/2
01
6
12
/27/2
01
6
1/3
/201
7
1/1
0/2
017
1/1
7/2
017
MX
N$
PE&OLES (MXN$) Gold (US$/Oz)
December 14, 2016: Fed's meeting minutes release
November 8, 2016: U.S. election day
Figure 3: Monte Carlo Simulation Summary
Source: Team Estimates
0
5,000
10,000
15,000
20,000
25,000
30,000
35,000
40,000
45,000
50,000
Fre
qu
en
cy
Sell Hold Buy
Student Research Precious Metals, Materials
Mexican Stock Exchange (“MSE”)
Industrias Peñoles S.A.B. de C.V.
1
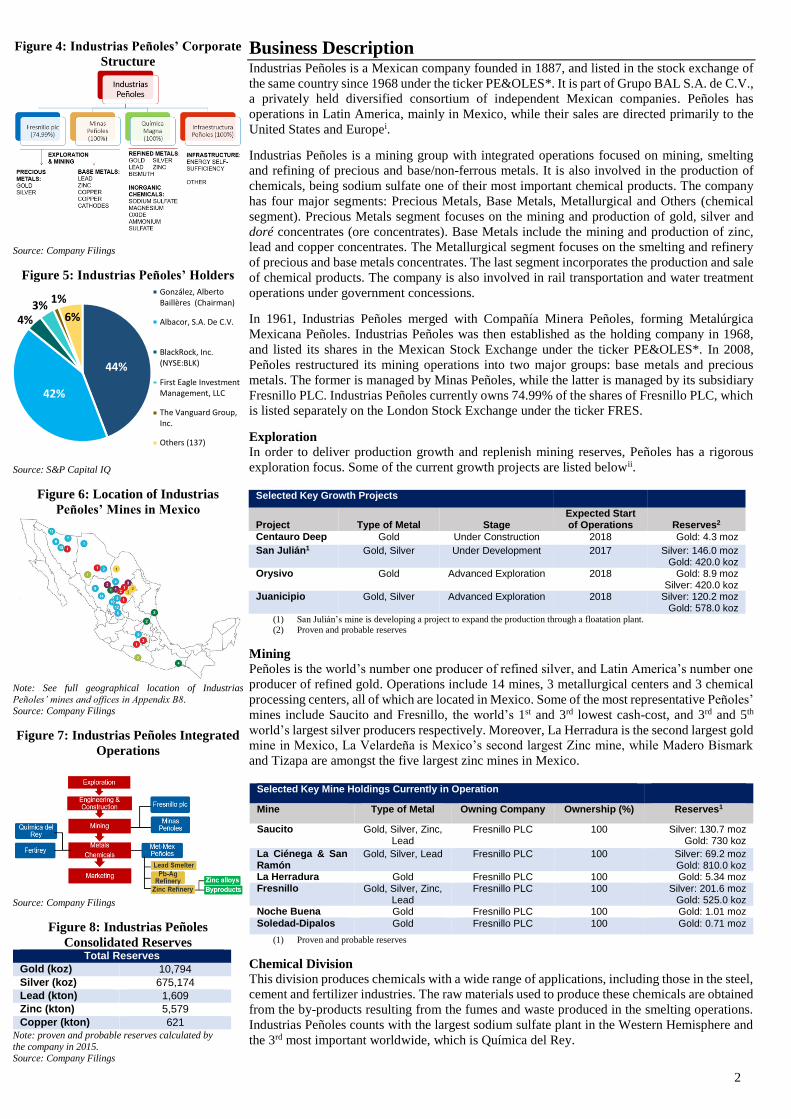
Business Description Industrias Peñoles is a Mexican company founded in 1887, and listed in the stock exchange of
the same country since 1968 under the ticker PE&OLES*. It is part of Grupo BAL S.A. de C.V.,
a privately held diversified consortium of independent Mexican companies. Peñoles has
operations in Latin America, mainly in Mexico, while their sales are directed primarily to the
United States and Europei.
Industrias Peñoles is a mining group with integrated operations focused on mining, smelting
and refining of precious and base/non-ferrous metals. It is also involved in the production of
chemicals, being sodium sulfate one of their most important chemical products. The company
has four major segments: Precious Metals, Base Metals, Metallurgical and Others (chemical
segment). Precious Metals segment focuses on the mining and production of gold, silver and
doré concentrates (ore concentrates). Base Metals include the mining and production of zinc,
lead and copper concentrates. The Metallurgical segment focuses on the smelting and refinery
of precious and base metals concentrates. The last segment incorporates the production and sale
of chemical products. The company is also involved in rail transportation and water treatment
operations under government concessions.
In 1961, Industrias Peñoles merged with Compañía Minera Peñoles, forming Metalúrgica
Mexicana Peñoles. Industrias Peñoles was then established as the holding company in 1968,
and listed its shares in the Mexican Stock Exchange under the ticker PE&OLES*. In 2008,
Peñoles restructured its mining operations into two major groups: base metals and precious
metals. The former is managed by Minas Peñoles, while the latter is managed by its subsidiary
Fresnillo PLC. Industrias Peñoles currently owns 74.99% of the shares of Fresnillo PLC, which
is listed separately on the London Stock Exchange under the ticker FRES.
Exploration
In order to deliver production growth and replenish mining reserves, Peñoles has a rigorous
exploration focus. Some of the current growth projects are listed belowii.
Selected Key Growth Projects
Project
Type of Metal
Stage
Expected Start of Operations
Reserves2
Centauro Deep Gold Under Construction 2018 Gold: 4.3 moz
San Julián1 Gold, Silver Under Development 2017 Silver: 146.0 moz Gold: 420.0 koz
Orysivo Gold Advanced Exploration 2018 Gold: 8.9 moz Silver: 420.0 koz
Juanicipio Gold, Silver Advanced Exploration 2018 Silver: 120.2 moz Gold: 578.0 koz
(1) San Julián’s mine is developing a project to expand the production through a floatation plant.
(2) Proven and probable reserves
Mining
Peñoles is the world’s number one producer of refined silver, and Latin America’s number one
producer of refined gold. Operations include 14 mines, 3 metallurgical centers and 3 chemical
processing centers, all of which are located in Mexico. Some of the most representative Peñoles’
mines include Saucito and Fresnillo, the world’s 1st and 3rd lowest cash-cost, and 3rd and 5th
world’s largest silver producers respectively. Moreover, La Herradura is the second largest gold
mine in Mexico, La Velardeña is Mexico’s second largest Zinc mine, while Madero Bismark
and Tizapa are amongst the five largest zinc mines in Mexico.
Selected Key Mine Holdings Currently in Operation
Mine Type of Metal Owning Company Ownership (%) Reserves1
Saucito Gold, Silver, Zinc, Lead
Fresnillo PLC 100 Silver: 130.7 moz Gold: 730 koz
La Ciénega & San Ramón
Gold, Silver, Lead Fresnillo PLC 100 Silver: 69.2 moz Gold: 810.0 koz
La Herradura Gold Fresnillo PLC 100 Gold: 5.34 moz Fresnillo Gold, Silver, Zinc,
Lead Fresnillo PLC 100 Silver: 201.6 moz
Gold: 525.0 koz Noche Buena Gold Fresnillo PLC 100 Gold: 1.01 moz
Soledad-Dipalos Gold Fresnillo PLC 100 Gold: 0.71 moz
(1) Proven and probable reserves
Chemical Division
This division produces chemicals with a wide range of applications, including those in the steel,
cement and fertilizer industries. The raw materials used to produce these chemicals are obtained
from the by-products resulting from the fumes and waste produced in the smelting operations.
Industrias Peñoles counts with the largest sodium sulfate plant in the Western Hemisphere and
the 3rd most important worldwide, which is Química del Rey.
Figure 4: Industrias Peñoles’ Corporate
Structure
Source: Company Filings
Figure 5: Industrias Peñoles’ Holders
Source: S&P Capital IQ
Figure 6: Location of Industrias
Peñoles’ Mines in Mexico
Note: See full geographical location of Industrias
Peñoles’ mines and offices in Appendix B8.
Source: Company Filings
Figure 7: Industrias Peñoles Integrated
Operations
Source: Company Filings
Figure 8: Industrias Peñoles
Consolidated Reserves Total Reserves
Gold (koz) 10,794
Silver (koz) 675,174
Lead (kton) 1,609
Zinc (kton) 5,579
Copper (kton) 621 Note: proven and probable reserves calculated by
the company in 2015.
Source: Company Filings
44%
42%
4%3%
1%
6%
González, AlbertoBaillères (Chairman)
Albacor, S.A. De C.V.
BlackRock, Inc.(NYSE:BLK)
First Eagle InvestmentManagement, LLC
The Vanguard Group,Inc.
Others (137)
2

Industry Overview and Competitive Positioning
Industry Overview Industrias Peñoles revenues come from metals and minerals sales, from which precious metals
account for 69% of total sales (Figure 9). Since most of the revenue comes from precious metals,
Peñoles revenues are very sensitive to changes in gold and silver spot market prices (Figure 10).
Gold
Gold Seen as a Haven Asset by Investors
In the latest years, gold prices have been significantly influenced by investor related demand in
gold ETFs, futures and derivatives contracts (Figure 3), whereas physical demand hasn’t been
as significant to changes in gold prices (Appendix B1). Furthermore, gold has become the
number one choice as a haven asset for investors, hence gold trades more than many other major
financial assets like the S&P 500, with nearly 200 US$bn/dayiii. Since gold is seen by investors
as a safe haven, changes in economic indicators drive wide movements in gold prices. The US
10-Year treasury bond yield is one of the most important drivers of gold prices, when the yield
goes up the gold price goes down and vice versa (Figure 12).
Trump Administration Impact on Gold Outlook
With the Trump administration, investors are foreseeing an uncertain economic outlook in the
US. On the one hand the market is speculating about a stronger than anticipated US economic
growth (GDP growth) and a higher inflation rate resulting from the policies that President
Trump proposed. This economic growth would come mostly from higher corporate investments
in the US, better employment numbers, a higher disposable income rate and an improvement in
the domestic consumption rate. As a result of these expectations, the S&P500 has been rallying
since the day of the US election until today, breaking all-time highs repeatedly (Figure18), the
US Dollar risen significantly relative to the major currencies since the day of the election (but
has been weakening since the Fed December meeting), and the US 10-Year Yield rallied since
the day of the election as well (and stopped the rally the day of the Fed’s December meeting).
Allover, these caused the gold prices to plummet from the day of the election to the day of the
Fed’s December meeting. However, this positive economic narrative changed the day after the
Federal Reserve held their December meeting on December 14, 2016. The minutes from the
Fed showed uncertainty over how President-elect (now President) Trump’s policies would
impact the pace of interest-rate increasesiv. The Fed officials also suggested three (instead of
two, as proposed in the previous meeting) rate hikes would be appropriate for 2017. The Fed’s
meeting minutes raised uncertainty in the market about the new US administration, and caused
major inflation fear. Thus, the US Dollar has been weakening since then until today, the US 10-
Year yield has also been weakening, and gold has climbed to a seven-week high as the market
demands for haven assets given the current investors’ sentiment about an uncertain U.S.
economic performance (Figure 13). The U.S. economic uncertainty along with expected market
volatility in Europe because of elections (Germany, France and Netherlands elections) in 2017,
should further increase investor’s appetite for haven assets. Given the mentioned above, we
forecast 2017 gold prices to be at $1,217.5/oz, and to keep rising marginally in the following
years as U.S. growth/inflation mix deteriorates through the President Trump’s administration
period.
Silver
Silver has proven to move in synergy with gold prices over the past years, having a sharp fall
since the US presidential elections until the Fed’s December meeting, and then rallying sharply
until today (Figure 13). Like gold, silver prices are mostly affected by investor demand in silver
ETFs, futures and other derivatives contracts (Figure 14), despite having a considerable amount
of physical demand (Appendix B2). Hence, we forecast 2017 silver prices to be at $17.21/oz,
and then to keep rising marginally along with the rise of gold spot prices.
Zinc
Zinc price movements are mainly driven by physical supply and demand (Figure 15). World
zinc supply is forecasted to decline, as one of the biggest Zinc mines in the world
(Glencore/Nyrstar) announced suspensions and more production cutbacks for the year 2017
(this mine started the production cutbacks in 2016v). Furthermore, average zinc concentrate
inventory levels at China smelters, which account for almost half of the world’s refined zinc
smelters, have dropped down from eight-weeks’ worth at the beginning of the year 2016 to just
3 weeks at some smelters in the 3rd quarter of 2016vi. More to this, the China’s zinc smelting
industry has lowered its fees for turning ore concentrates into refined metals by 20% (Treatment
charges or TCs), in an effort to be more competitive against a heated-up zinc market, this move
signals a tightening in zinc world supplyvii. The TCs fall-off came after some of the world’s
largest zinc mines, such as Century in Australia and Lisheen in Ireland, suddenly ran out of ore.
Figure 9: Industrias Peñoles Sales by
Product
Source: Company Filings
Figure 10: Industrias Peñoles Quarterly
Revenues vs. Gold Spot Prices
Source: Thomson Reuters
Figure 11: Gold Futures and Options
Net Position of Managed Money vs Gold
Price
Note: Monthly bars from December 2015 to December
2016.
Source: Thomson Reuters
Figure 12: Regression of Gold Spot
Price vs US 10-Year Yield
Note: Data from 1999 to 2016.
Source: Thomson Reuters, Team Calculations
Gold41%
Silver28%
Zinc12% Lead
6%
Ore Concentrates4%
Copper4%
Sodium Sulfate3%
Other2%
0
200
400
600
800
1000
1200
1400
1600
1800
2000
0
5000
10000
15000
20000
25000
30000
19
95
19
96
19
98
19
99
20
01
20
03
20
04
20
06
20
07
20
09
20
11
20
12
20
14
20
15
Reve
nu
es (
MX
N$ m
illio
ns)
PE&OLES Revenues (Left Axis)
Gold Spot Price (Right Axis)
1,000
1,050
1,100
1,150
1,200
1,250
1,300
1,350
1,400
-50,000
0
50,000
100,000
150,000
200,000
250,000
300,000
Gold Futures & ContractsGold Spot Price
0.00
200.00
400.00
600.00
800.00
1000.00
1200.00
1400.00
1600.00
1800.00
2000.00
0.00 2.00 4.00 6.00 8.00
Go
ld $
US
/oz
US 10Y Yield %
US
$/O
z
US
$/O
z
Con
tra
cts
3

In the other hand, zinc demand is expected to grow as China, the world’s biggest zinc consumer,
incentivizes its domestic economic growth with supportive fiscal and monetary policies. Given
the above mentioned we foresee a positive zinc outlook ahead, we forecast 2017 zinc prices to
be at US$ 2740.0 a ton, and to keep rising from there (Appendix B4).
Lead
Like zinc, lead prices are mainly driven by physical supply and demand (Appendix B5). China,
the world’s biggest producer and consumer of lead (lead is mostly used to make batteries), is
expected to suffer a supply tightening in 2017, as lead smelters struggled to keep up with lead
production levels in 2016viii. Following the zinc story, global mine shutdowns over the year
2015 and 2016, moves by lead producers to cut output, along with low lead prices, have
tightened the supply for lead. Thus, given the current and expected lead fundamentals, we expect
to see a stronger lead price environment in 2017 and thereafter (see Appendix B5 for the full
lead prices forecast).
Copper
Copper prices are generally driven by physical supply and demand (Appendix B3), however the
recent rally on copper from USD 2.1/lb on October 24, 2016 to USD 2.6/lb on January 20, 2017
is thought to be mainly a speculative game of investors anticipating a stronger China demand
in 2017, but fundamentals stay intact for now. We expect investor’s speculation to keep driving
copper prices in the short to medium-term, but prices should correct after the actual data on
copper supply and demand is released by China in the second half of 2017ix. (see Appendix B3
for the full copper prices forecast).
Precious Metals Industry, High Barriers to Entry
The precious metals industry is characterized by important entry barriers for new players:
mining concessions, limited mineral resource base and capital intensity (full Porter’s 5 forces
analysis in Appendix B7). Capital intensity is associated with mining equipment needs,
specialized work force, energy costs, water supply and transportation needs, as well as
development of environmental protection programs. These high entry barriers make it difficult
for new entrants to come into the precious metals and base metals industry, so current
competitors can expect to see their market share untouched by new players.
Competitive positioning Industrias Peñoles focus on exploration drives a solid reserve replacement
history: Peñoles has a solid history of constant reserve replenishment, as an example
of this; its flagship Fresnillo mine has been in operations for about 500 years
(operational since 1554) (Appendix B8). The key strategy supporting this success
history is the company’s vigorous focus on exploration across economic cycles.
Peñoles also has one of the largest areas of exploration concession in Mexico, with
over 3.4 million hectares, and concessions in South America as well, primarily in Peru
and Chile where it holds numerous mining projects with excellent prospects.
Fresnillo PLC, 75% owned by Industrias Peñoles: Fresnillo comprises the precious
metal segment of Peñoles, which accounted for 69% of Peñoles sales in 2015. Fresnillo
is characterized by (1) a strong focus on operational excellence, (2) quality volume
growth, and (3) the market’s favorite play on silver stocks, enjoying from a continued
premium to precious metals peers on earnings multiples.
Organic growth track record: Peñoles has a strong history of growth through an
organic route (Appendix B8). Recent project deliveries include Saucito, Noche Buena
and Velardeña. Saucito is a silver-gold mine, and it is among the richest silver mines
in the world, with silver reserves of 130.7 MOz and gold reserves of 730.0 KOz. Noche
Buena mine has gold reserves of 1.01 MOz, and Velardeña mine has silver reserves of
about 25.6 MOz. Additionally, the company is expected to continue with this narrative
with future growth projects.
Base metals and metallurgical assets complement each other: Peñoles'
metallurgical operations are complementary to its mining operations as together they
allow the company to capture a broader spectrum of value and reduce operational costs,
compared to most of its peers with only mining assets.
Financial Snapshot of Peñoles’ peer group
Industrias Peñoles is the largest silver producer in the world and one of the largest
gold producers within the primarily-silver producer: We established a strict peer
selection criteria to build the peer group for Peñoles (Appendix A6). Peñoles is the
largest silver producer in the world, and the largest silver producer within its peer group
with 54.5 million ounces produced in 2015, while the second largest silver producer
within its peer group is Goldcorp (Goldcorp ticker: “G”) with 40.6 million ounces
Figure 13: Gold and Silver Spot Price
Since U.S. Presidential Election
Source: Thomson Reuters
Figure 14: Silver Futures and Options
Net Position of Managed Money vs
Silver spot price
Note: Monthly bars from December 2015 to December
2016
Source: Thomson Reuters
Figure 15: Zinc prices vs world zinc
surplus/ deficit balance
Source: Thomson Reuters
Figure 16: Peer silver production
Source: Bloomberg
15
15.5
16
16.5
17
17.5
18
18.5
19
1125
1175
1225
1275
1325
11
/8/2
01
6
11
/15
/20
16
11
/22
/20
16
11
/29
/20
16
12
/6/2
01
6
12
/13
/20
16
12
/20
/20
16
12
/27
/20
16
1/3
/20
17
1/1
0/2
01
7
1/1
7/2
01
7
US
$/O
z
Gold (US$/Oz) Silver (US$/Oz)
November 8, 2016: U.S. election day
December 14, 2016: Fed's meeting minutes release
12
13
14
15
16
17
18
19
20
21
0
20,000
40,000
60,000
80,000
100,000
120,000
Silver Futures & Contracts
Silver Spot Price
1900
1950
2000
2050
2100
2150
2200
2250
2300
2350
2400
0
50
100
150
200
250
2014 2015 2016 2017
Pri
ce
$/t
on
ne
Ma
rke
t b
ala
nce
(0
00
to
nn
es)
0
10
20
30
40
50
60
Millio
ns o
f o
un
ce
s
Con
tra
cts
US
$/O
z
4

produced in the same period. Furthermore, Peñoles is the second largest gold producer
within its peer group just below Goldcorp.
One of the lowest cash costs in the industry: The cost structure of Fresnillo mine is
among the most competitive within the industry (Appendix B8). Having access to
world-class assets is one of the primary reasons for the company’s low cash cost
structure. The company’s Fresnillo mine is the richest primary silver mine in the world,
while the Saucito mine which started operations in 2011, has high-quality silver
reserves as well. Other than this, operating at 100% capacity and optimizing the mining
methods to maintain high recovery rates are key factors in achieving a lean cost
structure.
Investment Summary We issue a Buy recommendation on Industrias Peñoles with a 12-month target price of MXN
$566.0/share (see Figure 30 for the valuation summary) with a projected total return (including
dividends) of 17.90% from its January 20, 2017 closing price of MXN $488.24. We derived our
target price using a tailored valuation approach consisting in two methodologies: Discounted
Cash Flow to the Firm, and Trading Multiples.
Investment Drivers
Gold and Silver Prices to Improve Marginally in 2017 and Continue that Trend from 2018
Gold and silver prices movements are the two most important factors that make Peñoles’ stock
price move (gold being the most important of the two), hence it is crucial to have a clear outlook
on these precious metals prices (Figure 17). Gold and silver prices rallied temporarily on Donald
Trump’s election victory. However, investors sentiment made a dramatic U-turn after the
election date. The sharp rise in the US treasury yields combined with the rally in the US equity
markets in an environment of positive investor sentiment on the US economy, triggered a
substantial rally in the USD, causing a crash in the gold and silver prices (Figure 18 and 13).
However, the gold and silver bearish trend ended on December 14, 2016, just after the Federal
Reserve published their December meeting minutes (Appendix B10). The Fed’s December
meeting minutes showed uncertainty over how President-elect (now president) Trump’s policies
would impact the pace of interest-rate increasesx. The Fed’s officials reiterated that a “gradual”
pace of rate hikes over 2017 and the coming years would likely remain appropriate, generating
speculation that officials will step in to counter inflation with higher borrowing costs. This has
caused major inflation fear in the market, triggering a gold rally that has pumped the gold spot
price more than 8% since the Fed’s minutes were released, silver has rallied similarly. We
expect the current market narrative of uncertainty to remain in 2017, this should support a
continuation in the gold and silver rally for 2017. We forecast 2017 gold and silver prices to be
at $1,217.5/oz and $17.2/oz, respectively. Moreover, we expect a continuation of the 2017 gold
and silver trend from 2018 onwards. In 2018, we expect the US growth/inflation mix to
deteriorate (given the inability of the Trump’s administration to further boost economic growth),
meaning that US growth will slow down while inflation will remain relatively high.
Furthermore, we expect US dollar to peak in 2017 and then to weaken marginally in 2018, and
we also expect the US 10-year yield to peak in 2017 and then get lower in 2018. Altogether this
should give an incentive for investors to further position in gold and silver. This, together with
higher jewelry demand from China given the low gold and silver prices in 2017 relative to 2016,
should support a gold and silver price recovery (Figure 19).
Low Gold and Silver Prices Outlook to Boost Physical Demand
In the recent past, Peñoles’ refined gold and silver production has changed in congruence with
the world’s gold and silver physical demand year over year changes (Figure 20). With the
forecasted low gold and silver prices in 2017 (relative to 2016 prices), we expect physical
demand for these metals to increase. This demand increase should make Peñoles’ refined
production to increase as well, and this would absorb some of the negative effects that the low
gold and silver prices (low relative to 2016 prices) could have on the company’s revenues in
2017.
Base Metals Segment to Benefit from Higher Zinc Prices and Lower Costs
Base metals segment EBITDA jumped 41% QoQ in 3Q 2016. This performance was supported
by higher zinc prices and mining cost reductions, as well as a recover in zinc and lead QoQ
production. Given the current macroeconomic fundamentals, we expect zinc prices to keep
rising, which should support a continuation in the improvement on base metals EBITDA
margin.
Future Mining Projects Should Fuel Organic Growth in the Coming Years
Looking ahead, Peñoles has an attractive pipeline of projects that should allow an estimated
annual growth of 12% in silver production by 2018 (Appendix B8). Most of the growth projects
are focused on the precious metals business. Some of the near-term precious metals projects
Figure 17: Industrias Peñoles Price vs.
Gold Spot Price
Source: Thomson Reuters
Figure 18: USD Index and S&P500
Behavior Since Trump Election Day
Source: Thomson Reuters
Figure 19: Gold and Silver Prices
Forecast
Note: Gold and Silver prices are calculated using a multi-factor econometric model developed by the Team (see
Appendix C2 for more details on the Team’s model).
Source: Team Estimates
Figure 20: Peñoles refined gold
Production vs Gold Physical World
Demand
Source: Company Filings, CME Group.
150
250
350
450
550
650
750
1/2
7/2
01
2
5/2
7/2
01
2
9/2
7/2
01
2
1/2
7/2
01
3
5/2
7/2
01
3
9/2
7/2
01
3
1/2
7/2
01
4
5/2
7/2
01
4
9/2
7/2
01
4
1/2
7/2
01
5
5/2
7/2
01
5
9/2
7/2
01
5
1/2
7/2
01
6
5/2
7/2
01
6
9/2
7/2
01
6
950
1050
1150
1250
1350
1450
1550
1650
1750
US
D/O
z
Gold (USD/Oz) PE&OLES (MXN$)
2125
2145
2165
2185
2205
2225
2245
2265
2285
97.5
98.5
99.5
100.5
101.5
102.5
103.5
104.5
11
/14
/20
16
11
/21
/20
16
11
/28
/20
16
12
/5/2
01
6
12
/12
/20
16
12
/19
/20
16
12
/26
/20
16
1/2
/20
17
1/9
/20
17
1/1
6/2
01
7
.DX
Y (
Pts
.)
USD Index (.DXY)S&P500 Index (.SPX)
16
17
18
19
20
21
22
23
1,000.00
1,100.00
1,200.00
1,300.00
1,400.00
1,500.00
1,600.00
1,700.00
20
17
E
20
18
E
20
19
E
20
20
E
20
21
E
20
22
E
20
23
E
20
24
E
20
25
E
US
$/O
z
Gold (US$/Oz) Silver (US$/Oz)
300
500
700
900
1100
1300
1500
1700
1900
700
750
800
850
900
950
1000
20
06
20
07
20
08
20
09
20
10
20
11
20
12
20
13
20
14
20
15
Th
ou
sa
nd
s o
f O
un
ce
s
Millio
ns o
f O
un
ce
s
Gold fabrication demand (Millions of ounces)
Peñoles gold production (kOz)
MX
N$
.SP
X (
Pts
.)
5

include: Juanicipio (with 10 MOz Silver, and 30 KOz Gold expected production, expected to
begin operation in 2018), Centauro Deep (225 KOz Gold, 2020) and Orisyvo (136 KOz Gold,
2021). Moreover, Peñoles is also planning growth projects in the base metals business, the near-
term projects include: Racaycocha (potential open pit copper-molybdenum, 2022), and Humos
(copper, 2022).
Focus on Exploration Drives a Solid Reserve Replacement Ability
Peñoles has a remarkable history of constant reserve replenishment, reflecting an important
ability of replenishing their metal and mineral reserves in a cost-efficient way (Appendix B8).
Peñoles also has one of the largest areas of exploration concession in Mexico, with over 3.4
million hectares, and concessions in South America as well, primarily in Peru and Chile where
it holds numerous mining projects with excellent prospects. Thus, we expect this successful
reserve replenishment ability to persist in the coming years and the long run (Figure 22).
Strong USD is Positive for Industrias Peñoles
Almost 100% of Peñoles’ revenues are denominated in USD, while only ~50% of the costs are
based in MXN (Appendix A1), furthermore Peñoles reports its revenues in MXN. Hence, a
strong USD and a weak MXN is positive for Industrias Peñoles (especially positive for Peñoles’
EBITDA margins), which is the case we are forecasting for the following years (Figure 21).
With the recent macroeconomic events, such as the Trump victory as president of the United
States, and some automakers (Fordxi, Fiat-Chryslerxii and General Motorsxiii specifically)
canceling or postponing their plans to invest in Mexico as they rather prefer to invest in the US
(this because Trump has promised a low tax reform and threatened automakers to create new
tariffs on imports from Mexico to the US), the MXN has weakened to the USD significantly,
and it is expected to stay weak in the following years (yet marginally stronger than the current
rate). In the other hand, the USD has been strengthening to all other currencies in the world
(Figure 18), this is happening because investors are expecting an overall stronger US economy
with the Trump administration, despite the recent concerns risen by the Fed.
Valuation Methodology We derived our target price using a tailored valuation approach, employing Discounted Cash
Flow and Multiples Valuation methodologies. We assigned a greater weight to the DCF
methodology since we think it more accurately reflects our precious metals prices forecast
(Figure 19), and as mentioned above (Figure 17), the gold and silver prices movement is the
number one factor that makes Peñoles’ stock price and revenues move. The peer group used in
the Multiples Valuation was chosen in a rigorous manner, and we believe that comparison to
selected companies is fully justified.
Investment Risks Quantitative, qualitative and other risks were assessed for impact and likelihood, ranked in a
risk matrix (Figure 42), and subsequently modelled through a Monte Carlo simulation (Figure
3). The simulation results show: 58.3% of the simulations support a buy recommendation,
39.1% support a hold recommendation, and 2.6% support a sell recommendation
Valuation Two valuation methodologies were used in deriving a price target to Industrias Peñoles,
including a five-year DCF and a Relative Multiples Valuation. We believe that the utilization
of these two approaches is most appropriate given the different characteristics of (1) the precious
metals industry dynamics and its high correlation with precious metal price fluctuations, and
(2) the specific characteristics of Industrias Peñoles, including its refined production structure
(In the recent past Peñoles produced ~50% of its refined gold and silver from own mined
resources, and the other ~ 50% from third party mines, see Appendix B8), and its stock price
behavior relative to peers’ stock prices in the past.
DCF Model We used a discounted cash flow analysis to estimate the intrinsic value of Industrias Peñoles
share price because of the inherently reliable relationships of earnings and cash flows with
respect to changes in gold and silver market prices. The model is forecasted five years, mainly
due to the degree of error and uncertainty in forecasting gold and silver prices for the long term.
The cash flows in this model are calculated using Free Cash to the Firm (FCFF) because of the
current capital structure of Industrias Peñoles (Figure 23). FCFF is calculated as Net Operating
Profit Less Adjusted Taxes (NOPLAT), plus Depreciation, minus Capex, minus Change in
Working Capital, and it measures the cash flow available for all the claimholders of the firm
(debt and equity claimholders) (see Figure 24 for FCFF forecast).
The base case for this model was calculated using guidance from the company’s historical
financial performance, the industry and precious metals prices outlook, an assessment of
Figure 21: USD/MXN Forecast
Source: Bloomberg, Team Estimates
Figure 22: Industrias Peñoles’ Reserve
Replenishment Ability
Source: Company Filings, Team Estimates
Figure 23: Industrias Peñoles’ Capital
Structure
Capital Structure as for 2016 Q3 (Millions of $MXN)
Value % Market Cap 177,896.60 84.83% Short Term Debt 3,558.80 1.70% Long Term Debt 28,256.50 13.47%
Total 209,711.90 100.00%
Source: Bloomberg
Figure 24: Industrias Peñoles’ Free
Cash Flow to the Firm Forecast
Source: Team Estimates
Figure 25: DCF Valuation Summary
DCF Valuation Key Elements ($MXN
millions) (+) Sum of PV of FCF 83,986.5 (+) Present Value of Perpetuity
183,871.6
(=) Present Value of FCFF (EV)
267,858.1
(-) Interest Bearing Debt 32,085.3
(=) Peñoles Equity Value 235,772.8 # Shares Outstanding (millions)
397
Peñoles Target Price Per Share ($MXN)
593.9
Source: Team Estimates
10
12
14
16
18
20
22
242
014
20
15
20
16
20
17
E
20
18
E
20
19
E
20
20
E
20
21
E
US
D/M
XN
0
2
4
6
8
10
12
14
16
20
05
20
06
20
07
20
08
20
09
20
10
20
11
20
12
20
13
20
14
20
15
20
16
E
20
17
E
20
18
E
20
19
E
20
20
E
avera
ge r
eserv
es (
years
)
13,523.10
7,020.07
21,556.56
26,166.97
16,658.50
21,856.73
20
16
E
20
17
E
20
18
E
20
19
E
20
20
E
20
21
E
$M
XN
mill
ions
6

Industrias Peñoles competitive positioning, and company guidance on revenues and earnings
growth. The accuracy of the implied enterprise value for Industrias Peñoles is dependent on the
following model inputs:
Weighted Average Cost of Capital (“WACC”)
The cost of equity was calculated using the CAPM model (Figure 26). We used the 10-Year US
Treasury Bond Yield as the risk-free rate, a levered beta regressed against the MEXBOL Index
for 5 years, a mature market equity risk premium and a country risk premium to arrive to an
appropriate cost of equity. To correctly calculate the equity risk premium, we utilized an
historical implied equity risk premium for a mature market (obtained by looking at the implied
premium for the S&P500, based on A. Damodaran’s1 estimationsxiv). To estimate the country
risk premium, we used a country credit default spread for Mexico based on a Moody’s rating
(obtained by estimating the default spread for the Moody’s rating over a default free government
bond rate, based on A. Damodaran’s estimationsxv). We believe that the methodology of using
the S&P500 equity risk premium and adding a country risk premium is the best way to calculate
the cost of equity, since a mature market is more helpful to accurately estimate the equity market
risk. The cost of debt was calculated using the total pre-tax cost of debt (obtained by estimating
the weighted average of the short-term debt note rates and the long-term bond rates), and then
estimating the before-tax cost of debt (Figure 26).
Revenue Growth
Revenue growth for Industrias Peñoles is based primarily on (1) higher gold and silver market
spot prices, (2) new investments in successful exploration projects that should expand total
reserves and increase mine metal production, and (3) new investments in plant, property and
equipment to increase the total refined metal production output. However, most of the growth
in Peñoles’ revenues expected in 2017 (Industrias Peñoles revenues are reported in Mexican
Pesos) will come from a higher value of the USD to the MXN. Since we expect gold and silver
prices to stay low (relative to 2016 prices) at about $1,217.5 USD/Oz and $17.2 USD/Oz
respectively in 2017, the revenue growth for this year will come mainly from a high USD/MXN
rate and a refined metal production output increase. This production increase should be the result
of a higher gold and silver demand (resulting from the relatively low prices). Nonetheless, we
expect gold and silver prices to continue emerging in 2018 and onwards, which along with an
increasing mine production output coming from new mining projects should boost Peñoles’
revenue growth (Figure28).
Terminal Growth
The terminal growth rate is based on (1) the global economic conditions which affect the prices
of the precious and base metals that Peñoles sells (Appendix B10), (2) the company’s
exploration expenses and ability to replenish reserves, and (3) Peñoles’ competitive production
costs against other miners around the world (Appendix B8). Taking into consideration the
aforementioned factors, we determined the terminal growth rate of FCFF at 2.0%, which is
aligned with the long-term growth in GDP.
Capital Expenditures (“Capex”)
Due to new growth projects in Juanicipio (10 MOz Silver, and 30 KOz Gold, E2018), Centauro
Deep (225 KOz Gold, E2020), Orisyvo (136 KOz Gold, E2021), Racaycocha (Copper-
molybdenum, E2022), and Humos (Copper 2022), future capital expenditures are expected to
be significant. Per our estimates, the mentioned growth projects will lead to a Capex CAGR of
~4% from 2017 to 2022 (Appendix A3).
Relative Valuation Having previously chosen the appropriate peer group (see the peer group criteria in Appendix
A6), we conducted multiplier pricing using P/E, EV/EBITDA, and EV/Reserves as benchmark
ratios, the three of them based on two-year forward medians. There was a long-term discount
observed on Industrias Peñoles market price regarding EV/EBITDA multiple relative to its peer
group in the past, meanwhile there was a long-term term premium observed regarding P/E and
EV/Reserves multiples. This means that Industrias Peñoles usually trades at a discount to its
peers in EV/EBITDA multiple, and at a premium to its peers in P/E and EV/Reserves multiples.
Thus, we applied the appropriate discount/premium to each multiple to estimate Peñoles’ price
more accurately. The factors supporting the historical discount in EV/EBITDA multiple
include:
Country risk: most of Peñoles’ mines and offices are in Mexico (Appendix B8), which
is an emerging market with presence of drug cartels. Drug cartels affect the miners’
operations from time to time, though not directly robbing the miners, drug cartels are
1 Aswath Damodaran is a Professor of Finance at the Stern School of Business at New York University, he is best
known as the author of several widely used academic and practitioner books on Valuation.
Figure 26: WACC Analysis
WACC 9.16% Cost of Equity: 10.05%
Beta 1.05 Risk Free Rate 2.34% Country Risk 1.71% Equity Risk Premium 5.69% Cost of Debt: 4.92%
Before Tax Cost of Debt 7.57% Marginal Tax Rate 35.00% % Equity 84.70% % Debt 13.30%
Source: Bloomberg, Team Estimates
Figure 27: Industrias Peñoles’ Capex
Forecast
Source: Team Estimates
Figure 28: Industrias Peñoles’
Revenues Forecast
Source: Team Estimates
Figure 29: Relative Valuation
Summary
Multiple $MXN Weight
Price from P/E 436.8 33.3% Price from EV/ EBITDA 461.5 33.3% Price from EV/ Reserves 670.0 33.3%
Total average price 522.8
Source: Team Estimates
Figure 30: Valuation Summary
Valuation Method ($MXN)
Price from Relative Valuation 524.18 Weight of Relative Valuation 40% Price from Intrinsic Valuation (DCF)
593.89
Weight of Intrinsic Valuation (DCF) 60%
12-Month Target Price 566.0 Price Per Share (January 20, 2017) 488.24
Upside Potential 15.93%
Source: Team Estimates
13,787.76
17,579.39
14,063.52
10,899.22
13,624.03
16,348.84
20
16
E
20
17
E
20
18
E
20
19
E
20
20
E
20
21
E
$M
XN
mill
ions
78,589.9
96,238.3 101,906.3
112,001.6
124,796.9 131,582.9
20
16
E
20
17
E
20
18
E
20
19
E
20
20
E
20
21
E
$M
XN
mill
ions
7

a logistic obstacle for miners in Mexicoxvi. Furthermore, the Mexican Stock Exchange
(MSE) has a significant liquidity shortage in comparison to NYSE and LSE, where the
rest of the peer group trades, therefore MSE has lower trading multiples.
Few shareholders risk: only two shareholders have about 70% of all Industrias
Peñoles’ shares, this is could potentially be risky because few shareholders controlling
the company gives room for manipulation activities (though this is improbable).
Conversely, the factors supporting the historical premium of Industrias Peñoles relative to its
peer group in P/E and EV/Reserves multiples include:
Reserve replenishment history: Industrias Peñoles has a proven track record
replenishing its reserves in a cost-efficient fashion, and this should continue on ahead.
Metallurgical segment: about 50% of Peñoles refined gold and silver production
comes from third party mines, and the other 50% comes from Peñoles’ mines, whereas
many peer group members are more dependent on their property mines production.
We treat P/E, EV/EBITDA and EV/Resources multiples equally in our relative valuation, as we
believe there is no evidence of predominance of one over the other. The results obtained from
the relative valuation suggest a price of MXN $524.18 per share, and together with the DCF
price of MXN $593.89 per share, the valuation suggests a total price of MXN $566.0 per share,
this using a 60% (DCF) - 40% (Relative Valuation) weight procedure (Figure 30).
Financial Analysis
Selected Key Financials (in millions of MXN, except %) 2011 2012 2013 2014 2015 LTM Sep-
30-2016 Total Revenue 96,864.1 97,199.4 66,550.9 61,555.6 64,896.5 76,214.5
Growth Over Prior Year 48.9% 0.3% (31.5%) (7.5%) 5.4% 18.0% Gross Profit 33,459.9 28,654.5 18,464.0 16,071.8 13,360.5 21,532.0 Margin % 34.5% 29.5% 27.7% 26.1% 20.6% 28.3% EBITDA 31,610.2 25,896.2 15,869.2 13,619.3 13,356.1 22,610.6 Margin % 32.6% 26.6% 23.8% 22.1% 20.6% 29.7% EBT 26,657.8 20,111.0 9,330.8 4,779.8 3,571.4 9,096.8 Depreciation and Amortization
4,172.7 5,573.0 6,269.2 6,740.5 8,595.1 9,697.0
Change in Net Working Capital
6,980.1 2,299.0 (1,281.9) 601.5 2,830.1 2,826.6
Capital Expenditures (9,614.8) (11,406.5) (10,905.4) (9,084.9) (11,489.8) (11,697.3) Capital Expenditures as % of Sales
9.93% 11.74% 16.39% 14.76% 17.70% 15.35%
Unlevered Free Cash Flow
4,695.0 4,550.3 2,611.6 1,347.8 (2,752.7) 3,244.1
Ex-Fresnillo Results Continue to Improve on Better Base Metal Segment
After seeing an inflection point in 1Q-2016, ex-Fresnillo (“Excluding Fresnillo”, Fresnillo
accounts for the precious metals segment of Peñoles) EBITDA has continued to rise quarter
over quarter, with a 18% QoQ jump in 3Q 2016 (Figure 35). Furthermore, base metals segment
EBITDA jumped 41% QoQ. This performance was supported by improved zinc prices and
mining cost reductions, as well as a recovery in zinc, silver and lead QoQ production. Finally,
these jumps in earnings were also supported by a decline in expenses. Expenses were 6% lower
QoQ driven mainly by lower exploration expensesxvii (Figure 35).
Healthy Balance Sheet with Current Debt Obligations Ending in the Coming Years
Industrias Peñoles has maintained a very conservative capital structure of low Net Debt to
EBITDA (low relative its peer group) over the past 5 years (Figure 32). Additionally, the
company has a history of paying all its debts in a timely manner. In 2015, US$130 million of
structured notes issued in 2010 in the Mexican financial market matured and were timely paid
to bondholders. With the current debt maturity profile, all bonds are set to be amortized when
they reach maturity in the following years: US$ 400 million in 2020, US$ 200 million in 2022
and US$ 800 million in 2023 (Appendix A7).
Revenues and EBITDA Reversal
Industrias Peñoles has been underperforming since its 2012 all-time high; nonetheless, EBITDA
margin is expected to recover towards 2012 margins in 2017, driven mainly by an increase in
gold production and by a weakened Mexican peso. The USD/MXN rate jumped 24.9% from
2014 to 2016 and we expect it to stay high for the following years (Figure 21). Thus, we are
forecasting a solid growth in revenues and EBITDA for the following years driven mainly by
(1) a high USD/MXN rate, (2) stronger precious metals (gold and silver) prices, (3) stronger
organic growth with CAGR of 10% and CAGR of 7% in silver and gold equivalent production
respectively by 2019, and (4) lower costs in the base metals segment (Appendix A1).
Figure 31: Industrias Peñoles sales,
EBITDA & EBIT Growth
Sources: S&P Capital IQ & Team Estimates
Figure 32: Industrias Peñoles Debt and
Leverage
Sources: S&P Capital IQ & Team Estimates
Figure 33: Peñoles’ EPS & DPS
Sources: S&P Capital IQ & Team Estimates
Figure 34: DuPont Analysis
Source: Thomson Reuters
Figure 35: Ex-Fresnillo EBITDA
Recovery
Source: Company Filings
0
20,000.0
40,000.0
60,000.0
80,000.0
100,000.0
120,000.0
140,000.0
160,000.0
201
2
201
3
201
4
201
5
201
6E
201
7E
201
8E
201
9E
202
0E
202
1E
Thousands o
f M
XN
Sales Operating income (EBITDA) Operating profit (EBIT)
-40.0%
-20.0%
0.0%
20.0%
40.0%
60.0%
80.0%
100.0%
120.0%
-10000.00
0.00
10000.00
20000.00
30000.00
40000.00
50000.00
201
1
201
2
201
3
201
4
201
5
201
6E
201
7E
201
8E
201
9E
202
0E
202
1E
Thousands o
f M
XN
Net Debt Operating income (EBITDA)
Capital Expenditure Leverage (Liabilities / EBITDA)
(5.0)
0
5.0
10.0
15.0
20.0
25.0
30.0
35.0
201
1
201
2
201
3
201
4
201
5
201
6E
201
7E
201
8E
201
9E
MX
N
EPS Dividends per Share
Industry
Median 2015 2014 2013 2012 2011
Profitability
Gross Margin 22.8% 20.0% 25.6% 27.2% 29.2% 34.3%
EBITDA Margin 14.1% 21.5% 23.2% 25.3% 26.5% 32.7%
Operating Margin 6.7% 6.1% 10.6% 14.3% 20.7% 28.3%
Pretax Margin 1.9% 5.5% 7.8% 14.0% 20.7% 27.5%
Effective Tax Rate 24.2% 113.9% 64.2% 36.3% 29.7% 33.4%
Net Margin 1.0% (0.8%) 2.8% 8.9% 14.5% 18.3%
DuPont/Earning
Power
Asset Turnover 0.55 0.62 0.64 0.76 1.20 1.37
x Pretax Margin 1.9% 5.5% 7.8% 14.0% 20.7% 27.5%
Pretax ROA 1.2% 3.4% 5.0% 10.7% 24.9% 37.8%
x Leverage
(Assets/Equity) 2.39 2.12 2.12 2.21 1.95 1.95
Pretax ROE 3.1% 7.2% 10.8% 22.3% 48.5% 76.3%
x Tax Complement 0.75 (0.24) 0.25 0.51 0.50 0.48
ROE 0.9% (1.8%) 2.7% 11.4% 24.2% 36.5%
0
100
200
300
400
500
600
1Q
15
2Q
15
3Q
15
4Q
15
1Q
16
2Q
16
3Q
16
LT
M E
BIT
DA
for
ex-
Fre
snill
o (
US
$ m
illio
n)
8
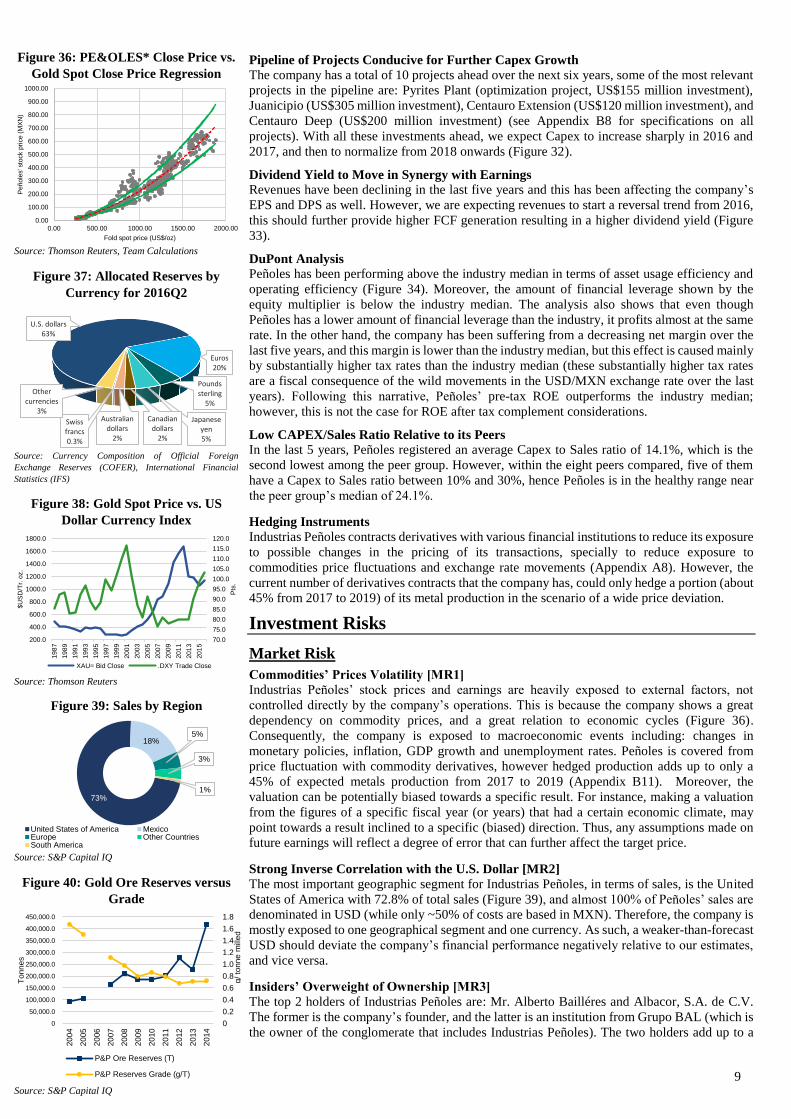
Pipeline of Projects Conducive for Further Capex Growth
The company has a total of 10 projects ahead over the next six years, some of the most relevant
projects in the pipeline are: Pyrites Plant (optimization project, US$155 million investment),
Juanicipio (US$305 million investment), Centauro Extension (US$120 million investment), and
Centauro Deep (US$200 million investment) (see Appendix B8 for specifications on all
projects). With all these investments ahead, we expect Capex to increase sharply in 2016 and
2017, and then to normalize from 2018 onwards (Figure 32). Dividend Yield to Move in Synergy with Earnings
Revenues have been declining in the last five years and this has been affecting the company’s
EPS and DPS as well. However, we are expecting revenues to start a reversal trend from 2016,
this should further provide higher FCF generation resulting in a higher dividend yield (Figure
33). DuPont Analysis
Peñoles has been performing above the industry median in terms of asset usage efficiency and
operating efficiency (Figure 34). Moreover, the amount of financial leverage shown by the
equity multiplier is below the industry median. The analysis also shows that even though
Peñoles has a lower amount of financial leverage than the industry, it profits almost at the same
rate. In the other hand, the company has been suffering from a decreasing net margin over the
last five years, and this margin is lower than the industry median, but this effect is caused mainly
by substantially higher tax rates than the industry median (these substantially higher tax rates
are a fiscal consequence of the wild movements in the USD/MXN exchange rate over the last
years). Following this narrative, Peñoles’ pre-tax ROE outperforms the industry median;
however, this is not the case for ROE after tax complement considerations. Low CAPEX/Sales Ratio Relative to its Peers
In the last 5 years, Peñoles registered an average Capex to Sales ratio of 14.1%, which is the
second lowest among the peer group. However, within the eight peers compared, five of them
have a Capex to Sales ratio between 10% and 30%, hence Peñoles is in the healthy range near
the peer group’s median of 24.1%.
Hedging Instruments
Industrias Peñoles contracts derivatives with various financial institutions to reduce its exposure
to possible changes in the pricing of its transactions, specially to reduce exposure to
commodities price fluctuations and exchange rate movements (Appendix A8). However, the
current number of derivatives contracts that the company has, could only hedge a portion (about
45% from 2017 to 2019) of its metal production in the scenario of a wide price deviation.
Investment Risks Market Risk
Commodities’ Prices Volatility [MR1]
Industrias Peñoles’ stock prices and earnings are heavily exposed to external factors, not
controlled directly by the company’s operations. This is because the company shows a great
dependency on commodity prices, and a great relation to economic cycles (Figure 36).
Consequently, the company is exposed to macroeconomic events including: changes in
monetary policies, inflation, GDP growth and unemployment rates. Peñoles is covered from
price fluctuation with commodity derivatives, however hedged production adds up to only a
45% of expected metals production from 2017 to 2019 (Appendix B11). Moreover, the
valuation can be potentially biased towards a specific result. For instance, making a valuation
from the figures of a specific fiscal year (or years) that had a certain economic climate, may
point towards a result inclined to a specific (biased) direction. Thus, any assumptions made on
future earnings will reflect a degree of error that can further affect the target price.
Strong Inverse Correlation with the U.S. Dollar [MR2]
The most important geographic segment for Industrias Peñoles, in terms of sales, is the United
States of America with 72.8% of total sales (Figure 39), and almost 100% of Peñoles’ sales are
denominated in USD (while only ~50% of costs are based in MXN). Therefore, the company is
mostly exposed to one geographical segment and one currency. As such, a weaker-than-forecast
USD should deviate the company’s financial performance negatively relative to our estimates,
and vice versa.
Insiders’ Overweight of Ownership [MR3] The top 2 holders of Industrias Peñoles are: Mr. Alberto Bailléres and Albacor, S.A. de C.V.
The former is the company’s founder, and the latter is an institution from Grupo BAL (which is
the owner of the conglomerate that includes Industrias Peñoles). The two holders add up to a
Figure 36: PE&OLES* Close Price vs.
Gold Spot Close Price Regression
Source: Thomson Reuters, Team Calculations
Figure 37: Allocated Reserves by
Currency for 2016Q2
Source: Currency Composition of Official Foreign
Exchange Reserves (COFER), International Financial
Statistics (IFS)
Figure 38: Gold Spot Price vs. US
Dollar Currency Index
Source: Thomson Reuters
Figure 39: Sales by Region
Source: S&P Capital IQ
Figure 40: Gold Ore Reserves versus
Grade
Source: S&P Capital IQ
0.00
100.00
200.00
300.00
400.00
500.00
600.00
700.00
800.00
900.00
1000.00
0.00 500.00 1000.00 1500.00 2000.00
Peñole
s' sto
ck p
rice (
MX
N)
Fold spot price (US$/oz)
U.S. dollars63%
Euros20%
Pounds sterling
5%
Japanese yen5%
Canadian dollars
2%
Australian dollars
2%
Swiss francs0.3%
Other currencies
3%
70.0
75.0
80.0
85.0
90.0
95.0
100.0
105.0
110.0
115.0
120.0
200.0
400.0
600.0
800.0
1000.0
1200.0
1400.0
1600.0
1800.0
198
7
198
9
199
1
199
3
199
5
199
7
199
9
200
1
200
3
200
5
200
7
200
9
201
1
201
3
201
5
Pts
.
$U
SD
/Tr.
oz.
XAU= Bid Close .DXY Trade Close
73%
18%5%
3%
1%
United States of America MexicoEurope Other CountriesSouth America
0
0.2
0.4
0.6
0.8
1.0
1.2
1.4
1.6
1.8
0
50,000.0
100,000.0
150,000.0
200,000.0
250,000.0
300,000.0
350,000.0
400,000.0
450,000.0
20
04
20
05
20
06
20
07
20
08
20
09
20
10
20
11
20
12
20
13
20
14
To
nn
es
P&P Ore Reserves (T)
P&P Reserves Grade (g/T)
g/
ton
ne
mill
ed
9

68.82% of ownership of all outstanding shares (Appendix B9). On the one hand, this situation
should be positive because holders are interested in making the business more profitable. But
on the other hand, this situation could lead to negative results such as filings manipulations that
could affect investor’s confidence and ultimately the company’s stock price (though this has
never happened before and is improbable to happen).
Operational Risk
Assumptions on Ore’s Grade, Size of Deposits, and Costs of Extraction and Exploration
[OR1]
These three factors directly affect the overall operational costs. A low ore grade, a small deposit
and increased costs will eventually lead to a higher cost per ounce (or ton) of material produced.
Costs of extraction and exploration are the only ones that can be tracked and managed, but to a
certain degree. As an example of this, the company shows an increase in reserve holdings but a
decrease in their grades, resulting in a softened increase in net gold reserves (Figure 40). On the
other hand, even when an exploration operation is conducted on an ore deposit, the size and
grade of the deposit are not certain. This can result in write-down charges as further operations
may not be economically viable.
Geological Disasters: Floods [OR2]
When performing excavation activities there is a degree of uncertainty about the existence of a
body of water coming from a geohydrological structure in the mine, and if the body of water is
drilled this could cause partial or total floods. Such an event has already happened to Industrias
Peñoles at its Naica mine in Chihuahuaxviii. When such an event happens, mines can lose their
value partially or totally. Moreover, sold-in-advance production and derivatives must be
refunded in cash as the commodity cannot be delivered.
Country Risk
Yielding Regulatory Governance [CR1]
In 2009, Soledad-Dipolos mine was suspended due to lawsuits carried out by communal
landowners (ejidatarios). Even though, the mining activities were conducted in accordance to
the governmental concessions and environmental permits legally granted at the time, the
Agrarian Court (which was the one conducting this case) ordered to vacate 1,824 hectares of
land arguing environmental rehabilitation measures.
Corporate governance
Board of Directors
The Board Chairman is elected by the members of the board, and he/she must not hold an
executive position within the company. Moreover, the elected Chairman must not be part of the
Board. The composition of the Board has been structured to ensure that no one individual can
dominate the decision-making processes of the Board. The current Chairman Alberto Bailléres,
holds interests of more than 50% of the share capital of the Company. From all the members of
the Board, 14 are Proprietary Board Members, and 13 are alternates.
In 2011, Peñoles implemented the new “Code of Conduct, Living our Values”, which governs
the behavior expected of all employees who work in the Company within a framework of ethics
aligned with the Institutional Values, thus reinforcing the transparency and accountability of the
stakeholders. Furthermore, Peñoles also counts with an Internal Audit Division that works in
coordination with External Auditors to review policies and internal control systems in
accordance to the Corporate Governance Code. We believe these practices are positive for the
company’s earnings prospects, since they enhance worker’s productivity and efficiency.
Corporate Governance Focus & Results
Industrias Peñoles was chosen to be part of the Sustainable Index of the Mexican Stock
Exchange (MSE) in 2011, becoming the first Company in its sector to achieve this recognition.
It will also receive the Sustainable Company seal from the MSE, because of its competitive
level in the adoption of sustainable policies and systems. The election of the winner of this seal
was conducted by the EIRIS (Empowering Responsible Investment) and the Center of
Excellence in Corporate Governance of the Universidad Anahuac del Sur, who were hired by
the MSE to analyze the 70 largest stock issuers in the MSE and rate their degree of adoption of
international practices in this area. The parameters used for the election of the winner were: The
Organization's Principles for Cooperation and Economic Development (OECD), the UN
Principles for Responsible Investment (UN-PRI) and the recommendations of the International
Corporate Governance Network (ICGN). In this way, Industrias Peñoles became a pioneer by
integrating the selected group of companies that have received both distinctions.
Figure 41: Gold Spot and S&P500 Rate
of Change since 1Q 2005
Source : Thomson Reuters
Figure 42: Risk Matrix
Source: Company Filings, Team Estimates
Figure 43: Monte Carlo Statistical
Summary Sample / Iterations 500,000 Mean $566.97 Median $564.52 Standard Deviation $75.07 Variance 5634.82 Skewness 0.2074 Kurtosis 3.27 Coefficient of Variation 0.1324 Minimum $191.50 Maximum $1007.04 Standard Error 0.11
Mean – 2 Std. Dev. $416.84 Mean – 1 Std. Dev. $491.90 Mean + 1 Std. Dev. $642.04 Mean + 2 Std. Dev. $717.10
Source: Team Estimates
Figure 44: Industrias Peñoles’ Ethics
and Compliance Program
Source: Company Filings
0%
50%
100%
150%
200%
250%
300%
350%
400%
450%
03
/20
05
05
/20
06
07
/20
07
09
/20
08
11
/20
09
01
/20
11
03
/20
12
05
/20
13
07
/20
14
09
/20
15
11
/20
16
Gold Spot S&P500
10

Section A: Financial Analysis and Valuation
Appendix A1: Industrias Peñoles’ Income Statement Historical & Expected Values
Historical Income Statement
Projected Income Statement
(MXN Millions) 2011 2012 2013 2014 2015 2016E 2017E 2018E 2019E 2020E 2021E
Total Revenue 96,864.1 97,199.4 66,550.9 61,555.6 64,896.5 78,589.89 96,238.28 101,906.33 112,001.56 124,796.89 131,582.88
Cost of Goods Sold 63,404.2 68,544.9 48,086.8 45,483.8 51,536.0 54,227.02 66,885.60 69,805.84 76,161.06 84,237.90 86,844.70
Gross Profit 33,459.9 28,654.5 18,464.0 16,071.8 13,360.5 24,362.87 29,352.67 32,100.49 35,840.50 40,558.99 44,738.18
Selling General & Admin Exp.
3,538.8 4,043.9 4,263.7 4,700.5 4,950.3 4,715.39 4,330.72 3,821.49 3,640.05 4,367.89 4,605.40
Other Operating Exp., Total
6,022.4 8,331.4 8,864.0 9,193.0 8,599.5 8,959.25 8,228.37 7,260.83 6,916.10 8,298.99 8,750.26
Operating Income (EBIT)
27,437.5 20,323.1 9,600.0 6,878.8 4,761.0 15,403.62 21,124.30 24,839.67 28,924.40 32,260.00 35,987.92
EBITDA 31,610.2 25,896.2 15,869.2 13,619.3 13,356.1 24,858.23 31,997.10 36,527.93 41,489.28 45,453.12 49,840.70
D&A 4,172.72 5,573.02 6,269.19 6,740.53 8,595.10 9,454.61 10,872.80 11,688.26 12,564.88 13,193.12 13,852.78
Net Interest Exp. & Other Exp.
779.7 212.1 269.2 2,099.0 1,189.6 1,375.32 1,539.81 1,528.59 1,512.02 1,559.96 1,644.79
EBT 26,657.8 20,111.0 9,330.8 4,779.8 3,571.4 14,028.30 19,584.49 23,311.07 27,412.38 30,700.03 34,343.13
Income Tax Expense 8,895.4 5,972.4 3,387.1 3,067.3 4,067.4 6,312.73 7,246.26 8,625.10 10,142.58 11,359.01 12,706.96
Minority Int. in Earnings 5,007.5 4,107.2 1,183.0 513.4 370.0 2,986.42 3,849.53 4,585.78 5,320.07 6,239.84 6,908.10
Net Income 12,754.9 10,031.4 4,760.7 1,199.1 (866.1) 4,729.15 8,488.70 10,100.19 11,949.73 13,101.18 14,728.07
EPS 32.09 25.24 11.98 3.02 (2.18) 11.91 21.38 25.44 30.10 33.00 37.10
Dividends per Share 20.09 9.3 9.23 1.51 1.51 4.76 9.62 12.72 15.05 18.15 20.40
Payout Ratio % 26.6% 79.4% 138.6% 62.9% - 40% 45% 50% 50% 55% 55%
Historical Income Statement Common Size Analysis Projected Income Statement Common Size Analysis
(MXN Thousands) 2011 2012 2013 2014 2015 2016E 2017E 2018E 2019E 2020E 2021E
Total Revenue 100.00% 100.00% 100.00% 100.00% 100.00% 100.00% 100.00% 100.00% 100.00% 100.00% 100.00%
Cost Of Goods Sold 65.46% 70.52% 72.26% 73.89% 79.41% 69.00% 69.50% 68.50% 68.00% 67.50% 66.00%
Gross Profit 34.54% 29.48% 27.74% 26.11% 20.59% 31.00% 30.50% 31.50% 32.00% 32.50% 34.00%
Selling General & Admin Exp. 3.65% 4.16% 6.41% 7.64% 7.63% 6.00% 4.50% 3.75% 3.25% 3.50% 3.50%
Other Operating Exp., Total 6.22% 8.57% 13.32% 14.93% 13.25% 11.40% 8.55% 7.13% 6.18% 6.65% 6.65%
Operating Income (EBIT) 28.33% 20.91% 14.43% 11.17% 7.34% 19.60% 21.95% 24.38% 25.83% 25.85% 27.35%
EBITDA 32.63% 26.64% 23.85% 22.13% 20.58% 31.63% 33.25% 35.84% 37.04% 36.42% 37.88%
D&A 4.31% 5.73% 9.42% 10.95% 13.24% 12.03% 11.30% 11.47% 11.22% 10.57% 10.53%
Net Interest Exp. & Other Exp. 0.80% 0.22% 0.40% 3.41% 1.83% 1.75% 1.60% 1.50% 1.35% 1.25% 1.25%
EBT 27.52% 20.69% 14.02% 7.76% 5.50% 17.85% 20.35% 22.88% 24.48% 24.60% 26.10%
Income Tax Expense 9.18% 6.14% 5.09% 4.98% 6.27% 8.03250% 7.5295% 8.4638% 9.0558% 9.1020% 9.6570%
Minority Int. in Earnings 5.17% 4.23% 1.78% 0.83% 0.57% 3.80% 4.00% 4.50% 4.75% 5.00% 5.25%
Net Income 13.17% 10.32% 7.15% 1.95% -1.33% 6.02% 8.82% 9.91% 10.67% 10.50% 11.19%
Source: Company Filings, Team Estimates
Appendix A2: Industrias Peñoles’ Balance Sheet Historical & Expected Values
Historical Balance Sheet Projected Balance Sheet
(MXN Thousands) 2011 2012 2013 2014 2015 2016E 2017E 2018E 2019E 2020E 2021E
Total Cash & ST Investments
15,931.2 11,482.1 19,720.2 15,596.7 13,993.7 12,594.37 6,297.18 8,816.06 13,224.09 9,256.86 10,182.55
Accounts Receivable 2,719.7 2,715.4 2,062.3 2,463.3 2,550.5 3,188.08 2,869.28 3,586.59 4,303.91 3,873.52 4,067.20
Other Receivables 2,847.0 6,883.1 6,998.7 6,980.6 5,549.9 6,937.38 6,243.64 7,804.55 9,365.46 8,428.92 8,850.36
Notes Receivable 77.2 314.6 91.6 94.5 70.1 87.68 78.91 98.63 118.36 106.53 111.85
Total Receivables 5,643.9 9,913.0 9,152.6 9,538.4 8,170.5 10,213.14 9,191.82 11,489.78 13,787.74 12,408.96 13,029.41
Inventory 16,625.6 13,534.0 11,817.6 13,173.2 16,016.9 20,021.10 18,018.99 22,523.74 27,028.49 24,325.64 25,541.92
Prepaid Exp. 188.5 - - - - - - - - - -
Other Current Assets 484.2 766.3 1,193.8 1,278.4 2,075.3 2,594.07 2,334.66 2,918.33 3,502.00 3,151.80 3,309.39
11

Total Current Assets 38,873.5 35,695.4 41,884.2 39,586.7 40,256.4 50,320.49 45,288.44 56,610.55 67,932.66 61,139.39 64,196.36
Net Property, Plant & Equipment
37,183.3 41,748.9 46,481.1 53,788.9 65,318.5 81,648.15 83,689.35 87,873.82 92,267.51 94,574.20 96,938.55
Long-term Investments 2,216.5 3,160.5 2,201.6 2,580.0 2,079.6 2,599.48 2,664.47 2,797.69 2,937.58 3,011.02 3,086.29
Other Intangibles 561.4 - - - - - - - - - -
Accounts Receivable Long-Term
191.3 - - - - - - - - - -
Loans Receivable Long-Term
- 279.5 201.3 62.6 48.2 - - - - - -
Deferred Tax Assets, LT
1,660.7 - 1,908.4 1,938.8 1,240.0 1,550.00 1,588.75 1,668.19 1,751.60 1,795.39 1,840.27
Other Long-Term Assets
44.1 129.9 351.2 495.7 1,916.6 - - - - - -
Total Assets 80,730.7 81,014.3 93,027.8 98,452.6 110,859.3 138,574.15 142,038.50 149,140.42 156,597.45 160,512.38 164,525.19
LIABILITIES
Accounts Payable 2,150.2 1,530.3 1,550.5 1,887.2 1,820.5 2,548.71 2,931.01 3,224.11 3,546.52 3,812.51 4,098.45
Accrued Exp. 2,455.3 2,599.5 2,352.6 2,278.6 2,290.6 3,206.88 3,687.91 4,056.70 4,462.37 4,797.05 5,156.82
Short-term Borrowings 148.0 - 535.1 - - - - - - - -
Curr. Port. of LT Debt 393.5 435.8 134.7 2,068.4 205.5 287.75 330.91 364.00 400.40 430.43 462.71
Curr. Income Taxes Payable
558.2 235.6 309.5 398.9 439.5 615.27 707.56 778.32 856.15 920.36 989.38
Unearned Revenue, Current
335.0 510.8 581.0 248.1 230.5 322.65 371.05 408.15 448.97 482.64 518.84
Other Current Liabilities 2,374.9 1,969.3 1,284.5 2,489.8 1,964.2 2,749.88 3,162.36 3,478.59 3,826.45 4,113.44 4,421.94
Total Current Liabilities
8,415.0 7,281.3 6,748.0 9,371.0 6,950.8 9,731.12 11,190.79 12,309.87 13,540.86 14,556.42 15,648.16
Long-Term Debt 8,798.2 10,309.5 20,323.8 20,839.3 24,173.4 30,216.71 30,972.13 31,746.43 32,063.90 32,865.50 33,194.15
Pension & Other Post-Retire. Benefits
450.7 683.0 789.3 1,215.5 1,598.7 1,998.34 2,048.30 2,099.51 2,120.50 2,173.51 2,195.25
Def. Tax Liability, Non-Curr.
7,855.8 4,702.9 5,346.3 6,098.3 8,094.1 10,117.69 10,370.63 10,629.89 10,736.19 11,004.60 11,114.64
Other Non-Current Liabilities
2,997.8 4,039.4 4,411.1 4,985.9 6,049.1 7,561.33 7,750.37 7,944.12 8,023.57 8,224.16 8,306.40
Total Liabilities 28,517.4 27,016.0 37,618.5 42,509.9 46,866.1 58,582.58 60,047.14 61,548.32 62,163.80 63,717.90 64,355.08
Common Stock 2,191.2 2,191.2 2,191.2 2,191.2 2,191.2 2,191.21 2,191.21 2,191.21 2,191.21 2,191.21 2,191.21
Retained Earnings 36,551.9 38,567.7 39,155.1 39,365.0 37,915.2 45,281.48 49,809.63 54,790.59 57,530.12 61,844.88 64,937.12
Treasury Stock (30.5) (30.5) (30.5) (30.5) (30.5) (30.50) (30.50) (30.50) (30.50) (30.50) (30.50)
Comprehensive Inc. and Other
2,664.7 838.8 772.8 4,895.4 12,333.2 15,448.75 17,209.70 19,146.74 20,212.11 21,890.08 23,092.62
Total Common Equity 41,377.4 41,567.3 42,088.5 46,421.1 52,409.1 62,890.94 69,180.04 76,098.04 79,902.94 85,895.66 90,190.45
Minority Interest 10,836.0 12,431.0 13,320.7 9,521.6 11,584.1 13,321.76 13,454.98 13,589.52 13,725.42 13,862.67 14,001.30
Total Equity 52,213.3 53,998.2 55,409.3 55,942.7 63,993.3 76,212.70 82,635.01 89,687.57 93,628.36 99,758.34 104,191.75
Total Liabilities and Equity
80,730.7 81,014.3 93,027.8 98,452.6 110,859.3 134,795.28 142,682.15 151,235.88 155,792.17 163,476.24 168,546.82
*Net Working Capital 14,920.8 17,367.7 15,550.7 16,687.3 19,517.4 28,282.74 28,131.37 35,848.62 41,568.11 37,756.54 38,828.37
*Change in working capital
2,446.95 (1,816.97) 1,136.55 2,830.08 8,765.36 (151.37) 7,717.25 5,719.49 (3,811.57) 1,071.83
Source: Company Filings, Team Estimates
Appendix A3: Industrias Peñoles’ Cash Flow Statement Historical & Expected Values
Historical Cash Flow Statement Projected Cash Flow Statement
(MXN Thousands) 2011 2012 2013 2014 2015 2016E 2017E 2018E 2019E 2020E 2021E
Net Income 12,754.9 10,031.4 4,760.7 1,199.1 (866.1) 4,729.15 8,488.70 10,100.19 11,949.73 13,101.18 14,728.07
Depreciation & Amort. 4,141.4 5,573.0 5,494.9 6,537.9 8,296.1 9,454.61 10,872.80 11,688.26 12,564.88 13,193.12 13,852.78
Amort. of Goodwill and Intangibles
31.4 - - - - - - - - - -
Impair. of Oil, Gas & Mineral Prop.
- - 774.2 202.7 299.0 - - - - - -
Depreciation & Amort., Total
4,172.7 5,573.0 6,269.2 6,740.5 8,595.1 9,454.61 10,872.80 11,688.26 12,564.88 13,193.12 13,852.78
(Gain) Loss from Sale of Assets
84.1 70.6 71.8 335.8 513.0 - - - - - -
(Gain) Loss on Sale of Invest.
- - 26.1 29.6 40.2 - - - - -
12

Asset Writedown & Restructuring Costs
- - 34.4 97.7 121.8 - - - - - -
(Income) Loss on Equity Invest.
19.8 (152.8) (102.2) (23.1) (38.5) - - - - - -
Other Operating Activities 16,787.2 11,541.1 5,838.7 2,485.0 5,957.0 6,289.76 11,289.97 13,433.25 15,893.14 17,424.57 19,588.34
Change in Acc. Receivable
(2,779.0) (6,522.5) 1,366.8 (1,051.9) (1,748.1) - - - - - -
Change in Inventories (4,936.8) 2,502.2 1,785.8 110.4 (1,235.9) - - - - - -
Change in Acc. Payable (43.2) 32.0 (410.8) 633.3 (173.0) - - - - - -
Change in Inc. Taxes (6,165.4) (5,764.2) (5,432.2) - - - - - - - -
Change in Other Net Operating Assets
(795.7) (1,209.5) (1,348.6) (9.5) (407.0) - - - - - -
Cash from Ops. 19,098.5 16,101.3 12,859.8 10,546.9 10,758.6 6,289.76 11,289.97 13,433.25 15,893.14 17,424.57 19,588.34
Capital Expenditure (9,614.8) (11,406.5) (10,905.4) (9,084.9) (11,489.8) (13,787.8) (17,579.4) (14,063.5) (10,899.2) (13,624.0) (16,348.8)
Sale of Property, Plant, and Equipment
121.6 506.4 90.2 52.7 43.3 - - - - - -
Cash Acquisitions - - - - (10.0) - - - - - -
Divestitures - - - - 637.8 - - - - - -
Sale (Purchase) of Intangible assets
(31.3) (19.2) (34.1) (5.5) (3.6) - - - - - -
Invest. in Marketable & Equity Securt.
(32.3) (285.3) (168.6) (4,268.1) 1,877.5 - - - - - -
Net (Inc.) Dec. in Loans Originated/Sold
(42.4) 48.8 284.0 77.7 49.1 - - - - - -
Other Investing Activities 177.9 171.2 399.0 265.3 129.2 - - - - - -
Cash from Investing (9,421.3) (10,984.7) (10,334.9) (12,962.8) (8,766.5) (13,787.8) (17,579.4) (14,063.5) (10,899.2) (13,624.0) (16,348.8)
Long-Term Debt Issued 17,631.2 7,105.7 15,336.3 - - - - 15,000.0 - - -
Total Debt Issued 17,631.2 7,105.7 15,336.3 - - - - 15,000.0 - - -
Short Term Debt Repaid - - - - - - - - - - -
Long-Term Debt Repaid (18,420.8) (4,591.3) (4,779.6) - (2,101.5) - - (2,000.0) (2,000.0) (4,000.0) (4,000.0)
Total Debt Repaid (18,420.8) (4,591.3) (4,779.6) - (2,101.5) - - (2,000.0) (2,000.0) (4,000.0) (4,000.0)
Issuance of Common Stock
- - - - 23.3 - - - - - -
Repurchase of Common Stock
- - - - - - - - - - -
Common Dividends Paid (3,395.0) (7,967.8) (6,596.1) (753.8) (599.2) (1,891.66) (3,819.91) (5,050.10) (5,974.86) (7,205.65) (8,100.44)
Total Dividends Paid (3,395.0) (7,967.8) (6,596.1) (753.8) (599.2) (1,891.66) (3,819.91) (5,050.10) (5,974.86) (7,205.65) (8,100.44)
Special Dividend Paid - - - - - - - - - - -
Other Financing Activities (3,662.1) (2,922.5) 1,604.6 (7,573.5) (1,573.3) - - - - - -
Cash from Financing (7,846.7) (8,375.9) 5,565.2 (8,327.3) (4,250.7) (1,891.66) (3,819.91) 7,949.90 (7,974.86) (11,205.65) (12,100.44)
Foreign Exchange Rate Adj.
1,523.5 (1,094.9) 148.0 2,277.9 2,533.1 3,000.0 (500.0) - - - -
Net Change in Cash 3,354.0 (4,354.1) 8,238.1 (8,465.3) 274.5 7,398.11 6,970.05 7,319.64 (2,980.95) (7,405.11) (8,860.94)
Source: Company Filings, Team Estimates
Appendix A4: Industrias Peñoles’ Discounted Cash Flow Model
Industrias Peñoles - DCF Valuation (MXN$ millions)
2016E 2017E 2018E 2019E 2020E 2021E Terminal Value
EBITDA 24,858.23 31,997.10 36,527.93 41,489.28 45,453.12 49,840.70 49,840.70
EBITDA Margin % 31.63% 33.25% 35.84% 37.04% 36.42% 37.88% 40.00%
(-) Depreciation 9,454.61 10,872.80 11,688.26 12,564.88 13,193.12 13,852.78 13,852.78
(=) EBIT 15,403.62 21,124.30 24,839.67 28,924.40 32,260.00 35,987.92 35,987.92
(-) Cash Tax 6,312.73 7,246.26 8,625.10 10,142.58 11,359.01 12,706.96 12,706.96
Cash Tax Rate 40.98% 34.30% 34.72% 35.07% 35.21% 35.31% 35.00%
(=) EBIT(1-t) 9,090.89 13,878.04 16,214.57 18,781.82 20,900.98 23,280.96 23,280.96
(+) Depreciation 9,454.61 10,872.80 11,688.26 12,564.88 13,193.12 13,852.78 13,852.78
(-) Capex 13,787.76 17,579.39 14,063.52 10,899.22 13,624.03 16,348.84 16,348.84
(-) Change in Working Capital (8,765.36) 151.37 (7,717.25) (5,719.49) 3,811.57 (1,071.83) (1,071.83)
Free Cash Flow to the Firm (FCFF) 13,523.10 7,020.07 21,556.56 26,166.97 16,658.50 21,856.73 21,856.73
WACC (%) 9.16% 9.16% 9.16% 9.16% 9.16% 9.16% 9.16%
Present Value of Cash Flows 13,523.10 6,430.73 18,089.10 20,114.52 11,730.35 14,098.70 311,173.24
13

(+) Sum of PV of FCF 83,986.50
(+) Present Value of Perpetuity 183,871.63
(=) Present Value of FCFF (EV) 267,858.12
(-) Interest Bearing Debt 32,085.30
(=) Industrias Peñoles Equity Value 235,772.82
# Shares Outstanding 397
Industrias Peñoles Target Price Per Share ($MXN)
593.89
Source: Team Estimates
Appendix A5: Industrias Peñoles’ Relative Valuation Model
P/E 2011 2012 2013 2014 2015 2016 E 2017 E 2018 E
SLW US 81.54 21.29 15.61 21.64 23.99 32.7 25.98 24.54
THO US 13.1 16.9 14.3 22.79 18.13 14.61 14.48 12.05
HL US 11.71 11.37 25.81 73.51 68.77 29.63 19.27 19.21
CDE US 384.52 15.96 19.73 31.7 44.8 28.67 17.34 12.9
HOC LN 17.62 15.03 20.26 21.2 23.7 19.69 18.7 13.09
G US 32.23 20.84 14.66 135.38 120.69 50.39 28.7 24.21
PAAS US 254.83 8.41 14.37 65.93 71.1 30.9 23.74 16.51
Median P/E for each year 32.23 15.96 15.61 31.7 44.8 29.63
PE&OLES MM 29.97 18.88 18.3 26.86 83.74 22.67
Historical Dicount/ Premium -7.0% 18.3% 17.2% -15.3% 86.9% -23.5%
Median of historical premium 5.1%
2017E 2018E
P/E peers’ median 19.27 16.51
Premium 5% 5%
Target P/E 20.23 17.34
EPS (MXN) 21.38 25.44
Price from P/E (MXN) 432.59 441.02
Weights for year 50% 50%
Average price (MXN) 436.80
EV/EBITDA 2011 2012 2013 2014 2015 2016 E 2017 E 2018 E
SLW US 39.03 17.61 12.02 16.94 16.66 17.02 14.48 14.17
THO US 13.1 12.9 12.5 12.08 16.33 7.91 7.03 6.03
HL US 184.79 4.99 10.83 26.89 9.67 10.67 8.87 8.39
CDE US 11.65 3.8 3.65 4.1 3.9 9.07 6.18 5.36
HOC LN 6.01 4.14 3.8 5.13 8.85 4.84 4.58 4.12
G US 19.47 11.21 8.93 9.5 8.8 54.12 27.57 20.67
PAAS US 10.76 4.49 4.2 5.1 4.9 8.11 7.76 6.02
Median EV/EBITDA for each year 13.1 4.99 8.93 9.5 8.85 9.07
PE&OLES MM 11.89 7.74 7.56 9.32 8.94 7.07
Historical Discount/ Premium -9.2% 55.1% -15.3% -1.9% 1.0% -22.1%
Median of historical discounts -5.6%
2017E 2018E
EV/EBITDA peer’s median 7.76 6.03
Discount -5% -5%
Target EV/EBITDA 7.37 5.73
EBITDA (MXN millions) 31,749.30 36,262.29
14

EV from EV/EBITDA (MXN millions) 234,055.84 207,728.53
Cash & Equivalents 6,297.80 8,816.06
Interest bearing debt 31,303.04 32,110.42
Preferred & Other 13,454.98 13,598.52
Value of equity (MXN millions) 195,595.62 170,835.65
Shares outstanding (millions) 397.00 397.00
Price from EV/EBITDA (MXN) 492.68 430.32
Weights for year 50% 50%
Average price (MXN) 461.50
EV/ Value of Mining Reserves 2011 2012 2013 2014 2015 2016 E 2017 E 2018 E
SLW US 0.44 0.47 0.34 0.35 0.23 0.33 0.25 0.35
THO US 0.5 0.6 0.5 0.5 0.4 0.5 0.4 0.45
HL US 0.16 0.18 0.21 0.17 0.18 0.2 0.18 0.19
CDE US 0.2 0.2 0.18 0.11 0.11 0.17 0.12 0.14
HOC LN 1.18 1.87 0.72 0.44 0.48 0.9 0.51 0.55
G US 0.21 0.17 0.13 0.15 0.1 0.14 0.11 0.12
PAAS US 0.19 0.23 0.12 0.09 0.07 0.16 0.08 0.09
Median EV/Reserves for each year 0.21 0.23 0.21 0.17 0.18 0.2
PE&OLES MM 0.62 0.71 0.38 0.37 0.23 0.375
Historical Discount/ Premium 195.2% 208.7% 81.0% 117.6% 27.8% 87.5%
Median of historical Premium 102.6%
2017E 2018E
EV/ Reserves Median 0.18 0.19
Premium 1.03 1.03
Target EV/ Reserves 0.37 0.39
Reserves
40,185.31
33,242.36
EV from EV/Reserves (USD millions) 14,683.71
12,821.58
Expected Exchange rate (USD/MXN)
22.15
22.00
EV from EV/Reserves (MXN millions) 325,244.25
282,074.71
Cash & Equivalents
6,297.80
8,816.06
Debt
31,303.04
32,110.42
Preferred & Other
13,454.98
13,598.52
Value of equity (MXN millions)
286,784.03
245,181.83
Shares outstanding (millions)
397.00
397.00
Price per share (MXN)
722.38
617.59
Weights for year 50% 50%
Average price 669.98
Total price average 524.18
Source: Bloomberg, Team Estimates
Appendix B5: Valuation Summary
Price from Relative Valuation 524.18
Weight of Relative Valuation 40%
Price from Intrinsic Valuation (DCF) 593.89
Weight of Intrinsic Valuation (DCF) 60%
12-Month Target Price (MXN) 566.0
Price Per Share (January 20, 2017) 488.24
Upside Potential 15.93%
Source: Team Estimates
15

Appendix A6: Peer group selection criteria
1) Production criteria:
2) Significant portion of mining operations in Latin America.
c) At least 10 million ounces of
silver produced in the last
reported year.
b) At least 100 thousand ounces
of gold produced in the last
reported year.
c) Gold produced in the last reported
year must not be higher than 10% of
silver production in the same year.
0
10
20
30
40
50
60
Mil
lio
ns
of
ounce
s
Silver production 2015 (Millions of ounces)
Lower limit (10 Million ounces)
0
0.5
1
1.5
2
2.5
3
3.5
Mil
lio
ns
of
ounce
s
Gold production 2015 (Millions of
ounces)Lower limit (0.1 million ounces)
0.00%
2.00%
4.00%
6.00%
8.00%
10.00%
12.00%
Gold/silver production ratio
Upper limit (10%)Source: Bloomberg, Team Estimates
-
2,000.00
4,000.00
6,000.00
8,000.00
10,000.00
12,000.00
14,000.00
16,000.00
PE&OLES SLW THO HL CDE HOC G PAAS
Milli
ons
of
$U
SD
Enterprise Value (Millions of USD) Current/ LTM
Lower limit (1,000 Million USD)
0.00%
20.00%
40.00%
60.00%
80.00%
100.00%
120.00%
140.00%
160.00%
PE&OLES SLW THO HL CDE HOC G PAAS
Last 5 years average CAPEX/ Sales ratio Lower limit (10%)
3) At least 10 million ounces of silver produced
in the last reported year.
4) Five-year Capex/ Sales ratio average of at
least 10%.
Source: Bloomberg, Team Estimates Source: Bloomberg, Team Estimates
Source: Bloomberg, Team Estimates
Source: Bloomberg, Team Estimates
16

Appendix A7: Debt Obligations Overview
Rating Agency Credit Rating Scale Outlook
Industrias Peñoles
S&P BBB Global –long term stable
S&P mxAAA Local – long term stable
S&P BBB/mxAAA Issuance of exchange traded bonds stable
Moody’s Baa3 Global, local currency stable
Moody’s Baa3/Aa2.mx Issuance of exchange traded bonds stable
Fresnillo PLC
S&P BBB Global - long term stable
Moody’s Baa2 Global foreign currency stable
Source: Company Filings
Appendix A8: Hedging program
a) Metal price and energy hedging program
As at 30 September 2015, Grupo Peñoles has entered into the following contracts that commit a portion of its
production from 2016 to 2019:
Note: (1) Includes 100% of consolidated hedging.
Source: Company Filings
400
200
800
0
100
200
300
400
500
600
700
800
900
2020 2021 2022 2023
Debt maturity profile US$ million
Silver Gold Zinc Lead Copper Natural Gas
19,802,934 1,238,388 88,629 5,859 8,301 1,290,000
ounces (oz) ounces (oz) tonnes (tn) tonnes (tn) tonnes (tn) mmBtu
Period Oct. '16 - Dec. '17Oct. '16 - Dec. '19 Oct. '16 - Dec. '17 Oct. '16 - Dec. '17 Oct. '16 - Dec. '17 Oct. '16 - Dec. '16
% production 2016* 50% 55% 29% 12% 32% 80%
% production 2017* 21% 45% 23% 3% 12% 0%
% production 2018* 0% 38% 0% 0% 0% 0%
% production 2019* 0% 37% 0% 0% 0% 0%
Price usd/oz usd/oz usd/tn usd/tn usd/tn usd/mmBtu
Min. Forward - - - - - 2.19
Max. Forward - - - - - 2.28
Wgt. Avg. Forward - - - - - 2.23
Min. Put 14.00 1,050 1,765 1,765 4,410 -
Max. Put 17.48 1,250 2,205 1,985 6,063 -
Wgt. Avg. Put 15.13 1,102 1,936 1,840 4,737 -
Min. Call 16.70 1,285 1,980 1,975 5,065 -
Max. Call 26.50 2,622 2,610 2,310 6,700 -
Wgt. Avg. Call 20.34 1,434 2,355 2,124 5,368 -
(1) Includes 100% of consolidated hedging.
* Based on 100% of consolidated production of the residuary period.
Total Hedged Volume (1)
17

b) Foreign currency hedging program
As at 30 September 2015, Grupo Peñoles has established the following derivative transactions that hedge a portion
of future obligations (2016) denominated in Mexican pesos:
Source: Company Filings
Appendix A9: Ratio Analysis
Credit Ratio Analysis FY 2011
FY 2012
FY 2013
FY 2014
FY 2015
Profitability Ratio Analysis
FY 2011
FY 2012
FY 2013
FY 2014
FY 2015
Net Debt/EBITDA -0.24 -0.06 0.01 0.52 0.80
Returns
Net Debt/EBIT -0.28 -0.08 0.01 1.03 2.48
Return on Common Equity
38.24 24.19 11.38 2.71 -1.75
EBITDA to Interest Expense
69.53 51.30 20.81 11.23 10.76
Return on Assets 18.72 12.40 5.47 1.25 -0.83
EBIT to Interest Expense
60.33 40.19 13.20 5.60 3.49
Return on Capital 35.83 23.29 9.20 2.77 -0.79
Common Equity/Total Assets
51.25 51.31 45.24 47.15 47.28
Return on Invested Capital
31.85 20.43 8.42 3.04 -0.71
Long-Term Debt/Equity 15.28 17.96 35.75 36.46 37.30
Margins
Long-Term Debt/Capital 13.19 15.16 26.33 26.07 27.17
Gross Margin 34.54 29.48 27.74 26.11 20.64
Long-Term Debt/Total Assets
9.88 11.97 21.29 20.72 21.53
EBITDA Margin 32.56 26.46 22.58 21.18 18.93
Total Debt/Equity 15.82 18.45 35.75 39.88 37.30
Operating Margin 28.25 20.73 14.32 10.56 6.15
Total Debt/Capital 13.66 15.57 26.33 28.51 27.17
Pretax Margin 27.52 20.69 14.02 7.76 5.50
Total Debt/Total Assets 10.23 12.30 21.29 22.66 21.53
Net Income Margin 13.17 10.32 7.15 1.95 -1.33
Net Debt/Equity -14.69
-2.82 0.16 12.00 15.44
Additional
Net Debt/Capital -17.22
-2.90 0.16 10.72 13.37
Effective Tax Rate 33.37 29.70 36.30 64.17 113.89
Dvd Payout Ratio 60.12 63.28 15.23 48.06 —
Source: Bloomberg
Section B: Industry Overview, Competitive Positioning, and Business Overview
Appendix B1: Gold overview
Table B1.1: Gold supply and demand balance
tonnes
Supply 2012 2013 2014 2015 2016 2017E 2018E 2019E
Mine Production 2,849.8 3,039.5 3,129.0 3,178.1 3,121.9 3,056.3 2,992.1 2,940.5
Scrap 1,700.4 1,302.3 1,157.4 1,166.2 1,288.9 1,429.3 1,524.3 1,612.3
Net Hedging Supply (40.1) (38.8) 107.7 20.9 90.0 (39.0) (18.0) (28.0)
Supply 4,510.1 4,302.9 4,394.2 4,365.1 4,500.8 4,446.6 4,498.4 4,524.8
Demand 2012 2013 2014 2015 2016 2017E 2018E 2019E
Jewellery 2,044.2 2,477.8 2,249.3 2,178.0 1,658.0 1,847.9 1,930.5 1,990.1
Industrial Fabrication 424.9 417.2 399.3 361.5 336.9 308.6 290.2 282.0
...of which Electronics 302.9 296.3 286.1 254.4 235.3 210.2 192.8 175.3
...of which Dental & Medical 38.6 36.3 33.9 31.5 31.0 29.3 26.9 25.1
...of which Other Industrial 83.4 84.7 79.3 75.6 70.5 69.0 70.4 81.6
Net Official Sector 544.1 409.3 465.6 435.7 200.0 200.0 200.0 200.0
Retail Investment 1,357.6 1,791.7 1,103.1 1,105.2 961.5 988.5 1,049. 0 1,146.2
Exchange Rate Mxn/Usd Short Forward Long Forward Options
Hedged Volume (Thousands of USD) - - 113,500
Hedged Volume (Thousands of MXN) - - 1,884,950
Period - - Oct '16 - Dec '16
Wgt. Avg. Put - - 16.6075
Mi. Put - - 16.4400
Max. Put - - 17.2500
Wgt. Avg. Call - - 19.1791
Min. Call - - 18.5000
Max. Call - - 20.3400
Wgt. Avg. Fwd - - -
Min. Fwd - - -
Max. Fwd - - -
18

...of which Bars 1,052.2 1,409.9 851.7 846.4 728.5 761.3 795.8 885.6
...of which Coins 305.5 381.8 251.4 258.8 233.0 227.2 253.2 260.6
Total Physical demand 4,370.8 5,096.1 4,217.2 4,080.4 3,156.3 3,345.1 3,469.6 3,618.3
Physical Surplus/(Deficit) 139.3 (793.1) 176.9 284.8 1,344.5 1,101.5 1,028.7 906.5
ETF Inventory Build 279.2 (880.1) (154.6) (124.5) 800.0 500.0 300.0 ..
Exchange Inventory Build (9.7) (98.0) 0.5 (48.2) 100.0 .. .. ..
Net Balance (130.2) 184.9 331.0 457.5 444.5 601.5 728.8 906.5
Source: Thomson Reuters GFMS, International Copper Study Group, COMEX, Shanghai Futures Exchange, London Metal
Exchange
Table B1.2: Gold prices forecast
Gold (US$/Oz)
2016 2017E 2018E 2019E 2020E 2021E LT
Bear Case 1251 1,095.75 1,087.15 1,129.41 1,136.02 1,171.07 1,144.24
Base Case 1251 1,217.50 1,242.46 1,328.71 1,376.99 1,463.83 1,525.66
Bull Case 1251 1,308.81 1,366.71 1,494.80 1,583.54 1,720.00 1,830.79
Source: Thomson Reuters GFMS, Team Estimates
Appendix B2: Silver overview
Table B2.1: Silver supply and demand balance
millions of ounces
SUPPLY 2012 2013 2014 2015 2016 2017E 2018E 2019E
Mine Production 790.8 823.7 868 893 887.4 868.9 848.9 837.2
Scrap 255.5 192.1 168.3 145.5 145 161 175.4 184.2
Net Hedging Supply -47.1 -34.8 16.8 7.8 -20 -5 -5 5
Total Supply 1006.6 988.9 1053 1046.4 1012.4 1024.8 1019.3 1026.5
DEMAND 2012 2013 2014 2015 2016 2017E 2018E 2019E
Jewellery 185.4 217.8 224 226.2 208.5 212.7 219.5 228.5
Coins & Bars 159.6 241.9 236.5 292.4 222 202 196 190.1
Silverware 43.7 58.8 60.7 62.9 49.1 48.1 47.1 46.2
Industrial Fabrication 615 619.1 611.2 588.9 585.1 572.3 563.4 557.7
...of which Electrical & Electronics 266.7 266 263.4 246.9 242.9 236.9 230.4 224.5 ...of which Brazing Alloys & Solders 60.6 63.2 66.1 61.1 59 58.4 59.1 59.7
...of which Photography 54.2 50.5 48.5 46.7 45.6 44.4 43.5 42.3
...of which Photovoltaic* 62.9 62.5 61.7 75.2 83.3 78.8 75.4 72.1
...of which Ethylene Oxide 4.7 7.7 5 10.2 10.2 6.9 5.5 7.1
...of which Other Industrial Uses 165.8 169.3 166.5 148.9 144.1 146.8 149.4 152
Total physical demand 1003.7 1137.6 1132.4 1170.3 1064.6 1035 1025.9 1022.5
Physical Surplus/(Deficit) 2.9 -148.7 -79.3 -124 -52.2 -10.2 -6.6 4
ETF Inventory Build 55.3 2.5 1.5 -17.7 71.4 40 20 10
Exchange Inventory Build 62.2 8.8 -5.3 12.6 61.9 .. .. ..
Net Balance -114.6 -160 -75.5 -118.9 -185.5 -50.2 -26.6 -6
Source: Thomson Reuters GFMS, International Copper Study Group, COMEX, Shanghai Futures Exchange, London Metal Exchange
19

Table B2.2: Silver prices forecast
Silver (US$/Oz)
2016 2017E 2018E 2019E 2020E 2021E LT
Bear Case 17.11 15.49 15.48 16.48 16.64 16.89 16.37
Base Case 17.11 17.21 17.69 19.39 20.17 21.12 21.82
Bull Case 17.11 18.51 19.46 21.82 23.20 24.81 26.19
Source: Thomson Reuters GFMS, Team Estimates
Appendix B3: Copper overview
Table B3.1: Copper supply and demand balance
thousands of tonnes
Production 2012 2013 2014 2015 2016 2017E 2018E 2019E
Global Refined Production 19,990 20,685 21,698 22,206 22,668 23,204 23,713 24,141
Consumption 2012 2013 2014 2015 2016 2017E 2018E 2019E
Total Mature Economies 5,896 5,890 6,164 6,212 6,292 6,397 6,505 6,636
...of which EU-28 3,100 3,027 3,137 3,212 3,276 3,338 3,400 3,466
...of which Japan 978 988 1,064 1,015 1,010 1,012 1,019 1,040
...of which United States 1,663 1,715 1,800 1,820 1,838 1,875 1,912 1,953
...of which Canada 155 159 163 165 168 171 174 177
Total BRIC 9,854 10,533 11,033 11,234 11,499 11,827 12,146 12,501
...of which Brazil 426 447 403 370 348 351 357 365
...of which Russia 660 664 630 460 446 450 452 455
...of which India 456 455 440 462 485 510 538 568
...of which China 8,312 8,967 9,560 9,942 10,220 10,516 10,799 11,112
Total ASEAN Economies 798 826 881 916 949 982 1,018 1,056
South Korea 720 714 745 739 737 740 745 754
Taiwan 433 437 465 463 472 485 500 515
Others 2,097 2,240 2,163 2,285 2,345 2,420 2,499 2,581
Global Consumption 19,799 20,640 21,450 21,849 22,294 22,852 23,412 24,043
Market Balance 191 46 248 357 374 352 301 98
Stocks (inventory) 2012 2013 2014 2015 2016 2017E 2018E 2019E
Total Stocks 1,360 1,325 1,339 1,482 1,855 2,208 2,508 2,606
Total as No. of weeks consumption 4 3 3 4 4 5 6 6
Source: Thomson Reuters GFMS, International Copper Study Group, COMEX, Shanghai Futures Exchange, London Metal Exchange
Table B3.2: Copper prices forecast
Copper (US$/ tonne)
2016 2017E 2018E 2019E 2020E 2021E LT
Bear Case 4,870.0 4,800.0 4,800.0 4,850.0 4,950.2 5,052.4 5,050.0
Base Case 4,870.0 5,771.0 5,800.0 6,250.0 6,508.2 6,642.6 6,650.0
Bull Case 4,870.0 6,500.0 5,950.0 6,300.0 6,630.1 6,762.9 6,750.0
Source: Thomson Reuters GFMS, Team Estimates
Appendix B4: Zinc overview
Table B4.1: Zinc supply and demand balance
million tonnes
Supply 2016 2015 2014 2013 2012 2011
Global Mined Zinc Supply 10,194,231 13,267,720 13,613,675 13,663,137 13,308,783 12,461,778
North America 1,508,886 1,761,038 1,844,003 1,853,086 2,039,462 2,023,459
20

United States 672,300 807,500 832,000 784,000 738,000 769,000
Mexico 574,861 677,018 659,878 642,542 660,349 631,859
South & Central America 1,688,111 2,124,254 2,041,031 2,007,474 1,927,671 1,962,551
Europe 899,110 1,130,093 1,189,417 1,178,919 1,187,886 1,170,644
Asia 4,865,090 6,228,833 6,516,550 6,718,502 6,271,443 5,473,531
China 3,878,605 4,750,000 5,118,400 5,187,700 4,859,100 4,050,000
India 456,609 825,723 728,600 817,025 724,937 733,022
Oceania 835,000 1,600,000 1,560,000 1,523,000 1,507,000 1,516,000
Africa 177,625 229,189 265,396 279,997 304,723 285,345
Production and Demand 2016 2015 2014 2013 2012 2011
Global Zinc Slab Production 11,520,539 13,886,617 13,512,986 13,023,457 12,594,682 13,128,835
Global Zinc Slab Demand 11,458,406 13,786,482 13,801,165 12,970,339 12,107,715 12,571,379
Zinc Slab Net Surplus/-Deficit 62,133 100,135 (288,179) 53,118 486,967 557,456
Inventory and Reserves 2016 2015 2014 2013 2012 2011
LME Zinc Inventory 427,850 464,400 691,600 933,475 1,220,750 821,700
Global Zinc Mine Reserves (rounded) 200,000 230,000 250,000 250,000 250,000
Source: CME Group, Bloomberg, WBMS
Table B4.2: Zinc prices forecast
Zinc ($US/ tonne)
2016 2017E 2018E 2019E 2020E 2021E LT
Bear Case 2,400.0 2,466.0 2,469.4 2,446.8 2,325.9 2,349.2 2,372.7
Base Case 2,400.0 2,740.0 2,822.2 2,878.6 2,907.4 2,936.5 2,965.9
Bull Case 2,400.0 2,877.0 3,033.9 3,166.5 3,198.2 3,230.2 3,262.5
Source: Thomson Reuters GFMS, Team Estimates
Appendix B5: Lead overview
Table B5.1: Lead supply and demand balance
million tonnes
Supply 2016 2015 2014 2013 2012 2011
Global Mined Lead Supply 3,842,320 4,997,171 5,271,167 5,293,415 5,099,584 4,771,557
North America 495,079 624,669 638,554 616,622 638,267 625,318
United States 291,869 370,526 385,017 342,583 336,061 334,095
Mexico 193,958 253,890 249,920 253,361 238,091 223,717
South & Central America 393,898 474,417 439,641 429,150 408,075 407,530
Europe 408,200 514,159 493,914 467,172 442,580 397,340
Asia 2,060,313 2,612,534 2,860,333 2,966,761 2,872,531 2,626,827
China 1,801,030 2,335,024 2,608,600 2,696,500 2,613,200 2,405,697
India 111,737 138,720 105,100 105,500 115,050 94,055
Oceania 364,000 654,000 728,000 711,000 639,000 621,000
Africa 80,889 90,139 80,385 95,264 100,493 100,595
Production and Demand 2016 2015 2014 2013 2012 2011
Global Refined Lead Production 8,984,145 10,190,618 11,022,943 11,305,623 10,709,074 10,646,647
Global Refined Lead Demand 9,003,445 10,204,971 11,039,546 11,294,322 10,525,762 10,462,772 Refined Lead Net Surplus/-Deficit (19,300) (14,353) (16,603) 11,301 183,312 183,875
Source: CME Group, Bloomberg, WBMS
21

Table B5.2: Lead prices forecast
Source: Thomson Reuters GFMS, Team Estimates
Appendix B6: Peñoles’ expected revenue breakdown by product
Appendix B7: Porter’s 5 forces
Power of Buyers – Moderate: Given the wide range of
uses that the Peñoles’ products have, there is also a wide
range of consumers. However, it is possible to divide
consumer by product segment. The Precious Metals
products (gold and silver) consumers have a low
bargaining power, since final gold and silver products
are mostly jewelry products. In the other hand, the Base
Metals products consumers are often big companies that
use the base metals to create another final product, so
their bargaining power is moderate. Nonetheless, both
precious and base metals are commodity products, and
their prices change as market conditions change.
Power of Suppliers – Low: The mining industry often
has large amounts of cash to buy their own plants and
equipment. Furthermore, most mining companies
usually acquire the same type of equipment, and there is
an important variety of equipment brands to choose from, hence the equipment providers have low bargaining power and
it is difficult for them to increase their prices significantly because of competitive reasons.
Threat of Substitutes – Low: On the one hand, precious metals such as gold and silver are often consumed as jewelry
products, and even though here are other types of jewelry in the market such as diamonds and gems, gold and silver are
seen by consumers as the most representative jewelry products. Thus, consumers are unlike to substitute gold or silver to
other type of jewelry. On the other hand, base metals products are difficult to substitute as well. Base metals such as Zinc,
have very specific and important industrial functions, so it is difficult to replace them with something else.
0%
10%
20%
30%
40%
50%
60%
70%
80%
90%
100%
2016E 2017E 2018E 2019E 2020E 2021E
Gold (USD) Silver Zinc Copper Lead Other
Lead (US$/tonne)
2016 2017E 2018E 2019E 2020E 2021E LT
Bear Case 1,850.0 2,061.9 2,054.7 2,036.0 1,944.9 1,964.4 1,984.0
Base Case 1,850.0 2,291.0 2,348.3 2,395.2 2,431.2 2,455.5 2,480.0
Bull Case 1,850.0 2,405.6 2,524.4 2,634.8 2,735.1 2,762.4 2,790.0
0
1
2
3
4
5
Power ofBuyers
Power ofSuppliers
Threat ofSubstitutes
Threat of NewEntrants
ExistingRivalries
Figure B7.1: Porter's Five Forces Analysys
Source: Team Estimates
Source: Team Estimates
22

Threat of New Entrants – Insignificant: The mining industry is a very capital intensive sector, where companies need
to have large amounts of cash to operate properly. Furthermore, companies need to have mining concessions and special
environmental permits to start a mining project. Thus, the threat of new entrants to the mining business is insignificant.
Existing Rivalries – Moderate: Since mining companies can’t do much to change metal commodities prices, the only
place where they can compete is in operating costs. Mines usually compare to each other in how cost efficient they are
(extraction costs, production costs and smelting costs). Companies know at what commodities prices mining would stop
being a profitable business for them, and there are some companies that would stop operations before others because of
their different operating costs (See Appendix #).
Appendix B8: Competitive advantage analysis
1) Mine cash costs analysis
a) Cash cost for primary silver producers 2015 (US$/Oz Silver equivalent):
b) Cash cost for zinc mines 2015 (USc/lb Zn):
Source: Company Filings
Source: Company Filings
23

2) Mines reserve replenishment history
3) Mine production by metal
Mine 1996 1997 1998 1999 2000 2001 2002 2003 2004 2005 2006 2007 2008 2009 2010 2011 2012 2013 2014 2015
NAICA 7 8 7 7 8 6 7 5 3 4 5 8 11 11 8 16 19 14 15 5
SABINAS 21 25 23 17 28 30 23 12 15 10 10 11 11 11 11 12 13 11 10 13
BISMARK 9 9 5 6 5 7 3 2 1 2 2 4 5 5 8 10 10 8 7 5
TIZAPA 15 11 8 7 5 5 3 3 3 4 3 12 17 22 19 14 14 14 13 12
MADERO 14 14 11 8 11 11 11 13 15 13 15 18 17 16 14
VELARDEÑA 15 16 17 16
MILPILLAS 19 38 27 22 16 12 10 10 8 8
FRESNILLO 11 10 9 9 10 8 9 9 8 8 7 11 12 12 13 13 13 12 10 8
CIÉNEGA 10 10 8 8 12 15 14 15 18 11 10 11 13 14 11 14 17 12 11 10
SAUCITO 3 11 9 6 5
HERRADURA 15 9 6 5 7 5 8 10 12 11 12 12 10 7 7 4 9 9
SOLEDAD-DIPOLOS 6 4 3
NOCHE BUENA 5 3 4 3
AVERAGE 12 12 11 9 10 11 10 8 8 7 8 13 13 14 12 11 12 11 10 9
0
100
200
300
400
500
600
700
800
900
2004
2005
2006
2007
2008
2009
2010
2011
2012
2013
2014
2015
kOz
Gold
0
10
20
30
40
50
60
2004
2005
2006
2007
2008
2009
2010
2011
2012
2013
2014
2015
MOz
Silver
0
50
100
150
200
250
300
2004
2005
2006
2007
2008
2009
2010
2011
2012
2013
2014
2015
kton
Zinc
0
10
20
30
40
50
60
70
80
90
2004
2005
2006
2007
2008
2009
2010
2011
2012
2013
2014
2015
kton
Lead
Source: Company Filings
24

4) Peñoles’ mines and third party mines contribution to refined production
0
5
10
15
20
25
30
35
40
45
2004
2005
2006
2007
2008
2009
2010
2011
2012
2013
2014
2015
kton
Copper
41%50% 53% 51% 48%
62%
59%50% 47% 49% 52%
38%
11 12 13 14 15 3Q '16
Go
ld
Year
Peñoles Third Parties
45%38%
57%65% 59% 64%
55%62%
43%35% 41% 36%
11 12 13 14 15 3Q '16
Sil
ve
r
Year
Peñoles Third Parties
41% 42% 48%58% 54% 56%
59% 58% 52%42% 46% 44%
11 12 13 14 15 3Q '16
Le
ad
Year
Peñoles Third Parties
63% 60%70% 74%
80% 84%
37% 40%30% 26%
20% 16%
11 12 13 14 15 3Q '16
Zin
c
Year
Peñoles Third Parties
Source: Company Filings
Source: Company Filings
25

5) Mine projects pipeline
Precious metals segment (Fresnillo PLC) projects pipeline:
Source: Company Filings
Base metals segment projects pipeline:
Humos (Sonora): copper, advanced exploration, estimated startup of operations: 2022.
La Industria (Durango): lead, zinc and silver, advanced explorations.
Rey de Plata (Guerrero): polymetallic, under construction, investment US$ 296.0 million, estimated startup of
operations: 2018.
Racaycocha (Peru): copper-molybdenum, estimated startup of operations: 2022.
Chile: gold and copper, continuous exploration.
6) Geographical localization of mines and offices
Source: Company Filings
26

Appendix B9: Industrias Peñoles’ Shareholders (PE&OLES)
Appendix B10: Macroeconomic Overview
Federal Reserve Economic Projections (Dec 14, 2016):
Figure A9.1: Summary of economic projections released by in the FOMC minutes
Source: Federal Reserve
Figure A9.2: FOMC participants’ assessment of appropriate monetary policy
Note: Each dot represents a prediction of the federal funds target rate by a member of the Federal Open Market Committee (FOMC).
Source: Federal Reserve
HolderCommon Stock
Equivalent Held
% of Total Shares
Outstanding
Market Value
(MXN in mm)*Position Date
González, Alberto Baillères 140,539,312 35.36 53,915.10 Dec-31-2015
Albacor, S.A. De C.V. 132,980,278 33.46 51,015.30 Dec-31-2015
BlackRock, Inc. 12,966,096 3.26 4,974.20 Nov-30-2016
First Eagle Investment Management, LLC 11,111,145 2.8 4,262.60 Sep-30-2016
The Vanguard Group, Inc. 3,843,639 0.97 1,474.50 Aug-31-2016
* Market value is calculated using the closing price 383.63 MXN as of Dec-22-2016.
Source: S&P Capital IQ
27

Figure A9.3: Medians, central tendencies, and ranges of economic projections, 2016-19 and over the long run
Source: Federal Reserve
Appendix B11: U.S. Dollar and Precious Metals’ spot prices
The usual justification behind investing in a commodity is to capture a price movement of a particular raw material, nonetheless it is
principally driven by the underlying supply and demand fundamentals. As stated before, supply and demand encompass economic,
geo-political, social and industrial factors. Additionally, exchange rates and currency parity relations play a major role as global
production and consumption is distributed differently amongst each of the regions.
28
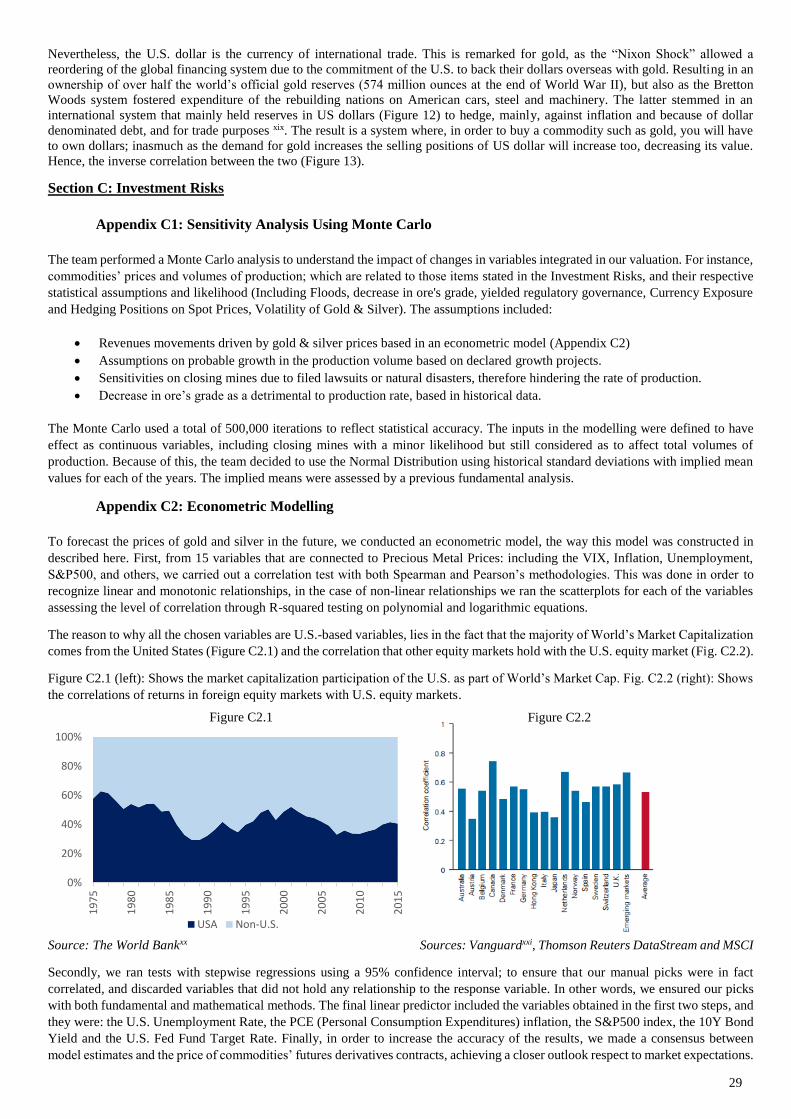
Nevertheless, the U.S. dollar is the currency of international trade. This is remarked for gold, as the “Nixon Shock” allowed a
reordering of the global financing system due to the commitment of the U.S. to back their dollars overseas with gold. Resulting in an
ownership of over half the world’s official gold reserves (574 million ounces at the end of World War II), but also as the Bretton
Woods system fostered expenditure of the rebuilding nations on American cars, steel and machinery. The latter stemmed in an
international system that mainly held reserves in US dollars (Figure 12) to hedge, mainly, against inflation and because of dollar
denominated debt, and for trade purposes xix. The result is a system where, in order to buy a commodity such as gold, you will have
to own dollars; inasmuch as the demand for gold increases the selling positions of US dollar will increase too, decreasing its value.
Hence, the inverse correlation between the two (Figure 13).
Section C: Investment Risks
Appendix C1: Sensitivity Analysis Using Monte Carlo
The team performed a Monte Carlo analysis to understand the impact of changes in variables integrated in our valuation. For instance,
commodities’ prices and volumes of production; which are related to those items stated in the Investment Risks, and their respective
statistical assumptions and likelihood (Including Floods, decrease in ore's grade, yielded regulatory governance, Currency Exposure
and Hedging Positions on Spot Prices, Volatility of Gold & Silver). The assumptions included:
Revenues movements driven by gold & silver prices based in an econometric model (Appendix C2)
Assumptions on probable growth in the production volume based on declared growth projects.
Sensitivities on closing mines due to filed lawsuits or natural disasters, therefore hindering the rate of production.
Decrease in ore’s grade as a detrimental to production rate, based in historical data.
The Monte Carlo used a total of 500,000 iterations to reflect statistical accuracy. The inputs in the modelling were defined to have
effect as continuous variables, including closing mines with a minor likelihood but still considered as to affect total volumes of
production. Because of this, the team decided to use the Normal Distribution using historical standard deviations with implied mean
values for each of the years. The implied means were assessed by a previous fundamental analysis.
Appendix C2: Econometric Modelling
To forecast the prices of gold and silver in the future, we conducted an econometric model, the way this model was constructed in
described here. First, from 15 variables that are connected to Precious Metal Prices: including the VIX, Inflation, Unemployment,
S&P500, and others, we carried out a correlation test with both Spearman and Pearson’s methodologies. This was done in order to
recognize linear and monotonic relationships, in the case of non-linear relationships we ran the scatterplots for each of the variables
assessing the level of correlation through R-squared testing on polynomial and logarithmic equations.
The reason to why all the chosen variables are U.S.-based variables, lies in the fact that the majority of World’s Market Capitalization
comes from the United States (Figure C2.1) and the correlation that other equity markets hold with the U.S. equity market (Fig. C2.2).
Figure C2.1 (left): Shows the market capitalization participation of the U.S. as part of World’s Market Cap. Fig. C2.2 (right): Shows
the correlations of returns in foreign equity markets with U.S. equity markets.
Source: The World Bankxx Sources: Vanguardxxi, Thomson Reuters DataStream and MSCI
Secondly, we ran tests with stepwise regressions using a 95% confidence interval; to ensure that our manual picks were in fact
correlated, and discarded variables that did not hold any relationship to the response variable. In other words, we ensured our picks
with both fundamental and mathematical methods. The final linear predictor included the variables obtained in the first two steps, and
they were: the U.S. Unemployment Rate, the PCE (Personal Consumption Expenditures) inflation, the S&P500 index, the 10Y Bond
Yield and the U.S. Fed Fund Target Rate. Finally, in order to increase the accuracy of the results, we made a consensus between
model estimates and the price of commodities’ futures derivatives contracts, achieving a closer outlook respect to market expectations.
0%
20%
40%
60%
80%
100%
19
75
19
80
19
85
19
90
19
95
20
00
20
05
20
10
20
15
USA Non-U.S.
Figure C2.1
Figure C2.2
29

Endnotes
i 2015 Annual Information Form. Industrias Peñoles, S.A.B. de C.V. ii 2015 Annual Report. Industrias Peñoles, S.A.B. de C.V. iii Gold Investor. World Gold Council. October, 2016. ivEconomic projections of Federal Reserve Board members and Federal Reserve Bank presidents under
their individual assessments of projected appropriate monetary policy, December 2016. Federal Reserve. December 14,
2016 v “2016 Global Metals & Mining Conference”. Nyrstar. May 12, 2016. vi “Metals Market Update and Outlook”. Thomson Reuters Report, July 2016. vii “China smelters face lowest fees in four years as zinc market tightens”. Burton, Melanie. Reuters Commodities. Aug
18, 2016. viii “METALS-Lead rises to 16-month high on tighter supply, nickel slips”. Serapio, Manolo. Reuters. Sep 29, 2016. ix “Is the Gloom Lifting for Base Metals?” Base Metals Team. Thomson Reuters. October 26, 2016. x Press Release. Board of Governance of the Federal Reserve System. Federal Reserve. December 14, 2016. xi “Ford Cancels Plans for New $1.6 Billion Mexico Plant”. Naughton, Keith. Bloomberg. January 3, 2017. xii “Fiat Chrysler plants in Mexico may close if Trump enacts import tax, CEO says”. Rushe, Dominic. The Guardian.
January 9, 2017. xiii “How General Motors Plans to Create Thousands of U.S. Jobs”. Korosec, Kristen. Fortune. January 17, 2017. xiv Historical Implied Equity Risk Premiums. Damodaran, Aswath. NYU Stern. January, 2017. xv Country Default Spreads and Risk Premiums. Damodaran, Aswath. NYU Stern. January, 2017. xvi “Mexico’s drug cartels make millions robbing multinational corporations”. Grillo, Ioan, Global Post. Los Angeles
Daily News. April 22, 2015. xvii Q3 2016 Report. Industrias Peñoles, S.A.B. de C.V. xviii UPDATE 1-Penoles suspends operations at Naica mine in northern Mexico. Market News. Thomson Reuters.
October 13, 2015. xix “The Nixon Shock”. Lowenstein, R. Bloomberg August 04, 2011. xx Market capitalization of listed domestic companies (current US$). World Federation of Exchanges database. World
Bank. January 2017. xxi Global equities: Balancing home bias and diversification. B. Philips, Christopher, CFA. Vanguard Research.
Vanguard. February 2014.
30

Disclosures: Ownership and material conflicts of interest:
The author(s), or a member of their household, of this report does not hold a financial interest in the securities of this company.
The author(s), or a member of their household, of this report does not know of the existence of any conflicts of interest that might bias
the content or publication of this report.
Receipt of compensation:
Compensation of the author(s) of this report is not based on investment banking revenue.
Position as a officer or director:
The author(s), or a member of their household, does not serve as an officer, director or advisory board member of the subject
company.
Market making:
The author(s) does not act as a market maker in the subject company’s securities.
Disclaimer:
The information set forth herein has been obtained or derived from sources generally available to the public and believed by the
author(s) to be reliable, but the author(s) does not make any representation or warranty, express or implied, as to its accuracy or
completeness. The information is not intended to be used as the basis of any investment decisions by any person or entity. This
information does not constitute investment advice, nor is it an offer or a solicitation of an offer to buy or sell any security. This report
should not be considered to be a recommendation by any individual affiliated with CFA Mexico, CFA Institute or the CFA Institute
Research Challenge with regard to this company’s stock.
CFA Institute Research Challenge