certification of levies and revenues - … · certification of levies and revenues as of january 1,...
TRANSCRIPT
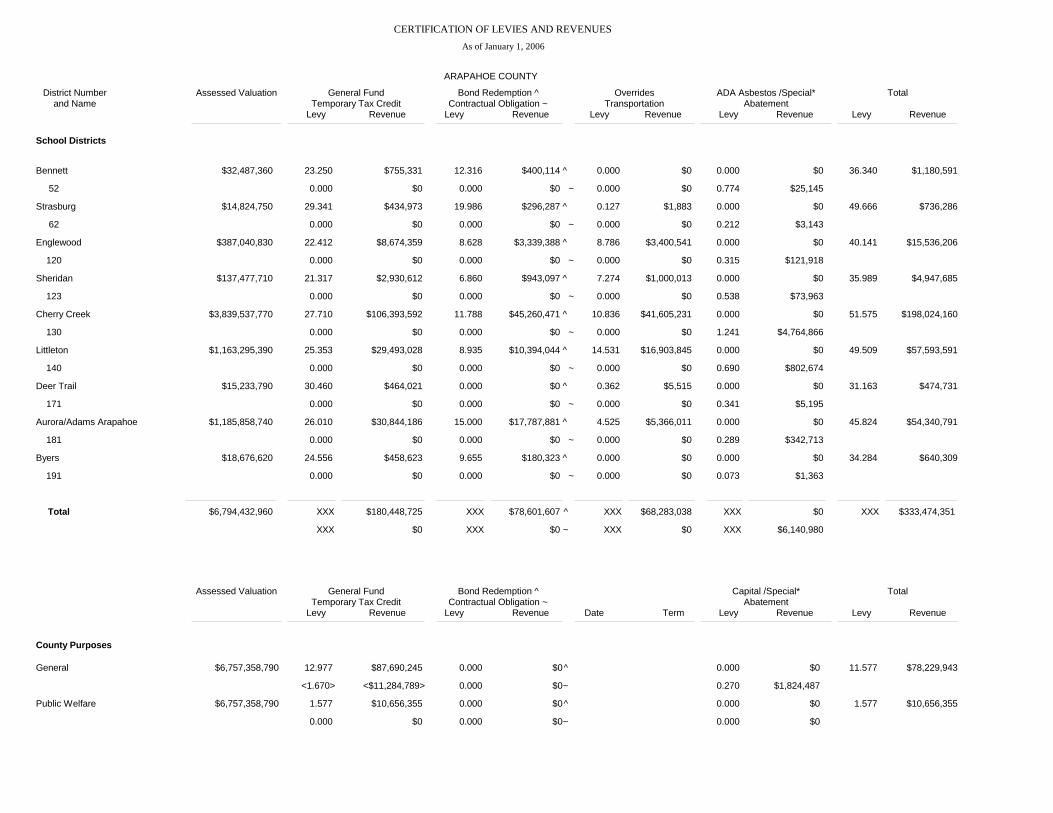
CERTIFICATION OF LEVIES AND REVENUESAs of January 1, 2006
ARAPAHOE COUNTY
School Districts
Bennett
Strasburg
Englewood
Sheridan
Cherry Creek
Littleton
Deer Trail
Aurora/Adams Arapahoe
Byers
District Numberand Name
52
62
120
123
130
140
171
181
191
$32,487,360
$14,824,750
$387,040,830
$137,477,710
$3,839,537,770
$1,163,295,390
$15,233,790
$1,185,858,740
$18,676,620
Assessed Valuation
23.250
29.341
22.412
21.317
27.710
25.353
30.460
26.010
24.556
General FundTemporary Tax Credit
Levy Revenue
0.000
0.000
0.000
0.000
0.000
0.000
0.000
0.000
0.000
12.316
19.986
8.628
6.860
11.788
8.935
0.000
15.000
9.655
Bond Redemption ^ Contractual Obligation ~Levy Revenue
0.000
0.000
0.000
0.000
0.000
0.000
0.000
0.000
0.000
0.000
0.127
8.786
7.274
10.836
14.531
0.362
4.525
0.000
OverridesTransportation
Levy Revenue
0.000
0.000
0.000
0.000
0.000
0.000
0.000
0.000
0.000
0.000
0.000
0.000
0.000
0.000
0.000
0.000
0.000
0.000
ADA Asbestos /Special*Abatement
Levy Revenue
0.774
0.212
0.315
0.538
1.241
0.690
0.341
0.289
0.073
36.340
49.666
40.141
35.989
51.575
49.509
31.163
45.824
34.284
Total
Levy Revenue
$755,331
$434,973
$8,674,359
$2,930,612
$106,393,592
$29,493,028
$464,021
$30,844,186
$458,623
$1,180,591
$736,286
$15,536,206
$4,947,685
$198,024,160
$57,593,591
$474,731
$54,340,791
$640,309
$0
$0
$0
$0
$0
$0
$0
$0
$0
$25,145
$3,143
$121,918
$73,963
$4,764,866
$802,674
$5,195
$342,713
$1,363
$0
$1,883
$3,400,541
$1,000,013
$41,605,231
$16,903,845
$5,515
$5,366,011
$0
$0
$0
$0
$0
$0
$0
$0
$0
$0
$400,114
$296,287
$3,339,388
$943,097
$45,260,471
$10,394,044
$0
$17,787,881
$180,323
$0
$0
$0
$0
$0
$0
$0
$0
$0
$0
$0
$0
$0
$0
$0
$0
$0
$0
County Purposes
General
Public Welfare
$6,757,358,790
$6,757,358,790
12.977
1.577
$87,690,245
$10,656,355
<1.670>
0.000
<$11,284,789>
$0
0.000
0.000
0.000
0.000
$0
$0
$0
$0
0.000
0.000
0.270
0.000
$0
$0
$1,824,487
$0
11.577
1.577
$78,229,943
$10,656,355
^
^
^
^
^
^
^
^
^
~
~
~
~
~
~
~
~
~
^
^
~
~
Total $6,794,432,960 XXX
XXX
$180,448,725
$0
XXX
XXX
$78,601,607
$0
^
~
XXX
XXX
$68,283,038
$0
XXX
XXX
$0
$6,140,980
XXX $333,474,351
Assessed Valuation General FundTemporary Tax Credit
Levy Revenue
Bond Redemption ^ Contractual Obligation ~Levy Revenue Date Term
Capital /Special*Abatement
Levy Revenue
Total
Levy Revenue

County Purposes
Developmental Disabilities
Road And Bridge
Capital Expenditures
$6,757,358,790
$6,757,358,790
$6,757,358,790
1.000
0.872
0.395
$6,757,359
$5,892,417
$2,669,157
0.000
0.000
0.000
$0
$0
$0
0.000
0.000
0.000
0.000
0.000
0.000
$0
$0
$0
$0
$0
$0
0.000
0.000
0.000
0.000
0.000
0.000
$0
$0
$0
$0
$0
$0
1.000
0.872
0.395
$6,757,359
$5,892,417
$2,669,157
$6,718,283,280 16.821
<1.670>
$113,008,243
<$11,219,533>
0.000
0.000
$0
0.000
0.000
0.270
$0
$1,813,936
15.421 $103,602,646
Cities and Towns
14020,14021,14035
Cherry Hills Village
Columbine Valley
Deer Trail
Glendale
Sheridan
Centennial
Littleton
Aurora
Englewood
$277,453,440
$26,667,780
$3,158,240
$108,670,790
$80,065,750
$1,439,295,450
$526,548,380
$2,227,882,730
$467,534,130
14.722
9.313
17.104
18.670
5.612
4.979
6.662
8.605
5.880
$4,084,670
$248,357
$54,019
$2,028,884
$449,329
$7,166,252
$3,507,865
$19,170,931
$2,749,101
<1.605>
<0.516>
<2.937>
0.000
0.000
0.000
0.000
0.000
0.000
<$445,313>
<$13,761>
<$9,276>
$0
$0
$0
$0
$0
$0
0.000
1.800
0.000
0.000
2.157
0.000
0.000
2.353
2.220
0.000
0.000
0.000
0.000
0.000
0.000
0.000
0.000
0.000
$0
$48,002
$0
$0
$172,702
$0
$0
$5,242,208
$1,037,926
$0
$0
$0
$0
$0
$0
$0
$0
$0
0.000
0.000
0.000
0.000
0.000
0.000
0.000
0.000
0.000
0.000
0.001
0.000
0.000
0.000
0.052
0.000
0.000
0.000
$0
$0
$0
$0
$0
$0
$0
$0
$0
$0
$27
$0
$0
$0
$74,843
$0
$0
$0
13.117
10.598
14.167
18.670
7.769
5.031
6.662
10.958
8.100
$3,639,357
$282,625
$44,743
$2,028,884
$622,031
$7,241,095
$3,507,865
$24,413,139
$3,787,026
^
^
^
~
~
~
^
~
^
^
^
^
^
^
^
^
^
~
~
~
~
~
~
~
~
~
Total
(14020) (14021) (14035)See Footnote No. 41 See Footnote No. 43 Exempt $5,000 actual val P.P.
Assessed Valuation General FundTemporary Tax Credit
Levy Revenue
Bond Redemption ^ Contractual Obligation ~Levy Revenue Date Term
Capital /Special*Abatement
Levy Revenue
Total
Levy Revenue
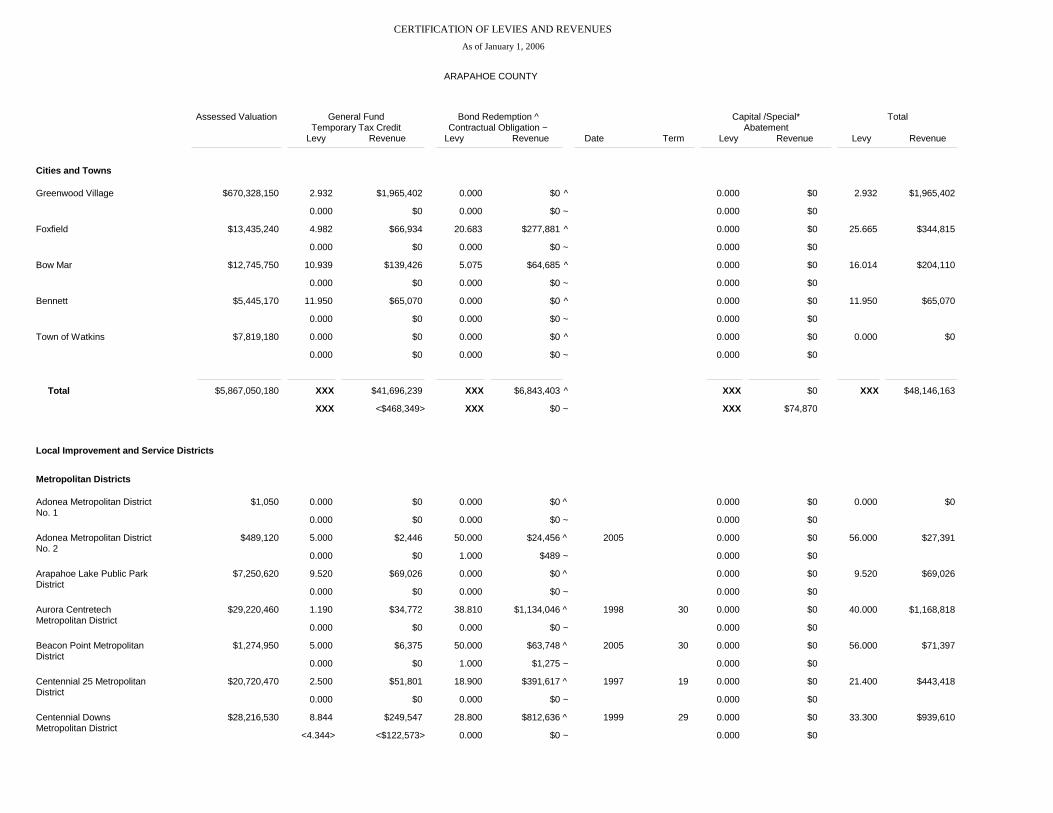
CERTIFICATION OF LEVIES AND REVENUESAs of January 1, 2006
ARAPAHOE COUNTY
Cities and Towns
Greenwood Village
Foxfield
Bow Mar
Bennett
Town of Watkins
$670,328,150
$13,435,240
$12,745,750
$5,445,170
$7,819,180
2.932
4.982
10.939
11.950
0.000
$1,965,402
$66,934
$139,426
$65,070
$0
0.000
0.000
0.000
0.000
0.000
$0
$0
$0
$0
$0
0.000
20.683
5.075
0.000
0.000
0.000
0.000
0.000
0.000
0.000
$0
$277,881
$64,685
$0
$0
$0
$0
$0
$0
$0
0.000
0.000
0.000
0.000
0.000
0.000
0.000
0.000
0.000
0.000
$0
$0
$0
$0
$0
$0
$0
$0
$0
$0
2.932
25.665
16.014
11.950
0.000
$1,965,402
$344,815
$204,110
$65,070
$0
Metropolitan Districts
Local Improvement and Service Districts
Adonea Metropolitan DistrictNo. 1
Adonea Metropolitan DistrictNo. 2
Arapahoe Lake Public ParkDistrict
Aurora CentretechMetropolitan District
Beacon Point MetropolitanDistrict
Centennial 25 MetropolitanDistrict
Centennial DownsMetropolitan District
$1,050
$489,120
$7,250,620
$29,220,460
$1,274,950
$20,720,470
$28,216,530
0.000
5.000
9.520
1.190
5.000
2.500
8.844
$0
$2,446
$69,026
$34,772
$6,375
$51,801
$249,547
0.000
0.000
0.000
0.000
0.000
0.000
<4.344>
$0
$0
$0
$0
$0
$0
<$122,573>
0.000
50.000
0.000
38.810
50.000
18.900
28.800
$0
$24,456
$0
$1,134,046
$63,748
$391,617
$812,636
2005
1998
2005
1997
1999
30
30
19
29
^
^
^
^
^
^
^
^
^
^
^
^
~
~
~
~
~
0.000
1.000
0.000
0.000
1.000
0.000
0.000
$0
$489
$0
$0
$1,275
$0
$0
~
~
~
~
~
~
~
0.000
0.000
0.000
0.000
0.000
0.000
0.000
0.000
0.000
0.000
0.000
0.000
0.000
0.000
$0
$0
$0
$0
$0
$0
$0
$0
$0
$0
$0
$0
$0
$0
0.000
56.000
9.520
40.000
56.000
21.400
33.300
$0
$27,391
$69,026
$1,168,818
$71,397
$443,418
$939,610
Total $5,867,050,180 XXX
XXX
$41,696,239
<$468,349>
XXX
XXX
$6,843,403
$0
^
~
XXX
XXX
$0
$74,870
XXX $48,146,163
Assessed Valuation General FundTemporary Tax Credit
Levy Revenue
Bond Redemption ^ Contractual Obligation ~Levy Revenue Date Term
Capital /Special*Abatement
Levy Revenue
Total
Levy Revenue
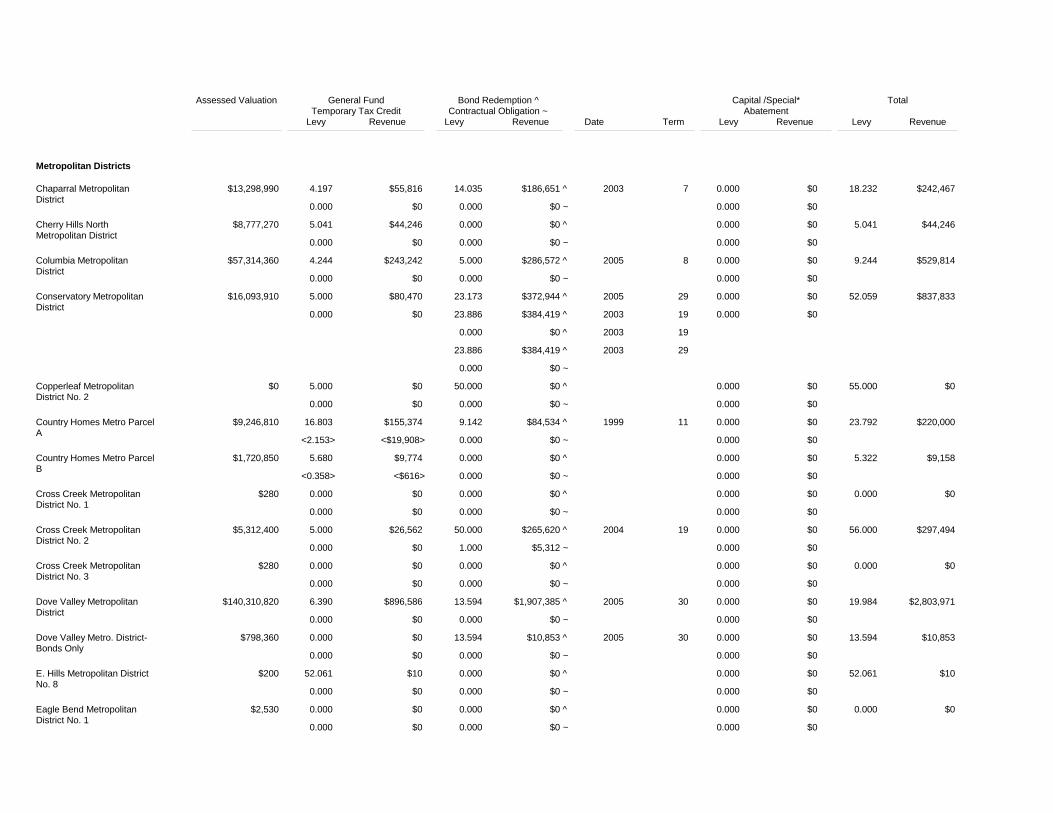
Metropolitan Districts
Chaparral MetropolitanDistrict
Cherry Hills NorthMetropolitan District
Columbia MetropolitanDistrict
Conservatory MetropolitanDistrict
Copperleaf MetropolitanDistrict No. 2
Country Homes Metro ParcelA
Country Homes Metro ParcelB
Cross Creek MetropolitanDistrict No. 1
Cross Creek MetropolitanDistrict No. 2
Cross Creek MetropolitanDistrict No. 3
Dove Valley MetropolitanDistrict
Dove Valley Metro. District-Bonds Only
E. Hills Metropolitan DistrictNo. 8
Eagle Bend MetropolitanDistrict No. 1
$13,298,990
$8,777,270
$57,314,360
$16,093,910
$0
$9,246,810
$1,720,850
$280
$5,312,400
$280
$140,310,820
$798,360
$200
$2,530
4.197
5.041
4.244
5.000
5.000
16.803
5.680
0.000
5.000
0.000
6.390
0.000
52.061
0.000
$55,816
$44,246
$243,242
$80,470
$0
$155,374
$9,774
$0
$26,562
$0
$896,586
$0
$10
$0
0.000
0.000
0.000
0.000
0.000
<2.153>
<0.358>
0.000
0.000
0.000
0.000
0.000
0.000
0.000
$0
$0
$0
$0
$0
<$19,908>
<$616>
$0
$0
$0
$0
$0
$0
$0
14.035
0.000
5.000
23.173
23.886
0.000
23.886
50.000
9.142
0.000
0.000
50.000
0.000
13.594
13.594
0.000
0.000
$186,651
$0
$286,572
$372,944
$384,419
$0
$384,419
$0
$84,534
$0
$0
$265,620
$0
$1,907,385
$10,853
$0
$0
2003
2005
2005
2003
2003
2003
1999
2004
2005
2005
7
8
29
19
19
29
11
19
30
30
^
^
^
^
^
^
^
^
^
^
^
^
^
^
^
^
^
0.000
0.000
0.000
0.000
0.000
0.000
0.000
0.000
1.000
0.000
0.000
0.000
0.000
0.000
$0
$0
$0
$0
$0
$0
$0
$0
$5,312
$0
$0
$0
$0
$0
~
~
~
~
~
~
~
~
~
~
~
~
~
~
0.000
0.000
0.000
0.000
0.000
0.000
0.000
0.000
0.000
0.000
0.000
0.000
0.000
0.000
0.000
0.000
0.000
0.000
0.000
0.000
0.000
0.000
0.000
0.000
0.000
0.000
0.000
0.000
$0
$0
$0
$0
$0
$0
$0
$0
$0
$0
$0
$0
$0
$0
$0
$0
$0
$0
$0
$0
$0
$0
$0
$0
$0
$0
$0
$0
18.232
5.041
9.244
52.059
55.000
23.792
5.322
0.000
56.000
0.000
19.984
13.594
52.061
0.000
$242,467
$44,246
$529,814
$837,833
$0
$220,000
$9,158
$0
$297,494
$0
$2,803,971
$10,853
$10
$0
Assessed Valuation General FundTemporary Tax Credit
Levy Revenue
Bond Redemption ^ Contractual Obligation ~Levy Revenue Date Term
Capital /Special*Abatement
Levy Revenue
Total
Levy Revenue

CERTIFICATION OF LEVIES AND REVENUESAs of January 1, 2006
ARAPAHOE COUNTY
Metropolitan Districts
Eagle Bend MetropolitanDistrict No. 2
East Arapahoe MetropolitanDistrict
East Plains MetropolitanDistrict
East Quincy HighlandsMetro. District
East Smoky Hill Metro.District #1
East Smoky Hill Metro.District #2
East Valley MetropolitanDistrict
Eastern Hills MetropolitanDist. No. 1
Eastern Hills MetropolitanDist. No. 2
Eastern Hills MetropolitanDist. No. 3
Eastern Hills MetropolitanDist. No. 4
Eastern Hills MetropolitanDist. No. 5
Eastern Hills MetropolitanDist. No. 6
Eastern Hills MetropolitanDist. No. 7
$48,031,750
$3,499,030
$11,520
$8,830,170
$11,062,900
$44,419,490
$3,338,140
$200
$35,040
$7,550
$29,830
$42,450
$30,580
$8,430
10.000
9.792
0.000
4.000
3.449
3.500
8.079
0.000
52.061
52.061
52.061
52.061
52.061
52.061
$480,318
$34,263
$0
$35,321
$38,156
$155,468
$26,969
$0
$1,824
$393
$1,553
$2,210
$1,592
$439
0.000
<0.552>
0.000
0.000
0.000
0.000
0.000
0.000
0.000
0.000
0.000
0.000
0.000
0.000
$0
<$1,931>
$0
$0
$0
$0
$0
$0
$0
$0
$0
$0
$0
$0
13.000
24.000
5.000
0.000
0.000
20.000
31.036
11.500
0.000
0.000
0.000
0.000
0.000
0.000
0.000
0.000
$624,413
$1,152,762
$240,159
$0
$0
$176,603
$343,348
$510,824
$0
$0
$0
$0
$0
$0
$0
$0
2005
2003
2004
2005
2001
2002
30
30
16
26
21
28
^
^
^
^
^
^
^
^
^
^
^
^
^
^
^
^
0.000
0.000
0.000
0.000
0.000
0.000
0.000
0.000
0.000
0.000
0.000
0.000
0.000
0.000
$0
$0
$0
$0
$0
$0
$0
$0
$0
$0
$0
$0
$0
$0
~
~
~
~
~
~
~
~
~
~
~
~
~
~
0.000
0.000
0.000
0.000
0.000
0.000
0.000
0.000
0.000
0.000
0.000
0.000
0.000
0.000
0.000
0.000
0.000
0.000
0.000
0.000
0.000
0.000
0.000
0.000
0.000
0.000
0.000
0.000
$0
$0
$0
$0
$0
$0
$0
$0
$0
$0
$0
$0
$0
$0
$0
$0
$0
$0
$0
$0
$0
$0
$0
$0
$0
$0
$0
$0
52.000
9.240
0.000
24.000
34.485
15.000
8.079
0.000
52.061
52.061
52.061
52.061
52.061
52.061
$2,497,651
$32,331
$0
$211,924
$381,504
$666,292
$26,969
$0
$1,824
$393
$1,553
$2,210
$1,592
$439
Assessed Valuation General FundTemporary Tax Credit
Levy Revenue
Bond Redemption ^ Contractual Obligation ~Levy Revenue Date Term
Capital /Special*Abatement
Levy Revenue
Total
Levy Revenue

Metropolitan Districts
Estancia Metropolitan District
Foxfield Metropolitan DistrictNo. 1
Galleria Metro
Galleria Metro Bonds Only
Goldsmith Metro
Goldsmith Metro - Bond
Goldsmith Metro. Dist. BlockK Subarea
Goodman MetropolitanDistrict
Greenwood Athletic ClubMetro. District
Greenwood MetropolitanDistrict
Greenwood NorthMetropolitan District
Greenwood South Metro
Heather GardensMetropolitan District
$17,320
$800,270
$1,661,120
$6,318,040
$164,865,860
$19,018,070
$1,775,860
$45,463,970
$400,360
$57,821,400
$21,545,980
$172,847,990
$31,273,110
5.000
40.000
20.000
0.000
6.180
0.000
60.000
3.000
0.000
4.890
4.550
4.526
0.000
$87
$32,011
$33,222
$0
$1,018,871
$0
$106,552
$136,392
$0
$282,747
$98,034
$782,310
$0
0.000
0.000
0.000
0.000
0.000
0.000
0.000
0.000
0.000
0.000
0.000
0.000
0.000
$0
$0
$0
$0
$0
$0
$0
$0
$0
$0
$0
$0
$0
45.000
0.000
45.000
0.000
45.000
8.986
0.493
1.094
0.000
8.986
0.493
1.094
0.000
16.000
0.000
8.500
0.000
0.000
8.103
$779
$0
$74,750
$0
$284,312
$1,481,485
$81,279
$180,363
$0
$170,896
$9,376
$20,806
$0
$727,424
$0
$491,482
$0
$0
$253,406
1999
2005
1999
1992
1997
2002
2004
1992
1997
2002
1999
1996
2/15/98
20
3
20
20
19
10
30
20
19
10
20
15
12
^
^
^
^
^
^
^
^
^
^
^
^
^
^
^
^
^
^
^
0.000
0.000
0.000
0.000
0.000
0.000
30.000
0.000
0.000
0.000
0.000
0.000
0.000
$0
$0
$0
$0
$0
$0
$53,276
$0
$0
$0
$0
$0
$0
~
~
~
~
~
~
~
~
~
~
~
~
~
2004 30
0.000
0.000
0.000
0.000
0.000
0.000
0.000
0.000
0.000
0.000
0.000
0.000
0.000
0.000
0.000
0.000
0.000
0.247
0.000
0.000
0.000
0.000
0.695
0.306
0.289
0.000
$0
$0
$0
$0
$0
$0
$0
$0
$0
$0
$0
$0
$0
$0
$0
$0
$0
$40,722
$0
$0
$0
$0
$40,186
$6,593
$49,953
$0
50.000
40.000
65.000
45.000
17.000
10.573
90.000
19.000
0.000
14.085
4.856
4.815
8.103
$866
$32,011
$107,973
$284,312
$2,802,720
$201,078
$159,827
$863,815
$0
$814,414
$104,627
$832,263
$253,406
Assessed Valuation General FundTemporary Tax Credit
Levy Revenue
Bond Redemption ^ Contractual Obligation ~Levy Revenue Date Term
Capital /Special*Abatement
Levy Revenue
Total
Levy Revenue
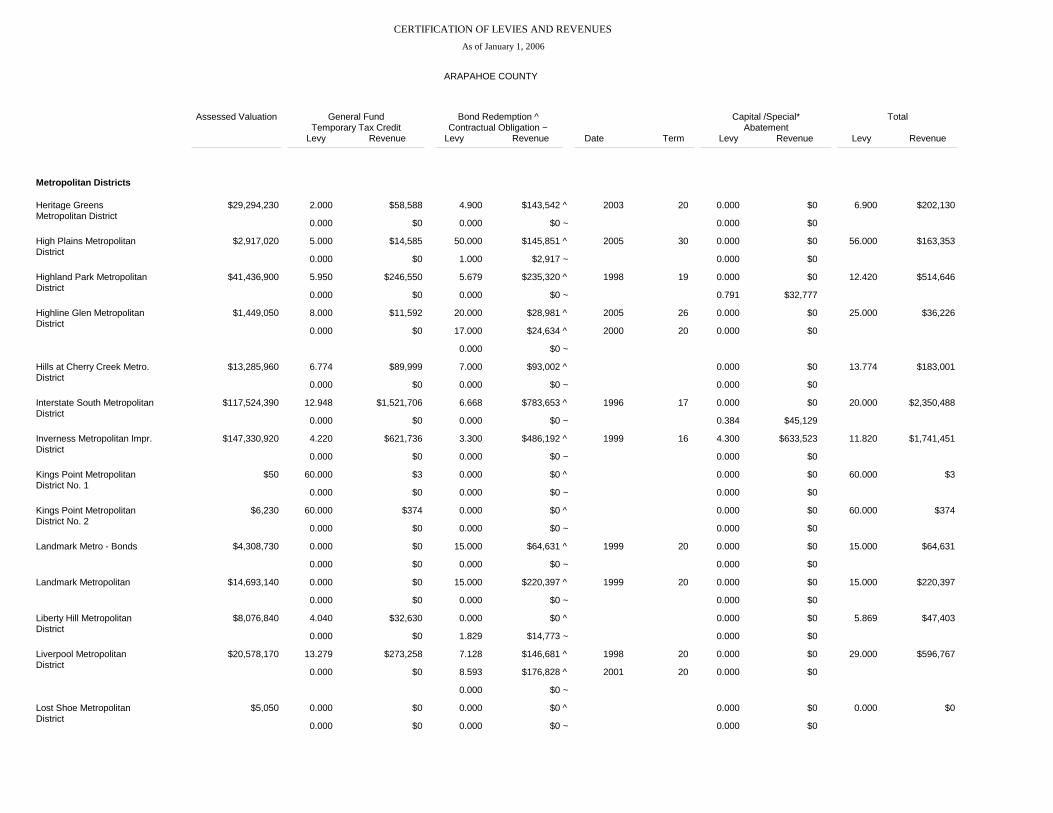
CERTIFICATION OF LEVIES AND REVENUESAs of January 1, 2006
ARAPAHOE COUNTY
Metropolitan Districts
Heritage GreensMetropolitan District
High Plains MetropolitanDistrict
Highland Park MetropolitanDistrict
Highline Glen MetropolitanDistrict
Hills at Cherry Creek Metro.District
Interstate South MetropolitanDistrict
Inverness Metropolitan Impr.District
Kings Point MetropolitanDistrict No. 1
Kings Point MetropolitanDistrict No. 2
Landmark Metro - Bonds
Landmark Metropolitan
Liberty Hill MetropolitanDistrict
Liverpool MetropolitanDistrict
Lost Shoe MetropolitanDistrict
$29,294,230
$2,917,020
$41,436,900
$1,449,050
$13,285,960
$117,524,390
$147,330,920
$50
$6,230
$4,308,730
$14,693,140
$8,076,840
$20,578,170
$5,050
2.000
5.000
5.950
8.000
6.774
12.948
4.220
60.000
60.000
0.000
0.000
4.040
13.279
0.000
$58,588
$14,585
$246,550
$11,592
$89,999
$1,521,706
$621,736
$3
$374
$0
$0
$32,630
$273,258
$0
0.000
0.000
0.000
0.000
0.000
0.000
0.000
0.000
0.000
0.000
0.000
0.000
0.000
0.000
$0
$0
$0
$0
$0
$0
$0
$0
$0
$0
$0
$0
$0
$0
4.900
50.000
5.679
20.000
17.000
7.000
6.668
3.300
0.000
0.000
15.000
15.000
0.000
7.128
8.593
0.000
$143,542
$145,851
$235,320
$28,981
$24,634
$93,002
$783,653
$486,192
$0
$0
$64,631
$220,397
$0
$146,681
$176,828
$0
2003
2005
1998
2005
2000
1996
1999
1999
1999
1998
2001
20
30
19
26
20
17
16
20
20
20
20
^
^
^
^
^
^
^
^
^
^
^
^
^
^
^
^
0.000
1.000
0.000
0.000
0.000
0.000
0.000
0.000
0.000
0.000
0.000
1.829
0.000
0.000
$0
$2,917
$0
$0
$0
$0
$0
$0
$0
$0
$0
$14,773
$0
$0
~
~
~
~
~
~
~
~
~
~
~
~
~
~
0.000
0.000
0.000
0.000
0.000
0.000
4.300
0.000
0.000
0.000
0.000
0.000
0.000
0.000
0.000
0.000
0.791
0.000
0.000
0.384
0.000
0.000
0.000
0.000
0.000
0.000
0.000
0.000
$0
$0
$0
$0
$0
$0
$633,523
$0
$0
$0
$0
$0
$0
$0
$0
$0
$32,777
$0
$0
$45,129
$0
$0
$0
$0
$0
$0
$0
$0
6.900
56.000
12.420
25.000
13.774
20.000
11.820
60.000
60.000
15.000
15.000
5.869
29.000
0.000
$202,130
$163,353
$514,646
$36,226
$183,001
$2,350,488
$1,741,451
$3
$374
$64,631
$220,397
$47,403
$596,767
$0
Assessed Valuation General FundTemporary Tax Credit
Levy Revenue
Bond Redemption ^ Contractual Obligation ~Levy Revenue Date Term
Capital /Special*Abatement
Levy Revenue
Total
Levy Revenue

Metropolitan Districts
Murphy Creek MetropolitanDistrict No. 1
Murphy Creek MetropolitanDistrict No. 2
Murphy Creek MetropolitanDistrict No. 3
Oak Park MetropolitanDistrict
Oakesdale MetropolitanDistrict
Orchard Valley MetropolitanDistrict
Panorama MetropolitanDistrict
Panorama Metro. District-Bonds Only
Parker Jordan MetropolitanDistrict
Parkview Metro
Piney Creek MetropolitanDistrict
Piney Creek Village Metro.District
Polo Reserve MetropolitanDistrict
Rangeview MetropolitanDistrict
Saddle Rock MetropolitanDistrict
$161,900
$6,520
$18,134,690
$755,290
$7,773,530
$17,288,530
$38,221,880
$558,510
$54,203,030
$32,265,510
$62,123,410
$5,643,470
$6,057,220
$39,260
$22,148,700
0.000
0.000
5.000
5.000
0.000
4.000
4.000
0.000
5.000
0.000
0.086
2.550
10.731
25.000
5.000
$0
$0
$90,673
$3,776
$0
$69,154
$152,888
$0
$271,015
$0
$5,343
$14,391
$65,000
$982
$110,744
0.000
0.000
0.000
0.000
0.000
0.000
0.000
0.000
0.000
0.000
0.000
0.000
0.000
0.000
0.000
$0
$0
$0
$0
$0
$0
$0
$0
$0
$0
$0
$0
$0
$0
$0
0.000
0.000
35.933
4.067
45.000
0.000
0.000
11.000
11.000
18.530
30.000
5.820
7.750
40.000
21.462
0.000
38.000
$0
$0
$651,634
$73,754
$33,988
$0
$0
$420,441
$6,144
$1,004,382
$967,965
$361,558
$481,456
$225,739
$130,000
$0
$841,651
2006
2004
NA
2000
12/1/2000
2003
1993
1997
2003
2005
2003
2002
27
25
25
25
19
20
10
30
13
29
^
^
^
^
^
^
^
^
^
^
^
^
^
^
^
^
^
0.000
36.000
0.000
30.000
0.000
0.000
0.000
0.000
1.470
0.000
0.000
0.000
0.000
0.000
0.000
$0
$235
$0
$22,659
$0
$0
$0
$0
$79,678
$0
$0
$0
$0
$0
$0
~
~
~
~
~
~
~
~
~
~
~
~
~
~
~
2002
2004
1998
4
11
0.000
0.000
0.000
0.000
0.000
0.000
0.000
0.000
0.000
0.000
0.000
0.000
0.000
0.000
0.000
0.000
0.000
0.000
0.000
0.000
0.000
0.000
0.000
0.000
0.000
0.000
0.000
0.000
0.000
0.000
$0
$0
$0
$0
$0
$0
$0
$0
$0
$0
$0
$0
$0
$0
$0
$0
$0
$0
$0
$0
$0
$0
$0
$0
$0
$0
$0
$0
$0
$0
0.000
36.000
45.000
35.000
0.000
4.000
15.000
11.000
25.000
30.000
13.656
42.550
32.193
25.000
43.000
$0
$235
$816,061
$26,435
$0
$69,154
$573,328
$6,144
$1,355,076
$967,965
$848,357
$240,130
$195,000
$982
$952,394
Assessed Valuation General FundTemporary Tax Credit
Levy Revenue
Bond Redemption ^ Contractual Obligation ~Levy Revenue Date Term
Capital /Special*Abatement
Levy Revenue
Total
Levy Revenue

CERTIFICATION OF LEVIES AND REVENUESAs of January 1, 2006
ARAPAHOE COUNTY
Metropolitan Districts
Saddle Rock S. MetropolitanDistrict #1
Saddle Rock S. MetropolitanDistrict #2
Saddle Rock S. MetropolitanDistrict #3
Saddle Rock S. MetropolitanDistrict #4
Sand Creek Ranch Metro.District #1
Sand Creek Ranch Metro.District #2
Sand Creek Ranch Metro.District #3
Serenity Ridge MetropolitanDistrict #1
Serenity Ridge MetropolitanDistrict #2
Sky Ranch MetropolitanDistrict No. 1
Sky Ranch MetropolitanDistrict No. 2
Sky Ranch MetropolitanDistrict No. 3
Sky Ranch MetropolitanDistrict No. 4
Sky Ranch MetropolitanDistrict No. 5
$15,670
$15,820,970
$9,168,860
$17,930,910
$17,850
$28,910
$16,810
$1,140
$2,396,230
$90
$331,310
$90
$90
$90
0.000
5.000
5.000
5.000
0.000
0.000
0.000
0.000
5.000
0.000
45.000
0.000
0.000
0.000
$0
$79,105
$45,844
$89,655
$0
$0
$0
$0
$11,981
$0
$14,909
$0
$0
$0
0.000
0.000
0.000
0.000
0.000
0.000
0.000
0.000
0.000
0.000
0.000
0.000
0.000
0.000
$0
$0
$0
$0
$0
$0
$0
$0
$0
$0
$0
$0
$0
$0
0.000
23.973
6.027
25.440
4.560
30.000
0.000
0.000
0.000
0.000
43.000
0.000
0.000
0.000
0.000
0.000
$0
$379,276
$95,353
$233,256
$41,810
$537,927
$0
$0
$0
$0
$103,038
$0
$0
$0
$0
$0
2000
2004
2000
2004
2004
2004
19
20
19
30
30
30
^
^
^
^
^
^
^
^
^
^
^
^
^
^
^
^
0.000
0.000
0.000
0.000
0.000
0.000
0.000
0.000
0.000
0.000
0.000
0.000
0.000
0.000
$0
$0
$0
$0
$0
$0
$0
$0
$0
$0
$0
$0
$0
$0
~
~
~
~
~
~
~
~
~
~
~
~
~
~
0.000
0.000
0.000
0.000
0.000
0.000
0.000
0.000
0.000
0.000
0.000
0.000
0.000
0.000
0.000
0.000
0.000
0.000
0.000
0.000
0.000
0.000
0.000
0.000
0.000
0.000
0.000
0.000
$0
$0
$0
$0
$0
$0
$0
$0
$0
$0
$0
$0
$0
$0
$0
$0
$0
$0
$0
$0
$0
$0
$0
$0
$0
$0
$0
$0
0.000
35.000
35.000
35.000
0.000
0.000
0.000
0.000
48.000
0.000
45.000
0.000
0.000
0.000
$0
$553,734
$320,910
$627,582
$0
$0
$0
$0
$115,019
$0
$14,909
$0
$0
$0
Assessed Valuation General FundTemporary Tax Credit
Levy Revenue
Bond Redemption ^ Contractual Obligation ~Levy Revenue Date Term
Capital /Special*Abatement
Levy Revenue
Total
Levy Revenue
Metropolitan Districts
Smoky Hill MetropolitanDistrict
Sorrel Ranch MetropolitanDistrict
SouthPark MetropolitanDistrict
SouthTech MetropolitanDistrict
Southeast Public Impr.Metro. District
Southern MetropolitanDistrict
Southgate Corp Ctr Metro
Southlands MetropolitanDistrict No. 1
Southlands MetropolitanDistrict No. 2
Southshore MetropolitanDistrict No. 1
Southshore MetropolitanDistrict No. 2
Sterling Hills MetropolitanDistrict
Sterling Hills West Metro.District
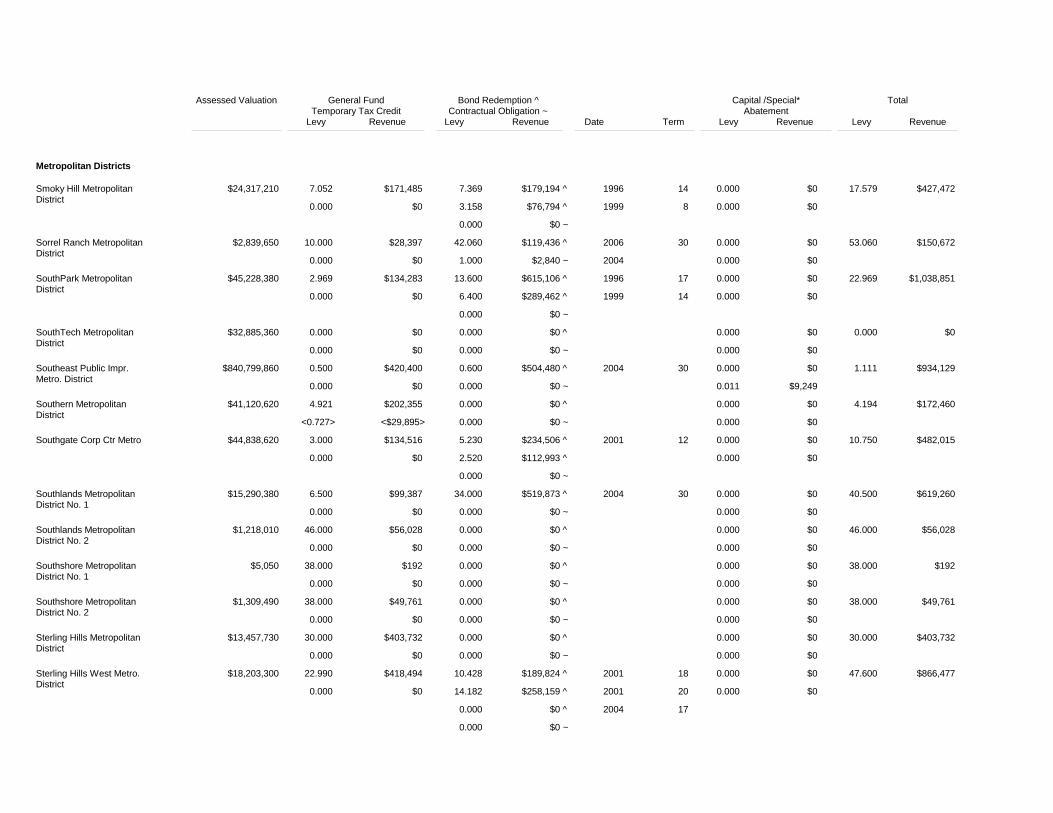
$24,317,210
$2,839,650
$45,228,380
$32,885,360
$840,799,860
$41,120,620
$44,838,620
$15,290,380
$1,218,010
$5,050
$1,309,490
$13,457,730
$18,203,300
7.052
10.000
2.969
0.000
0.500
4.921
3.000
6.500
46.000
38.000
38.000
30.000
22.990
$171,485
$28,397
$134,283
$0
$420,400
$202,355
$134,516
$99,387
$56,028
$192
$49,761
$403,732
$418,494
0.000
0.000
0.000
0.000
0.000
<0.727>
0.000
0.000
0.000
0.000
0.000
0.000
0.000
$0
$0
$0
$0
$0
<$29,895>
$0
$0
$0
$0
$0
$0
$0
7.369
3.158
42.060
13.600
6.400
0.000
0.600
0.000
5.230
2.520
34.000
0.000
0.000
0.000
0.000
10.428
14.182
0.000
$179,194
$76,794
$119,436
$615,106
$289,462
$0
$504,480
$0
$234,506
$112,993
$519,873
$0
$0
$0
$0
$189,824
$258,159
$0
1996
1999
2006
1996
1999
2004
2001
2004
2001
2001
2004
14
8
30
17
14
30
12
30
18
20
17
^
^
^
^
^
^
^
^
^
^
^
^
^
^
^
^
^
^
0.000
1.000
0.000
0.000
0.000
0.000
0.000
0.000
0.000
0.000
0.000
0.000
0.000
$0
$2,840
$0
$0
$0
$0
$0
$0
$0
$0
$0
$0
$0
~
~
~
~
~
~
~
~
~
~
~
~
~
2004
0.000
0.000
0.000
0.000
0.000
0.000
0.000
0.000
0.000
0.000
0.000
0.000
0.000
0.000
0.000
0.000
0.000
0.011
0.000
0.000
0.000
0.000
0.000
0.000
0.000
0.000
$0
$0
$0
$0
$0
$0
$0
$0
$0
$0
$0
$0
$0
$0
$0
$0
$0
$9,249
$0
$0
$0
$0
$0
$0
$0
$0
17.579
53.060
22.969
0.000
1.111
4.194
10.750
40.500
46.000
38.000
38.000
30.000
47.600
$427,472
$150,672
$1,038,851
$0
$934,129
$172,460
$482,015
$619,260
$56,028
$192
$49,761
$403,732
$866,477
Assessed Valuation General FundTemporary Tax Credit
Levy Revenue
Bond Redemption ^ Contractual Obligation ~Levy Revenue Date Term
Capital /Special*Abatement
Levy Revenue
Total
Levy Revenue

CERTIFICATION OF LEVIES AND REVENUESAs of January 1, 2006
ARAPAHOE COUNTY
Metropolitan Districts
Suburban MetropolitanDistrict
Sundance Hills MetropolitanDistrict
Tallgrass MetropolitanDistrict
Tallyn's Reach MetropolitanDistrict #1
Tallyn's Reach MetropolitanDistrict #2
Tallyn's Reach MetropolitanDistrict #3
Tollgate Crossing Metro.District #2
Traditions MetropolitanDistrict No. 1
Traditions MetropolitanDistrict No. 2
Trails at First Creek Metro.Dist. #1
Trails at First Creek Metro.Dist. #2
Valley Club PointeMetropolitan District
Wheatlands MetropolitanDistrict No. 1
Wheatlands MetropolitanDistrict No. 2
Wheatlands MetropolitanDistrict No. 3
$91,630,860
$12,695,370
$8,247,880
$590
$10,540,800
$17,229,090
$7,396,050
$1,120
$990,570
$90
$7,040
$284,190
$10
$1,833,650
$196,840
0.896
2.869
2.482
0.000
0.000
0.000
5.000
0.000
52.060
0.000
0.000
0.000
0.000
5.000
0.000
$82,101
$36,423
$20,471
$0
$0
$0
$36,980
$0
$51,569
$0
$0
$0
$0
$9,168
$0
0.000
0.000
0.000
0.000
0.000
0.000
0.000
0.000
0.000
0.000
0.000
0.000
0.000
0.000
0.000
$0
$0
$0
$0
$0
$0
$0
$0
$0
$0
$0
$0
$0
$0
$0
0.000
4.091
37.750
0.000
48.960
48.960
47.060
0.000
0.000
0.000
0.000
0.000
0.000
41.667
6.650
0.000
$0
$51,937
$311,357
$0
$516,078
$843,536
$348,058
$0
$0
$0
$0
$0
$0
$76,403
$12,194
$0
1999
2004
2004
2004
2004
2005
2006
19
30
19
29
29
30
30
^
^
^
^
^
^
^
^
^
^
^
^
^
^
^
^
0.000
0.000
0.000
0.000
0.000
0.000
0.000
0.000
0.000
0.000
0.000
0.000
0.000
1.000
0.000
$0
$0
$0
$0
$0
$0
$0
$0
$0
$0
$0
$0
$0
$1,834
$0
~
~
~
~
~
~
~
~
~
~
~
~
~
~
~
2005
0.000
0.000
0.000
0.000
0.000
0.000
0.000
0.000
0.000
0.000
0.000
0.000
0.000
0.000
0.000
0.000
0.000
0.000
0.000
0.000
0.000
0.000
0.000
0.000
0.000
0.000
0.000
0.000
0.000
0.000
$0
$0
$0
$0
$0
$0
$0
$0
$0
$0
$0
$0
$0
$0
$0
$0
$0
$0
$0
$0
$0
$0
$0
$0
$0
$0
$0
$0
$0
$0
0.896
6.960
40.232
0.000
48.960
48.960
52.060
0.000
52.060
0.000
0.000
0.000
0.000
54.317
0.000
$82,101
$88,360
$331,829
$0
$516,078
$843,536
$385,038
$0
$51,569
$0
$0
$0
$0
$99,598
$0
Assessed Valuation General FundTemporary Tax Credit
Levy Revenue
Bond Redemption ^ Contractual Obligation ~Levy Revenue Date Term
Capital /Special*Abatement
Levy Revenue
Total
Levy Revenue
Metropolitan Districts
Park & Recreation Districts
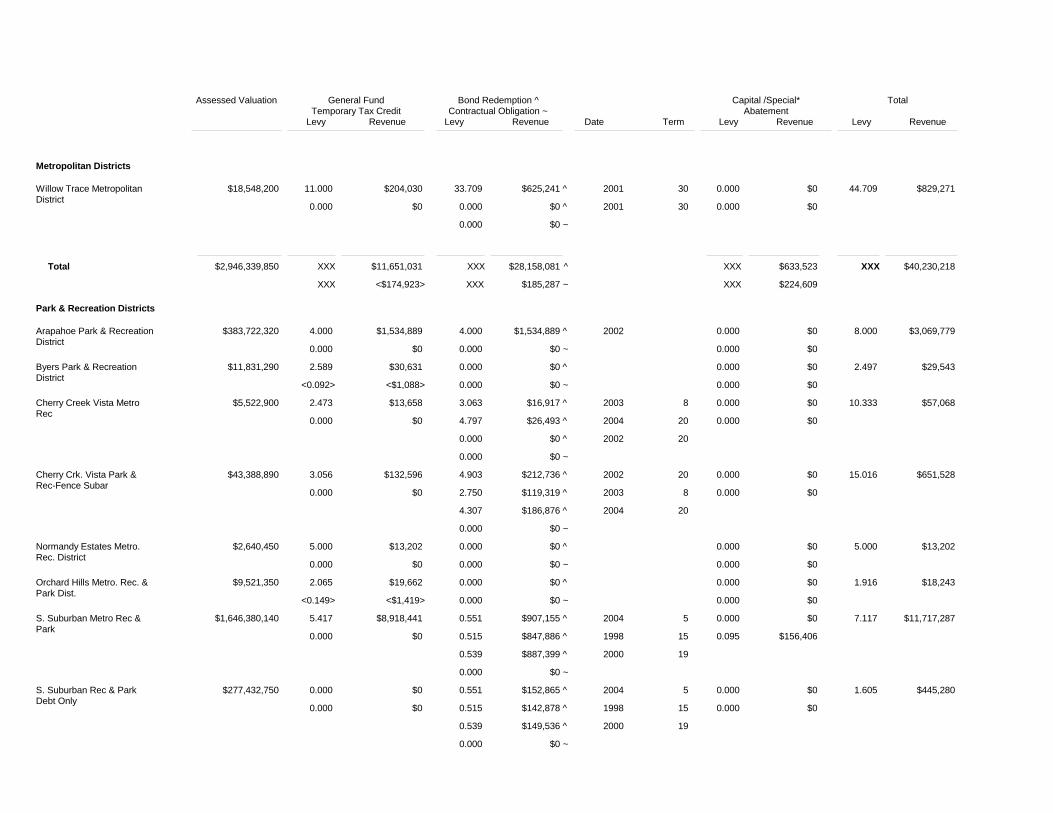
Willow Trace MetropolitanDistrict
Arapahoe Park & RecreationDistrict
Byers Park & RecreationDistrict
Cherry Creek Vista MetroRec
Cherry Crk. Vista Park &Rec-Fence Subar
Normandy Estates Metro.Rec. District
Orchard Hills Metro. Rec. &Park Dist.
S. Suburban Metro Rec &Park
S. Suburban Rec & ParkDebt Only
$18,548,200
$383,722,320
$11,831,290
$5,522,900
$43,388,890
$2,640,450
$9,521,350
$1,646,380,140
$277,432,750
11.000
4.000
2.589
2.473
3.056
5.000
2.065
5.417
0.000
$204,030
$1,534,889
$30,631
$13,658
$132,596
$13,202
$19,662
$8,918,441
$0
0.000
0.000
<0.092>
0.000
0.000
0.000
<0.149>
0.000
0.000
$0
$0
<$1,088>
$0
$0
$0
<$1,419>
$0
$0
33.709
0.000
4.000
0.000
3.063
4.797
0.000
4.903
2.750
4.307
0.000
0.000
0.551
0.515
0.539
0.551
0.515
0.539
$625,241
$0
$1,534,889
$0
$16,917
$26,493
$0
$212,736
$119,319
$186,876
$0
$0
$907,155
$847,886
$887,399
$152,865
$142,878
$149,536
2001
2001
2002
2003
2004
2002
2002
2003
2004
2004
1998
2000
2004
1998
2000
30
30
8
20
20
20
8
20
5
15
19
5
15
19
^
^
^
^
^
^
^
^
^
^
^
^
^
^
^
^
^
^
0.000
0.000
0.000
0.000
0.000
0.000
0.000
0.000
0.000
$0
$0
$0
$0
$0
$0
$0
$0
$0
~
~
~
~
~
~
~
~
~
0.000
0.000
0.000
0.000
0.000
0.000
0.000
0.000
0.000
0.000
0.000
0.000
0.000
0.000
0.000
0.000
0.095
0.000
$0
$0
$0
$0
$0
$0
$0
$0
$0
$0
$0
$0
$0
$0
$0
$0
$156,406
$0
44.709
8.000
2.497
10.333
15.016
5.000
1.916
7.117
1.605
$829,271
$3,069,779
$29,543
$57,068
$651,528
$13,202
$18,243
$11,717,287
$445,280
Total $2,946,339,850 XXX
XXX
$11,651,031
<$174,923>
XXX
XXX
$28,158,081
$185,287
^
~
XXX
XXX
$633,523
$224,609
XXX $40,230,218
Assessed Valuation General FundTemporary Tax Credit
Levy Revenue
Bond Redemption ^ Contractual Obligation ~Levy Revenue Date Term
Capital /Special*Abatement
Levy Revenue
Total
Levy Revenue
CERTIFICATION OF LEVIES AND REVENUESAs of January 1, 2006
ARAPAHOE COUNTY
Park & Recreation Districts
Fire Protection Districts
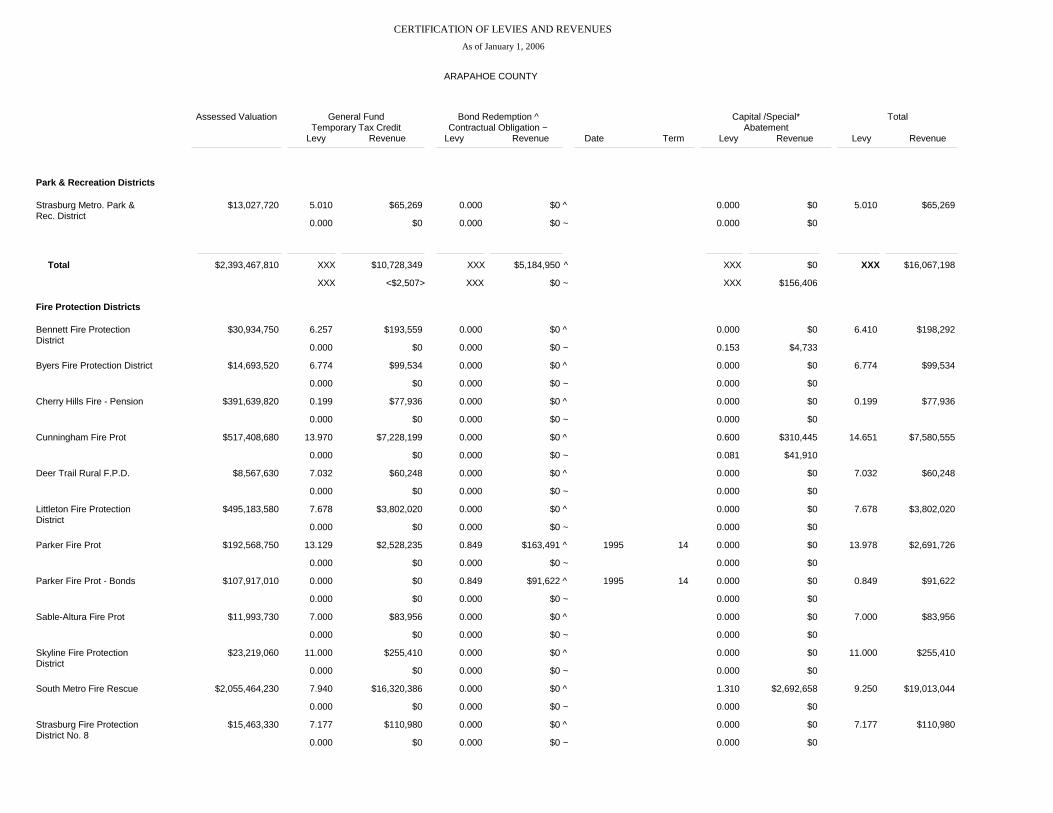
Strasburg Metro. Park &Rec. District
Bennett Fire ProtectionDistrict
Byers Fire Protection District
Cherry Hills Fire - Pension
Cunningham Fire Prot
Deer Trail Rural F.P.D.
Littleton Fire ProtectionDistrict
Parker Fire Prot
Parker Fire Prot - Bonds
Sable-Altura Fire Prot
Skyline Fire ProtectionDistrict
South Metro Fire Rescue
Strasburg Fire ProtectionDistrict No. 8
$13,027,720
$30,934,750
$14,693,520
$391,639,820
$517,408,680
$8,567,630
$495,183,580
$192,568,750
$107,917,010
$11,993,730
$23,219,060
$2,055,464,230
$15,463,330
5.010
6.257
6.774
0.199
13.970
7.032
7.678
13.129
0.000
7.000
11.000
7.940
7.177
$65,269
$193,559
$99,534
$77,936
$7,228,199
$60,248
$3,802,020
$2,528,235
$0
$83,956
$255,410
$16,320,386
$110,980
0.000
0.000
0.000
0.000
0.000
0.000
0.000
0.000
0.000
0.000
0.000
0.000
0.000
$0
$0
$0
$0
$0
$0
$0
$0
$0
$0
$0
$0
$0
0.000
0.000
0.000
0.000
0.000
0.000
0.000
0.849
0.849
0.000
0.000
0.000
0.000
$0
$0
$0
$0
$0
$0
$0
$163,491
$91,622
$0
$0
$0
$0
1995
1995
14
14
^
^
^
^
^
^
^
^
^
^
^
^
^
0.000
0.000
0.000
0.000
0.000
0.000
0.000
0.000
0.000
0.000
0.000
0.000
0.000
$0
$0
$0
$0
$0
$0
$0
$0
$0
$0
$0
$0
$0
~
~
~
~
~
~
~
~
~
~
~
~
~
0.000
0.000
0.000
0.000
0.600
0.000
0.000
0.000
0.000
0.000
0.000
1.310
0.000
0.000
0.153
0.000
0.000
0.081
0.000
0.000
0.000
0.000
0.000
0.000
0.000
0.000
$0
$0
$0
$0
$310,445
$0
$0
$0
$0
$0
$0
$2,692,658
$0
$0
$4,733
$0
$0
$41,910
$0
$0
$0
$0
$0
$0
$0
$0
5.010
6.410
6.774
0.199
14.651
7.032
7.678
13.978
0.849
7.000
11.000
9.250
7.177
$65,269
$198,292
$99,534
$77,936
$7,580,555
$60,248
$3,802,020
$2,691,726
$91,622
$83,956
$255,410
$19,013,044
$110,980
Total $2,393,467,810 XXX
XXX
$10,728,349
<$2,507>
XXX
XXX
$5,184,950
$0
^
~
XXX
XXX
$0
$156,406
XXX $16,067,198
Assessed Valuation General FundTemporary Tax Credit
Levy Revenue
Bond Redemption ^ Contractual Obligation ~Levy Revenue Date Term
Capital /Special*Abatement
Levy Revenue
Total
Levy Revenue

Fire Protection Districts
Sanitation Districts
Water Districts
Cherry Hills VillageSanitation District
Cherryvale Sanitation District
Goldsmith Gulch SanitationDistrict
Sheridan Sanitation District
Sheridan Sanitation DistrictNo. 2
South Arapahoe SanitationDistrict
South Englewood SanitationDistrict #1
Southgate Sanitation District
Valley Sanitation District
Arapahoe Estates WaterDistrict
Charlou Park Water District
$195,023,370
$7,699,640
$137,330,520
$3,055,310
$46,851,280
$320,590,890
$157,428,370
$804,000,220
$45,165,290
$7,719,940
$4,041,210
0.000
1.770
1.500
0.990
0.555
0.000
0.000
0.644
2.493
1.362
0.000
$0
$13,628
$205,996
$3,025
$26,002
$0
$0
$517,776
$112,597
$10,515
$0
0.000
0.000
0.000
0.000
<0.014>
0.000
0.000
0.000
0.000
0.000
0.000
$0
$0
$0
$0
<$656>
$0
$0
$0
$0
$0
$0
0.000
0.000
0.000
0.000
0.000
0.000
0.000
0.000
0.000
14.570
9.900
0.000
$0
$0
$0
$0
$0
$0
$0
$0
$0
$112,480
$76,427
$0
1998
1996
19
21
^
^
^
^
^
^
^
^
^
^
^
^
0.000
0.000
0.000
0.000
0.000
0.000
0.000
0.000
0.000
9.900
0.000
$0
$0
$0
$0
$0
$0
$0
$0
$0
$76,427
$0
~
~
~
~
~
~
~
~
~
~
~
1996 21
0.000
0.000
0.000
0.000
0.000
0.000
0.000
0.000
0.000
0.000
0.000
0.000
0.000
0.070
0.000
0.000
0.000
0.000
0.009
0.000
0.000
0.000
$0
$0
$0
$0
$0
$0
$0
$0
$0
$0
$0
$0
$0
$9,613
$0
$0
$0
$0
$7,236
$0
$0
$0
0.000
1.770
1.570
0.990
0.541
0.000
0.000
0.653
2.493
25.832
0.000
$0
$13,628
$215,609
$3,025
$25,347
$0
$0
$525,012
$112,597
$199,421
$0
Total
Total
$3,865,054,090
$1,717,144,890
XXX
XXX
XXX
XXX
$30,760,463
$879,025
$0
<$656>
XXX
XXX
XXX
XXX
$255,112
$0
$0
$0
^
^
~
~
XXX
XXX
XXX
XXX
$3,003,103
$0
$46,643
$16,849
XXX
XXX
$34,065,321
$895,218
Assessed Valuation General FundTemporary Tax Credit
Levy Revenue
Bond Redemption ^ Contractual Obligation ~Levy Revenue Date Term
Capital /Special*Abatement
Levy Revenue
Total
Levy Revenue

CERTIFICATION OF LEVIES AND REVENUESAs of January 1, 2006
ARAPAHOE COUNTY
Water Districts
Water & Sanitation Districts
Cherry Creek Village WaterDistrict
East Cherry Hills WaterDistrict
Greenwood Plaza WaterDistrict
South-East EnglewoodWater District
Southgate Water
Valley Water District
Willows Water District
Bow Mar Water & SanitationDistrict
Brookridge Hts. Water &San. District
Byers Water & SanitationDistrict
Castlewood Water &Sanitation District A
Castlewood Water &Sanitation District B
Castlewood Water &Sanitation District C
$19,143,940
$5,090,600
$30,008,240
$411,236,050
$725,998,130
$19,751,790
$189,749,570
$11,487,250
$7,368,540
$6,307,360
$310,772,160
$25,827,440
$9,319,170
2.800
0.764
2.500
0.000
0.000
0.000
2.835
8.550
0.392
0.000
0.868
0.593
0.593
$53,603
$3,889
$75,021
$0
$0
$0
$537,940
$98,216
$2,888
$0
$269,750
$15,316
$5,526
<0.204>
0.000
0.000
0.000
0.000
0.000
0.000
0.000
0.000
0.000
0.000
<0.009>
0.000
<$3,905>
$0
$0
$0
$0
$0
$0
$0
$0
$0
$0
<$232>
$0
0.000
0.000
0.000
0.000
0.000
0.000
0.000
0.000
0.000
0.000
0.000
0.000
0.000
$0
$0
$0
$0
$0
$0
$0
$0
$0
$0
$0
$0
$0
^
^
^
^
^
^
^
^
^
^
^
^
^
0.000
0.000
0.000
0.000
0.000
0.000
0.000
0.000
0.000
0.000
0.000
0.000
0.000
$0
$0
$0
$0
$0
$0
$0
$0
$0
$0
$0
$0
$0
~
~
~
~
~
~
~
~
~
~
~
~
~
0.000
0.000
0.000
0.000
0.000
0.000
0.000
0.000
0.000
0.000
0.000
0.000
0.000
0.000
0.000
0.113
0.000
0.000
0.000
0.000
0.000
0.000
0.000
0.000
0.000
0.000
$0
$0
$0
$0
$0
$0
$0
$0
$0
$0
$0
$0
$0
$0
$0
$3,391
$0
$0
$0
$0
$0
$0
$0
$0
$0
$0
2.596
0.764
2.613
0.000
0.000
0.000
2.835
8.550
0.392
0.000
0.868
0.584
0.593
$49,698
$3,889
$78,412
$0
$0
$0
$537,940
$98,216
$2,888
$0
$269,750
$15,083
$5,526
Total $1,412,739,470 XXX
XXX
$680,967
<$3,905>
XXX
XXX
$188,907
$76,427
^
~
XXX
XXX
$0
$3,391
XXX $869,360
Assessed Valuation General FundTemporary Tax Credit
Levy Revenue
Bond Redemption ^ Contractual Obligation ~Levy Revenue Date Term
Capital /Special*Abatement
Levy Revenue
Total
Levy Revenue

Water & Sanitation Districts
Castlewood Water &Sanitation District D
Castlewood Water &Sanitation District E
Cherry Creek Valley Water &Sanitation
Cherry Hills Hts. Water &San. Dist.
Columbine Water &Sanitation District
Devonshire Hts. Water &San. District
E Cherry Creek Valley BWater
E Cherry Creek Valley W &S Bonds
E Cherry Creek Valley Water& San A
Havana Water & San
Hi-Lin Water & SanitationDistrict
Hillcrest Water & SanitationDistrict
Holly Hills Water &Sanitation District
Inverness Sanitation Only
Inverness Water & San
$9,464,400
$1,513,890
$145,904,920
$2,494,750
$32,193,750
$5,775,890
$3,402,210
$61,784,110
$470,837,790
$85,550,440
$5,597,540
$15,269,800
$17,459,230
$9,478,690
$138,918,040
0.593
0.275
0.000
7.285
1.889
0.000
3.639
0.000
4.968
4.227
1.934
0.000
2.716
0.000
0.000
$5,612
$416
$0
$18,174
$60,814
$0
$12,381
$0
$2,339,122
$361,622
$10,826
$0
$47,419
$0
$0
0.000
0.000
0.000
0.000
0.000
0.000
0.000
0.000
<0.146>
0.000
0.000
0.000
0.000
0.000
0.000
$0
$0
$0
$0
$0
$0
$0
$0
<$68,742>
$0
$0
$0
$0
$0
$0
0.000
0.000
0.000
0.000
0.000
0.000
0.000
0.000
0.000
0.000
0.000
0.000
0.000
4.150
1.130
5.120
$0
$0
$0
$0
$0
$0
$0
$0
$0
$0
$0
$0
$0
$39,337
$156,977
$711,260
1996 19
^
^
^
^
^
^
^
^
^
^
^
^
^
^
^
^
0.000
0.000
0.000
0.000
1.242
0.000
0.000
0.000
0.000
0.000
0.000
0.000
0.000
0.000
0.000
$0
$0
$0
$0
$39,985
$0
$0
$0
$0
$0
$0
$0
$0
$0
$0
~
~
~
~
~
~
~
~
~
~
~
~
~
~
~
0.000
0.000
0.000
0.000
0.000
0.000
0.000
0.000
0.000
0.000
0.000
0.000
0.000
0.000
0.000
0.000
0.000
0.000
0.000
0.000
0.000
0.000
0.000
0.093
0.000
0.000
0.000
0.000
0.000
0.000
$0
$0
$0
$0
$0
$0
$0
$0
$0
$0
$0
$0
$0
$0
$0
$0
$0
$0
$0
$0
$0
$0
$0
$43,788
$0
$0
$0
$0
$0
$0
0.593
0.275
0.000
7.285
3.131
0.000
3.639
0.000
4.915
4.227
1.934
0.000
2.716
4.150
6.250
$5,612
$416
$0
$18,174
$100,799
$0
$12,381
$0
$2,314,168
$361,622
$10,826
$0
$47,419
$39,337
$868,238
Assessed Valuation General FundTemporary Tax Credit
Levy Revenue
Bond Redemption ^ Contractual Obligation ~Levy Revenue Date Term
Capital /Special*Abatement
Levy Revenue
Total
Levy Revenue

CERTIFICATION OF LEVIES AND REVENUESAs of January 1, 2006
ARAPAHOE COUNTY
Water & Sanitation Districts
Ground Water Management Districts
Conservation Districts (Soil)
Mansfield Hts. Water & San.District
Platte Canyon Water & San.District
S.W. Metro. Water & San.District
Strasburg Sanitation andWater District
Lost Creek GroundwaterMgmt. District
North Kiowa BijouGroundwater Mgmt
Agate Conservation District
Cope Conservation District
Deer Trail ConservationDistrict
West ArapahoeConservation District
$11,599,160
$34,669,540
$45,132,200
$2,055,400
$7,477,360
$47,787,690
$44,380
$48,390
$20,792,860
$4,107,278,440
0.000
7.104
0.000
4.500
0.714
0.027
0.000
0.000
0.000
0.000
$0
$246,292
$0
$9,249
$5,339
$1,290
$0
$0
$0
$0
0.000
0.000
0.000
0.000
0.000
0.000
0.000
0.000
0.000
0.000
$0
$0
$0
$0
$0
$0
$0
$0
$0
$0
0.000
0.000
0.000
0.000
0.000
0.000
0.000
0.000
0.000
0.000
$0
$0
$0
$0
$0
$0
$0
$0
$0
$0
^
^
^
^
^
^
^
^
^
^
0.000
0.000
0.000
0.000
0.000
0.000
0.000
0.000
0.000
0.000
$0
$0
$0
$0
$0
$0
$0
$0
$0
$0
~
~
~
~
~
~
~
~
~
~
0.000
0.000
0.000
0.000
0.000
0.000
0.000
0.000
0.000
0.000
0.000
0.060
0.000
0.000
0.000
0.000
0.000
0.000
0.000
0.000
$0
$0
$0
$0
$0
$0
$0
$0
$0
$0
$0
$2,080
$0
$0
$0
$0
$0
$0
$0
$0
0.000
7.164
0.000
4.500
0.714
0.027
0.000
0.000
0.000
0.000
$0
$248,373
$0
$9,249
$5,339
$1,290
$0
$0
$0
$0
Total
Total
$1,470,183,670
$55,265,050
XXX
XXX
XXX
XXX
$3,503,625
$6,629
<$68,975>
$0
XXX
XXX
XXX
XXX
$907,574
$0
$39,985
$0
^
^
~
~
XXX
XXX
XXX
XXX
$0
$0
$45,868
$0
XXX
XXX
$4,428,077
$6,629
Assessed Valuation General FundTemporary Tax Credit
Levy Revenue
Bond Redemption ^ Contractual Obligation ~Levy Revenue Date Term
Capital /Special*Abatement
Levy Revenue
Total
Levy Revenue

Conservation Districts (Soil)
General Improvement Districts (Municipal)
Public Improvement Districts (County)
Antelope Hills GID, Town ofBennett, CO
Antelope Water SystemG.I.D.
Greenwood Village SewerImpr. Dist. #1
Arapahoe Cty. Water &Wastewater Pub. Im
Cherry Park GeneralImprovement District
Foxridge GeneralImprovement District
Walnut Hills G.I.D.
$5,431,600
$4,639,410
$30,537,350
$286,477,800
$7,872,850
$23,032,900
$22,313,350
0.000
1.293
2.306
0.000
4.437
2.151
3.112
$0
$5,999
$70,419
$0
$34,932
$49,544
$69,439
0.000
0.000
0.000
0.000
0.000
0.000
0.000
$0
$0
$0
$0
$0
$0
$0
36.710
17.880
0.000
18.949
5.801
8.420
4.728
0.849
0.000
0.000
$199,394
$82,953
$0
$5,428,468
$1,661,858
$2,412,143
$1,354,467
$6,684
$0
$0
2000
2002
2002
2002
2005
1995
30
30
30
24
30
14
^
^
^
^
^
^
^
^
^
^
0.000
0.000
0.000
0.000
0.000
0.000
0.000
$0
$0
$0
$0
$0
$0
$0
~
~
~
~
~
~
~
0.000
0.000
0.000
0.000
0.000
0.000
0.000
0.000
0.000
0.000
0.000
0.000
0.000
0.000
$0
$0
$0
$0
$0
$0
$0
$0
$0
$0
$0
$0
$0
$0
36.710
19.173
2.306
18.949
4.437
2.151
3.112
$199,394
$88,951
$70,419
$5,428,468
$34,932
$49,544
$69,439
Total
Total
Total
$4,128,164,070
$40,608,360
$339,696,900
XXX
XXX
XXX
XXX
XXX
XXX
$0
$76,418
$153,915
$0
$0
$0
XXX
XXX
XXX
XXX
XXX
XXX
$0
$282,347
$10,863,620
$0
$0
$0
^
^
^
~
~
~
XXX
XXX
XXX
XXX
XXX
XXX
$0
$0
$0
$0
$0
$0
XXX
XXX
XXX
$0
$358,765
$5,582,383
Assessed Valuation General FundTemporary Tax Credit
Levy Revenue
Bond Redemption ^ Contractual Obligation ~Levy Revenue Date Term
Capital /Special*Abatement
Levy Revenue
Total
Levy Revenue
CERTIFICATION OF LEVIES AND REVENUESAs of January 1, 2006
ARAPAHOE COUNTY
Urban Drainage & Flood Control District
Business Improvement Districts
Other
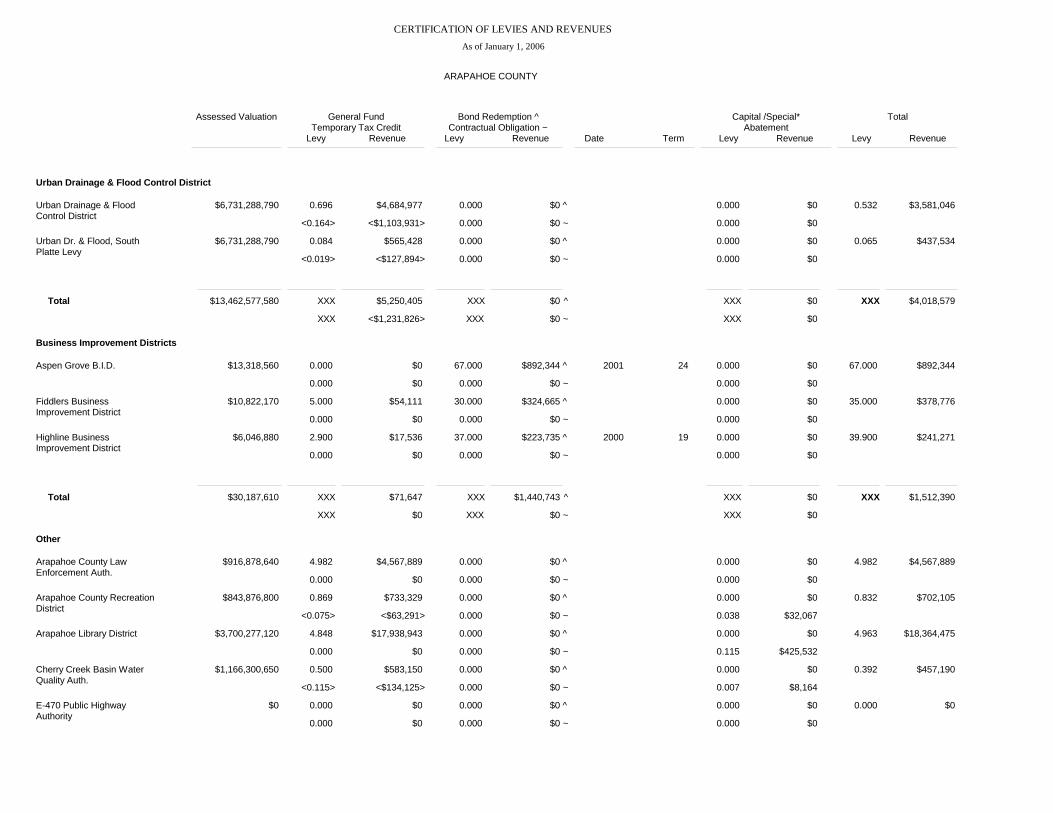
Urban Drainage & FloodControl District
Urban Dr. & Flood, SouthPlatte Levy
Aspen Grove B.I.D.
Fiddlers BusinessImprovement District
Highline BusinessImprovement District
Arapahoe County LawEnforcement Auth.
Arapahoe County RecreationDistrict
Arapahoe Library District
Cherry Creek Basin WaterQuality Auth.
E-470 Public HighwayAuthority
$6,731,288,790
$6,731,288,790
$13,318,560
$10,822,170
$6,046,880
$916,878,640
$843,876,800
$3,700,277,120
$1,166,300,650
$0
0.696
0.084
0.000
5.000
2.900
4.982
0.869
4.848
0.500
0.000
$4,684,977
$565,428
$0
$54,111
$17,536
$4,567,889
$733,329
$17,938,943
$583,150
$0
<0.164>
<0.019>
0.000
0.000
0.000
0.000
<0.075>
0.000
<0.115>
0.000
<$1,103,931>
<$127,894>
$0
$0
$0
$0
<$63,291>
$0
<$134,125>
$0
0.000
0.000
67.000
30.000
37.000
0.000
0.000
0.000
0.000
0.000
$0
$0
$892,344
$324,665
$223,735
$0
$0
$0
$0
$0
2001
2000
24
19
^
^
^
^
^
^
^
^
^
^
0.000
0.000
0.000
0.000
0.000
0.000
0.000
0.000
0.000
0.000
$0
$0
$0
$0
$0
$0
$0
$0
$0
$0
~
~
~
~
~
~
~
~
~
~
0.000
0.000
0.000
0.000
0.000
0.000
0.000
0.000
0.000
0.000
0.000
0.000
0.000
0.000
0.000
0.000
0.038
0.115
0.007
0.000
$0
$0
$0
$0
$0
$0
$0
$0
$0
$0
$0
$0
$0
$0
$0
$0
$32,067
$425,532
$8,164
$0
0.532
0.065
67.000
35.000
39.900
4.982
0.832
4.963
0.392
0.000
$3,581,046
$437,534
$892,344
$378,776
$241,271
$4,567,889
$702,105
$18,364,475
$457,190
$0
Total
Total
$13,462,577,580
$30,187,610
XXX
XXX
XXX
XXX
$5,250,405
$71,647
<$1,231,826>
$0
XXX
XXX
XXX
XXX
$0
$1,440,743
$0
$0
^
^
~
~
XXX
XXX
XXX
XXX
$0
$0
$0
$0
XXX
XXX
$4,018,579
$1,512,390
Assessed Valuation General FundTemporary Tax Credit
Levy Revenue
Bond Redemption ^ Contractual Obligation ~Levy Revenue Date Term
Capital /Special*Abatement
Levy Revenue
Total
Levy Revenue

Other
Fitzsimons RedevelopmentAuthority
Littleton Riverfront Authority
Regional TransportationDistrict
$6,724,700
$7,851,870
$6,665,218,710
0.000
0.000
0.000
$0
$0
$0
0.000
0.000
0.000
$0
$0
$0
0.000
0.000
0.000
$0
$0
$0
^
^
^
0.000
0.000
0.000
$0
$0
$0
~
~
~
0.000
0.000
0.000
0.000
0.000
0.000
$0
$0
$0
$0
$0
$0
0.000
0.000
0.000
$0
$0
$0
Total Local Impv & Svc $45,168,557,840 XXX
XXX
$87,585,785
<$1,680,208>
XXX
XXX
$47,281,334 ^
$301,699 ~
XXX
XXX $959,529
$3,636,626 XXX $132,125,798
Total $13,307,128,490 XXX
XXX
$23,823,312
<$197,415>
XXX
XXX
$0
$0
^
~
XXX
XXX
$0
$465,763
XXX $24,091,660
Assessed Valuation General FundTemporary Tax Credit
Levy Revenue
Bond Redemption ^ Contractual Obligation ~Levy Revenue Date Term
Capital /Special*Abatement
Levy Revenue
Total
Levy Revenue

CERTIFICATION OF LEVIES AND REVENUESAs of January 1, 2006
ARAPAHOE COUNTY
Schools
Local Government
Districts
Counties
Cities and Towns
Local Improv. and Service
$6,794,432,960
$6,718,283,280
$5,867,050,180
$45,168,557,840
$180,448,725
$113,008,243
$41,696,239
$87,585,785
$78,601,607
$0
$6,843,403
$41,322,366
$6,140,980
$1,813,936
$74,870
$4,596,156
$333,474,351
$103,602,646
$48,146,163
$132,125,798
$68,283,038
///////
///////
///////
$0
<$11,219,533>
<$468,349>
<$1,680,208>
$0
$0
$0
$301,699
$0
///////
///////
///////
Type of Levy AssessedValuation
General OperatingTemp Tax Credit
Revenue
Bond RedemptionContractual
Obligation Revenue
OverridesTransportation
Revenue
Other*Revenue
TotalRevenues
SUMMARY OF LEVIES AND REVENUES
$180,448,725
$242,290,267
$0
<$13,368,090>
$78,601,607
$48,165,770
$0
$301,699
$68,283,038
///////
$0
///////
$6,140,980
$12,625,943
$333,474,351
$283,874,608
XXX
XXX
Sub-Total School
Sub-Total Local Gov't
Total Valuation and Revenue $6,718,283,280 $422,738,992
<$13,368,090>
$126,767,376
$301,699
$68,283,038
$0
$12,625,943 $617,348,959
*See detail for specific fund type and name
TAX INCREMENT FINANCE FOOTNOTES:
(14022)
(14023)
(14024)
(14025)
(14026)
(14027)
(14028)
(14029)
(14030)
Englewood School District #1 includes $28,133,350 Assessed Valuation and $1,129,301 Revenue attributable To Englewood Urban Renewal.
Littleton School District includes $6,202,980 Assessed Valuation and $307,103 Revenue attributable to the Littleton Riverfront Authority.
Aurora School District #28J includes $4,739,180 Assessed Valuation and $217,168 Revenue attributable to Aurora Urban Renewal.
County Purposes include $28,133,350 Assessed Valuation and $433,844 Revenue attributable to Englewood Urban Renewal; $6,202,980 Assessed Valuation and $95,656 Revenue attributable to Littleton RiverfrontAuthority; and, $4,739,180 Assessed Valuation and $73,083 Revenue attributable to Aurora Urban Renewal Authority.
City of Aurora includes $4,739,180 Assessed Valuation and $51,932 Revenue attributable to Aurora Urban Renewal.
City of Englewood includes $28,133,350 Assessed Valuation and $227,880 Revenue attributable to Englewood Urban Renewal.
City of Littleton includes $6,202,980 Assessed Valuation and $41,324 Revenue attributable to Littleton Riverfront Authority.
South Suburban Metro. Recreation & Park District includes $6,202,980 Assessed Valuation and $44,147 Revenue attributable to the Littleton Riverfront Authority.
West Arapahoe Conservation District includes $4,739,180 Assessed Valuation and $0 Revenue attributable to Aurora Urban Renewal Authority.

TAX INCREMENT FINANCE FOOTNOTES:
(14031)
(14032)
(14033)
(14034)
Urban Drainage and Flood Control District includes $28,133,350 Assessed Valuation and $14,967 Revenue attributable to Englewood Urban Renewal Authority; $6,202,980 Assessed Valuation and $3,300 Revenueattribuable to Littleton Riverfront Authority; and $4,739,180 Assessed Valuation and $2,521 Revenue attributable to Aurora Renewal Authority.
Urban Drainage and Flood Control District/S. Platte District includes $28,133,350 Assessed Valuation and $1,829 Revenue attributable to Englewood Urban Renewal Authority; $6,202,980 Assessed Valuation and$403 Revenue attributable to Littleton Riverfront Authority; and $4,739,180 Assessed Valuation and $308 Revenue attributable to Aurora Urban Renewal Authority.
Regional Transportation District includes $28,133,350 Assessed Valuation and $0 Revenue attributable to Englewood Urban Renewal Authority; $6,202,980 Assessed Valuation and $0 Revenue attributable toLittleton Riverfront Authority; and, $4,739,180 Assessed Valuation and $0 Revenue attributable to Aurora Urban Renewal Authority.
Total Valuation and Revenue includes $28,133,350 Assessed Valuation and $1,807,821 Revenue attributable to Englewood Urban Renewal; $6,202,980 Assessed Valuation and $491,934 Revenue attributable toLittleton Riverfront Authority; and $4,739,180 Assessed Valuation and $345,012 Revenue attributable to Aurora Urban Renewal Authority.