certificate - exploregokhalechaitanya.github.io/images/gokhale_mscthesis.pdf · 2019-05-24 · 4...
TRANSCRIPT

1
Certificate
This is to certify that this thesis work entitled “Ab initio calculations on the HGPRT active
site and analysis of select mutations” submitted by Chaitanya Gokhale is a bonafide thesis
work carried out under my supervision and guidance and fulfilling the nature and standard
required for the partial fulfillment of the degree of Master of Science in Bioinformatics from
Sikkim-Manipal University. The work embodied in this thesis has not been submitted
elsewhere for a degree.
Date:
Place: Bangalore Dr. Mrinalini Puranik
Reader
National Centre for Biological Sciences (TIFR)

2
Declaration
I hereby declare that the work presented in this thesis has been done solely by me and has not
been presented for any other degree or any other certification other than Master of Science in
Bioinformatics from the Sikkim Manipal University of Health, Medical and Technological
Sciences.
Date:
Place: Bangalore Chaitanya Gokhale

3
Contents Chapter I / Introduction
1.1 Background………………………………………………………………………...5
1.2 Human HGPRT. ………………………………………………………………...…8
Chapter II / Computational approach 2.1 Molecular Orbital theory………………………………………………………….13
2.2 Ab initio implementations………………………………………………………...14
2.3 Density Functional Theory (DFT). ……………………………………………….17
2.4 Software…………………………………………………………………………..19
Chapter III / Calculations performed
3.1 Initial Guanine Base calculations…………………………………………………21
3.2 Model building and calculations………………………………………………….22
3.3 Output analysis……………………………………………………………………24
3.4 Interaction energy calculation…………………………………………………….31
3.5 Conclusions……………………………………………………………………….33
Chapter IV / Structural and functional analysis of select amino-acid substitution mutations
in HGPRT listed in OMIM 4.1 Data mining………………………………………………………………………..34
4.2 Data curation and standardization…………………………………………………35
4.3 Parameters. ………………………………………………………………………..36
4.4 Visualizing the mutations……………………………………………………….....41
4.5 Detailed analysis of each mutation...……………………………………………....42
4.6 Summary…………………………………………………………………………...51
Chapter V / Conclusions and Future directions 5.1 Conclusions………………………………………………………………………...52
5.2 Future directions……………………………………………………………………53
References……………………………………………………………………………………..54
Index of figures/tables…………………………………………………………………...……56

4
Acknowledgement
A journey is easier and fun when traveling together. This project has seen the light of the day
only because of the contributions and support of a lot of people. I would like to express my
sincere gratitude to them for their patience and confidence in me.
Foremost I would like to thank Dr. Mrinalini Puranik who in spite of her busy schedule, allowed
me to work under her able guidance throughout this project. Her timely tips and suggestions
helped me add to my knowledge a vast new portion of quantum chemistry and physics.
Spriha Gogia, Namrata Jayanth and Gopakumar answered my questions and helped me out in
difficult situations in spite of being totally immersed in their PhD studies.
A lively atmosphere and a happy mood are very essential to be able to complete the task at hand
with full dedication. This atmosphere is very much created by friends around us and I was very
fortunate to find good new friends like Radhika, Silja, Vijetha, Harish and Gaurav who have
supported me throughout my stay and never let me feel away from home.
I also received suggestions from Lokesh, Divya and Caroline who helped me out when I was
stuck on some crucial problems in the project and I am deeply grateful for their help.
Without the support and encouragement of my family and friends back home I would not have
been able to come to NCBS to do the project in the first place. I am very much thankful for their
support and finally I would like to express my respect to God Almighty for giving me the
strength to complete this task.

5
Chapter I
Introduction
1.1 Background Protozoan parasites like Plasmodium falciparum, Toxoplasma gondii etc. have been a menace to
humanity since thousands of years because of the varied diseases which they cause like malaria,
trypanosomiasis and toxoplasmosis. The parasites are protozoan and hence developing a
systemic drug for the parasites is difficult as they have a molecular biology quite similar to our
own.
One important difference, though, which can be exploited, is that the protozoan parasites lack the
ability to synthesis purines by the de novo pathway. They depend on the host purines and salvage
them to create their own nucleotide which is the only pathway in the parasites. Mammals possess
both the de novo as well as the salvage pathway for nucleotide synthesis.
Hypoxanthine-guanine-phosphoribosyl-transferase (E.C: 2.4.2.8) is a central enzyme in the
salvage pathway. Phosphoribosyl-transferases convert the purines into their corresponding
nucleotides by transferring the 5-phosphoribosyl group from the -D-5’-phosphoribosyl- 1-
pyrophosphate (PRPP) to a nitrogen atom of the imidazole ring of the purine base.
Humans possess PRTases since the de novo pathway of purine synthesis is very energy
expensive as compared to the salvage pathway. Comparing the PRTases of human and that of
Plasmodium falciparum (Pf HGXPRTase) it has been observed that the parasite not only
salvages hypoxanthine and guanine from the host to IMP (inosine monophosphate) and GMP
(guanosine monophosphate). In addition to that it can also salvage xanthine to XMP (xanthosine
monophosphate). This is the difference which can be exploited in developing a potential inhibitor
of the HG(X)PRT which will disrupt the only pathway of purine biosynthesis in the Plasmodium.
This will help in getting rid of the parasite without affecting the human counterpart of the
enzyme1. Thus though HGPRT has been studied for long, as a potential chemotherapeutic target
for diseases like malaria, giardiasis, trypanosomiasis and toxoplasmosis; it has been difficult to
design clinically useful inhibitors for it. The concept of utmost important is that the inhibitor
should be selective for the parasite HG(X)PRT since the deficiency of HGPRT in humans causes
gouty arthritis, uric acid nephrolithiasis and also the dreaded Lesch-Nyhan syndrome2. In general

6
when HGPRT does not function properly hypoxanthine is not salvaged and converted to IMP. As
a result the cellular result of hypoxanthine increases and then xanthine oxidase acts converts it to
uric acid which when found in high levels results in hyperuricemia. Hyperurecimia leads to the
formation of uric acid crystals, which cause nephrolithiasis and gouty arthritis.
The sequence comparison of the two enzymes shows that they share and overall 44% sequence
identity, which rises to 80% in the active site region1. Hence to find a potent drug which is
selective to the Plasmodium HG(X)PRTase has been a challenge.
What is important then is to find out what is the structural difference in the PRTases of human
and Plasmodium that leads to this difference in functionality. The crystal structures of the two
enzymes do not clearly display the difference in the enzymes and hence there is a need to follow
a different technique to look at the differences.
HGPRT gene structure Hprt1 is the official symbol of the HGPRT gene as per documented online in the NCBI
knowledge base. The gene is present in a well-characterized location on the X chromosome with
a moderate frequency of the single nucleotide polymorphisms.
Figure 1 X chromosome characterization
7
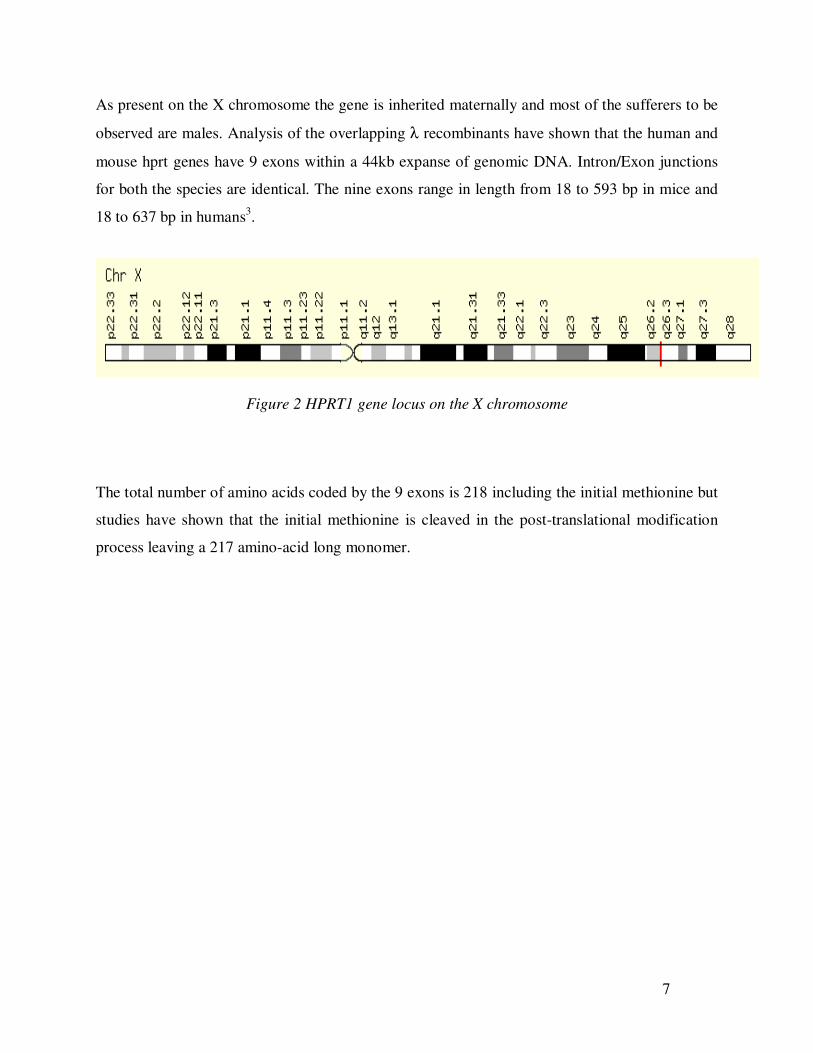
As present on the X chromosome the gene is inherited maternally and most of the sufferers to be
observed are males. Analysis of the overlapping ! recombinants have shown that the human and
mouse hprt genes have 9 exons within a 44kb expanse of genomic DNA. Intron/Exon junctions
for both the species are identical. The nine exons range in length from 18 to 593 bp in mice and
18 to 637 bp in humans3.
Figure 2 HPRT1 gene locus on the X chromosome
The total number of amino acids coded by the 9 exons is 218 including the initial methionine but
studies have shown that the initial methionine is cleaved in the post-translational modification
process leaving a 217 amino-acid long monomer.

8
1.2 Human HGPRT structure
Figure 3. Human HGPRT tetramer. PDB: 1BZY. Image created in Accelrys DS Visualizer
Structure leads to function and that’s the key to finding the potential inhibitor of the plasmodium
HG(X)PRT, by scanning for its difference from the human HGPRT. The following is a detail of
each of the enzymes summarized in the end by their differences.
The human enzyme unprocessed precursor consists of a total of 218 amino acids including the
initial methoinine. The human HGPRT can be found as a dimer or a tetramer in solution
depending upon the pH and ionic concentration (Johnson et al., 1979; Strauss et al., 1978). The molecular
weight of the unprocessed precursor is 24579 Da
Of the ten different PRTases found in the purine, pyrimidine and pyridine nucleotide synthesis
pathway, none shows clear sequence homology but all have been proposed to have a common
structure of a typical nucleotide binding domain4.
Subunit A
Subunit B
Subunit C
Subunit D

9
Four crystal structures of the human HGPRT have been reported with different ligands and at
different resolutions.
Table 1 PDB files for Human HGPRT from RCSB databank
PDB IB Resolution (Angstroms) Description
1D6N 2.70
Ternary complex structure of
Human HGPRT ,PRPP,
Mg2+ and inhibitor HPP
1Z7G 1.90 Free Human HGPRT
1HMP 2.50 Human HGPRT with bound
GMP
1BZY 2.00 Human HGPRT with
transition state inhibitor
Figure 4 Human HGPRT monomer. PDB: 1HMP. Image created in Pymol
The structure 1HMP is a dimer of which the two monomers are 1-217 and 501-717. The
structure described here is that of the monomer. The human HGPRT shows ten strands and six
helices in the monomer. The structure of the monomer can be divided roughly into two parts,

10
the hood region and the core region. The core region is composed of parallel sheets of 5 strands
and 4 helices. Thus the core region made up of the amino acids, 37-189 consist of the five
sheets (B3-B7) and the four helices (A2-A5). The core structure resembles a dinucleotide-
binding domain, which has also been observed in orotate phophoribosyltransferases. The
sequence for the core is in the center of the primary structure and the sequences flanking it form
a different substructure, which is different in HGPRT, OPRTase and amido PRTases, and it
appears to be involved in substrate recognition.
The core region forms a / sheet of 5 strands. The first half sheet is composed of A2, B3, A3
and B4. A long loop A4 connects to the second half sheet composed of B5, A5, B6, and B7.
sheets of this half are literally parallel to the first half sheet ones, forming a kind of a ledge,
which is the active site. A long loop of residues from 103-117 in the HGPRT is very much
disordered and it is proposed to move during catalysis, hence called as the flexible catalytic loop.
Proposed mechanism of catalysis GMP is proposed to bind in the cleft above the central sheet of the core region. The cavity has
a volume of about 700 Å3 while the GMP in it occupies about 280 Å3. Almost 20% of the GMP
is exposed to the solvent. The base of the GMP is wedged between the B8 and B9, which are in
between the core region of the protein. It is found that the B8 and B9 strands are bound together
by just one hydrogen bond and in general the bonding between is very weak. The position of the
GMP may be the reason for such a quality. The carbonyl oxygen of VAL 187 is proposed to
form hydrogen bond with the exocyclic amino group of the base of GMP and may be causing the
separation between the two strands.
The formation of the nucleotide from the purine requires that the N9 be de-protonated whereas in
the reverse reaction it needs to be protonated. According to the crystal structure it is proposed
that it is highly unlikely that the N9 will be directly protonated or de-protonated as the
phosphoribosyl group sterically hinders the site.

11
Figure 5 Van der Waal surface of HGPRT showing the GMP in the active site. PDB: 1HMP Image created in Accelrys DS Visualizer
The base is held together in place by polar contacts between the exocyclic amino group of the
guanine and the oxygen atoms of Asp 193 and Val 187. Also the N1H bonds to the Val 187
oxygen. It is likely that the N7 is the site of enzymatic protonation and de-protonation. In the
human HGPRT ASP 137 or LYS 165 are both near the N7 of the base and can fulfill the role of
the transition state stabilization by protonating N7 or hydrogen bonding with N7. The end
product may be the base leaving in this tautomeric form or may be equilibriated at the active site
itself by protonation of N7 followed by the de-protonation at N9 by water.
The transition state is expected to have a partial positive charge on the ribose which is expected
to be stabilized by the anionic environment provided by the Aspartic acid in the 134 position and
Glutamate 133. This also suggests that the charge and position both may be specific at the
positions defined by the D and E.
12
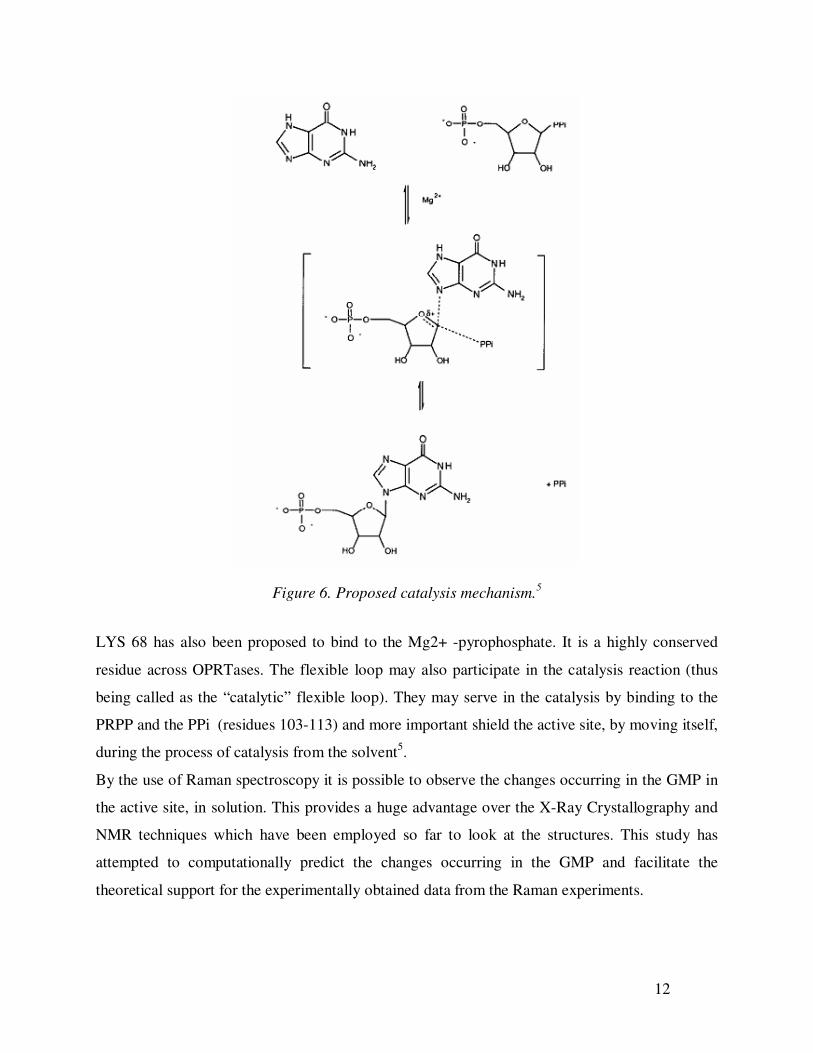
Figure 6. Proposed catalysis mechanism.5
LYS 68 has also been proposed to bind to the Mg2+ -pyrophosphate. It is a highly conserved
residue across OPRTases. The flexible loop may also participate in the catalysis reaction (thus
being called as the “catalytic” flexible loop). They may serve in the catalysis by binding to the
PRPP and the PPi (residues 103-113) and more important shield the active site, by moving itself,
during the process of catalysis from the solvent5.
By the use of Raman spectroscopy it is possible to observe the changes occurring in the GMP in
the active site, in solution. This provides a huge advantage over the X-Ray Crystallography and
NMR techniques which have been employed so far to look at the structures. This study has
attempted to computationally predict the changes occurring in the GMP and facilitate the
theoretical support for the experimentally obtained data from the Raman experiments.

13
Chapter II
Computational Approach
2.1 Molecular Orbital Theory Earlier it was thought that the rules governing the macroscopic and the microscopic worlds are
the same. In 1900 Max Planck proposed that the black body radiation emitted by microscopic
particles was limited to certain discrete values i.e. it was quantized. A new type of mechanics
was required to take into account this quantization of energy. Thus was born “Quantum
Mechanics”. A fundamental postulate of the quantum mechanics is that any system (chemical)
has a wave function, , associated with it, and appropriate operators (functions) that act upon
will give the observable properties of the system.
There are two main ways of trying to explain how the electrons of a molecule are involved in
bonding.
1. Localized bond approach (also known as the valence bond theory): involves
regarding all bonds as localized interactions involving two electrons shared between
two atoms. In polyatomic molecules this leads to the use of orbital hybridization as a
convenient mathematical (and pictorial) procedure of manipulating the atomic
orbitals to permit the bonding to be described in terms of a collection of simple two-
centre, two-electron bonds.
2. Molecular orbital approach (also known as MO theory): involves the assignment of
electrons to molecular orbitals which are, in general, delocalized over the whole
molecule.
One cannot decide which approach is the better one as neither is the exact one.
There is no straightforward answer to this question - neither approach is exact. In some
instances, such as in the description of bonding in diatomic molecules, the two approaches give
essentially identical results. The valence bond approach is the approach with which you will be
most familiar - it is conceptually simpler and is widely used in organic chemistry, but it fails to
adequately explain the bonding in certain classes of molecules, including aromatic compounds.
The MO approach is generally harder to implement but better explains the bonding in those

14
molecules where the valence bond approach fails, and is generally more consistent with the
results of spectroscopic measurements.
The theory requires us to solve the simple looking Schrödinger equation
H= E in which the Hamiltonian H is the operator which returns the energy of the system, E, as an
eigenvalue.
The Hamiltonian actually consists of the following.
- Kinetic energy of the nuclei
- Kinetic energy of the electrons
- Internuclear electrostatic potential energy
- Interelectronic electrostatic potential energy
Hence the equation becomes very complicated and difficult to solve.
To solve the Schrödinger equation the molecular orbital theory implements a number of
approximations namely:
1. The Born-Oppenheimer Approximation
2. The orbital approximation
3. LCAO approximation
2.2 Ab Initio Methodology Ab initio comes from the Latin phrase “from first principles”, or, more simply, “from scratch”.
Ab initio is the only computational chemistry method that is 100% mathematical. Ab initio
methods do not use any experimental data or other parameters to attempt to calculate information
about a molecule or molecular system
Ab initio methods are unarguably the most accurate, as well as the most difficult, of all of the
techniques currently in use in the field of molecular modeling. A significant reason for this is
that, unlike other methods, the ab initio method really does start “from scratch”. Beginning with
just the molecular structure and a few constants – the speed of light (c), Planck’s constant (h), the
mass (me) and charge (qe) of the electron – one can calculate a score of chemical properties,
make insights into the reactivity of a molecule, and “see” the shapes and sizes of molecular
orbitals.
15
Needless to say, the underlying mathematics of ab initio methods are very complicated,
involving the solution of integrals, the establishment and solution of complicated matrices, and
the establishment of equations that can only be solved through the repetitive abilities of
computers. What is important for all users to understand is the concept of model chemistry.
Model chemistry is a complete mathematical description of the particular calculation. In
simplest terms, the model chemistry has two components: the specific theory being used, and the
specific basis set that is being used as the starting point for the calculation.
Hartree-Fock (HF) Self-Consistent Field (SCF) Theory The most basic of all theories is the Hartree-Fock method, named after the two physicists (note:
not chemists!) who developed the system. The “HF” method is also sometimes known as the
“self-consistent field (SCF)” theory, which is a better description of what happens. Most
computational chemistry software packages, however, have pull-down menus that say “Hartree-
Fock” or “RHF” (restricted Hartree-Fock, meaning that all of the electrons are paired) or “UHF”
(unrestricted Hartree-Fock, meaning that there are unpaired electrons). The essential part being
that HF and SCF are referring to the same theory.
Self Consistent Field method The Hartree-Fock ground state energy is obtained by minimizing with respect to the variation of
the orbitals subject to the constraint that the orbitals remain orthonormal. In general the Hartree-
Fock equations cannot be solved analytically. One exception is for the homogeneous electron
gas, where the constant external potential leads to plane wave solutions that result in the local
exchange energy derived by Dirac. In other situations, the Hartree-Fock equations are solved
using an iterative process known as the self-consistent field procedure. Kohn-Sham equations are
solved to obtain an initial set of orbitals. This set of orbitals is used to obtain a better
approximation to the electron density and the process is repeated until the density and exchange-
correlation energy are constant within some tolerance. The self-consistent procedure starts with
an initial guess for the orbitals, and successive iterations are performed with new orbitals until
the self-consistent condition is achieved.
The self-consistent field theory, mathematically, is quite complicated, but conceptually relatively
simple. A procedural description is as follows:

16
1. Begin with a set of approximate orbitals (a basis set) for all of the electrons in the system
2. Select one electron as a starting electron
3. Calculate the potential (the energy of the system) in which it moves by "freezing" the
distribution of all the other electrons by treating their averaged distribution as a single
("centrosymmetric") source of potential
4. Calculate the Schrödinger equation for the selected electron, resulting in a new, more
accurate orbital for that electron
5. Repeat the procedure for all the other electrons in the system.
6. A single cycle is complete once each electron has been evaluated
7. Begin the process again with the first electron evaluated, using the newly calculated
orbitals as the starting point.
8. Continue this process through the iteration (repeating, or cycling) process until a pass
through the calculations does not change the values of the orbitals
9. Declare the calculation to be done, as the orbitals are now considered to be "self-
consistent".
In the procedure above, there is no mention of nuclei – the Born-Oppenheimer approximation.
The procedure also talks about treating the electrons as “averaged” – the Hartree-Fock
approximation. By calculating the energy of an electron as measured against all of the other
electrons combined into one big electron, we have an “uncorrelated” system. This lack of
electron correlation introduces a fair degree of inaccuracy to our calculations.
Hartree-Fock, or SCF methods, therefore, does not include electron correlation. This limitation is
being addressed with the development of newer, “post-SCF” methods that do attempt to take into
account electron correlation. Some of these methods are listed below:
Moller-Plesset (MP) perturbation theory
Configuration Interaction (CI) theory
Coupled Cluster (CC) theory

17
2.3 Density Functional Theory Density Functional method is the most convenient method to deal with the electronic structure of
many-body-system. This method considers the many body electron wave function as electron
density. This theory supports the dependence of the basic variable of the system only on the
spatial coordinates rather that the 3*N degrees of freedom. Multiple determinant calculations
require very large basis sets whereas DFT can produce accurate results with very small basis
sets. DFT derives the energy directly from the electron probability density. In the language of
DFT, electrons interact with one another and with an external potential. Thus in the uniform
electron gas, the external potential is the uniformly distributed positive charge, and in a
molecule, the external potential, is the attraction to the nuclei given by the usual expression.
More specifically, according to the theorem proved by them, the total ground state energy of an
electron system can be written as a function of the electronic density, and this energy is at
minimum if the density is an exact density for the ground state. The simplest approximation is
the local density approximation (LDA) which leads to a Thomas-Fermi term for kinetic energy
and the Dirac term for the exchange energy. The corresponding functional is called Thomas-
Fermi-Dirac energy. The theorem of HK is an existence proof of such a functional.
Hohenberg and Kohn theorems
The field of rigorous density functional theory was born in 1964 with the publication of the
Hohenberg and Kohn paper (1964). They proved the following:
1. Every observable of a stationary quantum mechanical system (including energy), can be
calculated, in principle exactly, from the ground-state density alone, i.e., every
observable can be written as a functional of the ground-state density.
2. The ground state density can be calculated, in principle exactly, using the variational
method involving only density.
The original theorems refer to the time independent (stationary) ground state, but are being
extended to excited states and time-dependent potentials.
18
Level of Theory used The geometry optimizations as well as the frequency calculations have been done at the level of
B3LYP/6-31G** except wherever defined as different. This is one of the most popular split
valence basis set used in the DFT methods. This basis set tells us that it uses 6 Gaussian function
has been used to describe the inner orbital of the heavy atoms (atoms except hydrogen). The
hyphen indicates a split valence basis set, telling us that the valence 2s and 2p orbitals are each
represented by a pair of Slater orbitals. One of these Slater orbitals, the smaller one, is
represented by a sum of three Gaussian functions and the larger orbital is represented by a single
Gaussian function. The time required to evaluate the elements of the secular determinant depends
upon the number of functions used. 6-31G** basis set is mainly used for those calculations
which account for hydrogen bonding interactions. The '**' symbol denotes the polarization effect
on the system. First asterisk symbol denotes addition of d character to the description of the
valence electrons in 2p orbitals, thereby providing a representation of the asymmetric shape of
the electron density along with chemical bonds involving 2p orbitals. The second asterisk symbol
denotes that polarization is also being taken in to account for the orbital descriptions on
hydrogen atoms by adding 2p orbitals to the hydrogen 1s orbitals.
Geometry Optimizations
Prior to performing most molecular modeling calculations, the molecule needs to be optimized
using a geometry optimization calculation, run at particular model chemistry. Optimizing a
molecule results in the best combination of bond-lengths, angles and dihedrals. Also then the
molecule has the lowest and therefore the most stable energy. Some molecules are difficult to
optimize, and may have to be optimized several times using progressively more robust
mathematical methods. In some cases, the optimization is the focus of the calculation, but in
most instances the modeler optimizes the molecule(s) prior to beginning the calculations of
interest.
Single Point Energies: Single point energy (SPE) is a basic molecular modeling calculation. This calculation
determines the energy of a molecule at a specific molecular geometry. Single point energies,
sometimes known simply as molecular energies, are typically in units of Hartrees, which can be

19
[-1 -1 -1] converted to more common energy terms such as kilojoules mol (kJ mol ), kilocalories
mol -1 (kcal/mol ), or electron-volts (eV). Any change in a molecular geometry will require that
a new single point energy calculation be performed.
2.4 Software used
1. Molekel6
Molkel is a platform independent visualization tool written in C/C++ and uses the OpenGL /
Mesa, GLUT and GLUI libraries. This is an attractive, three dimensional molecular package,
which represents the molecule as a wireframe, stick, ball and stick etc. In the present study I
have used this software to look at the GAMESS out put files and to animate and display the
vibrational modes. This software is used frequently to look at the bond lengths and bond
angles of the different substrates. I was able to calculate the dihedral angles of the molecule
when dealing with the planarity of the molecule.
2. Arguslab7
ArgusLab is a free molecular modeling, graphics and drug design program which can be used
to visualize the molecules in a number of different formats. The tool is very intuitive and the
modeling and different molecules and their manipulations onscreen are very easy. Inbuilt
algorithms for energy minimizations and docking are an added help. The tool can also linkup
with Gaussian to perform ab-initio calculations.
3. GAMESS8
GAMESS (General Atomic and Molecular electronic Structure system) is a program for ab
initio quantum chemical calculations. GAMESS can compute SCF wavefunction ranging
from RHF, ROHF, UHF, GVB, and MCSCF. Correlation corrections to these SCF
wavefunction include Configuration Interaction, second order Perturbation Theory, and
Coupled-Cluster approaches, as well as the Density Functional Theory approximation.
Nuclear gradients are available, for automatic geometry optimization, transition state
searches, or reaction path following. Computation of the energy Hessian permits prediction
of vibrational frequencies, with IR or Raman intensities. The discrete Effective Fragment
Potentials, or continuum models such as the Polarizable Continuum Model may model

20
solvent effects. Numerous relativistic computations are available, including third order
Douglas-Kroll scalar corrections, and various spin-orbit coupling options. The Fragment
Molecular Orbital method permits use of many of these sophisticated treatments to be used
on very large systems, by dividing the computation into small fragments.
All the GAMESS calculations were performed on a Fedora Core Linux operating system
with 2 GB RAM and i686 architecture.
4. Accelrys Discovery Studio Visualizer.
Accelrys DS Visualizer is commercial-grade graphics visualizer available free to all
academic, government and commercial researchers through Discovery Studio (DS)
Visualizer. With DS Visualizer, one can visualize and share molecular information in a clear
and consistent way and in a wide variety of industry-standard formats. High quality graphics
and can be generated using this tool. DS Visualizer runs on both Windows 2000 and XP and
the Red Hat Enterprise Linux operating system, versions 3.0 and 4.0.

21
Chapter III
Calculations Performed
3.1 Initial Guanine Base Calculations Guanine is the part of the ligand, which is of interest from the point of view of Raman
spectroscopy. This is so because the detail study of the guanine base has been done using Raman
spectroscopy as well as IR spectroscopy. The experiments with HGPRT and its ligands can be
performed and the guanine base can be analyzed during that process. This will give a picture of
the changes happening in the base when the reaction is proceeding and what are the
modifications it undergoes so that the catalysis can take place and the reaction can proceed to its
end.
For this comparison of the guanine base and its different stages it was necessary to calculate the
initial state of the guanine base, free in gas phase. The calculations were already performed by
Spriha which were a DFT/B3LYP 6-31G** geometry optimization and also a HF/3-21G
geometry optimization.
The outputs have been characterized as:
a. Free base in gas phase optimized by DFT/B3LYP 6-31G**.
Figure 7 Free base optimized in gas phase using DFT/B3LYP 6-31G**. Image from Molekel6

22
b. Frequency calculation of (a).
The HESSIAN calculation was performed on the optimized structure so as to
theoretically predict the frequencies of the various modes of vibration of the guanine in
free gas phase. The frequencies have been analyzed by comparison with the guanine
extracted from the PDB.
c. Free base in gas phase optimized by HF/3-21G.
Figure 8 Free base optimized in gas phase using HF/3-21G. Image from Molekel6
d. Frequency calculation of (b).
The frequencies obtained from this calculation were obviously different from the ones
obtained from optimizing the structure using DFT calculation. HF is a more crude
method for optimization hence the frequencies predictions are also not that accurate.
3.2 Model building and calculation Model is the word used in this thesis to define the structure generated by using only a select few
residues from the active site of HGPRT and the guanine in the active site. The residues, which
were expected to be the most significant in binding of the ligand to the active site and the one
that is proposed to bring about the catalysis, were included.
ASP 193, VAL 187 and LYS 165 are known to be forming hydrogen bonds with the ligand. The
NH2 group of the guanine binds with the oxygen atoms of ASP 193 and VAL 187 while the
N1H also binds to the same oxygen of VAL 187. The C6O forms two hydrogen bonds with the
23
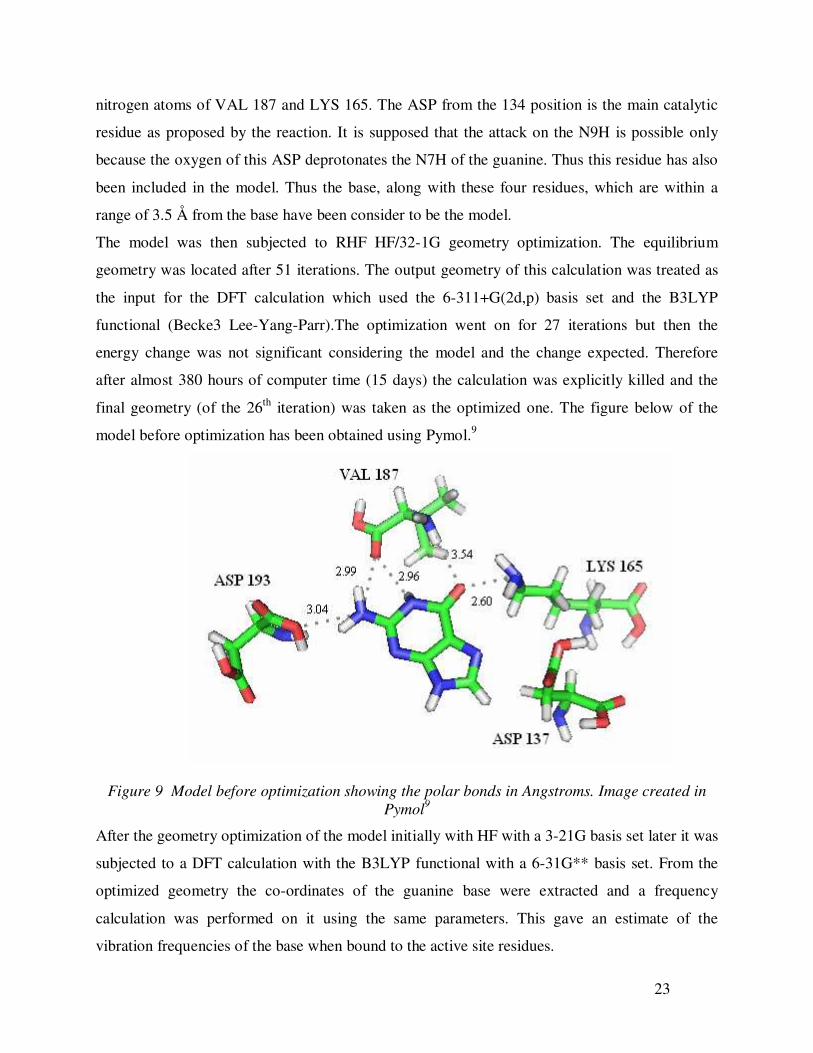
nitrogen atoms of VAL 187 and LYS 165. The ASP from the 134 position is the main catalytic
residue as proposed by the reaction. It is supposed that the attack on the N9H is possible only
because the oxygen of this ASP deprotonates the N7H of the guanine. Thus this residue has also
been included in the model. Thus the base, along with these four residues, which are within a
range of 3.5 Å from the base have been consider to be the model.
The model was then subjected to RHF HF/32-1G geometry optimization. The equilibrium
geometry was located after 51 iterations. The output geometry of this calculation was treated as
the input for the DFT calculation which used the 6-311+G(2d,p) basis set and the B3LYP
functional (Becke3 Lee-Yang-Parr).The optimization went on for 27 iterations but then the
energy change was not significant considering the model and the change expected. Therefore
after almost 380 hours of computer time (15 days) the calculation was explicitly killed and the
final geometry (of the 26th iteration) was taken as the optimized one. The figure below of the
model before optimization has been obtained using Pymol.9
Figure 9 Model before optimization showing the polar bonds in Angstroms. Image created in Pymol9
After the geometry optimization of the model initially with HF with a 3-21G basis set later it was
subjected to a DFT calculation with the B3LYP functional with a 6-31G** basis set. From the
optimized geometry the co-ordinates of the guanine base were extracted and a frequency
calculation was performed on it using the same parameters. This gave an estimate of the
vibration frequencies of the base when bound to the active site residues.

24
3.3 Output analysis The output of the calculations have been analyzed so as the give the differences between the
guanine base and thus find out what changes happen in the base as energy minimization process
progresses which will reflect the changes happening in the base during the progression of the
catalytic reaction.
The comparison was done between the guanine optimized by DFT/B3LYP 6-31G** and the free
guanine optimized in gas phase and the guanine optimized in the model. Also the co-ordinates of
the guanine were extracted from the optimized model and a frequency calculation was performed
so as to obtain the expected frequencies of vibrations of the model.
NN
NN
O
NH
H
H
H
H1
23
4
56
78
9
2a
2b
2
Figure 10. Numbering system of the atoms of the base in this study
The numbering system of the atoms in the guanine that has been used in this context is as
displayed above. As the guanine extracted from the PDB did not have any hydrogen atoms, they
were added explicitly using ArgusLab7.
Those hydrogen atoms were added in a standard manner and hence can be excluded from
comparison with the others. The bond lengths and angles, which need to be compared, have been
highlighted.

25
Table 2 Bond length comparisons (All bond lengths are in Angstroms (Å))
Bond Optimized base
DFT/6-31G**
Base from PDB Base after model
optimization
DFT/6-31G**
N1-N1H 1.013 1.100 1.027
N1-C2 1.371 1.382 1.367
C2-C2N2 1.377 1.337 1.373
C2N2-Ha 1.011 1.100 1.015
C2N2-Hb 1.011 1.100 1.011
C2-N3 1.313 1.338 1.319
N3-C4 1.358 1.376 1.354
C4-C5 1.396 1.383 1.401
C5-C6 1.442 1.435 1.441
C6-C6O 1.218 1.235 1.234
C6-N1 1.440 1.402 1.409
C5-N7 1.383 1.406 1.386
N7-C8 1.308 1.298 1.310
C8-C8H 1.082 1.100 1.082
C8-N9 1.384 1.374 1.379
N9-N9H 1.009 1.100 1.009
N9-C4 1.370 1.399 1.371

26
Table 3 Dihedral Angles (degrees)
Angle Optimized base
DFT/6-31G**
Base from PDB Base after model
optimization
DFT/6-31G**
N1H-N1-C6-C6O 3.9 6.8 -2.5
C6O-C6-C5-N7 0.1 -3.4 -0.4
C5-N7-C8-C8H -180.0 176.7 -176.9
C8H-C8-N9-N9H -0.2 5.5 -2.2
N9H-N9-C4-N3 0.8 -0.4 1.0
C4-N3-C2-C2N2 176.5 -177.2 -179.5
N3-C2-N2-NH2b 12.6 -4.0 35.3
NH2a-N2-C2-N1 -34.3 -0.0 -9.4
Table 4 Angles (degrees)
Angle Optimized base
DFT/6-31G**
Base from PDB Base after model
optimization
DFT/6-31G**
C2-N1-N1H 120 120 117.3
N1H-N1-C6 113.3 115.2 115.4
N1-C6-C6O 119.3 119.0 118.4
C6O-C6-C5 131.3 128.9 131.4
N7-C8-C8H 125.5 128.2 126.1
C8H-C8-N9 121.6 120.0 121.0
C8-N9-N9H 127.7 120.0 127.1
N9H-N9-C4 125.6 132.6 125.8

27
Angle Optimized base
DFT/6-31G**
Base from PDB Base after model
optimization
DFT/6-31G**
N3-C2-C2N2 119.3 120.7 120.9
C2N2-C2-N1 117.1 115.4 115.4
NH2a-N2-NH2b 114.2 120.0 114.8
NH2a-N2-C2 117.5 120.0 114.9
NH2b-N2-C2 112.4 120.0 114.6
Table 5 Comparing the HF/3-21G optimized base with base extracted from PDB
Bond Optimized base (HF/3-21G) Base from PDB
N1-N1H 0.997 1.100
N1-C2 1.359 1.382
C2-C2N2 1.359 1.337
C2N2-Ha 0.994 1.100
C2N2-Hb 0.994 1.100
C2-N3 1.289 1.338
N3-C4 1.355 1.376
C4-C5 1.366 1.383
C5-C6 1.436 1.435
C6-C6O 1.194 1.235
C6-N1 1.416 1.402
C5-N7 1.378 1.406
N7-C8 1.278 1.298

28
Bond Optimized base (HF/3-21G) Base from PDB
C8-C8H 1.071 1.100
C8-N9 1.374 1.374
N9-N9H 0.993 1.100
N9-C4 1.352 1.399
Table 6 Dihedral Angles comparison of optimized base (HF/3-21G) and base from PDB (degrees)
Angle Optimized base (HF/3-21G) Base from PDB
N1H-N1-C6-C6O 3.8 6.8
C6O-C6-C5-N7 0.1 -3.4
C5-N7-C8-C8H 180.0 176.7
C8H-C8-N9-N9H -0.2 5.5
N9H-N9-C4-N3 0.6 -0.4
C4-N3-C2-C2N2 177.4 -177.2
N3-C2-N2-NH2b 11.1 -4.0
NH2a-N2-C2-N1 -28.6 -0.0
Table 7 Angles (degrees)
Angle Optimized base (HF/3-21G) Base from PDB
C2-N1-N1H 119.7 120
N1H-N1-C6 113.9 115.2
N1-C6-C6O 119.1 119.0
C6O-C6-C5 131.2 128.9

29
Angle Optimized base (HF/3-21G) Base from PDB
N7-C8-C8H 125.7 128.2
C8H-C8-N9 121.5 120.0
C8-N9-N9H 127.7 120.0
N9H-N9-C4 125.8 132.6
N3-C2-C2N2 119.8 120.7
C2N2-C2-N1 116.3 115.4
NH2a-N2-NH2b 115.6 120.0
NH2a-N2-C2 118.7 120.0
NH2b-N2-C2 114.3 120.0
From the comparisons we observe:
1. The guanine from the PDB is highly distorted as compared to the structure obtained by
geometry optimization by the DFT calculation but comparatively less distorted from the
one after the HF calculation. This is expected, as DFT calculations are more accurate than
the HF calculations as discussed in the previous chapter.
2. The guanine base has moved towards the ASP 137 and VAL 187 moiety as is evident
from the distances shown in the figures. Also checking the intra –molecular distance it is
evident that the molecule stretches a bit to complete the hydrogen bonding

30
Figure 11 Free base optimized using DFT
Figure 12 Base optimized in model using DFT
3. The guanine structure obtained from the model is very similar to that of the one obtained
from the DFT optimization. The difference lies in the dihedral angles of the NH2a and
NH2b which are almost exactly opposite.
This change can be explained as the NH2b is within hydrogen bonding distance of the main
chain oxygen of ASP 193 as is observed in the active site figure and the model figure.
The HF/3-21G frequency comparison of the free base optimized and the unoptimized base from
PDB shows shifts in the correct direction which is as expected but the DFT/6-31G** frequency
comparison of the free base optimized and the optimized from model shows shifts in the opposite
direction from the values observed in the Raman experiment. One possible reason for such kind
of an observation may be that the amino acid residues selected around the base for optimization
were not enough to act as constraints. The solution would be to add more amino acids in the
model which are proposed to be in contact with the base.

31
3.4 Interaction energy calculations The interaction energy between the selected amino acids from the active, which formed the
model, and the guanine base was calculated by performing single point energy calculations using
the same parameters, before and after optimization. This gave the most important E, which is
the true measure of how much change occurs in the system before and after optimization.
E (model) = E (interactions) + E (Individual components of the model)
Therefore concerning this model system:
E (interactions) = E (model) - (E (base) + E (residues))
As the residues were freezed during the optimization process, the energy of only the residues
should remain constant. This was not the case. After careful scrutiny of the inputs and the
outputs it was found that a white space typo had caused 5 co-ordinates of a residue to become
unfreezed and hence the change in the energy of the residues. After the energy of the residues
after optimization was adjusted as per the original energy of the residues, the energy of the
optimized model was also reduced by the same factor of that of the residues as the total model
energy comprises of the energy of the residues too and thus has to be accounted for.
The energies obtained from the single point energy calculations before and after optimization
have been tabulated below.
The energies are obtained from the program in HARTREE but have been converted to kcal/mole
by multiplying it with the conversion factor of 627.5095
Table 8. Various Single Point Energies calculated
Energy (kcal/mole) Before optimization After optimization
Energy of Model -1546622.719818251 -1546667.526461471
Energy of base -340260.879564842 -340279.52067263
Energy of residues -1206362.525200108 -1206362.525200108

32
Now:
E (interactions) = E (model) - (E (base) + E (residues))
Where:
E (model) = E (after opt) - E (before opt)
= -1546667.526461471 – (-1546622.719818251)
= - 44.8066644322 kcal/mole
E (base) = E (after opt) - E (before opt)
= -340279.52067263 – (-340260.879564842)
= -18.641107788 kcal/mole
E (residues) = E (after opt) - E (before opt)
= -1206362.525200108 – (-1206362.525200108)
= 0.0 kcal/mole
Therefore
E (interactions) = - 44.8066644322 - (-18.641107788 + 0.0)
= -26.165535432 kcal/mole
Therefore the total change in the energy of interaction is negative and about 26 kcal/mole. The
interactions when observed in the structure of the model, before and after optimization suggest
polar bonding between the NH2 hydrogen atoms and the oxygen of ASP 193 and Val 187. Also
the C6 Oxygen shows possible hydrogen bonding interaction with the Nitrogen atoms of Val 187
and LYS 165. The figure below of the model after optimization has been obtained using Pymol.9

33
Figure 13 Optimized model showing the polar contacts in Angstroms. Image created in Pymol9
Considering the five hydrogen bonds and as energy of a hydrogen bond has been known to vary
between 2 to 10 kcal/mole, the total interaction energy of the system can be predicted to be
around the magnitude of 25-30 kcal/mole which is precisely what is obtained by the energy
calculations.
3.5 Conclusions Thus here it is observed that as the base is optimized in the model it relaxes from the PDB co-
ordinates so as to move towards the binding site and strengthen the expected polar bonds. The
interaction energy is also in the same window as expected to be and that validates the model
more so.
Though the base from the model shows more similarity to the free base optimized using the DFT
parameters, it is a possibility that the base is relaxing more than expected in the optimization
procedure and this can be sorted out by adding more of the active site residues to act as
constraints around the base.

34
Chapter IV
Structural and functional analysis of select amino-acid substitution mutations
in HGPRT listed in OMIM
4.1 Data mining
Hypoxanthine-guanine-phosphoribosyl-transferase (MIM #308000) is widely used as a genetic
marker in eukaryotic cells. The enzyme has evolved from the hpt protein found in the
prokaryotes and is now found in most of the eukaryotes. Since the evolution of the gene it has
shown many types of mutations causing dreaded diseases in humans namely the Lesch-Nyhan
syndrome, Kelly-Seegmiller, nephrolithiasis, and gouty arthritis.
The sequence of HGPRT shows that it contains some highly conserved regions which if mutated
could mostly lead to the above mentioned diseases
Sequence of Human HGPRT (SWISS-PROT entry: P00492)
10 20 30 40 50 60
MATRSPGVVI SDDEPGYDLD LFCIPNHYAE DLERVFIPHG LIMDRTERLA RDVMKEMGGH
70 80 90 100 110 120
HIVALCVLKG GYKFFADLLD YIKALNRNSD RSIPMTVDFI RLKSYCNDQS TGDIKVIGGD
130 140 150 160 170 180
DLSTLTGKNV LIVEDIIDTG KTMQTLLSLV RQYNPKMVKV ASLLVKRTPR SVGYKPDFVG
190 200 210
FEIPDKFVVG YALDYNEYFR DLNHVCVISE TGKAKYKA
For example the residues, which have been found to be in the PRPP binding activity and have
been found to be conserved across the various types of PRTases, have been highlighted in red
above.
A detail study of the mutations has shown that the mutations show no particular pattern in the
structure and are well spread throughout the structure10, 11. Almost more than 2000 mutations in

35
the HGPRT gene have been observed of which 1453 and independent single nucleotide
substitutions12. Also the spectrum of Asian mutations was updated recently in which nine novel
mutations were reported13. It is not possible to review all of them in this project. A more feasible
catalogue of the human genes and genetic disorders is available at NCBI, provided by the John
Hopkins University in the Online Mendelian Inheritance of Man. The mutations listed in the
database are not complete but are the most significant as they follow the following criteria for
inclusion:
The first mutation to be discovered
High population frequency
Distinctive phenotype
Historic significance
Unusual mechanism of mutation
Unusual pathogenic mechanism
Distinctive inheritance (e.g., dominant with some mutations, recessive with other
mutations in the same gene).
Most of the allelic variants represent disease-producing mutations. A few polymorphisms are
also included in the database, many of which show a positive statistical correlation with
particular common disorders. Of the listed mutation the single amino acid mutations have been
chosen to be analyzed in this study. The rest of the mutations were either insertions or long
deletions that were difficult to visualize too.
4.2 Data curation and standardization
The data obtained was not in the same format as authors had used different numbering systems
for the amino acid sequence (including or excluding the initial methionine). It was needed to
standardize the numbering according to one format so as to avoid the overlap of numbers with
different residues. Also sometimes the same residues were addressed with different numbering.
If same residues were side by side in the sequence then the numbering system followed by the

36
author was referred to, to find out which was the amino acid which was actually being referred
to. In this way a non-redundant list of the mutations was created. While displaying the number of
the amino acid as in the PDB structure used for visualizing was used so as to do justice to the
numbering followed in the structure.
4.3 Parameters
For deciding the quality of the mutations, certain important characteristics of the amino acids
have been used as the parameters to find out the intensity of the mutations and the reason for the
observed phenotype. The following are the considered parameters:
4.3.1 Polarity of the R group
The polarity of the R group plays a major role is the binding of the ligand to the active site
residues. The polar and non-polar R groups bind strongly together and are one of the main
binding factors of the ligand. The following is the polarity of the amino acids
4.3.2 Acidity/Basicity of the R group
The acidity or the basicity of the R group of the amino acids mostly determines the environment
in which the amino acid is present and also the reactivity of the amino acid with its surroundings.
4.3.3 Hydropathy index
Hydropathy index of an amino acids helps denote how hydrophilic/hydrophobic a particular
amino acid is. The greater the value more is the hydrophobicity. Hence it is expected that the
amino acids on the surface of the protein will have less hydrophobicity index than the one’s
found in the core as hydrophobic amino acids tend to aggregate forming the core of the protein.
4.3.4 Structural position
The structural position of the amino acid in the protein is one of the most important parameters
to be considered for observing and analyzing the mutations. This is so because it is expected that
amino acids close to the active site of the protein will show a stronger phenotype. It has been
observed though in HGPRT that the mutations which are far off from the active site too have the
potential of evoking a strong response expressing the phenotype of the Lesch-Nyhan syndrome12.

37
Each of the residues has been observed and noted if being present in the binding of the ligand, or
catalysis by combing the literature. Also it has been determined if the residue is buried in the
protein or is solvent exposed by probing the structure with 1.40 Å radius sphere. Residues have
been termed as solvent exposed if they have more than 25% solvent accessibility surface (SAS)
and have been termed as buried if their SAS is less than 10%.
Also of importance is the secondary structure of the protein in which they are present. Some
amino acids are preferred in some secondary structure while some are not for example proline is
not at all preferred in helices as it causes kinks and bends and termination of the helix. This
aspect too has been dealt with when studying the functional implication of the mutation.
4.3.5 Conservation index
One of the important points to be considered when analyzing the mutations is to know that the
residue that is mutated is of any significance at all or not. This was best considered by doing a
multiple sequence alignment of HGPRT protein obtained from various organisms. The most
conserved amongst them are most likely to be playing an important part in the structural and
functional stability of the enzyme. The HGPRT protein from the following organisms was taken
from the NCBI’s GenBank14 repository after verification (E.C: 2.4.2.8):
1. Leishmania tarentolae-AAF61462.1
2. Plasmodium berghei-BAA34691.1
3. Leishmania donovani-AAD50966.1
4. Trypanosoma brucei brucei-Q07010
5. Schistosoma mansoni-P09383
6. Crithidia fasciculate-Q27541
7. Homo sapiens-NP_000185.1
8. Phytophthora parasitica-ABB77563.1
9. Bacillus firmus-AAB41678
10. Schistosoma mansoni-CAA31885
11. Leishmania infantum--ABE47510.1
12. Leishmania major-ABE47509.1
13. Leishmania sp. IMT208-ABE47508.1
14. Homo sapiens-AAH00578.1
15. Mycoplasma pulmonis-CAC13724.1
16. Mus musculus-P00493

38
17. Homo sapiens -P00492
18. Cricetulus griseus- P00494
19. Bos taurus-Q3SZ18
20. Sus scrofa- Q45FY6
21. Canis familiaris- Q6WIT9
22. Macaca fascicularis- Q6LDD9
23. Gallus gallus- Q9W719
24. Mus spretus- Q64531
25. Meriones unguiculatus- P47959
26. Rattus norvegicus- P27605
27. Streptococcus pyogenes serotype M6- Q5XEL6
28. Plasmodium falciparum FCR-3/Gambia- P20035
29. Plasmodium falciparum K1/Thailand- P07833
30. Toxoplasma gondii-Q26997
31. Lactococcus lactis subsp. cremoris MG1363- CAL96628.1
30 HGPRT model were chosen as if multiple sequence alignment is done using less than 20
sequences then a lot of vital information may be lost and if done with more that 50 then the
alignment may get biased towards the sequence of interest. The “hpt” sequence which is
expected to be the prokaryotic precursor of the evolved eukaryotic hprt1 gene has been included
as the extra 31st sequence. The multiple sequence alignment was performed using ClustalW15
with the default parameters and later on the Scorecons16 server was used to score the residues
using the MSA output from ClustalW. The output of the Scorecons was used to build the
following graph. The values range from 0 to 1 with 1 being the most conserved. Jalview17 editor
has been used to visualize the conservation in the multiple sequence alignment. A part of the
alignment which shows the PRPP binding residues which are know to be conserved have been
shown in the following figure. The conservation index pf ClustalW has been taken from this
itself.

39
Figure 14 Section of the ClustalW output viewed in JALVIEW showing the conserved PRPP binding domain sequence.

40
Tabl
e fr
om e
xcel

41
4.4 Visualizing the mutations
It is easier to talk about the distance of the mutation from the active site or to say how much
buried a particular mutation is in the structure but it is very difficult to visualize it. Visualizing
will not only help in understanding the structural significance of the mutation, but also help in
analyzing the environment of the residue which undergoes mutation and that might help in
establishing a relationship between the functional aspect of the residue and the severity of the
phenotype which is observed after the particular mutation knocks out the original residue’s
function.
Using Accelrys Discovery Studio Visualizer the following *.msv file was created in which the
whole protein has been rendered as a backbone but only the mutations considered in the above
case have been shown in wire-form. The following figure was generated which labels the
mutations serially as they appeared in the amino acid sequence. The table detailing each of these
mutations has also been provided.
Figure 15 Select mutation from the OMIM database on the backbone of HGPRT (1BZY)
42
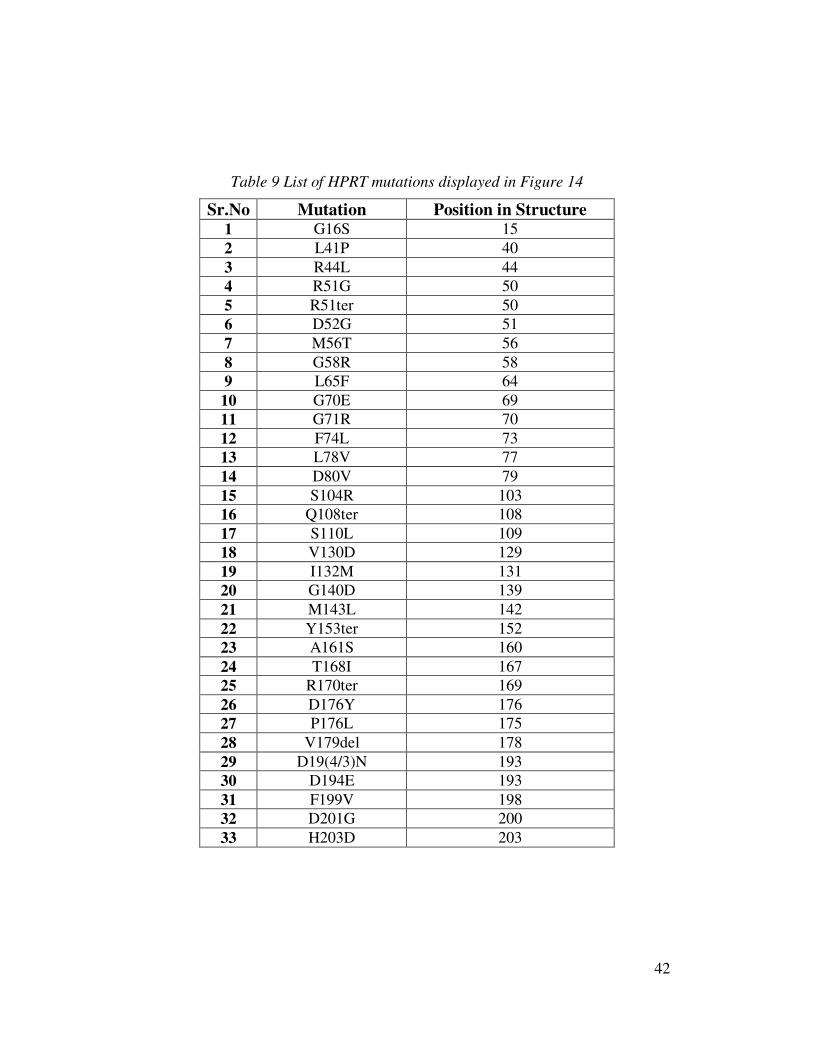
Table 9 List of HPRT mutations displayed in Figure 14
Sr.No Mutation Position in Structure 1 G16S 15 2 L41P 40 3 R44L 44 4 R51G 50 5 R51ter 50 6 D52G 51 7 M56T 56 8 G58R 58 9 L65F 64 10 G70E 69 11 G71R 70 12 F74L 73 13 L78V 77 14 D80V 79 15 S104R 103 16 Q108ter 108 17 S110L 109 18 V130D 129 19 I132M 131 20 G140D 139 21 M143L 142 22 Y153ter 152 23 A161S 160 24 T168I 167 25 R170ter 169 26 D176Y 176 27 P176L 175 28 V179del 178 29 D19(4/3)N 193 30 D194E 193 31 F199V 198 32 D201G 200 33 H203D 203

43
4.5 Detail analysis of mutations The single amino acid substitution mutations were selected from the OMIM database and were
checked for all of the above-mentioned parameters. The data is presented in the supplementary
material. The processed data has been presented below:
G16S
Position is structure: 15
Glycine is hydrophilic and as expected is solvent exposed. The change of glycine to serine will
change the polarity of the R group from non-polar to a polar whereas the R group by itself
remains neutral. It is on the A-C dimer interface and may be acting to stabilize the interface.
Conservation scores for G16 are low (SC: 0.287 CW: 0) and hence it doesn’t seem to be a
functionally important residue. The phenotype of the mutant shows a partial HPRT deficiency.
L41P
Position in Structure: 40
L is hydrophobic and present on the A-C interface. Although the conservation score of this
residue is low (SC: 0.302 CW: 0), it is present in a helix and its substitution for a proline will
surely disrupt the helix and the in all conformation of the interface and might have an impact on
the structure of the monomer too. Therefore as expected the phenotype of this mutant shows a
severe Lesch-Nyhan syndrome.
R44L
Position in structure: 44
Arginine is hydrophilic and is present at the A-C dimer interface. Even if it is hydrophilic it is a
buried residue. This might indicate that that the arginine may be taking place in the dimer
stabilization and also might help the structure to remain structurally viable in the monomer form.
The change from arginine to L is a polar to non-polar change and where arginine is strongly
basic, L is neutral. This might also disrupt the structural stability of the helix in which arginine is
present as L is very much hydrophobic as compared to arginine. Such structural importance
might be reason for the phenotype of the mutant to show the Lesch-Nyhan syndrome.

44
R51G
Position in structure: 50
R is hydrophilic and is solvent accessible. It is just partially on the A-C dimer interface as well as
just behind the A-D interface, and the side-chain pointing towards the C monomer. Arginine is
strongly basic and glycine is neutral. This might disrupt the helix but as the side-chain is not very
close to either of the other subunits it might explain the not so severe, HPRT deficiency related
gout phenotype.
R51ter
Position in structure: 50
A change in codon CGA to TGA resulted into a termination codon. This resulted in a severe
phenotype of Lesch-Nyhan syndrome.
D52G
Position in structure: 51
D to glycine change is an acidic to neutral as of the arginine group changes from polar to non-
polar. The residue hydrophilic and is only partially buried. The change may result in the helix
instability and the phenotype of the mutant shows HPRT related Gout.
M56T
Position in structure: 56
M is not relatively hydrophilic and lies buried in the structure, its side-chain pointing towards the
core of the protein. M lies in a helix and T is not a preferred residue to be in a helix. Also the
non-polar to polar change of the R group might affect the helix stability. Possibly as the residue
is buried and pointing towards the protein core the mutant phenotype shows the Lesch-Nyhan
syndrome.
G58R
Position in structure: 58
The R group of glycine is non-polar and neutral whereas arginine is polar and strongly basic. The
45
glycine sits in a turn whose conformation might change when substituted by the bulkier arginine
residue, thus explaining the milder partial HPRT deficiency.
L65F
Position in structure: 64
L65 lies in a beta sheet in a highly compact region of the protein core. F can substitute L without
much change in physicochemical properties both are hydrophobic and have non-polar and
neutral side-chains. The mutation results in a partial HPRT deficiency.
G70E
Position in structure: 69
G70 lies quite close to the active site and may play a potential role in the ligand binding activity.
Glycine is buried in both the monomer as well as the tetramer. It is one of the very highly
conserved residues (SC: 1 CW: 11) and a hotspot for HPRT mutations. The change observed
here in the R group is from non-polar to polar and becoming acidic and also E is more
hydrophilic than glycine, which surely will not be favored in the ligand binding environment and
hence a Lesch-Nyhan syndrome is observed as a phenotype.
G71R
Position in structure: 70
G71 is a residue on the A-B dimer interface. G71 is right in the ligand binding environment too.
It also has a good conservation score (SC: 0.639 CW: 7). Arginine having an R group which is
polar and strongly basic and sterically larger than glycine will disrupt both the functions of the
G71 as in the interface and ligand binding.
F74L
Position in structure: 73
F74 is a highly conserved residue (SC: 1 CW: 11) forming the helix that is the base of the active
site. It supports the residues, which actually bind to the ligand, and provides the necessary
hydrophobic packing in the protein core. This residue also comes under the A-B interface
residues group though the side-chain points away from the interface. Therefore any change in

46
this residue results in the dreaded Lesch-Nyhan syndrome.
L78V
Position in structure: 77
L78 is positioned in the helix that is forming the A-B interface. This leucine shows a high
conservation index (SC: 0.962 CW: 9). When exchanged with valine that is indifferent to a helix
as compared to L that is a favorable helix former, the structure might be slightly distorted and
hence leading to the observed phenotype of partial HPRT deficiency.
D80V
Position in structure: 79
D80 is positioned well on the A-B interface. D is hydrophilic whereas V is hydrophobic. Also
the position is solvent inaccessible in the dimer/tetramer so it might not react drastically to the
hydrophobic change. The R groups of D and V differ a lot, D being polar and acidic while V
being non-polar and neutral. Even then as the conservation scores of D in this particular position
are not very high (SC: 0.567 CW: 6) hence it may be resulting into the HPRT related Gout
phenotype.
S104R
Position in Structure: 103
S103 is present in the proposed catalytic loop and is almost at the tip of the loop. It co-ordinates
with the two water molecules inside the active site, with the phosphate and its oxygen atoms. A
change from serine to arginine will result in a bulkier R group which will also be strongly basic
as compared to the neutral Serine R group. Arginine is also more hydrophilic than serine and
may interfere in normal bonding towards the water molecules. The position is a highly conserved
position for serine (SC: 1 CW: 11). Considering all the implications and also the structure being
flexible, the mutant shows the HPRT related Gout phenotype.

47
Q108ter
Position in Structure: 108
Q is positioned just below the bend in the catalytic loop near its tip. This has an important
function in structurally maintaining the bend in the loop by bonding back with the adjacent
residues. When mutated to a terminating codon the resultant phenotype shows a severe Lesch-
Nyhan syndrome.
S110L
Position in Structure: 109
Serine at the 110 position is a polar residue which is not so hydrophobic but is just yet solvent
accessible. L in contrast has a non-polar R group and is highly hydrophobic. This change may
not be that much permissible as proper bonding needs to be formed with previous amino acids in
the loop so as to maintain the structure of the catalytic loop. The mutant phenotype shows a
HPRT related Gout.
V130D
Position in Structure: 129
V130 is found in one of the sheets found in the core region of the protein. Although Valine is
hydrophilic as it is present in the core it is solvent inaccessible and so it might be possible that it
has a structural stability maintenance function in the sheet. An exchange for D will change the
R group from non-polar to polar and to acidic from neutral. The residue Valine for this position
too is quite conserved (SC: 0.758 CW: 9) and also D is not preferred over Valine in a sheet.
The mutation therefore results in to the dreaded Lesch-Nyhan syndrome.
I132M
Position in Structure: 131
The Isoleucine is present in a sheet which is forming the base of the active site. The residue
when substituted with M doesn’t cause changes in the polarity or the acidity/basicity of the R
group as both are non-polar and neutral but I is more hydrophobic than M. The preference for I is
though more than M in a sheet and hence the mutant phenotype shows a HPRT related Gout.

48
G140D
Position in Structure: 139
G present at position 140 is very much conserved (SC: 0.758 CW: 10) and is one of the ligand
binding residues. It is in a hydrogen bonding distance from the PRPP and its substitution for D
would be unfortunate, as the side-chain will change from non-polar to polar and neutral to acidic.
D is more hydrophilic than glycine and hence it might interfere with the normal water binding in
the active site. The phenotype of this mutation shows Lesch-Nyhan syndrome.
M143L
Position in Structure: 142
M142 is one of the highly conserved residues (SW: 0.708 CW: 9) and is one of the residues
functional in PRPP binding. Although there is no change in the polarity or the acidity/basicity of
the R group of the two residues, the hydrophobic character increases with L than when it is M.
Now this might trigger instability in the active site as water binding needs to be very specific and
with the right strength to bind the to the PRPP.
Y153ter
Position in Structure: 152
This tyrosine is not very much conserved a residue in the enzyme but it forms important
interaction with the Serine and Leucine which are present in the catalytic loop opposite the ring
in Y. They might be stabilizing the loop when in the transition state as depicted in the tetramer.
Hence the mutation too might be explained as to showing a phenotype of severe Lesch-Nyhan
syndrome.
A161S
Position in Structure: 160
A161 is present in the protein core region and on a sheet that is protected from the solvent by
helices. A is hydrophobic but its substitution to serine will make it slightly more hydrophilic
which might disrupt the internal hydrophobic packing. The mutation results in a HPRT related
Gout case.

49
T168I
Position in Structure: 167
T in this particular position is solvent exposed and is just a layer away from the active site, which
actually is also a threonine. Threonine is hydrophilic only a bit but the substitution will make the
position more hydrophobic and hence might totally disrupt the structural stability of the active
site. The phenotype of the mutation is HPRT related Gout.
R170ter
Position in Structure: 170
R170 forms intricate bonding with A137 and T138 which are the ligand binding residues and it
helps in stabilizing them by providing a polar and strongly basic support. When terminated at
this codon the enzyme is obviously ineffective and results in the Lesch-Nyhan syndrome.
P176L
Position in Structure: 175
Proline at the 175th position is present in a sheet and that too at a turn in the sheet which is
very much expected as it breaks the flow of the sheet to introduce a turn in direction. If
substituted by L then the sheet will lose its characteristic twist and the structure will be altered
significantly of the sheet. Thus the mutation shows a Lesch-Nyhan syndrome.
D176Y
Position in Structure: 176
Aspartic acid is hydrophilic and lies on the solvent accessible surface of the enzyme. It is present
in a coil and the change to Y leading to the addition of the bulkier side-chain, which will make
the turn in the coil difficult and also, is neutral as compared to the acidic R group of D. This
mutation leads to Lesch-Nyhan syndrome.
V179del
Position in structure: 178
Valine at the particular position of 179 is present in a sheet taking part in the hydrophobic
packing of the protein core. The deletion would result in disruption of the important hydrophobic

50
packing and a loss in the proper core formation which is necessary for the function of the
enzyme. The deletion leads therefore to Lesch-Nyhan syndrome.
D19(3/4)N
Position in Structure: 193
Aspartic Acid at 193 is a very important and a highly conserved residue (SC: 0.847 CW: 11). It
is present in the active site and takes part in the direct binding of the ligand (nucleobase). A
change in this residue to N would surely lead to the wrong or non-binding of the ligand and thus
render the enzyme useless. The mutation leads naturally to the dreaded Lesch-Nyhan syndrome.
D194E
Position in Structure: 193
As described above the Aspartic acid is very important in this particular position but the reason
that it being substituted by E doesn’t not result into Lesch-Nyhan but the less severe HPRT
related Gout may be because the physico-chemical properties of the R groups are very same.
Both have polar and acidic side-chains and both are hydrophilic and that too with the same
strength.
F199V
Position in Structure: 198
F199 is buried in the hood region of the enzyme in the dimeric structure. It probably provides the
hydrophobic packing for the hood region to maintain its structure as we see the side-chain
pointing inwards. Even though the residue is buried according to the constraints specified, it is
the component of the coil which forms the A-B dimer interface and hence this change would
disrupt the interface binding too as the hydrophobicity will increase with the change from
phenylalanine to valine. The mutation therefore results into the Lesch-Nyhan syndrome.
D201G
Position in Structure: 200
Aspartic acid is highly hydrophilic and is yet found buried in the dimeric structure at the A-B
interface. This is probably because it is paired against the proline and methionine of which

51
methionine is hydrophobic and may be stabilizing the structure of the dimer locally. A change
from aspartic acid to glycine will result in a drop in the hydrophilicity and hence may
disorganize the structural stability of the dimer. The phenotype of the mutation shows HPRT
related Gout.
H203D
Position in Structure: 204
The R group of the histidine points directly towards the C subunit declaring its role in the A-C
interface. If the histidine changes to a D then even though the hydrophilicity remains
comparable, the weakly basic R group is replaced by the acidic group of aspartic acid and hence
will disrupt the interface packing. The mutation results in the Lesch-Nyhan syndrome.
4.6 Summary
This study has shown it prominently that even thought the mutations are of varying degrees of
phenotype, they are spread out quite evenly on the protein and they do not show a particular
pattern. This might be the case because as the protein can be present in the dimer or tetramer
form too, some residues might be important in maintaining such structures and hence might be
causing severe disease phenotypes even when away from the active site. Also it must be taken
into considerations that the predictions made here are relative to the static crystal structure
1BZY. In actuality when the protein is in solution it is quite flexible and can easily change its
conformation to accommodate the changes brought about by the mutations. This is one of the
key reasons that one cannot be totally sure of the changes in the protein predicted by just
analyzing the structure unless in-vitro or in-vivo experiments are performed to check their
credibility.

52
Chapter V
Conclusions The active site of the HGPRT and the protein itself is very intriguing. The exact mechanism as
per how the reaction proceeds during the catalysis is not very clear. The formation of the anion is
a proposed hypothesis which needs to be substantiated by experimental evidence. This
computational approach towards the problem may be a stepping stone towards solving this
problem.
The simulation of the active site and the calculation done has helped prove the binding capacities
of those selected amino acids in the active site at least for the model system. The change in the
energy of interactions also substantiates the hydrogen bonding of the involved contacts between
the ligand and the residues in the model. The interaction energy of - 26.165535432 kcal/mole
also signifies that approximately 5 hydrogen bonds are in play which is the case observed in the
optimized model when viewing the polar contacts.
The numerous and varied mutations in HGPRT have been studied for a long time, yet such kind
of characterization of the mutations on different parameters which will try to predict the change
in the protein and hence the phenotype has not been undertaken extensively except for a few
studies12. This is the case maybe because the comments based on speculations do not sound to be
factual but yet examining the already proved mutations and the reasons for them, an intelligent
guess can be made and as the number of parameters to be considered increases the predictions
may come more close to the facts. In this study though it is to be always to be remembered that
we are observing the protein as derived from the crystal structure and that may not be the case in
the natural environment of the protein. Some changes in the protein can be absorbed or nullified
by changes in the structure of the protein which can change in solution. Thus flexibility of the
protein cannot be taken into account here and that is one problem which can be actually worked
around as discussed in future directions.

53
Future Directions The calculations performed over here consider the residues in the model to be fixed and freezed
in space whereas this not the actual case. The protein too changes its shape so as to accommodate
the ligand. This scenario was not implemented in the geometry optimizations as then the residues
in the model and the base would settle at far off distances from each other to minimize the
energy. Also the whole protein could not be put in for the simulations due to the limitations of
the system on which the calculations were performed. The next step would be to add some more
of the amino acids from the active site around the ligand so as to add more constraints to its
movements. This might more accurately show the movement of the ligand in the active site. Also
then the interaction energy will be more accurate.
A full molecular dynamics study if done on HGPRT with Guanine will not only show the exact
changes happening in the GMP but also make the active site flexible which will be the actual
case in solution. GROMACS could provide the right parameters for the running the simulation.

54
Bibliography
1. Thomas, A. & Field, M. J. A comparative QM/MM simulation study of the reaction
mechanisms of human and Plasmodium falciparum HG(X)PRTases. Journal of the American Chemical Society 128, 10096-10102 (2006).
2. Nyhan, W. L., Sweetman, L. & Lesch, M. Effects of the uricogenic agent, 2-ethylamino-1,3,4-thiadiazole in hypoxanthine-guanine phosphoribosyl transferase deficiency. Metabolism: Clinical and Experimental 17, 846-853 (1968).
3. Stout, J. T. & Caskey, C. T. HPRT: gene structure, expression, and mutation. Annual review of genetics 19, 127-148 (1985).
4. Musick, W. D. Structural features of the phosphoribosyltransferases and their relationship to the human deficiency disorders of purine and pyrimidine metabolism. CRC critical reviews in biochemistry 11, 1-34 (1981).
5. Eads, J. C., Scapin, G., Xu, Y., Grubmeyer, C. & Sacchettini, J. C. The crystal structure of human hypoxanthine-guanine phosphoribosyltransferase with bound GMP. Cell 78, 325-334 (1994).
6. P. Flükiger, H. P. L., S. Portmann, J. Weber. MOLEKEL: MOLEKEL 4.0. Swiss Center for Scientific Computing, Manno (Switzerland) (2000.).
7. Thompson, M. A. ArgusLab 4.0. Planaria Software LLC, Seattle. 8. M.W.Schmidt, K. K. B., J.A.Boatz, S.T.Elbert, M.S.Gordon, J.H.Jensen, S.Koseki,
N.Matsunaga, K.A.Nguyen, S.J.Su, T.L.Windus, M.Dupuis, J.A.Montgomery. General atomic and molecular electronic structure system. Journal of Computational Chemistry 14, 1347-1363 (1993.).
9. DeLano, W. L. The PyMOL Molecular Graphics System. DeLano Scientific, San Carlos, CA, USA. (2002).
10. Jinnah, H. A., De Gregorio, L., Harris, J. C., Nyhan, W. L. & O'Neill, J. P. The spectrum of inherited mutations causing HPRT deficiency: 75 new cases and a review of 196 previously reported cases. Mutation Research - Reviews in Mutation Research 463, 309-326 (2000).
11. Jinnah, H. A., Harris, J. C., Nyhan, W. L. & O'Neill, J. P. The spectrum of mutations causing HPRT deficiency: An update. Nucleosides, Nucleotides and Nucleic Acids 23, 1153-1160 (2004).
12. Duan, J., Nilsson, L. & Lambert, B. Structural and functional analysis of mutations at the human hypoxanthine phosphoribosyl transferase (HPRT1) locus. Human Mutation 23, 599-611 (2004).
13. Yamada, Y., Nomura, N., Yamada, K. & Wakamatsu, N. Molecular analysis of HPRT deficiencies: An update of the spectrum of Asian mutations with novel mutations. Molecular Genetics and Metabolism 90, 70-76 (2007).
14. Benson, D. A., Karsch-Mizrachi, I., Lipman, D. J., Ostell, J. & Wheeler, D. L. GenBank. Nucleic Acids Research 35, D21-D25 (2007).
15. Thompson, J. D., Higgins, D.G. and Gibson, T.J. CLUSTAL W: improving the sensitivity of progressive multiple sequence alignments through sequence weighting, position specific gap penalties and weight matrix choice. Nucl. Acids Res 22, 4673-4680. (1994).
16. WSJ, V. Scoring residue conservation. Proteins: Structure, Function, and Genetics 43,

55
227-241. (2002). 17. Michele Clamp 1, 4,*, James Cuff 1,2, Stephen M. Searle 1,2 and Geoffrey J. Barton
2,3,4 The Jalview Java alignment editor. Bioinformatics 20, 426-427 (2003). Books Referred
a) Tim Clark, A handbook of Computational Chemistry, A Practical Guide to Chemical
Structure and Energy Calculations, b) Donald McQuarrie, Physical Chemistry, A Molecular Approach. c) Christopher J Cramer, Essentials of Computational Chemistry, Theories and Models. d) Arthur M Lesk, Introduction to Bioinformatics.

56
Index of Figures Figure 1 X chromosome characterization ....................................................................................6 Figure 2 HPRT1 gene locus on the X chromosome .....................................................................7 Figure 3. Human HGPRT tetramer. PDB: 1BZY. Image created in Accelrys DS Visualizer ........8 Figure 4 Human HGPRT monomer. PDB: 1HMP. Image created in Pymol................................9 Figure 5 Van der Waal surface of HGPRT showing the GMP in the active site. PDB: 1HMP Image created in Accelrys DS Visualizer...................................................................................11 Figure 6. Proposed catalysis mechanism.5 .................................................................................12 Figure 7 Free base optimized in gas phase using DFT/B3LYP 6-31G**. Image from Molekel6 .21 Figure 8 Free base optimized in gas phase using HF/3-21G. Image from Molekel6 ....................22 Figure 9 Model before optimization showing the polar bonds in Angstroms. Image created in Pymol9 ......................................................................................................................................23 Figure 10. Numbering system of the atoms of the base in this study ..........................................24 Figure 11 Free base optimized using DFT .................................................................................30 Figure 12 Base optimized in model using DFT..........................................................................30 Figure 13 Optimized model showing the polar contacts in Angstroms. Image created in Pymol9
.................................................................................................................................................33 Figure 14 Section of the ClustalW output viewed in JALVIEW showing the conserved PRPP binding domain sequence. .........................................................................................................39 Figure 15 Select mutation from the OMIM database on the backbone of HGPRT (1BZY) ........41 Index of Tables
Table 1 PDB files for Human HGPRT from RCSB databank ......................................................9 Table 2 Bond length comparisons (All bond lengths are in Angstroms (Å))...............................25 Table 3 Dihedral Angles (degrees) ............................................................................................26 Table 4 Angles (degrees)...........................................................................................................26 Table 5 Comparing the HF/3-21G optimized base with base extracted from PDB .....................27 Table 6 Dihedral Angles comparison of optimized base (HF/3-21G) and base from PDB (degrees) ...................................................................................................................................28 Table 7 Angles (degrees)...........................................................................................................28 Table 8. Various Single Point Energies calculated....................................................................31 Table 9 List of HPRT mutations displayed in Figure 14 ............................................................42